Scolaris Content Display Scolaris Content Display

Study flow diagram of papers within the review.
Figuras y tablas -
Figure 1

Study flow diagram of papers within the review.

Risk of bias graph: review authors' judgements about each risk of bias item presented as percentages across all included studies.
Figuras y tablas -
Figure 2

Risk of bias graph: review authors' judgements about each risk of bias item presented as percentages across all included studies.

Risk of bias summary: review authors' judgements about each risk of bias item for each included study.
Figuras y tablas -
Figure 3

Risk of bias summary: review authors' judgements about each risk of bias item for each included study.

Comparison 1 Any pharmacological vs no pharmacological, Outcome 1 Drug use (objective).
Figuras y tablas -
Analysis 1.1

Comparison 1 Any pharmacological vs no pharmacological, Outcome 1 Drug use (objective).

Comparison 1 Any pharmacological vs no pharmacological, Outcome 2 Drug use community setting.
Figuras y tablas -
Analysis 1.2

Comparison 1 Any pharmacological vs no pharmacological, Outcome 2 Drug use community setting.

Comparison 1 Any pharmacological vs no pharmacological, Outcome 3 Drug use secure establishment.
Figuras y tablas -
Analysis 1.3

Comparison 1 Any pharmacological vs no pharmacological, Outcome 3 Drug use secure establishment.

Comparison 1 Any pharmacological vs no pharmacological, Outcome 4 Drug use self reported dichotomous.
Figuras y tablas -
Analysis 1.4

Comparison 1 Any pharmacological vs no pharmacological, Outcome 4 Drug use self reported dichotomous.

Comparison 1 Any pharmacological vs no pharmacological, Outcome 5 Drug use self reported continuous.
Figuras y tablas -
Analysis 1.5

Comparison 1 Any pharmacological vs no pharmacological, Outcome 5 Drug use self reported continuous.

Comparison 1 Any pharmacological vs no pharmacological, Outcome 6 Criminal activity dichotomous.
Figuras y tablas -
Analysis 1.6

Comparison 1 Any pharmacological vs no pharmacological, Outcome 6 Criminal activity dichotomous.

Comparison 1 Any pharmacological vs no pharmacological, Outcome 7 Criminal activity continuous.
Figuras y tablas -
Analysis 1.7

Comparison 1 Any pharmacological vs no pharmacological, Outcome 7 Criminal activity continuous.

Comparison 2 Buprenorphine vs no pharmacological, Outcome 1 Self report drug use dichotomous.
Figuras y tablas -
Analysis 2.1

Comparison 2 Buprenorphine vs no pharmacological, Outcome 1 Self report drug use dichotomous.

Comparison 3 Methadone vs no pharmacological, Outcome 1 Self‐report drug use dichotomous.
Figuras y tablas -
Analysis 3.1

Comparison 3 Methadone vs no pharmacological, Outcome 1 Self‐report drug use dichotomous.

Comparison 3 Methadone vs no pharmacological, Outcome 2 Self report drug use continuous.
Figuras y tablas -
Analysis 3.2

Comparison 3 Methadone vs no pharmacological, Outcome 2 Self report drug use continuous.

Comparison 3 Methadone vs no pharmacological, Outcome 3 Re‐incarceration dichotomous.
Figuras y tablas -
Analysis 3.3

Comparison 3 Methadone vs no pharmacological, Outcome 3 Re‐incarceration dichotomous.

Comparison 4 Naltrexone vs no pharmacological, Outcome 1 Criminal activity dichotomous.
Figuras y tablas -
Analysis 4.1

Comparison 4 Naltrexone vs no pharmacological, Outcome 1 Criminal activity dichotomous.

Comparison 5 Methadone vs buprenorphine, Outcome 1 Self reported drug use dichotomous.
Figuras y tablas -
Analysis 5.1

Comparison 5 Methadone vs buprenorphine, Outcome 1 Self reported drug use dichotomous.

Comparison 5 Methadone vs buprenorphine, Outcome 2 Self reported drug use continuous.
Figuras y tablas -
Analysis 5.2

Comparison 5 Methadone vs buprenorphine, Outcome 2 Self reported drug use continuous.

Comparison 5 Methadone vs buprenorphine, Outcome 3 Criminal activity dichotomous.
Figuras y tablas -
Analysis 5.3

Comparison 5 Methadone vs buprenorphine, Outcome 3 Criminal activity dichotomous.

Comparison 6 Methadone vs diamorphine, Outcome 1 criminal activity dichotomous.
Figuras y tablas -
Analysis 6.1

Comparison 6 Methadone vs diamorphine, Outcome 1 criminal activity dichotomous.

Comparison 7 Methadone vs naltrexone, Outcome 1 self reported drug use continuous.
Figuras y tablas -
Analysis 7.1

Comparison 7 Methadone vs naltrexone, Outcome 1 self reported drug use continuous.

Comparison 7 Methadone vs naltrexone, Outcome 2 criminal activity dichotomous.
Figuras y tablas -
Analysis 7.2

Comparison 7 Methadone vs naltrexone, Outcome 2 criminal activity dichotomous.

Comparison 7 Methadone vs naltrexone, Outcome 3 criminal activity continuous.
Figuras y tablas -
Analysis 7.3

Comparison 7 Methadone vs naltrexone, Outcome 3 criminal activity continuous.

Table 1. Table 1 summary of outcomes and comparisons

Study

Setting

Intervention

Comparison group

Follow‐up period

Outcome type

Outcome description

Bayanzadeh, 2004

Prison

Methadone treatment in combination with CBT and widely focused on coping and problem‐solving skills.

Non‐methadone drugs plus standard psychiatric services and therapeutic medications

6 months

Biological drug use

Self‐report drug use

Drug use yes/no

Frequency of drug injections (percentage)

Syringe sharing

Morphine urine analysis
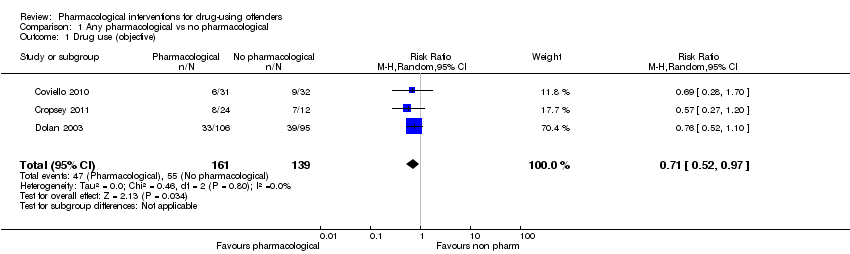
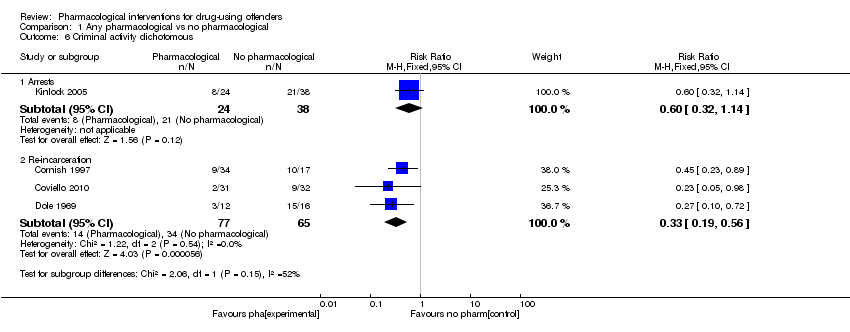
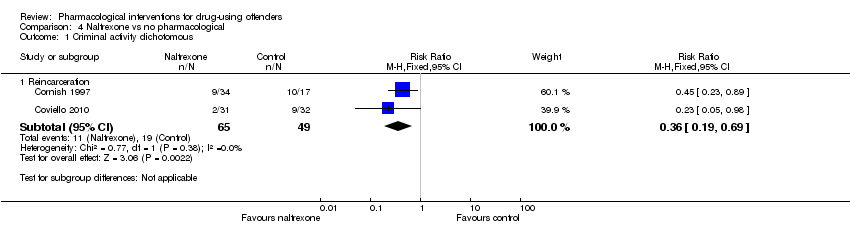
Cornish 1997

Community

Naltrexone

Routine parole/probation

6 months and during 6 months of treatment

Criminal activity dichotomous

% re‐incarcerated during 6 months of follow‐up

Coviello 2010

Community

Naltrexone

Psychosocial treatment only

6 months

Biological drug use dichotomous

Criminal activity dichotomous

% positive urine drug screen opioids

% positive urine drug screen cocaine

% violating parole/probation
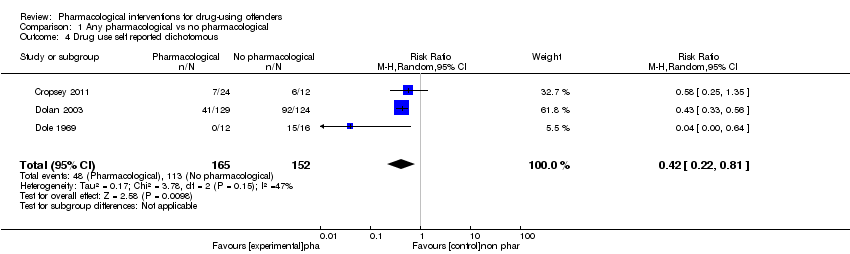
Cropsey 2011

Community

Buprenorphine

Placebo

End of treatment

3 months

Biological drug use dichotomous

Self‐report drug use dichotomous

% positive urine opiates

% self‐report injection drug use
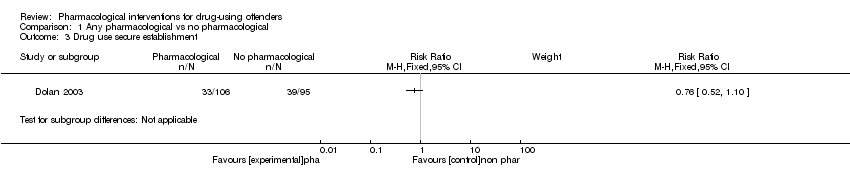
Dolan 2003

Prison

Pharmacological (methadone)

Waiting list control

4 months

2 months

3 months

Biological drug use continuous

Biological drug use dichotomous

Self‐report drug use dichotomous

% hair positive for morphine

% self‐reported any injection

% self‐reported heroin injection

Dole 1969

Prison

Methadone

Waiting list control.

At between 7 and 10 months

At 50 weeks

Biological drug use continuous

Biological drug use dichotomous

Self‐report drug use dichotomous

Heroin use

Re‐incarceration

Treatment retention

Employment
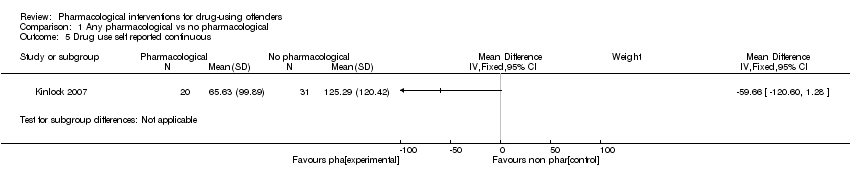
Kinlock 2007


Prison

Counselling + methadone initiation pre‐release(a) and post‐release (b)

Counselling only

1 month

3 months

6 months

12 months

Biological drug use dichotomous

Self‐report drug use dichotomous

Criminal activity dichotomous

% positive for urine opioids

% positive for urine cocaine

% self‐reported 1 or more days heroin

n used heroin for entire 180‐day follow‐up period

Re‐incarcerated

Self‐reported criminal activity
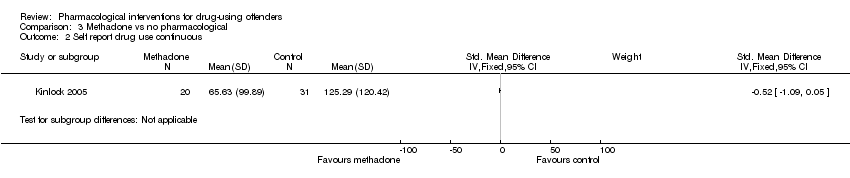
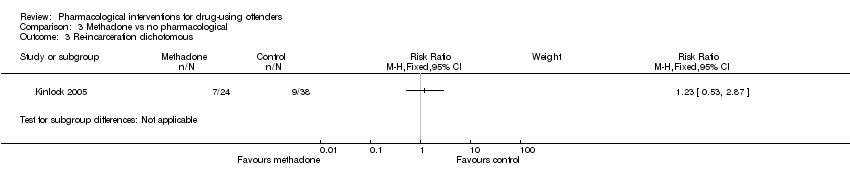
Kinlock 2005

Prison

Prison based levo alpha acetyl methanol and transfer to methadone after release

untreated controls

During 9 months

Biological drug use dichotomous

Self‐report drug use dichotomous

Criminal activity dichotomous

Heroin use

Arrest

Re incarceration

Frequency of illegal activity

Admission drug use

Average weekly income

Lobmaier 2010

Prison

Naltrexone

Methadone

6 months

Criminal activity continuous

Criminal activity dichotomous

Self‐report drug use continuous

Mean days of criminal activity

% re‐incarcerated

Mean days of heroin use

Mean days of benzodiazepine use

Mean days of amphetamine use

Lobmann 2007

Community

Pharmacological (diamorphine)

Methadone

12 months

Criminal activity dichotomous

% self‐reported criminal activity

% police‐recorded offences
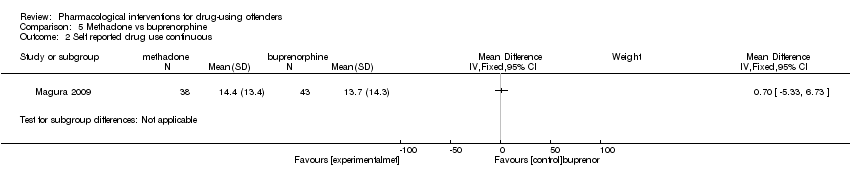
Magura 2009

Prison

Buprenorphine

Methadone

3 months

Criminal activity dichotomous

Self‐report drug use continuous

Self‐report drug use dichotomous

% re‐incarcerated

% arrested for property crime

% arrested for drug possession

Mean days of heroin use

% any heroin/opioid use

Figuras y tablas -
Table 1. Table 1 summary of outcomes and comparisons
Comparison 1. Any pharmacological vs no pharmacological

Outcome or subgroup title

No. of studies

No. of participants

Statistical method

Effect size

1 Drug use (objective) Show forest plot

3

300

Risk Ratio (M‐H, Random, 95% CI)

0.71 [0.52, 0.97]

2 Drug use community setting Show forest plot

2

99

Risk Ratio (M‐H, Random, 95% CI)

0.62 [0.35, 1.09]

3 Drug use secure establishment Show forest plot

1

Risk Ratio (M‐H, Fixed, 95% CI)

Subtotals only

4 Drug use self reported dichotomous Show forest plot

3

317

Risk Ratio (M‐H, Random, 95% CI)

0.42 [0.22, 0.81]

5 Drug use self reported continuous Show forest plot

1

Mean Difference (IV, Fixed, 95% CI)

Subtotals only

6 Criminal activity dichotomous Show forest plot

4

Risk Ratio (M‐H, Fixed, 95% CI)

Subtotals only

6.1 Arrests

1

62

Risk Ratio (M‐H, Fixed, 95% CI)

0.60 [0.32, 1.14]

6.2 Re‐incarceration

3

142

Risk Ratio (M‐H, Fixed, 95% CI)

0.33 [0.19, 0.56]

7 Criminal activity continuous Show forest plot

1

Mean Difference (IV, Fixed, 95% CI)

Subtotals only

Figuras y tablas -
Comparison 1. Any pharmacological vs no pharmacological
Comparison 2. Buprenorphine vs no pharmacological

Outcome or subgroup title

No. of studies

No. of participants

Statistical method

Effect size

1 Self report drug use dichotomous Show forest plot

1

Risk Ratio (M‐H, Fixed, 95% CI)

Subtotals only

Figuras y tablas -
Comparison 2. Buprenorphine vs no pharmacological
Comparison 3. Methadone vs no pharmacological

Outcome or subgroup title

No. of studies

No. of participants

Statistical method

Effect size

1 Self‐report drug use dichotomous Show forest plot

1

Risk Ratio (M‐H, Fixed, 95% CI)

Subtotals only

2 Self report drug use continuous Show forest plot

1

Std. Mean Difference (IV, Fixed, 95% CI)

Subtotals only

3 Re‐incarceration dichotomous Show forest plot

1

Risk Ratio (M‐H, Fixed, 95% CI)

Subtotals only

Figuras y tablas -
Comparison 3. Methadone vs no pharmacological
Comparison 4. Naltrexone vs no pharmacological

Outcome or subgroup title

No. of studies

No. of participants

Statistical method

Effect size

1 Criminal activity dichotomous Show forest plot

2

Risk Ratio (M‐H, Fixed, 95% CI)

Subtotals only

1.1 Reincarceration

2

114

Risk Ratio (M‐H, Fixed, 95% CI)

0.36 [0.19, 0.69]

Figuras y tablas -
Comparison 4. Naltrexone vs no pharmacological
Comparison 5. Methadone vs buprenorphine

Outcome or subgroup title

No. of studies

No. of participants

Statistical method

Effect size

1 Self reported drug use dichotomous Show forest plot

1

Risk Ratio (M‐H, Fixed, 95% CI)

Subtotals only

2 Self reported drug use continuous Show forest plot

1

Mean Difference (IV, Fixed, 95% CI)

Subtotals only

3 Criminal activity dichotomous Show forest plot

1

Risk Ratio (M‐H, Fixed, 95% CI)

Subtotals only

3.1 re incarceration

1

116

Risk Ratio (M‐H, Fixed, 95% CI)

1.25 [0.83, 1.88]

Figuras y tablas -
Comparison 5. Methadone vs buprenorphine
Comparison 6. Methadone vs diamorphine

Outcome or subgroup title

No. of studies

No. of participants

Statistical method

Effect size

1 criminal activity dichotomous Show forest plot

1

Risk Ratio (M‐H, Fixed, 95% CI)

Subtotals only

1.1 arrest

1

825

Risk Ratio (M‐H, Fixed, 95% CI)

1.25 [1.03, 1.51]

Figuras y tablas -
Comparison 6. Methadone vs diamorphine
Comparison 7. Methadone vs naltrexone

Outcome or subgroup title

No. of studies

No. of participants

Statistical method

Effect size

1 self reported drug use continuous Show forest plot

1

Mean Difference (IV, Fixed, 95% CI)

Subtotals only

2 criminal activity dichotomous Show forest plot

1

Risk Ratio (M‐H, Fixed, 95% CI)

Subtotals only

2.1 re incarceration

1

44

Risk Ratio (M‐H, Fixed, 95% CI)

1.10 [0.37, 3.26]

3 criminal activity continuous Show forest plot

1

Mean Difference (IV, Fixed, 95% CI)

Subtotals only

Figuras y tablas -
Comparison 7. Methadone vs naltrexone