Intervenciones para el tratamiento de los derrames pleurales malignos: un metanálisis en red
Información
- DOI:
- https://doi.org/10.1002/14651858.CD010529.pub2Copiar DOI

- Base de datos:
-
- Cochrane Database of Systematic Reviews
- Versión publicada:
-
- 08 mayo 2016see what's new
- Tipo:
-
- Intervention
- Etapa:
-
- Review
- Grupo Editorial Cochrane:
-
Grupo Cochrane de Dolor y cuidados paliativos
- Copyright:
-
- Copyright © 2019 The Cochrane Collaboration. Published by John Wiley & Sons, Ltd.
Cifras del artículo
Altmetric:
Citado por:
Autores
Contributions of authors
The protocol was written collaboratively by all authors.
The searches were performed by Jane Hayes and Joanne Abbott.
AOC screened the titles and abstracts and obtained the full text papers.
AOC and NAM assessed the full text articles for inclusion.
AOC, NP, RB and NAM performed the data extractions.
AOC entered the data into RevMan and undertook the direct pair‐wise comparisons in RevMan.
HJ performed the network meta‐analysis and provided statistical support.
AOC drafted the final report, which was reviewed and amended by all the authors.
AOC and NAM are responsible for the update.
Declarations of interest
AOC is involved in co‐ordinating and recruiting to the TIME‐3 trial (TIME‐3).
HJ: none known.
RB has been the trial co‐ordinator for the TAPPS and IPC‐Plus studies since 2012 (IPC‐Plus; TAPPS) but did not perform the data extractions for these studies for the purposes of this review.
NJP: none known.
NM is a member of the trial steering committee for TIME‐1 and TIME‐3 trials (TIME‐1; TIME‐3). NM is a co‐author for one of the included studies (Maskell 2004). However, he did not perform the data extractions for this study for the purposes of this review. North Bristol NHS Trust received unrestricted research funding from CareFusion, to run the IPC‐Plus trial (IPC‐Plus) (2013‐2016) for which NM was the chief investigator. NM also received honoraria from CareFusion for medical advisory board meetings (2013‐2015). This has no direct link with the Cochrane Review.
Acknowledgements
The authors would like to thank Dr Deborah Caldwell for several helpful discussions.
Cochrane Review Group funding acknowledgement: The National Institute for Health Research (NIHR) is the largest single funder of the Cochrane PaPaS Group. Disclaimer: The views and opinions expressed in this review are those of the authors and do not necessarily reflect those of the NIHR, National Health Service (NHS) or the Department of Health.
Version history
| Published | Title | Stage | Authors | Version |
| 2020 Apr 21 | Interventions for the management of malignant pleural effusions: a network meta‐analysis | Review | Alexandra Dipper, Hayley E Jones, Rahul Bhatnagar, Nancy J Preston, Nick Maskell, Amelia O Clive | |
| 2016 May 08 | Interventions for the management of malignant pleural effusions: a network meta‐analysis | Review | Amelia O Clive, Hayley E Jones, Rahul Bhatnagar, Nancy J Preston, Nick Maskell | |
| 2013 May 31 | Interventions for the management of malignant pleural effusions | Protocol | Amelia Clive, Rahul Bhatnagar, Nancy J Preston, Hayley E Jones, Nick Maskell | |
Differences between protocol and review
The wording of the background and methods sections have been improved to make them more concise, minimise repetition and to reflect the recently published literature.
In the original protocol, we stated we would use relative risk for dichotomous outcomes, however, we elected to use odds ratios instead, since network meta‐analysis models are more readily available for these.
Although the use of network meta‐analysis was mentioned in the published protocol, further details have been included to clarify the methodology, including details on evaluating heterogeneity, inconsistency and imprecision. These changes are based on the protocol template from the Comparing Multiple Interventions Methods Group, which was not available when we wrote our original protocol.
The protocol stated that the size of the study would be assessed to look for bias associated with small study effects. This was not performed, as size in itself should not affect the study results and inclusion of sample size in risk of bias tables would be against the advice in the Cochrane Handbook (Higgins 2011a) and training provided by the Cochrane Bias Methods Group.
The protocol combined blinding of participants and personnel and outcome assessment into a single domain. However, in light of new guidance from Cochrane, this was separated into 'blinding of participants and personnel' and 'blinding of outcome assessment', as per the Cochrane Handbook (Higgins 2011a).
The protocol stated we would evaluate mortality in the short, medium and long term. However, due to a paucity of evidence at all these different time points, an overall assessment was done using the available study data closest to three months after the intervention.
The wording of the planned sensitivity analyses have been amended for clarity.
Post‐hoc, we chose to perform a sensitivity analysis of the main network excluding talc poudrage and IPCs in order to remove the effect of mode of administration to identify which agent may be best delivered via a standard chest tube.
For clarity, we added 'a network meta‐analysis' to the title.
Notes
A restricted search in January 2018 identified ongoing studies which are expected to report in the next 18 months (July 2019). The review will then be assessed for updating. Therefore, this review has been stabilised following discussion with the authors and editors. If appropriate, we will update the review before this date if new evidence likely to change the conclusions is published, or if standards change substantially which necessitate major revisions
Keywords
MeSH
Medical Subject Headings (MeSH) Keywords
Medical Subject Headings Check Words
Adult; Humans;
PICO

Study flow diagram

Risk of bias graph: review authors' judgements about each risk of bias item presented as percentages across all included studies.

Risk of bias summary: review authors' judgements about each risk of bias item for each included study.

Network plot of the pleurodesis efficacy network. The nodes are weighted according to the number of participants randomised to the intervention. The edges (line thicknesses) are weighted according to the number of studies included in each comparison.

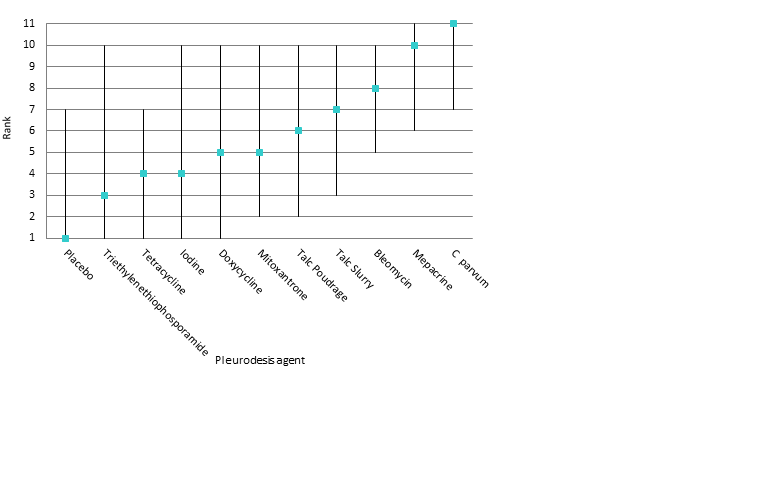
Estimated (95% Cr‐I) ranks for each of the pleurodesis methods from the main network

Inconsistency plot for the main network. Treatment codes: 01 = Talc slurry; 02 = Talc poudrage; 03 = Bleomycin; 04 = Tetracycline; 05 = C. parvum; 06 = Interferon; 07 = Iodine; 08 = Indwelling pleural catheter; 09 = Placebo; 10 = Mustine; 11 = Mitoxantrone; 12 = Mepacrine; 13 = Doxycyline; 14 = Triethylenethiophosphoramide; 15 = Adriamycin. Abbreviations: ROR = Ratio of Odds Ratios; 95% CI = 95% Confidence interval. Heterogeneity variance was set at 0.8847 (reflecting the estimation of Tau from the network)
Estimated rank (95% Cr‐I) for causing fever (a low rank suggests less fever)

Comparison 1 Bleomycin, Outcome 1 Pleurodesis failure.
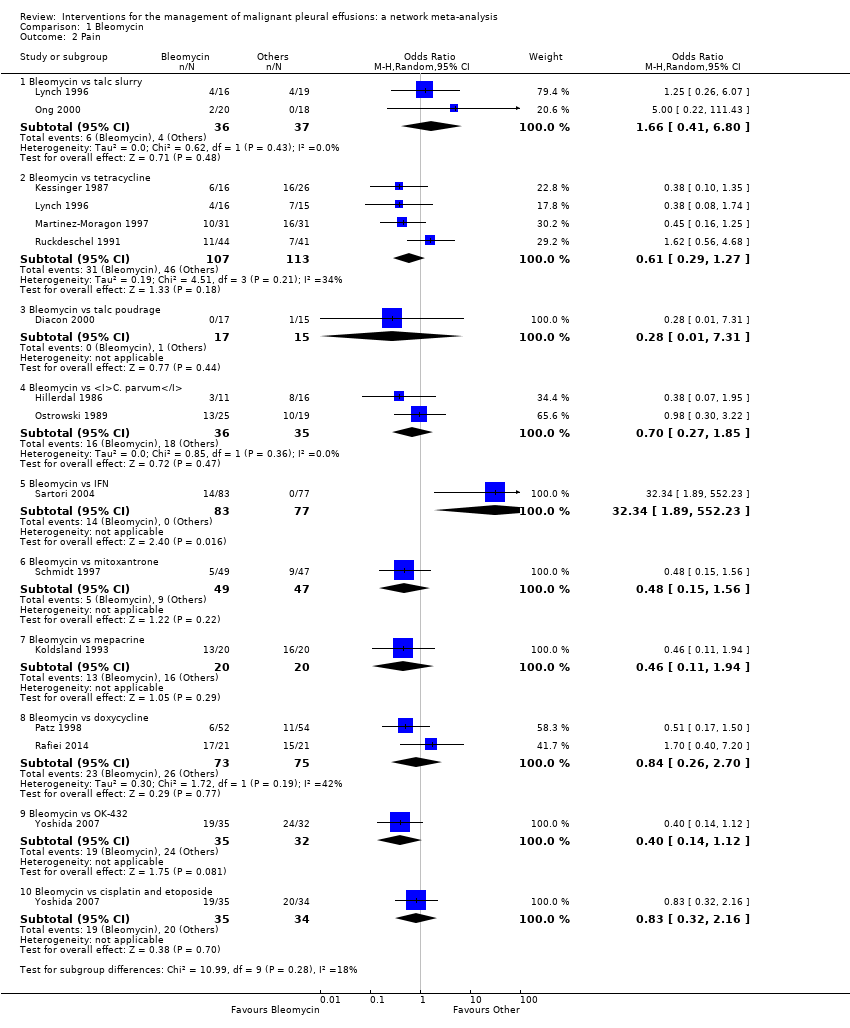
Comparison 1 Bleomycin, Outcome 2 Pain.

Comparison 1 Bleomycin, Outcome 3 Mortality.

Comparison 1 Bleomycin, Outcome 4 Fever.

Comparison 2 Talc slurry, Outcome 1 Pleurodesis failure.

Comparison 2 Talc slurry, Outcome 2 Mortality.

Comparison 2 Talc slurry, Outcome 3 Pain.

Comparison 2 Talc slurry, Outcome 4 Fever.

Comparison 3 Talc poudrage, Outcome 1 Pleurodesis failure.

Comparison 3 Talc poudrage, Outcome 2 Mortality.
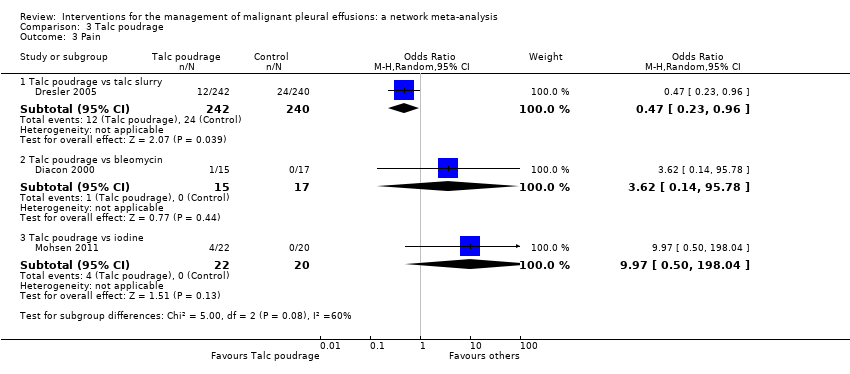
Comparison 3 Talc poudrage, Outcome 3 Pain.

Comparison 3 Talc poudrage, Outcome 4 Fever.
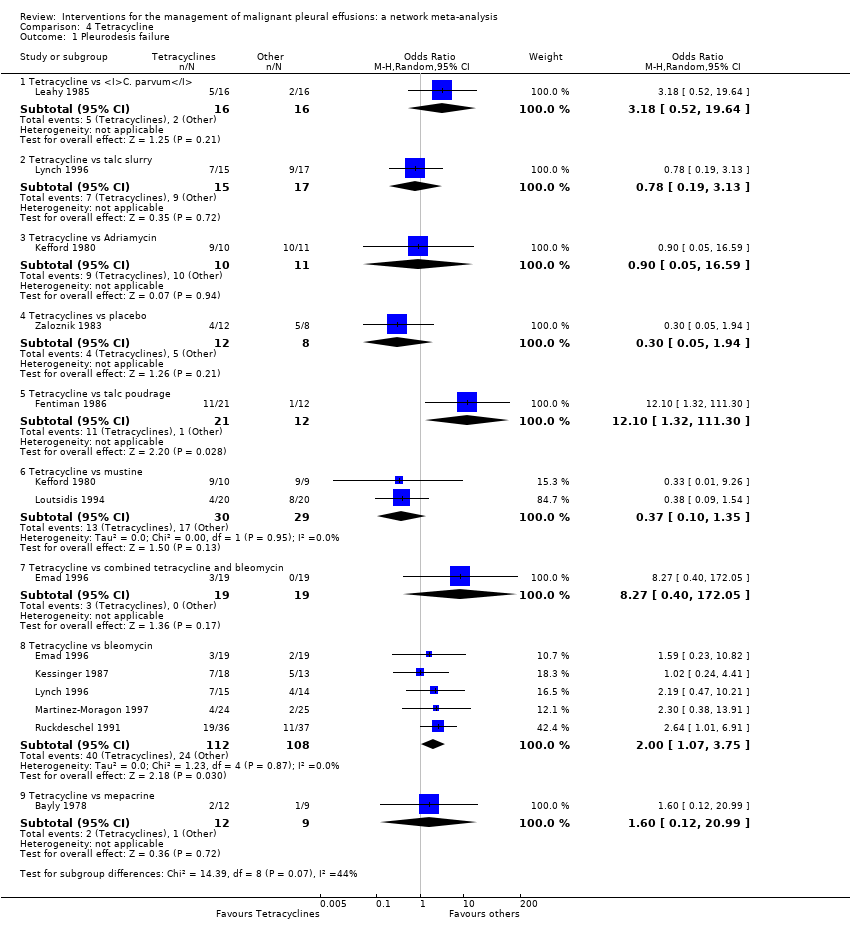
Comparison 4 Tetracycline, Outcome 1 Pleurodesis failure.
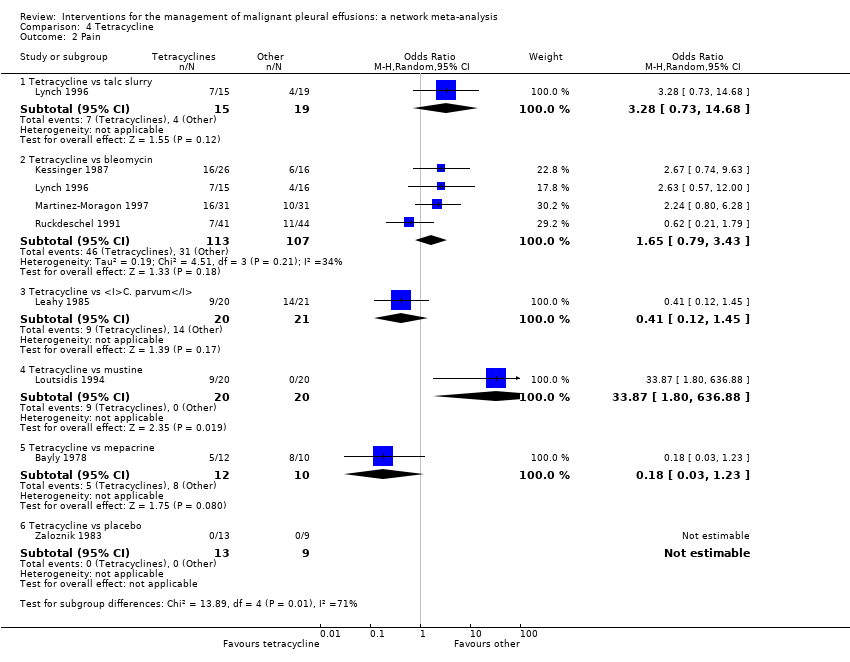
Comparison 4 Tetracycline, Outcome 2 Pain.

Comparison 4 Tetracycline, Outcome 3 Fever.
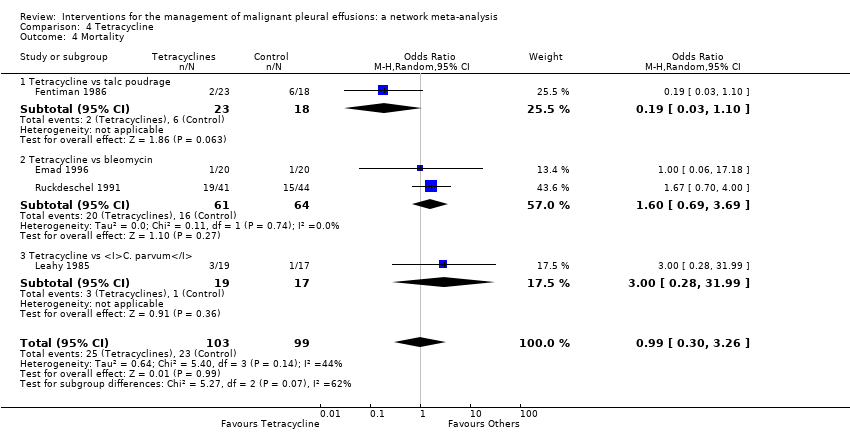
Comparison 4 Tetracycline, Outcome 4 Mortality.

Comparison 5 C. parvum, Outcome 1 Pleurodesis failure.

Comparison 5 C. parvum, Outcome 2 Pain.

Comparison 5 C. parvum, Outcome 3 Fever.

Comparison 5 C. parvum, Outcome 4 Mortality.

Comparison 6 Indwelling pleural catheter (IPC), Outcome 1 Pleurodesis failure.

Comparison 6 Indwelling pleural catheter (IPC), Outcome 2 Mortality.

Comparison 6 Indwelling pleural catheter (IPC), Outcome 3 Pain.

Comparison 7 Iodine, Outcome 1 Pleurodesis failure.

Comparison 7 Iodine, Outcome 2 Fever.

Comparison 7 Iodine, Outcome 3 Mortality.

Comparison 7 Iodine, Outcome 4 Pain.

Comparison 8 Doxycycline, Outcome 1 Pleurodesis failure.

Comparison 8 Doxycycline, Outcome 2 Pain.

Comparison 8 Doxycycline, Outcome 3 Fever.

Comparison 8 Doxycycline, Outcome 4 Mortality.

Comparison 9 Mode of administration, Outcome 1 Pleurodesis failure.

Comparison 10 Duration of drainage after pleurodesis administration, Outcome 1 Pleurodesis failure.

Comparison 10 Duration of drainage after pleurodesis administration, Outcome 2 Mortality.

Comparison 11 OK‐432, Outcome 1 Pleurodesis failure.

Comparison 11 OK‐432, Outcome 2 Pain.

Comparison 11 OK‐432, Outcome 3 Fever.

Comparison 11 OK‐432, Outcome 4 Mortality.

Comparison 12 Mepacrine, Outcome 1 Pain.

Comparison 12 Mepacrine, Outcome 2 Fever.

Comparison 12 Mepacrine, Outcome 3 Pleurodesis failure.

Comparison 12 Mepacrine, Outcome 4 Mortality.

Comparison 13 Interferon (IFN), Outcome 1 Pleurodesis failure.

Comparison 13 Interferon (IFN), Outcome 2 Pain.

Comparison 13 Interferon (IFN), Outcome 3 Fever.

Comparison 13 Interferon (IFN), Outcome 4 Mortality.

Comparison 14 Triethylenethiophophoramide, Outcome 1 Pleurodesis failure.

Comparison 14 Triethylenethiophophoramide, Outcome 2 Pain.
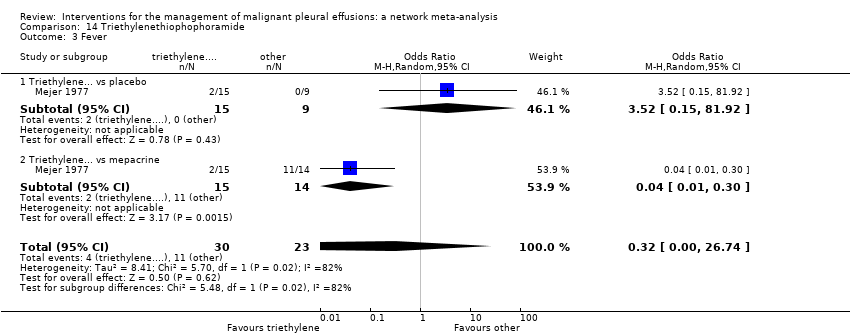
Comparison 14 Triethylenethiophophoramide, Outcome 3 Fever.

Comparison 15 Adriamycin, Outcome 1 Pleurodesis failure.

Comparison 15 Adriamycin, Outcome 2 Fever.
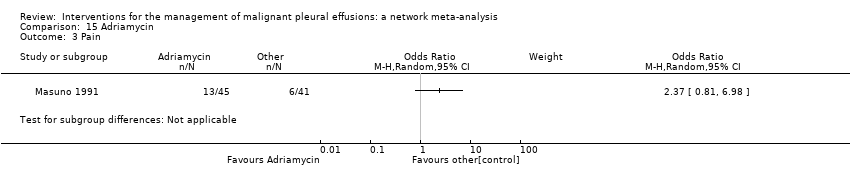
Comparison 15 Adriamycin, Outcome 3 Pain.

Comparison 16 Placebo, Outcome 1 Pleurodesis failure.

Comparison 16 Placebo, Outcome 2 Pain.

Comparison 16 Placebo, Outcome 3 Fever.
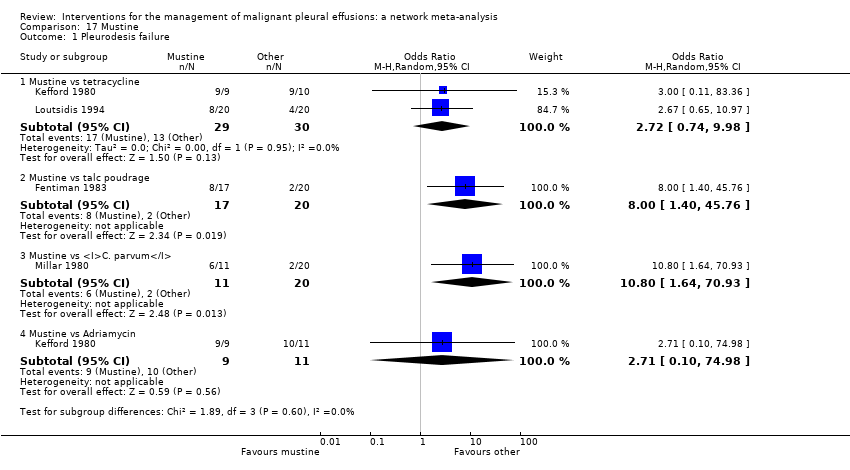
Comparison 17 Mustine, Outcome 1 Pleurodesis failure.

Comparison 17 Mustine, Outcome 2 Fever.

Comparison 17 Mustine, Outcome 3 Mortality.

Comparison 17 Mustine, Outcome 4 Pain.

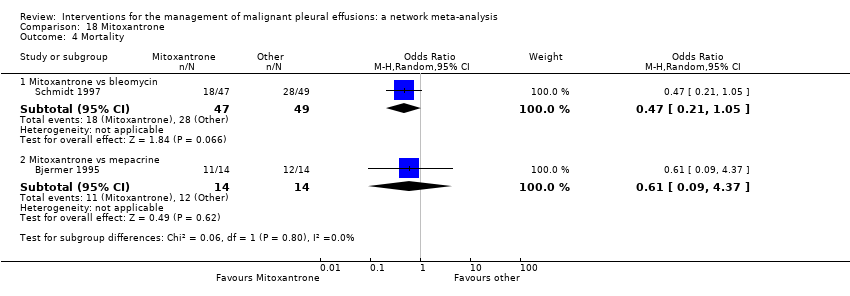
Comparison 18 Mitoxantrone, Outcome 1 Pleurodesis failure.

Comparison 18 Mitoxantrone, Outcome 2 Pain.

Comparison 18 Mitoxantrone, Outcome 3 Fever.
Comparison 18 Mitoxantrone, Outcome 4 Mortality.

Comparison 19 Drain size, Outcome 1 Pleurodesis failure.

Comparison 19 Drain size, Outcome 2 Pain.

Comparison 19 Drain size, Outcome 3 Mortality.

Comparison 20 Thoracoscopic mechanical pleurodesis (TMP), Outcome 1 Pleurodesis failure.

Comparison 20 Thoracoscopic mechanical pleurodesis (TMP), Outcome 2 Mortality.

Comparison 21 Other, Outcome 1 Pleurodesis failure.
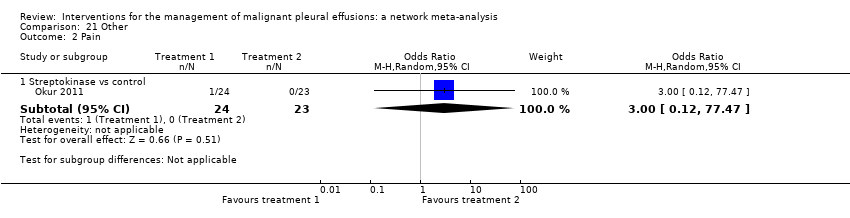
Comparison 21 Other, Outcome 2 Pain.

Comparison 21 Other, Outcome 3 Fever.

Comparison 21 Other, Outcome 4 Mortality.

Comparison 22 Silver nitrate, Outcome 1 Pleurodesis failure.

Comparison 22 Silver nitrate, Outcome 2 Fever.

Comparison 23 Cisplatin, Outcome 1 Pleurodesis failure.

Comparison 23 Cisplatin, Outcome 2 Pain.

Comparison 23 Cisplatin, Outcome 3 Fever.

Comparison 23 Cisplatin, Outcome 4 Mortality.

Comparison 24 Duration of drainage prior to administration of sclerosant, Outcome 1 Pleurodesis failure.

Comparison 25 Dose of silver nitrate, Outcome 1 Pleurodesis failure.

Comparison 25 Dose of silver nitrate, Outcome 2 Mortality.

Comparison 25 Dose of silver nitrate, Outcome 3 Pain.

Comparison 25 Dose of silver nitrate, Outcome 4 Fever.
| Treatment | Talc slurry | Talc poudrage | Bleomycin | Tetracycline | C. parvum | Placebo | Mustine | Mitoxantrone | Mepacrine |
| Talc poudrage | 0.76 (0.54, 1.09); n = 3; Tau2 = 0; I2 = 0% | NA | ‐ | ‐ | ‐ | ‐ | ‐ | ‐ | ‐ |
| Bleomycin | 1.22 (0.55, 2.70); n = 5*; Tau2 = 0.1; I2 = 12% | 9.70 (2.10, 44.78); n = 2; Tau2 = 0; I2= 0% | NA | ‐ | ‐ | ‐ | ‐ | ‐ | ‐ |
| Tetracycline | 0.78 (0.19, 3.13); n = 1* | 12.10 (1.32, 111.30); n = 1 | 2.00 (1.07, 3.75); n = 5*; Tau2 = 0; I2 = 0% | NA | ‐ | ‐ | ‐ | ‐ | ‐ |
| C. parvum | NA | NA | 0.55 (0.01, 57.48); n = 2; Tau2 = 11; I2 = 94% | 0.31 (0.05, 1.94); n = 1 | NA | ‐ | ‐ | ‐ | ‐ |
| Interferon | NA | NA | 3.25 (1.54, 6.89); n = 1 | NA | NA | ‐ | ‐ | ‐ | ‐ |
| Iodine | 0.47 (0.04, 5.71); n = 1 | 1.76 (0.26, 11.83); n = 1 | 1.25 (0.28, 5.59); n = 1 | NA | NA | ‐ | ‐ | ‐ | ‐ |
| Indwelling pleural catheter | 3.35 (1.64, 6.83); n = 2 Tau2 = 0; I2 = 0% | NA | NA | NA | NA | ‐ | ‐ | ‐ | ‐ |
| Placebo | 13.93 (0.66, 293.99); n = 1 | NA | NA | 3.33 (0.51, 21.58); n = 1 | NA | NA | ‐ | ‐ | ‐ |
| Mustine | NA | 8.00 (1.40, 45.76); n = 1 | NA | 2.72 (0.74, 9.98) n = 2*; Tau2= 0; I2= 0% | 3.00 (0.40, 22.71); n = 1 | NA | NA | ‐ | ‐ |
| Mitoxantrone | NA | NA | 3.18 (1.17, 8.65); n = 1 | NA | NA | 0.75 (0.32, 1.79); n = 1 | NA | NA | ‐ |
| Mepacrine | 2.08 (0.62, 6.96); n = 1 | NA | 0.16 (0.03, 0.89); n = 1 | 0.63 (0.05, 8.20); n = 1 | NA | 0.15 (0.03, 0.64); n = 1* | NA | 7.61 (0.35, 163.82); n = 1 | NA |
| Doxycycline | NA | 42.69 (2.13, 856.61); n = 1 | 0.67 (0.24, 1.86); n = 2; Tau2= 0; I2= 0% | NA | 1.91 (0.43, 8.48); n = 1 | NA | NA | NA | NA |
| Triethylenethiophosphoramide | NA | NA | NA | NA | NA | 2.06 (0.43, 9.80); n = 1* | NA | NA | 4.95 (1.02, 24.10); n = 1* |
| Adriamycin | NA | NA | NA | 1.11 (0.06, 20.49); n = 1* | NA | NA | 0.37 (0.01, 10.18); n = 1* | NA | NA |
| n = the number of studies included in the pair‐wise comparison. * Indicates that the comparison included a three‐arm study. NA = no direct pair‐wise comparison available. Results that are statistically significant at the conventional level of P < 0.05 are shaded in grey. ‐ indicates the odds ratio is already expressed elsewhere in the table comparing the interventions the other way around. | |||||||||
| Talc slurry | Talc poudrage | Bleomycin | Tetracycline | C. parvum | Interferon | Iodine | Indwelling pleural catheter | Placebo | Mustine | Mitoxantrone | Mepacrine | Doxycyline | Triethylenethiophosphoramide | viscum | |
| Talc poudrage | 0.42 (0.13, 1.19) | NA | ‐ | ‐ | ‐ | ‐ | ‐ | ‐ | ‐ | ‐ | ‐ | ‐ | ‐ | ‐ | ‐ |
| Bleomycin | 2.56 (1.05, 6.67) | 6.03 (2.19, 20.46) | NA | ‐ | ‐ | ‐ | ‐ | ‐ | ‐ | ‐ | ‐ | ‐ | ‐ | ‐ | ‐ |
| Tetracycline | 3.71 (1.22, 11.67) | 8.77 (2.74, 33.01) | 1.45 (0.59, 3.46) | NA | ‐ | ‐ | ‐ | ‐ | ‐ | ‐ | ‐ | ‐ | ‐ | ‐ | ‐ |
| C. parvum | 1.48 (0.34, 6.57) | 3.49 (0.79, 17.64) | 0.58 (0.16, 1.95) | 0.40 (0.10, 1.52) | NA | ‐ | ‐ | ‐ | ‐ | ‐ | ‐ | ‐ | ‐ | ‐ | ‐ |
| Interferon | 8.49 (0.94, 82.98) | 19.96 (2.22, 229.60) | 3.33 (0.43, 25.66) | 2.29 (0.26, 21.65) | 5.75 (0.55, 64.16) | NA | ‐ | ‐ | ‐ | ‐ | ‐ | ‐ | ‐ | ‐ | ‐ |
| Iodine | 1.25 (0.22, 6.77) | 2.97 (0.55, 17.21) | 0.49 (0.09, 2.49) | 0.34 (0.05, 2.04) | 0.85 (0.11, 6.35) | 0.15 (0.01, 1.90) | NA | ‐ | ‐ | ‐ | ‐ | ‐ | ‐ | ‐ | ‐ |
| Indwelling pleural catheter | 3.47 (0.75, 16.46) | 8.19 (1.32, 59.02) | 1.36 (0.22, 8.01) | 0.94 (0.14, 6.27) | 2.36 (0.28, 19.88) | 0.41 (0.03, 5.96) | 2.76 (0.29, 28.48) | NA | ‐ | ‐ | ‐ | ‐ | ‐ | ‐ | ‐ |
| Placebo | 19.50 (3.73, 128.50) | 46.51 (7.86, 375.90) | 7.64 (1.55, 44.22) | 5.29 (1.04, 31.95) | 13.28 (1.91, 110.80) | 2.29 (0.18, 34.14) | 15.63 (1.72, 179.10) | 5.61 (0.59, 65.18) | NA | ‐ | ‐ | ‐ | ‐ | ‐ | ‐ |
| Mustine | 7.50 (1.35, 43.86) | 17.75 (3.59, 105.70) | 2.94 (0.58, 14.84) | 2.02 (0.43, 9.79) | 5.07 (0.91, 29.81) | 0.88 (0.06, 11.71) | 5.98 (0.68, 58.17) | 2.16 (0.22, 22.76) | 0.38 (0.04, 3.32) | NA | ‐ | ‐ | ‐ | ‐ | ‐ |
| Mitoxantrone | 12.87 (2.36, 89.02) | 30.53 (5.11, 259.50) | 5.04 (1.04, 28.67) | 3.48 (0.64, 22.72) | 8.76 (1.24, 73.66) | 1.51 (0.12, 22.89) | 10.28 (1.12, 119.70) | 3.71 (0.38, 44.85) | 0.66 (0.13, 3.52) | 1.73 (0.19, 17.80 | NA | ‐ | ‐ | ‐ | ‐ |
| Mepacrine | 0.98 (0.22, 4.15) | 2.32 (0.45, 12.99) | 0.38 (0.09, 1.52) | 0.27 (0.05, 1.17) | 0.67 (0.10, 4.06) | 0.12 (0.01, 1.31) | 0.78 (0.09, 6.55) | 0.28 (0.03, 2.32) | 0.05 (0.01, 0.28) | 0.13 (0.02, 0.99) | 0.08 (0.01, 0.47) | NA | ‐ | ‐ | ‐ |
| Doxycycline | 3.49 (0.68, 19.56) | 8.23 (1.70, 50.18) | 1.37 (0.31, 6.09) | 0.94 (0.18, 5.09) | 2.36 (0.46, 13.09) | 0.41 (0.03, 5.14) | 2.78 (0.33, 26.50) | 1.00 (0.11, 10.23) | 0.18 (0.02, 1.53) | 0.47 (0.06, 3.77) | 0.27 (0.03, 2.31) | 3.56 (0.50, 28.59) | NA | ‐ | ‐ |
| Triethylenethiophosphoramide | 5.53 (0.40, 80.97) | 13.07 (0.89, 227.30) | 2.16 (0.16, 29.77) | 1.50 (0.10, 21.61) | 3.74 (0.21, 66.99) | 0.65 (0.02, 17.63) | 4.40 (0.22, 98.58) | 1.59 (0.08, 35.28) | 0.28 (0.02, 3.62) | 0.74 (0.04, 15.00) | 0.43 (0.02, 6.80) | 5.60 (0.55, 63.81) | 1.59 (0.08, 31.05) | NA | ‐ |
| Adriamycin | 2.31 (0.03, 165.40) | 5.53 (0.08, 403.50) | 0.90 (0.01, 59.43) | 0.62 (0.01, 38.58) | 1.57 (0.02, 114.20) | 0.27 (0.00, 27.43) | 1.85 (0.02, 162.70) | 0.67 (0.01, 62.01) | 0.12 (0.00, 9.46) | 0.31 (0.00, 20.50) | 0.18 (0.00, 14.59) | 2.36 (0.03, 191.30) | 0.66 (0.01, 52.71) | 0.42 (0.00, 54.35) | NA |
| Viscum | 0.39 (0.01, 8.23) | 0.92 (0.03, 21.77) | 0.15 (0.01, 2.73) | 0.10 (0.00, 2.17) | 0.26 (0.01, 6.21) | 0.04 (0.00, 1.55) | 0.31 (0.01, 9.07) | 0.11 (0.00, 3.44) | 0.02 (0.00, 0.53) | 0.05 (0.00, 1.41) | 0.03 (0.00, 0.79) | 0.39 (0.01, 10.28) | 0.11 (0.00, 2.83) | 0.07 (0.00, 3.48) | 0.16 (0.00, 26.60) |
| Results that are statistically significant at the conventional level of P < 0.05 are shaded in grey. ‐ indicates the odds ratio is already expressed elsewhere in the table comparing the interventions the other way around. NA= not applicable. | |||||||||||||||
| Study | Reason study excluded from network | Intrapleural agent or intervention 1 | Pleurodesis failure rate for agent 1 | Intrapleural agent or intervention 2 | Pleurodesis failure rate for agent 2 | OR (95% CI) of agent 1 compared with agent 2*** |
| Du 2013 | Lung cancer specific therapy | Cisplatin and bevacizumab | 6/36 | Cisplatin | 17/34 | 0.20 (0.07, 0.60) |
| Emad 1996* | No pleurodesis failures in the Combined group | Tetracycline** | 3/19 | Combined tetracycline and bleomycin | 0/19 | 8.27 (0.40, 172.05) |
| Bleomycin** | 2/19 | Combined tetracycline and bleomycin | 0/19 | 5.57 (0.25, 124.19) | ||
| Ishida 2006* | Lung cancer specific therapy | OK‐432 | 8/17 | Cisplatin | 11/17 | 0.48 (0.12, 1.92) |
| OK‐432 | 8/17 | OK‐432 and cisplatin | 1/15 | 12.44 (1.32, 117.03) | ||
| Cisplatin | 11/17 | OK‐432 and cisplatin | 1/15 | 25.67 (2.68, 245.84) | ||
| Kasahara 2006 | Lung cancer specific therapy | High dose OK‐432 | 5/19 | Low dose OK‐432 | 3/19 | 1.90 (0.38, 9.44) |
| Luh 1992 | Lung cancer specific therapy | OK‐432 | 3/26 | Mitomycin C | 9/27 | 0.26 (0.06, 1.11) |
| Maskell 2004 | Two Talc slurry preparations | Mixed particle talc | 3/14 | Graded talc (particles >20µm) | 2/14 | 1.64 (0.23, 11.70)) |
| Masuno 1991 | Lung cancer specific therapy | LC9018 and Adriamycin | 10/38 | Adriamycin | 23/38 | 0.23 (0.09, 0.62) |
| Paschoalini 2005 | No pleurodesis failures in Silver Nitrate group | Talc slurry | 1/9 | Silver nitrate | 0/16 | 5.85 (0.21, 158.82) |
| Rintoul 2014 | MPM specific surgical technique | Talc pleurodesis (slurry or poudrage) | 25/62 | VATS pleurectomy | 24/60 | 0.88 (0.43, 1.82) |
| Terra 2015* | Comparison of different doses of Silver Nitrate | 90 mg silver nitrate | 0/20 | 150 mg silver nitrate | 0/20 | not estimable |
| 90 mg silver nitrate | 0/20 | 180 mg silver nitrate | 2/20 | 0.18 (0.01, 4.01) | ||
| 150 mg silver nitrate | 0/20 | 180 mg silver nitrate | 2/20 | 0.19 (0.01, 4.01) | ||
| Yoshida 2007* | Lung cancer specific therapy | OK‐432 | 8/33 | Bleomycin | 11/35 | 0.70 (0.24, 2.03) |
| OK‐432 | 8/33 | Cisplatin and etoposide | 10/34 | 0.77 (0.26, 2.27) | ||
| Bleomycin | 11/35 | Cisplatin and etoposide | 10/34 | 1.10 (0.39, 3.07) | ||
| Zhao 2009 | Lung cancer specific therapy | rAd‐p53 and cisplatin | 3/17 | Cisplatin | 9/18 | 0.21 (0.05, 1.01) |
| *Three‐arm study. **The results for the pair‐wise comparison between tetracycline and bleomycin are included in the network meta‐analysis. ***Results that are statistically significant at the conventional level of P < 0.05 are shaded in grey | ||||||
| Type of method to optimise pleurodesis | Study | Intervention 1 | Pleurodesis failure rate for intervention 1 | Intervention 2 | Pleurodesis failure rate for intervention 2 | OR (95% CI) of intervention 1 compared with intervention 2* |
| Mode of administration | Evans 1993 | Tetracycline pleurodesis at the end of thoracoscopy | 2/15 | Tetracycline pleurodesis through an intercostal cannula | 5/14 | 0.28 (0.04, 1.76) |
| Chest tube size | Clementsen 1998 | Small‐bore chest drain | 2/9 | Large‐bore chest drain | 3/9 | 0.57 (0.07, 4.64) |
| Patient rotation | Mager 2002 | Rotation after instillation of talc | 2/10 | No rotation after instillation of talc | 1/10 | 2.25 (0.17, 29.77) |
| Duration of drainage after administration of the sclerosant | Goodman 2006 | Drain removed 24 hours after pleurodesis | 2/16 | Drain removed 72 hours after pleurodesis | 4/19 | 0.54 (0.08, 3.40) |
| Villanueva 1994 | Drain removal the day after pleurodesis | 2/9 | Drain removal when < 150 ml/day output | 3/15 | 1.14 (0.15, 8.59) | |
| Yildirim 2005 | Fractionated dose oxytetracycline (4 divided doses at 6‐hourly intervals) | 0/12 | Single bedside instillation of oxytetracycline | 2/8 | 0.10 (0.00, 2.50) | |
| Duration of drainage prior to administration of the sclerosant | Ozkul 2014 | Early instillation of talc slurry after drain insertion | 5/40 | Instillation of talc slurry when daily drainage from chest tube < 300 ml/day | 6/39 | 0.79 (0.22, 2.82) |
| Intrapleural fibrinolytics | Okur 2011 | Intrapleural streptokinase | 14/19 | No intrapleural streptokinase | 9/16 | 2.18 (0.53, 9.02) |
| Pleural abrasion at thoracoscopy | Crnjac 2004 | Talc slurry | 11/42 | Thoracoscopic mechanical pleurodesis | 6/45 | 2.31 (0.77, 6.93) |
| * Results that are statistically significant at the conventional level of P < 0.05 are shaded in grey | ||||||
| Talc slurry | Talc poudrage | Bleomycin | Tetracycline | C. parvum | Iodine | Mepacrine | Placebo | Mitoxantrone | Doxycycline | |
| Talc poudrage | 0.66 (0.09, 3.98) | NA | ‐ | ‐ | ‐ | ‐ | ‐ | ‐ | ‐ | ‐ |
| Bleomycin | 1.26 (0.24, 6.82) | 1.93 (0.22, 19.42) | NA | ‐ | ‐ | ‐ | ‐ | ‐ | ‐ | ‐ |
| Tetracycline | 0.29 (0.04, 2.09) | 0.45 (0.04, 5.74) | 0.23 (0.06, 0.88) | NA | ‐ | ‐ | ‐ | ‐ | ‐ | ‐ |
| C. parvum | 6.31 (0.61, 70.69) | 9.71 (0.65, 176.70) | 5.01 (0.92, 29.12) | 21.46 (3.10, 175.70) | NA | ‐ | ‐ | ‐ | ‐ | ‐ |
| Iodine | 0.27 (0.02, 3.69) | 0.42 (0.03, 6.09) | 0.21 (0.01, 4.25) | 0.93 (0.03, 23.41) | 0.04 (0.00, 1.29) | NA | ‐ | ‐ | ‐ | ‐ |
| Mepacrine | 4.52 (0.30, 76.00) | 6.95 (0.34, 182.20) | 3.58 (0.40, 36.59) | 15.41 (1.62, 178.80) | 0.71 (0.05, 11.99) | 16.72 (0.43, 831.10) | NA | ‐ | ‐ | ‐ |
| Placebo | 0.06 (0.00, 2.00) | 0.10 (0.00, 4.27) | 0.05 (0.00, 1.08) | 0.22 (0.00, 5.71) | 0.01 (0.00, 0.32) | 0.23 (0.00, 17.55) | 0.01 (0.00, 0.30) | NA | ‐ | ‐ |
| Mitoxantrone | 0.48 (0.02, 10.24) | 0.73 (0.02, 22.95) | 0.38 (0.02, 5.02) | 1.64 (0.07, 29.71) | 0.08 (0.00, 1.60) | 1.75 (0.03, 99.74) | 0.11 (0.00, 2.16) | 7.57 (0.59, 138.80) | NA | ‐ |
| Doxycycline | 0.49 (0.03, 6.13) | 0.75 (0.04, 14.68) | 0.39 (0.05, 2.66) | 1.67 (0.14, 17.22) | 0.08 (0.01, 0.63) | 1.81 (0.05, 69.03) | 0.11 (0.00, 1.93) | 7.69 (0.19, 539.10) | 1.02 (0.04, 33.23) | NA |
| Triethylenephosphoramide | 0.24 (0.00, 17.04) | 0.37 (0.00, 35.93) | 0.19 (0.00, 9.80) | 0.81 (0.02, 47.08) | 0.04 (0.00, 2.63) | 0.88 (0.01, 139.50) | 0.05 (0.00, 1.49) | 3.62 (0.07, 529.40) | 0.49 (0.01, 49.44 | 0.49 (0.01, 45.90) |
| Results that are statistically significant at the conventional level of P < 0.05 are shaded in grey. ‐ indicates the odds ratio is already expressed elsewhere in the table comparing the interventions the other way around. NA= not applicable | ||||||||||
| Outcome or subgroup title | No. of studies | No. of participants | Statistical method | Effect size |
| 1 Pleurodesis failure Show forest plot | 21 | Odds Ratio (M‐H, Random, 95% CI) | Subtotals only | |
| 1.1 Bleomycin vs iodine | 1 | 39 | Odds Ratio (M‐H, Random, 95% CI) | 0.8 [0.18, 3.57] |
| 1.2 Bleomycin vs talc slurry | 5 | 199 | Odds Ratio (M‐H, Random, 95% CI) | 1.22 [0.55, 2.70] |
| 1.3 Bleomycin vs tetracycline | 5 | 220 | Odds Ratio (M‐H, Random, 95% CI) | 0.50 [0.27, 0.93] |
| 1.4 Bleomycin vs talc poudrage | 2 | 57 | Odds Ratio (M‐H, Random, 95% CI) | 9.70 [2.10, 44.78] |
| 1.5 Bleomycin vs C. parvum | 2 | 78 | Odds Ratio (M‐H, Random, 95% CI) | 1.81 [0.02, 189.25] |
| 1.6 Bleomycin vs doxycycline | 2 | 122 | Odds Ratio (M‐H, Random, 95% CI) | 1.50 [0.54, 4.20] |
| 1.7 Bleomycin vs IFN | 1 | 160 | Odds Ratio (M‐H, Random, 95% CI) | 0.31 [0.15, 0.65] |
| 1.8 Bleomycin vs mitoxantrone | 1 | 85 | Odds Ratio (M‐H, Random, 95% CI) | 0.31 [0.12, 0.86] |
| 1.9 Bleomycin vs mepacrine | 1 | 36 | Odds Ratio (M‐H, Random, 95% CI) | 6.40 [1.12, 36.44] |
| 1.10 Bleomycin vs combined tetracycline and bleomycin | 1 | 38 | Odds Ratio (M‐H, Random, 95% CI) | 5.57 [0.25, 124.19] |
| 1.11 Bleomycin vs cisplatin and etoposide | 1 | 69 | Odds Ratio (M‐H, Random, 95% CI) | 1.1 [0.39, 3.07] |
| 1.12 Bleomycin vs OK‐432 | 1 | 68 | Odds Ratio (M‐H, Random, 95% CI) | 1.43 [0.49, 4.17] |
| 1.13 Bleomycin vs viscum | 1 | 17 | Odds Ratio (M‐H, Random, 95% CI) | 5.33 [0.62, 45.99] |
| 2 Pain Show forest plot | 14 | Odds Ratio (M‐H, Random, 95% CI) | Subtotals only | |
| 2.1 Bleomycin vs talc slurry | 2 | 73 | Odds Ratio (M‐H, Random, 95% CI) | 1.66 [0.41, 6.80] |
| 2.2 Bleomycin vs tetracycline | 4 | 220 | Odds Ratio (M‐H, Random, 95% CI) | 0.61 [0.29, 1.27] |
| 2.3 Bleomycin vs talc poudrage | 1 | 32 | Odds Ratio (M‐H, Random, 95% CI) | 0.28 [0.01, 7.31] |
| 2.4 Bleomycin vs C. parvum | 2 | 71 | Odds Ratio (M‐H, Random, 95% CI) | 0.70 [0.27, 1.85] |
| 2.5 Bleomycin vs IFN | 1 | 160 | Odds Ratio (M‐H, Random, 95% CI) | 32.34 [1.89, 552.23] |
| 2.6 Bleomycin vs mitoxantrone | 1 | 96 | Odds Ratio (M‐H, Random, 95% CI) | 0.48 [0.15, 1.56] |
| 2.7 Bleomycin vs mepacrine | 1 | 40 | Odds Ratio (M‐H, Random, 95% CI) | 0.46 [0.11, 1.94] |
| 2.8 Bleomycin vs doxycycline | 2 | 148 | Odds Ratio (M‐H, Random, 95% CI) | 0.84 [0.26, 2.70] |
| 2.9 Bleomycin vs OK‐432 | 1 | 67 | Odds Ratio (M‐H, Random, 95% CI) | 0.40 [0.14, 1.12] |
| 2.10 Bleomycin vs cisplatin and etoposide | 1 | 69 | Odds Ratio (M‐H, Random, 95% CI) | 0.83 [0.32, 2.16] |
| 3 Mortality Show forest plot | 11 | Odds Ratio (M‐H, Random, 95% CI) | Subtotals only | |
| 3.1 Bleomycin vs combined tetracycline and bleomycin | 1 | 40 | Odds Ratio (M‐H, Random, 95% CI) | 1.0 [0.06, 17.18] |
| 3.2 Bleomycin vs talc slurry | 2 | 116 | Odds Ratio (M‐H, Random, 95% CI) | 0.89 [0.29, 2.75] |
| 3.3 Bleomycin vs tetracycline | 2 | 125 | Odds Ratio (M‐H, Random, 95% CI) | 0.63 [0.27, 1.44] |
| 3.4 Bleomycin vs talc poudrage | 1 | 32 | Odds Ratio (M‐H, Random, 95% CI) | 0.82 [0.20, 3.43] |
| 3.5 Bleomycin vs C. parvum | 1 | 55 | Odds Ratio (M‐H, Random, 95% CI) | 0.60 [0.19, 1.94] |
| 3.6 Bleomycin vs IFN | 1 | 160 | Odds Ratio (M‐H, Random, 95% CI) | 0.46 [0.25, 0.87] |
| 3.7 Bleomycin vs mitoxantrone | 1 | 96 | Odds Ratio (M‐H, Random, 95% CI) | 2.15 [0.95, 4.86] |
| 3.8 Bleomycin vs OK‐432 | 1 | 68 | Odds Ratio (M‐H, Random, 95% CI) | 2.66 [0.98, 7.23] |
| 3.9 Bleomycin vs doxycycline | 2 | 122 | Odds Ratio (M‐H, Random, 95% CI) | 1.44 [0.53, 3.90] |
| 3.10 Bleomycin vs cisplatin and etoposide | 1 | 69 | Odds Ratio (M‐H, Random, 95% CI) | 2.22 [0.82, 6.01] |
| 4 Fever Show forest plot | 16 | Odds Ratio (M‐H, Random, 95% CI) | Subtotals only | |
| 4.1 Bleomycin vs talc Slurry | 3 | 99 | Odds Ratio (M‐H, Random, 95% CI) | 0.90 [0.31, 2.56] |
| 4.2 Bleomycin vs talc poudrage | 1 | 32 | Odds Ratio (M‐H, Random, 95% CI) | 0.87 [0.11, 7.05] |
| 4.3 Bleomycin vs tetracycline | 5 | 250 | Odds Ratio (M‐H, Random, 95% CI) | 2.05 [0.67, 6.34] |
| 4.4 Tetracycline vs C. parvum | 2 | 80 | Odds Ratio (M‐H, Random, 95% CI) | 0.43 [0.17, 1.12] |
| 4.5 Bleomycin vs IFN | 1 | 160 | Odds Ratio (M‐H, Random, 95% CI) | 151.35 [9.08, 2522.62] |
| 4.6 Bleomycin vs mitoxantrone | 1 | 96 | Odds Ratio (M‐H, Random, 95% CI) | 1.11 [0.37, 3.36] |
| 4.7 Bleomycin vs mepacrine | 1 | 40 | Odds Ratio (M‐H, Random, 95% CI) | 0.52 [0.14, 1.92] |
| 4.8 Bleomycin vs doxycycline | 2 | 148 | Odds Ratio (M‐H, Random, 95% CI) | 2.69 [0.08, 89.51] |
| 4.9 Bleomycin vs combined tetracycline and bleomycin | 1 | 40 | Odds Ratio (M‐H, Random, 95% CI) | 0.47 [0.04, 5.69] |
| 4.10 Bleomycin vs OK432 | 1 | 67 | Odds Ratio (M‐H, Random, 95% CI) | 0.7 [0.23, 2.13] |
| 4.11 Bleomycin vs cisplatin and etoposide | 1 | 69 | Odds Ratio (M‐H, Random, 95% CI) | 2.22 [0.82, 6.01] |
| Outcome or subgroup title | No. of studies | No. of participants | Statistical method | Effect size |
| 1 Pleurodesis failure Show forest plot | 15 | Odds Ratio (M‐H, Random, 95% CI) | Subtotals only | |
| 1.1 Talc slurry vs talc poudrage | 3 | 599 | Odds Ratio (M‐H, Random, 95% CI) | 1.31 [0.92, 1.85] |
| 1.2 Talc slurry vs bleomycin | 5 | 199 | Odds Ratio (M‐H, Random, 95% CI) | 0.82 [0.37, 1.82] |
| 1.3 Talc slurry vs IPC | 2 | 160 | Odds Ratio (M‐H, Random, 95% CI) | 0.30 [0.15, 0.61] |
| 1.4 Talc slurry vs mepacrine | 1 | 89 | Odds Ratio (M‐H, Random, 95% CI) | 0.48 [0.14, 1.60] |
| 1.5 Talc slurry vs placebo | 1 | 21 | Odds Ratio (M‐H, Random, 95% CI) | 0.07 [0.00, 1.51] |
| 1.6 Talc slurry vs iodine | 1 | 36 | Odds Ratio (M‐H, Random, 95% CI) | 2.13 [0.18, 25.78] |
| 1.7 Talc slurry vs tetracycline | 1 | 32 | Odds Ratio (M‐H, Random, 95% CI) | 1.29 [0.32, 5.17] |
| 1.8 Talc slurry vs silver nitrate | 1 | 25 | Odds Ratio (M‐H, Random, 95% CI) | 5.82 [0.21, 158.82] |
| 1.9 Talc slurry vs TMP | 1 | 87 | Odds Ratio (M‐H, Random, 95% CI) | 2.31 [0.77, 6.93] |
| 2 Mortality Show forest plot | 9 | Odds Ratio (M‐H, Random, 95% CI) | Subtotals only | |
| 2.1 Talc slurry vs talc poudrage | 2 | 397 | Odds Ratio (M‐H, Random, 95% CI) | 0.98 [0.33, 2.85] |
| 2.2 Talc slurry vs bleomycin | 2 | 116 | Odds Ratio (M‐H, Random, 95% CI) | 1.12 [0.36, 3.46] |
| 2.3 Talc slurry vs iodine | 1 | 36 | Odds Ratio (M‐H, Random, 95% CI) | 0.0 [0.0, 0.0] |
| 2.4 Talc slurry vs IPC | 2 | 163 | Odds Ratio (M‐H, Random, 95% CI) | 0.97 [0.45, 2.10] |
| 2.5 Talc slurry vs mepacrine | 1 | 89 | Odds Ratio (M‐H, Random, 95% CI) | 1.88 [0.70, 5.02] |
| 2.6 Talc slurry vs TMP | 1 | 87 | Odds Ratio (M‐H, Random, 95% CI) | 10.64 [0.55, 203.85] |
| 3 Pain Show forest plot | 7 | Odds Ratio (M‐H, Random, 95% CI) | Subtotals only | |
| 3.1 Talc slurry vs bleomycin | 3 | 99 | Odds Ratio (M‐H, Random, 95% CI) | 0.60 [0.15, 2.46] |
| 3.2 Talc slurry vs talc poudrage | 1 | 482 | Odds Ratio (M‐H, Random, 95% CI) | 2.13 [1.04, 4.36] |
| 3.3 Talc slurry vs tetracycline | 1 | 34 | Odds Ratio (M‐H, Random, 95% CI) | 0.30 [0.07, 1.36] |
| 3.4 Talc slurry vs iodine | 1 | 36 | Odds Ratio (M‐H, Random, 95% CI) | 0.0 [0.0, 0.0] |
| 3.5 Talc slurry vs IPC | 1 | 57 | Odds Ratio (M‐H, Random, 95% CI) | 0.31 [0.01, 7.95] |
| 3.6 Talc slurry vs placebo | 1 | 31 | Odds Ratio (M‐H, Random, 95% CI) | 0.0 [0.0, 0.0] |
| 4 Fever Show forest plot | 7 | Odds Ratio (M‐H, Random, 95% CI) | Subtotals only | |
| 4.1 Talc slurry vs talc poudrage | 2 | 479 | Odds Ratio (M‐H, Random, 95% CI) | 1.65 [0.42, 6.48] |
| 4.2 Talc slurry vs bleomycin | 3 | 98 | Odds Ratio (M‐H, Random, 95% CI) | 0.95 [0.36, 2.51] |
| 4.3 Talc slurry vs tetracycline | 1 | 34 | Odds Ratio (M‐H, Random, 95% CI) | 1.09 [0.28, 4.32] |
| 4.4 Talc slurry vs iodine | 1 | 36 | Odds Ratio (M‐H, Random, 95% CI) | 1.6 [0.23, 10.94] |
| 4.5 Talc slurry vs silver nitrate | 1 | 60 | Odds Ratio (M‐H, Random, 95% CI) | 0.7 [0.15, 3.24] |
| Outcome or subgroup title | No. of studies | No. of participants | Statistical method | Effect size |
| 1 Pleurodesis failure Show forest plot | 9 | Odds Ratio (M‐H, Fixed, 95% CI) | Subtotals only | |
| 1.1 Talc poudrage vs talc slurry | 3 | 599 | Odds Ratio (M‐H, Fixed, 95% CI) | 0.77 [0.54, 1.09] |
| 1.2 Talc poudrage vs bleomycin | 2 | 57 | Odds Ratio (M‐H, Fixed, 95% CI) | 0.10 [0.02, 0.48] |
| 1.3 Talc poudrage vs tetracycline | 1 | 33 | Odds Ratio (M‐H, Fixed, 95% CI) | 0.08 [0.01, 0.76] |
| 1.4 Talc poudrage vs iodine | 1 | 42 | Odds Ratio (M‐H, Fixed, 95% CI) | 0.57 [0.08, 3.80] |
| 1.5 Talc poudrage vs mustine | 1 | 37 | Odds Ratio (M‐H, Fixed, 95% CI) | 0.13 [0.02, 0.71] |
| 1.6 Talc poudrage vs doxycycline | 1 | 31 | Odds Ratio (M‐H, Fixed, 95% CI) | 0.02 [0.00, 0.47] |
| 2 Mortality Show forest plot | 6 | Odds Ratio (M‐H, Random, 95% CI) | Subtotals only | |
| 2.1 Talc poudrage vs talc slurry | 2 | 397 | Odds Ratio (M‐H, Random, 95% CI) | 1.02 [0.35, 3.00] |
| 2.2 Talc poudrage vs bleomycin | 1 | 32 | Odds Ratio (M‐H, Random, 95% CI) | 1.22 [0.29, 5.13] |
| 2.3 Talc poudrage vs tetracycline | 1 | 41 | Odds Ratio (M‐H, Random, 95% CI) | 5.25 [0.91, 30.22] |
| 2.4 Talc poudrage vs iodine | 1 | 42 | Odds Ratio (M‐H, Random, 95% CI) | 2.64 [0.58, 12.09] |
| 2.5 Talc poudrage vs mustine | 1 | 46 | Odds Ratio (M‐H, Random, 95% CI) | 0.43 [0.09, 1.96] |
| 3 Pain Show forest plot | 3 | Odds Ratio (M‐H, Random, 95% CI) | Subtotals only | |
| 3.1 Talc poudrage vs talc slurry | 1 | 482 | Odds Ratio (M‐H, Random, 95% CI) | 0.47 [0.23, 0.96] |
| 3.2 Talc poudrage vs bleomycin | 1 | 32 | Odds Ratio (M‐H, Random, 95% CI) | 3.62 [0.14, 95.78] |
| 3.3 Talc poudrage vs iodine | 1 | 42 | Odds Ratio (M‐H, Random, 95% CI) | 9.97 [0.50, 198.04] |
| 4 Fever Show forest plot | 4 | Odds Ratio (M‐H, Random, 95% CI) | Subtotals only | |
| 4.1 Talc poudrage vs talc slurry | 2 | 479 | Odds Ratio (M‐H, Random, 95% CI) | 0.60 [0.15, 2.37] |
| 4.2 Talc poudrage vs bleomycin | 1 | 32 | Odds Ratio (M‐H, Random, 95% CI) | 1.15 [0.14, 9.38] |
| 4.3 Talc poudrage vs iodine | 1 | 42 | Odds Ratio (M‐H, Random, 95% CI) | 4.22 [0.43, 41.45] |
| Outcome or subgroup title | No. of studies | No. of participants | Statistical method | Effect size |
| 1 Pleurodesis failure Show forest plot | 11 | Odds Ratio (M‐H, Random, 95% CI) | Subtotals only | |
| 1.1 Tetracycline vs C. parvum | 1 | 32 | Odds Ratio (M‐H, Random, 95% CI) | 3.18 [0.52, 19.64] |
| 1.2 Tetracycline vs talc slurry | 1 | 32 | Odds Ratio (M‐H, Random, 95% CI) | 0.78 [0.19, 3.13] |
| 1.3 Tetracycline vs Adriamycin | 1 | 21 | Odds Ratio (M‐H, Random, 95% CI) | 0.9 [0.05, 16.59] |
| 1.4 Tetracyclines vs placebo | 1 | 20 | Odds Ratio (M‐H, Random, 95% CI) | 0.30 [0.05, 1.94] |
| 1.5 Tetracycline vs talc poudrage | 1 | 33 | Odds Ratio (M‐H, Random, 95% CI) | 12.10 [1.32, 111.30] |
| 1.6 Tetracycline vs mustine | 2 | 59 | Odds Ratio (M‐H, Random, 95% CI) | 0.37 [0.10, 1.35] |
| 1.7 Tetracycline vs combined tetracycline and bleomycin | 1 | 38 | Odds Ratio (M‐H, Random, 95% CI) | 8.27 [0.40, 172.05] |
| 1.8 Tetracycline vs bleomycin | 5 | 220 | Odds Ratio (M‐H, Random, 95% CI) | 2.00 [1.07, 3.75] |
| 1.9 Tetracycline vs mepacrine | 1 | 21 | Odds Ratio (M‐H, Random, 95% CI) | 1.6 [0.12, 20.99] |
| 2 Pain Show forest plot | 8 | Odds Ratio (M‐H, Random, 95% CI) | Subtotals only | |
| 2.1 Tetracycline vs talc slurry | 1 | 34 | Odds Ratio (M‐H, Random, 95% CI) | 3.28 [0.73, 14.68] |
| 2.2 Tetracycline vs bleomycin | 4 | 220 | Odds Ratio (M‐H, Random, 95% CI) | 1.65 [0.79, 3.43] |
| 2.3 Tetracycline vs C. parvum | 1 | 41 | Odds Ratio (M‐H, Random, 95% CI) | 0.41 [0.12, 1.45] |
| 2.4 Tetracycline vs mustine | 1 | 40 | Odds Ratio (M‐H, Random, 95% CI) | 33.87 [1.80, 636.88] |
| 2.5 Tetracycline vs mepacrine | 1 | 22 | Odds Ratio (M‐H, Random, 95% CI) | 0.18 [0.03, 1.23] |
| 2.6 Tetracycline vs placebo | 1 | 22 | Odds Ratio (M‐H, Random, 95% CI) | 0.0 [0.0, 0.0] |
| 3 Fever Show forest plot | 9 | Odds Ratio (M‐H, Random, 95% CI) | Subtotals only | |
| 3.1 Tetracycline vs talc slurry | 1 | 34 | Odds Ratio (M‐H, Random, 95% CI) | 0.92 [0.23, 3.63] |
| 3.2 Tetracycline vs bleomycin | 5 | 250 | Odds Ratio (M‐H, Random, 95% CI) | 0.49 [0.16, 1.50] |
| 3.3 Tetracycline vs C. parvum | 1 | 36 | Odds Ratio (M‐H, Random, 95% CI) | 0.00 [0.00, 0.06] |
| 3.4 Tetracycline vs mepacrine | 1 | 22 | Odds Ratio (M‐H, Random, 95% CI) | 0.13 [0.02, 0.89] |
| 3.5 Tetracycline vs combination tetracycline and bleomycin | 1 | 40 | Odds Ratio (M‐H, Random, 95% CI) | 0.47 [0.04, 5.69] |
| 3.6 Tetracycline vs placebo | 1 | 22 | Odds Ratio (M‐H, Random, 95% CI) | 0.0 [0.0, 0.0] |
| 3.7 Tetracycline vs mustine | 1 | 40 | Odds Ratio (M‐H, Random, 95% CI) | 0.0 [0.0, 0.0] |
| 4 Mortality Show forest plot | 4 | 202 | Odds Ratio (M‐H, Random, 95% CI) | 0.99 [0.30, 3.26] |
| 4.1 Tetracycline vs talc poudrage | 1 | 41 | Odds Ratio (M‐H, Random, 95% CI) | 0.19 [0.03, 1.10] |
| 4.2 Tetracycline vs bleomycin | 2 | 125 | Odds Ratio (M‐H, Random, 95% CI) | 1.60 [0.69, 3.69] |
| 4.3 Tetracycline vs C. parvum | 1 | 36 | Odds Ratio (M‐H, Random, 95% CI) | 3.0 [0.28, 31.99] |
| Outcome or subgroup title | No. of studies | No. of participants | Statistical method | Effect size |
| 1 Pleurodesis failure Show forest plot | 5 | Odds Ratio (M‐H, Random, 95% CI) | Subtotals only | |
| 1.1 C. parvum vs bleomycin | 2 | 78 | Odds Ratio (M‐H, Random, 95% CI) | 0.55 [0.01, 57.48] |
| 1.2 C. parvum vs tetracycline | 1 | 32 | Odds Ratio (M‐H, Random, 95% CI) | 0.31 [0.05, 1.94] |
| 1.3 C. parvum vs doxycycline | 1 | 35 | Odds Ratio (M‐H, Random, 95% CI) | 0.52 [0.12, 2.33] |
| 1.4 C. parvum vs mustine | 1 | 18 | Odds Ratio (M‐H, Random, 95% CI) | 0.33 [0.04, 2.52] |
| 2 Pain Show forest plot | 4 | 153 | Odds Ratio (M‐H, Random, 95% CI) | 2.51 [1.10, 5.75] |
| 2.1 C. parvum vs bleomycin | 2 | 71 | Odds Ratio (M‐H, Random, 95% CI) | 1.42 [0.54, 3.75] |
| 2.2 C . parvum vs tetracycline | 1 | 41 | Odds Ratio (M‐H, Random, 95% CI) | 2.44 [0.69, 8.66] |
| 2.3 C. parvum vs doxycycline | 1 | 41 | Odds Ratio (M‐H, Random, 95% CI) | 7.37 [1.84, 29.55] |
| 3 Fever Show forest plot | 5 | Odds Ratio (M‐H, Random, 95% CI) | Subtotals only | |
| 3.1 C. parvum vs bleomycin | 2 | 80 | Odds Ratio (M‐H, Random, 95% CI) | 2.30 [0.90, 5.92] |
| 3.2 C. parvum vs tetracycline | 1 | 36 | Odds Ratio (M‐H, Random, 95% CI) | 288.00 [16.62, 4991.05] |
| 3.3 C. parvum vs mustine | 1 | 21 | Odds Ratio (M‐H, Random, 95% CI) | 4.41 [0.16, 121.68] |
| 3.4 C. parvum vs doxycycline | 1 | 41 | Odds Ratio (M‐H, Random, 95% CI) | 7.37 [1.84, 29.55] |
| 4 Mortality Show forest plot | 3 | Odds Ratio (M‐H, Random, 95% CI) | Subtotals only | |
| 4.1 C. parvum vs bleomycin | 1 | 55 | Odds Ratio (M‐H, Random, 95% CI) | 1.66 [0.51, 5.38] |
| 4.2 C. parvum vs tetracycline | 1 | 36 | Odds Ratio (M‐H, Random, 95% CI) | 0.33 [0.03, 3.55] |
| 4.3 C. parvum vs mustine | 1 | 21 | Odds Ratio (M‐H, Random, 95% CI) | 0.42 [0.07, 2.66] |
| Outcome or subgroup title | No. of studies | No. of participants | Statistical method | Effect size |
| 1 Pleurodesis failure Show forest plot | 2 | Odds Ratio (M‐H, Random, 95% CI) | Subtotals only | |
| 1.1 IPC vs talc slurry | 2 | 160 | Odds Ratio (M‐H, Random, 95% CI) | 3.35 [1.64, 6.83] |
| 2 Mortality Show forest plot | 2 | 163 | Odds Ratio (M‐H, Random, 95% CI) | 1.03 [0.48, 2.23] |
| 3 Pain Show forest plot | 1 | Odds Ratio (M‐H, Random, 95% CI) | Subtotals only | |
| Outcome or subgroup title | No. of studies | No. of participants | Statistical method | Effect size |
| 1 Pleurodesis failure Show forest plot | 3 | Odds Ratio (M‐H, Random, 95% CI) | Subtotals only | |
| 1.1 Iodine vs talc poudrage | 1 | 42 | Odds Ratio (M‐H, Random, 95% CI) | 1.76 [0.26, 11.83] |
| 1.2 Iodine vs talc slurry | 1 | 36 | Odds Ratio (M‐H, Random, 95% CI) | 0.47 [0.04, 5.71] |
| 1.3 Iodine vs bleomycin | 1 | 39 | Odds Ratio (M‐H, Random, 95% CI) | 1.25 [0.28, 5.59] |
| 2 Fever Show forest plot | 2 | Odds Ratio (M‐H, Random, 95% CI) | Subtotals only | |
| 2.1 Iodine vs talc slurry | 1 | 36 | Odds Ratio (M‐H, Random, 95% CI) | 0.63 [0.09, 4.28] |
| 2.2 Iodine vs talc poudrage | 1 | 42 | Odds Ratio (M‐H, Random, 95% CI) | 0.24 [0.02, 2.33] |
| 3 Mortality Show forest plot | 1 | Odds Ratio (M‐H, Random, 95% CI) | Subtotals only | |
| 3.1 Iodine vs talc poudrage | 1 | 42 | Odds Ratio (M‐H, Random, 95% CI) | 0.38 [0.08, 1.73] |
| 4 Pain Show forest plot | 2 | Odds Ratio (M‐H, Random, 95% CI) | Subtotals only | |
| 4.1 Iodine vs talc slurry | 1 | 36 | Odds Ratio (M‐H, Random, 95% CI) | 0.0 [0.0, 0.0] |
| 4.2 Iodine vs talc poudrage | 1 | 42 | Odds Ratio (M‐H, Random, 95% CI) | 0.10 [0.01, 1.99] |
| Outcome or subgroup title | No. of studies | No. of participants | Statistical method | Effect size |
| 1 Pleurodesis failure Show forest plot | 4 | Odds Ratio (M‐H, Fixed, 95% CI) | Subtotals only | |
| 1.1 Doxycycline vs talc poudrage | 1 | 31 | Odds Ratio (M‐H, Fixed, 95% CI) | 42.69 [2.13, 856.61] |
| 1.2 Doxycycline vs bleomycin | 2 | 122 | Odds Ratio (M‐H, Fixed, 95% CI) | 0.66 [0.24, 1.83] |
| 1.3 Doxycycline vs C. parvum | 1 | 35 | Odds Ratio (M‐H, Fixed, 95% CI) | 1.91 [0.43, 8.48] |
| 2 Pain Show forest plot | 3 | Odds Ratio (M‐H, Random, 95% CI) | Subtotals only | |
| 2.1 Doxycycline vs bleomycin | 2 | 148 | Odds Ratio (M‐H, Random, 95% CI) | 1.19 [0.37, 3.80] |
| 2.2 Doxycycline vs C. parvum | 1 | 41 | Odds Ratio (M‐H, Random, 95% CI) | 0.10 [0.01, 0.96] |
| 3 Fever Show forest plot | 3 | 189 | Odds Ratio (M‐H, Random, 95% CI) | 0.28 [0.04, 2.16] |
| 3.1 Doxycycline vs bleomycin | 2 | 148 | Odds Ratio (M‐H, Random, 95% CI) | 0.37 [0.01, 12.35] |
| 3.2 Doxycycline vs C. parvum | 1 | 41 | Odds Ratio (M‐H, Random, 95% CI) | 0.14 [0.03, 0.54] |
| 4 Mortality Show forest plot | 1 | Odds Ratio (M‐H, Random, 95% CI) | Subtotals only | |
| 4.1 Doxycycline vs bleomycin | 1 | 80 | Odds Ratio (M‐H, Random, 95% CI) | 0.69 [0.26, 1.87] |
| Outcome or subgroup title | No. of studies | No. of participants | Statistical method | Effect size |
| 1 Pleurodesis failure Show forest plot | 4 | 628 | Odds Ratio (M‐H, Random, 95% CI) | 0.74 [0.52, 1.04] |
| 1.1 Talc | 3 | 599 | Odds Ratio (M‐H, Random, 95% CI) | 0.76 [0.54, 1.09] |
| 1.2 Tetracycline | 1 | 29 | Odds Ratio (M‐H, Random, 95% CI) | 0.28 [0.04, 1.76] |
| Outcome or subgroup title | No. of studies | No. of participants | Statistical method | Effect size |
| 1 Pleurodesis failure Show forest plot | 3 | Odds Ratio (M‐H, Fixed, 95% CI) | Subtotals only | |
| 2 Mortality Show forest plot | 3 | Odds Ratio (M‐H, Random, 95% CI) | Subtotals only | |
| Outcome or subgroup title | No. of studies | No. of participants | Statistical method | Effect size |
| 1 Pleurodesis failure Show forest plot | 4 | Odds Ratio (M‐H, Random, 95% CI) | Subtotals only | |
| 1.1 OK‐432 and mitomycin C | 1 | 53 | Odds Ratio (M‐H, Random, 95% CI) | 0.26 [0.06, 1.11] |
| 1.2 OK‐432 vs cisplatin and etoposide | 1 | 67 | Odds Ratio (M‐H, Random, 95% CI) | 0.77 [0.26, 2.27] |
| 1.3 OK‐432 and cisplatin | 1 | 34 | Odds Ratio (M‐H, Random, 95% CI) | 0.48 [0.12, 1.92] |
| 1.4 High dose vs low dose | 1 | 38 | Odds Ratio (M‐H, Random, 95% CI) | 1.90 [0.38, 9.44] |
| 1.5 OK‐432 vs bleomycin | 1 | 68 | Odds Ratio (M‐H, Random, 95% CI) | 0.70 [0.24, 2.03] |
| 1.6 OK‐432 vs OK‐432 and cisplatin | 1 | 32 | Odds Ratio (M‐H, Random, 95% CI) | 12.44 [1.32, 117.03] |
| 2 Pain Show forest plot | 3 | Odds Ratio (M‐H, Random, 95% CI) | Subtotals only | |
| 2.1 OK‐432 vs cisplatin | 1 | 34 | Odds Ratio (M‐H, Random, 95% CI) | 6.67 [1.15, 38.60] |
| 2.2 OK‐432 vs OK‐432 and cisplatin | 1 | 32 | Odds Ratio (M‐H, Random, 95% CI) | 1.33 [0.33, 5.43] |
| 2.3 OK‐432 vs mitomycin C | 1 | 53 | Odds Ratio (M‐H, Random, 95% CI) | 1.04 [0.14, 8.00] |
| 2.4 OK‐432 vs bleomycin | 1 | 67 | Odds Ratio (M‐H, Random, 95% CI) | 2.53 [0.89, 7.15] |
| 2.5 OK‐432 vs cisplatin and etoposide | 1 | 66 | Odds Ratio (M‐H, Random, 95% CI) | 2.1 [0.73, 6.01] |
| 3 Fever Show forest plot | 3 | Odds Ratio (M‐H, Random, 95% CI) | Subtotals only | |
| 3.1 OK‐432 vs cisplatin | 1 | 34 | Odds Ratio (M‐H, Random, 95% CI) | 256.00 [14.70, 4457.27] |
| 3.2 OK‐432 vs OK‐432 and cisplatin | 1 | 32 | Odds Ratio (M‐H, Random, 95% CI) | 14.00 [1.46, 134.25] |
| 3.3 OK‐432 vs mitomycin C | 1 | 53 | Odds Ratio (M‐H, Random, 95% CI) | 26.67 [5.91, 120.42] |
| 3.4 OK‐432 vs bleomycin | 1 | 67 | Odds Ratio (M‐H, Random, 95% CI) | 1.43 [0.47, 4.35] |
| 3.5 OK‐432 vs cisplatin and etoposide | 1 | 66 | Odds Ratio (M‐H, Random, 95% CI) | 3.17 [1.08, 9.30] |
| 4 Mortality Show forest plot | 2 | Odds Ratio (M‐H, Random, 95% CI) | Subtotals only | |
| 4.1 OK‐432 vs cisplatin | 1 | 34 | Odds Ratio (M‐H, Random, 95% CI) | 1.31 [0.31, 5.53] |
| 4.2 OK‐432 vs combined OK‐432 and cisplatin | 1 | 32 | Odds Ratio (M‐H, Random, 95% CI) | 2.18 [0.44, 10.91] |
| 4.3 OK‐432 vs bleomycin | 1 | 68 | Odds Ratio (M‐H, Random, 95% CI) | 0.38 [0.14, 1.03] |
| 4.4 OK‐432 vs cisplatin and etoposide | 1 | 67 | Odds Ratio (M‐H, Random, 95% CI) | 0.84 [0.32, 2.18] |
| Outcome or subgroup title | No. of studies | No. of participants | Statistical method | Effect size |
| 1 Pain Show forest plot | 3 | 114 | Odds Ratio (M‐H, Random, 95% CI) | 4.56 [1.66, 12.52] |
| 1.1 Mepacrine vs bleomycin | 1 | 40 | Odds Ratio (M‐H, Random, 95% CI) | 2.15 [0.52, 9.00] |
| 1.2 Mepacrine vs tetracycline | 1 | 22 | Odds Ratio (M‐H, Random, 95% CI) | 5.6 [0.81, 38.51] |
| 1.3 Mepacrine vs placebo | 1 | 23 | Odds Ratio (M‐H, Random, 95% CI) | 14.53 [0.71, 298.21] |
| 1.4 Mepacrine vs triethylenethiophosphoramide | 1 | 29 | Odds Ratio (M‐H, Random, 95% CI) | 23.71 [1.19, 474.06] |
| 2 Fever Show forest plot | 3 | Odds Ratio (M‐H, Random, 95% CI) | Subtotals only | |
| 2.1 Mepacrine vs bleomycin | 1 | 40 | Odds Ratio (M‐H, Random, 95% CI) | 1.91 [0.52, 7.01] |
| 2.2 Mepacrine vs tetracycline | 1 | 22 | Odds Ratio (M‐H, Random, 95% CI) | 8.00 [1.13, 56.79] |
| 2.3 Mepacrine vs placebo | 1 | 23 | Odds Ratio (M‐H, Random, 95% CI) | 62.43 [2.85, 1365.52] |
| 2.4 Mepacrine vs triethylene... | 1 | 29 | Odds Ratio (M‐H, Random, 95% CI) | 23.83 [3.35, 169.39] |
| 3 Pleurodesis failure Show forest plot | 5 | Odds Ratio (M‐H, Random, 95% CI) | Subtotals only | |
| 3.1 Mepacrine vs talc slurry | 1 | 89 | Odds Ratio (M‐H, Random, 95% CI) | 2.08 [0.62, 6.96] |
| 3.2 Mepacrine vs bleomycin | 1 | 36 | Odds Ratio (M‐H, Random, 95% CI) | 0.16 [0.03, 0.89] |
| 3.3 Mepacrine vs tetracycline | 1 | 21 | Odds Ratio (M‐H, Random, 95% CI) | 0.63 [0.05, 8.20] |
| 3.4 Mepacrine vs placebo | 1 | 23 | Odds Ratio (M‐H, Random, 95% CI) | 0.07 [0.01, 0.73] |
| 3.5 Mepacrine vs mitoxantrone | 1 | 26 | Odds Ratio (M‐H, Random, 95% CI) | 7.61 [0.35, 163.82] |
| 3.6 Mepacrine vs triethylene... | 1 | 29 | Odds Ratio (M‐H, Random, 95% CI) | 0.20 [0.04, 0.98] |
| 4 Mortality Show forest plot | 2 | Odds Ratio (M‐H, Random, 95% CI) | Subtotals only | |
| 4.1 Mepacrine vs talc slurry | 1 | 89 | Odds Ratio (M‐H, Random, 95% CI) | 0.53 [0.20, 1.43] |
| 4.2 Mepacrine vs mitoxantrone | 1 | 28 | Odds Ratio (M‐H, Random, 95% CI) | 1.64 [0.23, 11.70] |
| Outcome or subgroup title | No. of studies | No. of participants | Statistical method | Effect size |
| 1 Pleurodesis failure Show forest plot | 1 | Odds Ratio (M‐H, Random, 95% CI) | Subtotals only | |
| 1.1 IFN vs bleomycin | 1 | 160 | Odds Ratio (M‐H, Random, 95% CI) | 3.25 [1.54, 6.89] |
| 2 Pain Show forest plot | 1 | 160 | Odds Ratio (M‐H, Random, 95% CI) | 0.03 [0.00, 0.53] |
| 3 Fever Show forest plot | 1 | 160 | Odds Ratio (M‐H, Random, 95% CI) | 0.01 [0.00, 0.11] |
| 4 Mortality Show forest plot | 1 | Odds Ratio (M‐H, Random, 95% CI) | Subtotals only | |
| Outcome or subgroup title | No. of studies | No. of participants | Statistical method | Effect size |
| 1 Pleurodesis failure Show forest plot | 1 | Odds Ratio (M‐H, Random, 95% CI) | Subtotals only | |
| 1.1 Triethylene... vs placebo | 1 | 24 | Odds Ratio (M‐H, Random, 95% CI) | 0.34 [0.03, 3.69] |
| 1.2 Triethylene... vs mepacrine | 1 | 29 | Odds Ratio (M‐H, Random, 95% CI) | 4.95 [1.02, 24.10] |
| 2 Pain Show forest plot | 1 | 53 | Odds Ratio (M‐H, Random, 95% CI) | 1.39 [0.10, 20.15] |
| 2.1 Triethylene... vs mepacrine | 1 | 29 | Odds Ratio (M‐H, Random, 95% CI) | 0.48 [0.10, 2.30] |
| 2.2 Triethylene... vs placebo | 1 | 24 | Odds Ratio (M‐H, Random, 95% CI) | 7.43 [0.35, 156.28] |
| 3 Fever Show forest plot | 1 | 53 | Odds Ratio (M‐H, Random, 95% CI) | 0.32 [0.00, 26.74] |
| 3.1 Triethylene... vs placebo | 1 | 24 | Odds Ratio (M‐H, Random, 95% CI) | 3.52 [0.15, 81.92] |
| 3.2 Triethylene... vs mepacrine | 1 | 29 | Odds Ratio (M‐H, Random, 95% CI) | 0.04 [0.01, 0.30] |
| Outcome or subgroup title | No. of studies | No. of participants | Statistical method | Effect size |
| 1 Pleurodesis failure Show forest plot | 2 | Odds Ratio (M‐H, Random, 95% CI) | Subtotals only | |
| 1.1 Adriamycin vs mustine | 1 | 20 | Odds Ratio (M‐H, Random, 95% CI) | 0.37 [0.01, 10.18] |
| 1.2 Adriamycin vs tetracycline | 1 | 21 | Odds Ratio (M‐H, Random, 95% CI) | 1.11 [0.06, 20.49] |
| 1.3 Adriamycin vs LC9018 and Adriamycin | 1 | 76 | Odds Ratio (M‐H, Random, 95% CI) | 4.29 [1.62, 11.35] |
| 2 Fever Show forest plot | 1 | Odds Ratio (M‐H, Random, 95% CI) | Subtotals only | |
| 3 Pain Show forest plot | 1 | Odds Ratio (M‐H, Random, 95% CI) | Subtotals only | |
| Outcome or subgroup title | No. of studies | No. of participants | Statistical method | Effect size |
| 1 Pleurodesis failure Show forest plot | 4 | Odds Ratio (M‐H, Random, 95% CI) | Subtotals only | |
| 1.1 Placebo vs mepacrine | 1 | 23 | Odds Ratio (M‐H, Random, 95% CI) | 14.40 [1.37, 150.81] |
| 1.2 Placebo vs mitoxantrone | 1 | 95 | Odds Ratio (M‐H, Random, 95% CI) | 1.33 [0.56, 3.17] |
| 1.3 Placebo vs triethylene... | 1 | 24 | Odds Ratio (M‐H, Random, 95% CI) | 2.91 [0.27, 31.21] |
| 1.4 Placebo vs talc slurry | 1 | 21 | Odds Ratio (M‐H, Random, 95% CI) | 13.93 [0.66, 293.99] |
| 1.5 Placebo vs tetracycline | 1 | 20 | Odds Ratio (M‐H, Random, 95% CI) | 3.33 [0.51, 21.58] |
| 2 Pain Show forest plot | 3 | 100 | Odds Ratio (M‐H, Random, 95% CI) | 0.10 [0.01, 0.82] |
| 2.1 Placebo vs talc slurry | 1 | 31 | Odds Ratio (M‐H, Random, 95% CI) | 0.0 [0.0, 0.0] |
| 2.2 Placebo vs tetracycline | 1 | 22 | Odds Ratio (M‐H, Random, 95% CI) | 0.0 [0.0, 0.0] |
| 2.3 Placebo vs mepacrine | 1 | 23 | Odds Ratio (M‐H, Random, 95% CI) | 0.07 [0.00, 1.41] |
| 2.4 Placebo vs triethylene... | 1 | 24 | Odds Ratio (M‐H, Random, 95% CI) | 0.13 [0.01, 2.83] |
| 3 Fever Show forest plot | 2 | Odds Ratio (M‐H, Random, 95% CI) | Subtotals only | |
| 3.1 Placebo vs mepacrine | 1 | 95 | Odds Ratio (M‐H, Random, 95% CI) | 0.31 [0.12, 0.79] |
| 3.2 Placebo vs mitoxantone | 1 | 23 | Odds Ratio (M‐H, Random, 95% CI) | 0.02 [0.00, 0.35] |
| 3.3 Placebo vs triethylene... | 1 | 24 | Odds Ratio (M‐H, Random, 95% CI) | 0.28 [0.01, 6.62] |
| Outcome or subgroup title | No. of studies | No. of participants | Statistical method | Effect size |
| 1 Pleurodesis failure Show forest plot | 4 | Odds Ratio (M‐H, Random, 95% CI) | Subtotals only | |
| 1.1 Mustine vs tetracycline | 2 | 59 | Odds Ratio (M‐H, Random, 95% CI) | 2.72 [0.74, 9.98] |
| 1.2 Mustine vs talc poudrage | 1 | 37 | Odds Ratio (M‐H, Random, 95% CI) | 8.00 [1.40, 45.76] |
| 1.3 Mustine vs C. parvum | 1 | 31 | Odds Ratio (M‐H, Random, 95% CI) | 10.8 [1.64, 70.93] |
| 1.4 Mustine vs Adriamycin | 1 | 20 | Odds Ratio (M‐H, Random, 95% CI) | 2.71 [0.10, 74.98] |
| 2 Fever Show forest plot | 2 | Odds Ratio (M‐H, Random, 95% CI) | Subtotals only | |
| 2.1 Mustine vs tetracycline | 1 | 40 | Odds Ratio (M‐H, Random, 95% CI) | 0.0 [0.0, 0.0] |
| 2.2 Mustine vs C. parvum | 1 | 21 | Odds Ratio (M‐H, Random, 95% CI) | 0.23 [0.01, 6.25] |
| 3 Mortality Show forest plot | 2 | Odds Ratio (M‐H, Random, 95% CI) | Subtotals only | |
| 3.1 Mustine vs talc poudrage | 1 | 46 | Odds Ratio (M‐H, Random, 95% CI) | 2.35 [0.51, 10.86] |
| 3.2 Mustine vs C. parvum | 1 | 21 | Odds Ratio (M‐H, Random, 95% CI) | 2.4 [0.38, 15.32] |
| 4 Pain Show forest plot | 1 | Odds Ratio (M‐H, Random, 95% CI) | Subtotals only | |
| Outcome or subgroup title | No. of studies | No. of participants | Statistical method | Effect size |
| 1 Pleurodesis failure Show forest plot | 3 | Odds Ratio (M‐H, Random, 95% CI) | Subtotals only | |
| 1.1 Mitoxantrone vs placebo | 1 | 95 | Odds Ratio (M‐H, Random, 95% CI) | 0.75 [0.32, 1.79] |
| 1.2 Mitoxantrone vs mepacrine | 1 | 26 | Odds Ratio (M‐H, Random, 95% CI) | 7.61 [0.35, 163.82] |
| 1.3 Mitoxantrone vs bleomycin | 1 | 85 | Odds Ratio (M‐H, Random, 95% CI) | 3.18 [1.17, 8.65] |
| 2 Pain Show forest plot | 1 | 96 | Odds Ratio (M‐H, Random, 95% CI) | 2.08 [0.64, 6.76] |
| 3 Fever Show forest plot | 2 | Odds Ratio (M‐H, Random, 95% CI) | Subtotals only | |
| 3.1 Mitoxantrone vs bleomycin | 1 | 96 | Odds Ratio (M‐H, Random, 95% CI) | 0.90 [0.30, 2.71] |
| 3.2 Mitoxantrone vs placebo | 1 | 95 | Odds Ratio (M‐H, Random, 95% CI) | 3.28 [1.26, 8.49] |
| 4 Mortality Show forest plot | 2 | Odds Ratio (M‐H, Random, 95% CI) | Subtotals only | |
| 4.1 Mitoxantrone vs bleomycin | 1 | 96 | Odds Ratio (M‐H, Random, 95% CI) | 0.47 [0.21, 1.05] |
| 4.2 Mitoxantrone vs mepacrine | 1 | 28 | Odds Ratio (M‐H, Random, 95% CI) | 0.61 [0.09, 4.37] |
| Outcome or subgroup title | No. of studies | No. of participants | Statistical method | Effect size |
| 1 Pleurodesis failure Show forest plot | 1 | 18 | Odds Ratio (M‐H, Random, 95% CI) | 0.57 [0.07, 4.64] |
| 2 Pain Show forest plot | 1 | Odds Ratio (M‐H, Random, 95% CI) | Subtotals only | |
| 3 Mortality Show forest plot | 1 | Odds Ratio (M‐H, Random, 95% CI) | Subtotals only | |
| Outcome or subgroup title | No. of studies | No. of participants | Statistical method | Effect size |
| 1 Pleurodesis failure Show forest plot | 1 | 87 | Odds Ratio (M‐H, Random, 95% CI) | 0.43 [0.14, 1.30] |
| 2 Mortality Show forest plot | 1 | Odds Ratio (M‐H, Random, 95% CI) | Subtotals only | |
| Outcome or subgroup title | No. of studies | No. of participants | Statistical method | Effect size |
| 1 Pleurodesis failure Show forest plot | 4 | 205 | Odds Ratio (M‐H, Random, 95% CI) | 1.26 [0.70, 2.30] |
| 1.1 Rotation vs no rotation | 1 | 20 | Odds Ratio (M‐H, Random, 95% CI) | 2.25 [0.17, 29.77] |
| 1.2 Streptokinase vs no streptokinase | 1 | 35 | Odds Ratio (M‐H, Random, 95% CI) | 2.18 [0.53, 9.02] |
| 1.3 Mixed particle talc vs graded talc | 1 | 28 | Odds Ratio (M‐H, Random, 95% CI) | 1.64 [0.23, 11.70] |
| 1.4 Talc pleurodesis vs VATS parietal pleurectomy | 1 | 122 | Odds Ratio (M‐H, Random, 95% CI) | 1.01 [0.49, 2.09] |
| 2 Pain Show forest plot | 1 | Odds Ratio (M‐H, Random, 95% CI) | Subtotals only | |
| 2.1 Streptokinase vs control | 1 | 47 | Odds Ratio (M‐H, Random, 95% CI) | 3.0 [0.12, 77.47] |
| 3 Fever Show forest plot | 1 | Odds Ratio (M‐H, Random, 95% CI) | Subtotals only | |
| 3.1 Mixed particle talc vs graded talc | 1 | 46 | Odds Ratio (M‐H, Random, 95% CI) | 15.92 [1.81, 140.16] |
| 4 Mortality Show forest plot | 2 | Odds Ratio (M‐H, Random, 95% CI) | Subtotals only | |
| 4.1 Mixed particle talc vs graded talc | 1 | 43 | Odds Ratio (M‐H, Random, 95% CI) | 0.88 [0.25, 3.07] |
| 4.2 Talc pleurodesis vs VATS partial pleurectomy | 1 | 175 | Odds Ratio (M‐H, Random, 95% CI) | 0.92 [0.45, 1.90] |
| Outcome or subgroup title | No. of studies | No. of participants | Statistical method | Effect size |
| 1 Pleurodesis failure Show forest plot | 1 | Odds Ratio (M‐H, Random, 95% CI) | Subtotals only | |
| 2 Fever Show forest plot | 1 | Odds Ratio (M‐H, Random, 95% CI) | Subtotals only | |
| Outcome or subgroup title | No. of studies | No. of participants | Statistical method | Effect size |
| 1 Pleurodesis failure Show forest plot | 3 | Odds Ratio (M‐H, Random, 95% CI) | Subtotals only | |
| 1.1 Cisplatin vs cisplatin and bevacizumab | 1 | 70 | Odds Ratio (M‐H, Random, 95% CI) | 5.0 [1.66, 15.09] |
| 1.2 Cisplatin vs OK‐432 | 1 | 34 | Odds Ratio (M‐H, Random, 95% CI) | 2.06 [0.52, 8.17] |
| 1.3 Cisplatin vs OK‐432 and cisplatin | 1 | 32 | Odds Ratio (M‐H, Random, 95% CI) | 25.67 [2.68, 245.84] |
| 1.4 Cisplatin vs rAd‐p53 and cisplatin | 1 | 35 | Odds Ratio (M‐H, Random, 95% CI) | 4.67 [0.99, 22.03] |
| 2 Pain Show forest plot | 1 | Odds Ratio (M‐H, Random, 95% CI) | Subtotals only | |
| 2.1 Cisplatin vs OK‐432 | 1 | 34 | Odds Ratio (M‐H, Random, 95% CI) | 0.15 [0.03, 0.87] |
| 2.2 Cisplatin vs OK‐432 and cisplatin | 1 | 32 | Odds Ratio (M‐H, Random, 95% CI) | 0.2 [0.03, 1.21] |
| 3 Fever Show forest plot | 2 | Odds Ratio (M‐H, Random, 95% CI) | Subtotals only | |
| 3.1 Cisplatin vs OK‐432 | 1 | 34 | Odds Ratio (M‐H, Random, 95% CI) | 0.00 [0.00, 0.07] |
| 3.2 Cisplatin vs OK‐432 and cisplatin | 1 | 32 | Odds Ratio (M‐H, Random, 95% CI) | 0.05 [0.01, 0.52] |
| 3.3 Cisplatin vs rAd‐p53 and cisplatin | 1 | 35 | Odds Ratio (M‐H, Random, 95% CI) | 0.09 [0.02, 0.51] |
| 4 Mortality Show forest plot | 2 | Odds Ratio (M‐H, Random, 95% CI) | Subtotals only | |
| 4.1 Cisplatin vs OK‐432 | 1 | 34 | Odds Ratio (M‐H, Random, 95% CI) | 0.76 [0.18, 3.23] |
| 4.2 Cisplatin vs combination OK‐432 and cisplatin | 1 | 32 | Odds Ratio (M‐H, Random, 95% CI) | 1.67 [0.32, 8.59] |
| 4.3 Cisplatin vs combination rAd‐p53 and cisplatin | 1 | 35 | Odds Ratio (M‐H, Random, 95% CI) | 0.0 [0.0, 0.0] |
| Outcome or subgroup title | No. of studies | No. of participants | Statistical method | Effect size |
| 1 Pleurodesis failure Show forest plot | 1 | 79 | Odds Ratio (M‐H, Random, 95% CI) | 0.79 [0.22, 2.82] |
| Outcome or subgroup title | No. of studies | No. of participants | Statistical method | Effect size |
| 1 Pleurodesis failure Show forest plot | 1 | Odds Ratio (M‐H, Random, 95% CI) | Subtotals only | |
| 1.1 Silver nitrate 90 mg vs 150 mg | 1 | 40 | Odds Ratio (M‐H, Random, 95% CI) | 0.0 [0.0, 0.0] |
| 1.2 Silver nitrate 90 mg vs 180 mg | 1 | 40 | Odds Ratio (M‐H, Random, 95% CI) | 0.18 [0.01, 4.01] |
| 1.3 Silver nitrate 150 mg vs 180 mg | 1 | 40 | Odds Ratio (M‐H, Random, 95% CI) | 0.18 [0.01, 4.01] |
| 2 Mortality Show forest plot | 1 | Odds Ratio (M‐H, Random, 95% CI) | Subtotals only | |
| 2.1 Silver nitrate 90 mg vs 150 mg | 1 | 39 | Odds Ratio (M‐H, Random, 95% CI) | 3.18 [0.30, 33.58] |
| 2.2 Silver nitrate 90 mg vs 180 mg | 1 | 39 | Odds Ratio (M‐H, Random, 95% CI) | 7.80 [0.38, 161.87] |
| 2.3 Silver nitrate 150 mg vs 180 mg | 1 | 38 | Odds Ratio (M‐H, Random, 95% CI) | 3.16 [0.12, 82.64] |
| 3 Pain Show forest plot | 1 | Odds Ratio (M‐H, Random, 95% CI) | Subtotals only | |
| 3.1 Silver nitrate 90 mg vs 150 mg | 1 | 40 | Odds Ratio (M‐H, Random, 95% CI) | 1.0 [0.13, 7.89] |
| 3.2 Silver nitrate 90 mg vs 180 mg | 1 | 40 | Odds Ratio (M‐H, Random, 95% CI) | 1.0 [0.13, 7.89] |
| 3.3 Silver nitrate 150 mg vs 180 mg | 1 | 40 | Odds Ratio (M‐H, Random, 95% CI) | 1.0 [0.13, 7.89] |
| 4 Fever Show forest plot | 1 | Odds Ratio (M‐H, Random, 95% CI) | Subtotals only | |
| 4.1 Silver nitrate 90 mg vs 150 mg | 1 | 40 | Odds Ratio (M‐H, Random, 95% CI) | 0.63 [0.09, 4.24] |
| 4.2 Silver nitrate 90 mg vs 180 mg | 1 | 40 | Odds Ratio (M‐H, Random, 95% CI) | 1.0 [0.13, 7.89] |
| 4.3 Silver nitrate 150 mg vs 180 mg | 1 | 40 | Odds Ratio (M‐H, Random, 95% CI) | 1.59 [0.24, 10.70] |