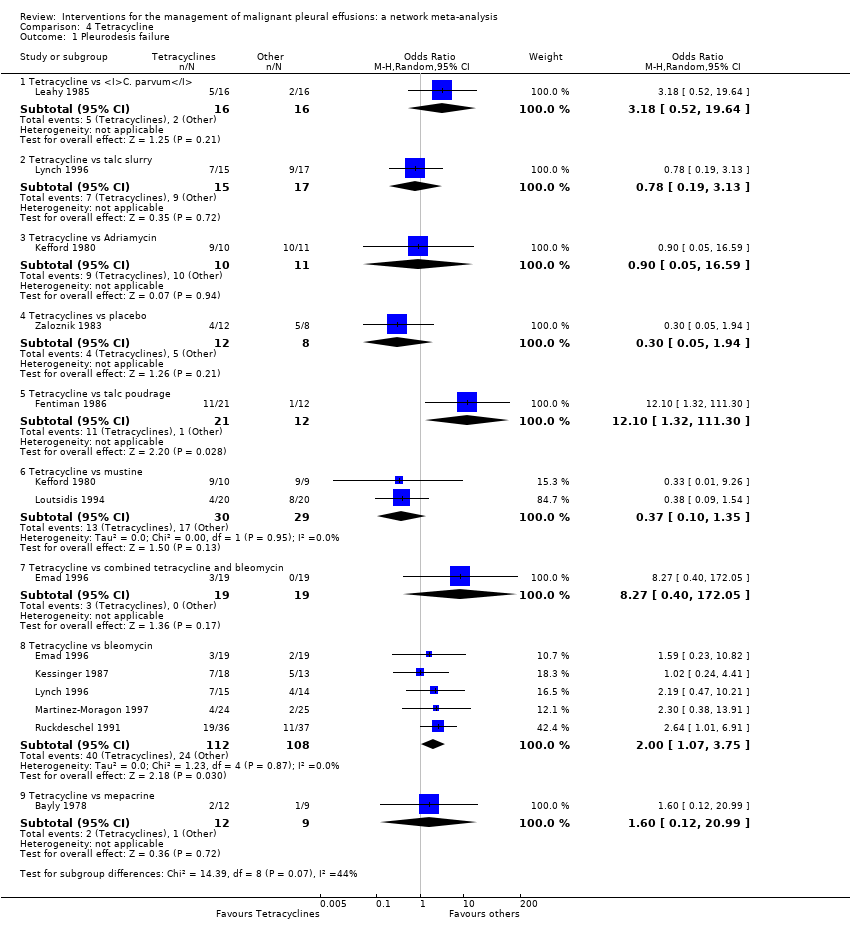
| 1 Pleurodesis failure Show forest plot | 21 | | Odds Ratio (M‐H, Random, 95% CI) | Subtotals only |
|
| 1.1 Bleomycin vs iodine | 1 | 39 | Odds Ratio (M‐H, Random, 95% CI) | 0.8 [0.18, 3.57] |
| 1.2 Bleomycin vs talc slurry | 5 | 199 | Odds Ratio (M‐H, Random, 95% CI) | 1.22 [0.55, 2.70] |
| 1.3 Bleomycin vs tetracycline | 5 | 220 | Odds Ratio (M‐H, Random, 95% CI) | 0.50 [0.27, 0.93] |
| 1.4 Bleomycin vs talc poudrage | 2 | 57 | Odds Ratio (M‐H, Random, 95% CI) | 9.70 [2.10, 44.78] |
| 1.5 Bleomycin vs C. parvum | 2 | 78 | Odds Ratio (M‐H, Random, 95% CI) | 1.81 [0.02, 189.25] |
| 1.6 Bleomycin vs doxycycline | 2 | 122 | Odds Ratio (M‐H, Random, 95% CI) | 1.50 [0.54, 4.20] |
| 1.7 Bleomycin vs IFN | 1 | 160 | Odds Ratio (M‐H, Random, 95% CI) | 0.31 [0.15, 0.65] |
| 1.8 Bleomycin vs mitoxantrone | 1 | 85 | Odds Ratio (M‐H, Random, 95% CI) | 0.31 [0.12, 0.86] |
| 1.9 Bleomycin vs mepacrine | 1 | 36 | Odds Ratio (M‐H, Random, 95% CI) | 6.40 [1.12, 36.44] |
| 1.10 Bleomycin vs combined tetracycline and bleomycin | 1 | 38 | Odds Ratio (M‐H, Random, 95% CI) | 5.57 [0.25, 124.19] |
| 1.11 Bleomycin vs cisplatin and etoposide | 1 | 69 | Odds Ratio (M‐H, Random, 95% CI) | 1.1 [0.39, 3.07] |
| 1.12 Bleomycin vs OK‐432 | 1 | 68 | Odds Ratio (M‐H, Random, 95% CI) | 1.43 [0.49, 4.17] |
| 1.13 Bleomycin vs viscum | 1 | 17 | Odds Ratio (M‐H, Random, 95% CI) | 5.33 [0.62, 45.99] |
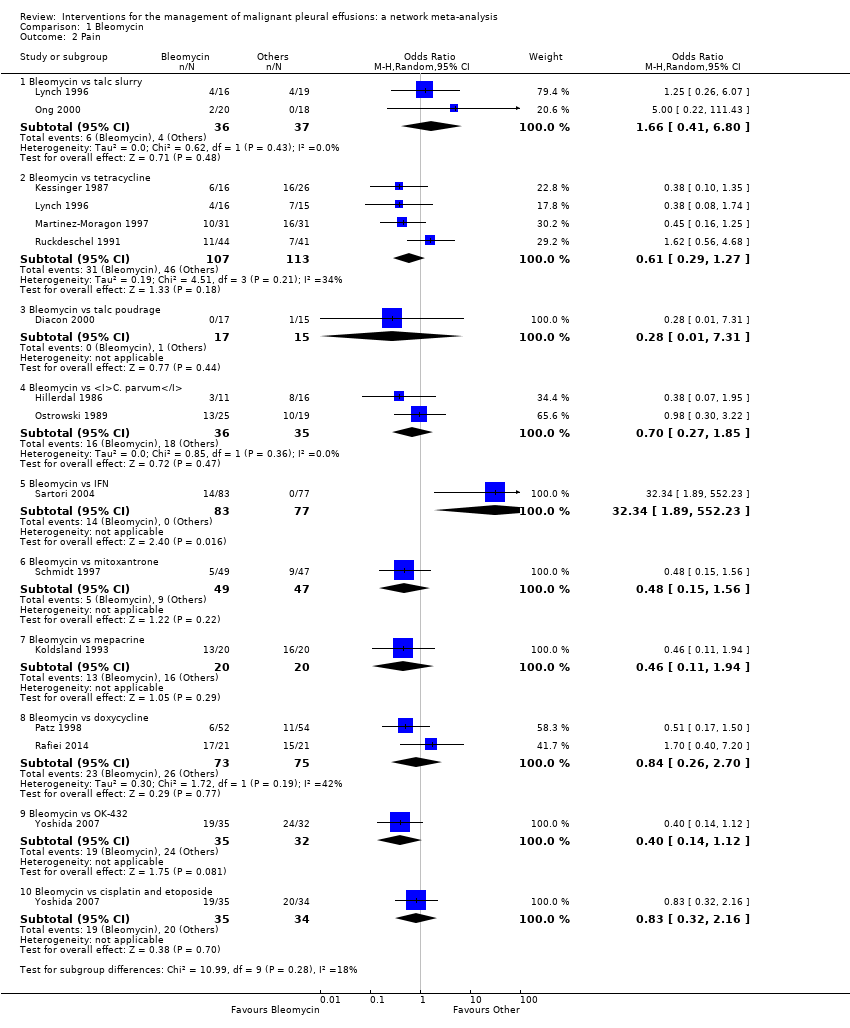
| 2 Pain Show forest plot | 14 | | Odds Ratio (M‐H, Random, 95% CI) | Subtotals only |
|
| 2.1 Bleomycin vs talc slurry | 2 | 73 | Odds Ratio (M‐H, Random, 95% CI) | 1.66 [0.41, 6.80] |
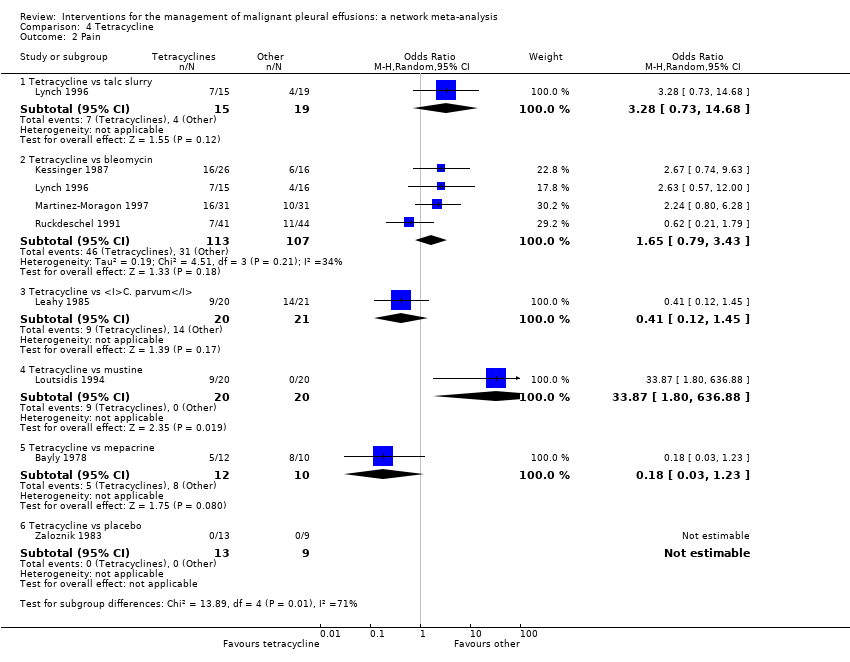
| 2.2 Bleomycin vs tetracycline | 4 | 220 | Odds Ratio (M‐H, Random, 95% CI) | 0.61 [0.29, 1.27] |
| 2.3 Bleomycin vs talc poudrage | 1 | 32 | Odds Ratio (M‐H, Random, 95% CI) | 0.28 [0.01, 7.31] |
| 2.4 Bleomycin vs C. parvum | 2 | 71 | Odds Ratio (M‐H, Random, 95% CI) | 0.70 [0.27, 1.85] |
| 2.5 Bleomycin vs IFN | 1 | 160 | Odds Ratio (M‐H, Random, 95% CI) | 32.34 [1.89, 552.23] |
| 2.6 Bleomycin vs mitoxantrone | 1 | 96 | Odds Ratio (M‐H, Random, 95% CI) | 0.48 [0.15, 1.56] |
| 2.7 Bleomycin vs mepacrine | 1 | 40 | Odds Ratio (M‐H, Random, 95% CI) | 0.46 [0.11, 1.94] |
| 2.8 Bleomycin vs doxycycline | 2 | 148 | Odds Ratio (M‐H, Random, 95% CI) | 0.84 [0.26, 2.70] |
| 2.9 Bleomycin vs OK‐432 | 1 | 67 | Odds Ratio (M‐H, Random, 95% CI) | 0.40 [0.14, 1.12] |
| 2.10 Bleomycin vs cisplatin and etoposide | 1 | 69 | Odds Ratio (M‐H, Random, 95% CI) | 0.83 [0.32, 2.16] |
| 3 Mortality Show forest plot | 11 | | Odds Ratio (M‐H, Random, 95% CI) | Subtotals only |
|
| 3.1 Bleomycin vs combined tetracycline and bleomycin | 1 | 40 | Odds Ratio (M‐H, Random, 95% CI) | 1.0 [0.06, 17.18] |
| 3.2 Bleomycin vs talc slurry | 2 | 116 | Odds Ratio (M‐H, Random, 95% CI) | 0.89 [0.29, 2.75] |
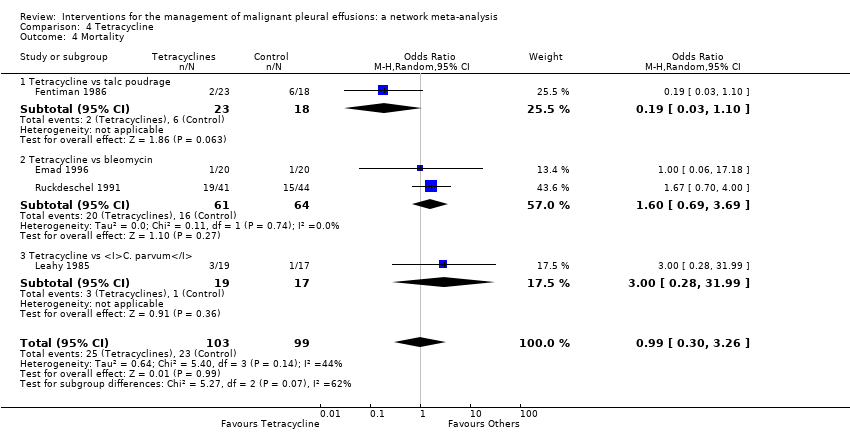
| 3.3 Bleomycin vs tetracycline | 2 | 125 | Odds Ratio (M‐H, Random, 95% CI) | 0.63 [0.27, 1.44] |
| 3.4 Bleomycin vs talc poudrage | 1 | 32 | Odds Ratio (M‐H, Random, 95% CI) | 0.82 [0.20, 3.43] |
| 3.5 Bleomycin vs C. parvum | 1 | 55 | Odds Ratio (M‐H, Random, 95% CI) | 0.60 [0.19, 1.94] |
| 3.6 Bleomycin vs IFN | 1 | 160 | Odds Ratio (M‐H, Random, 95% CI) | 0.46 [0.25, 0.87] |
| 3.7 Bleomycin vs mitoxantrone | 1 | 96 | Odds Ratio (M‐H, Random, 95% CI) | 2.15 [0.95, 4.86] |
| 3.8 Bleomycin vs OK‐432 | 1 | 68 | Odds Ratio (M‐H, Random, 95% CI) | 2.66 [0.98, 7.23] |
| 3.9 Bleomycin vs doxycycline | 2 | 122 | Odds Ratio (M‐H, Random, 95% CI) | 1.44 [0.53, 3.90] |
| 3.10 Bleomycin vs cisplatin and etoposide | 1 | 69 | Odds Ratio (M‐H, Random, 95% CI) | 2.22 [0.82, 6.01] |
| 4 Fever Show forest plot | 16 | | Odds Ratio (M‐H, Random, 95% CI) | Subtotals only |
|
| 4.1 Bleomycin vs talc Slurry | 3 | 99 | Odds Ratio (M‐H, Random, 95% CI) | 0.90 [0.31, 2.56] |
| 4.2 Bleomycin vs talc poudrage | 1 | 32 | Odds Ratio (M‐H, Random, 95% CI) | 0.87 [0.11, 7.05] |
| 4.3 Bleomycin vs tetracycline | 5 | 250 | Odds Ratio (M‐H, Random, 95% CI) | 2.05 [0.67, 6.34] |
| 4.4 Tetracycline vs C. parvum | 2 | 80 | Odds Ratio (M‐H, Random, 95% CI) | 0.43 [0.17, 1.12] |
| 4.5 Bleomycin vs IFN | 1 | 160 | Odds Ratio (M‐H, Random, 95% CI) | 151.35 [9.08, 2522.62] |
| 4.6 Bleomycin vs mitoxantrone | 1 | 96 | Odds Ratio (M‐H, Random, 95% CI) | 1.11 [0.37, 3.36] |
| 4.7 Bleomycin vs mepacrine | 1 | 40 | Odds Ratio (M‐H, Random, 95% CI) | 0.52 [0.14, 1.92] |
| 4.8 Bleomycin vs doxycycline | 2 | 148 | Odds Ratio (M‐H, Random, 95% CI) | 2.69 [0.08, 89.51] |
| 4.9 Bleomycin vs combined tetracycline and bleomycin | 1 | 40 | Odds Ratio (M‐H, Random, 95% CI) | 0.47 [0.04, 5.69] |
| 4.10 Bleomycin vs OK432 | 1 | 67 | Odds Ratio (M‐H, Random, 95% CI) | 0.7 [0.23, 2.13] |
| 4.11 Bleomycin vs cisplatin and etoposide | 1 | 69 | Odds Ratio (M‐H, Random, 95% CI) | 2.22 [0.82, 6.01] |