Intervenciones para el tratamiento de los derrames pleurales malignos: un metanálisis en red
Resumen
Antecedentes
El derrame pleural maligno (DPM) es una afección frecuente en los pacientes con cáncer ocasionada por la infiltración maligna de la pleura. Se suele asociar con disnea importante. Existen varias opciones de tratamiento disponibles para tratar la acumulación descontrolada de líquido pleural, incluida la administración de un agente de pleurodesis (ya sea a través de una sonda torácica o durante una toracoscopia) o la inserción de un drenaje pleural permanente.
Objetivos
Garantizar la estrategia de tratamiento óptima en adultos con derrame pleural maligno en función de una pleurodesis exitosa. Además, cuantificar las diferencias en los resultados informados por el paciente y los efectos adversos entre las estrategias de tratamiento.
Métodos de búsqueda
Se hicieron búsquedas en el Registro Cochrane Central de Ensayos Controlados (Cochrane Central Register of Controlled Trials) (CENTRAL), Ovid MEDLINE, Ovid EMBASE; EBSCO CINAHL; SCI‐EXPANDED y en SSCI (ISI Web of Science) hasta abril 2015.
Criterios de selección
Se incluyeron en la revisión los ensayos controlados aleatorios de intervenciones intrapleurales para adultos con DPM sintomático.
Obtención y análisis de los datos
Dos revisores extrajeron los datos, de manera independiente, sobre el diseño del estudio, las características del estudio, las medidas de resultado, los posibles modificadores del efecto y el riesgo de sesgo.
La medida de resultado primaria fue la tasa de fracaso de la pleurodesis. Las medidas de resultado secundarias fueron los efectos adversos y las complicaciones, el control de la disnea informado por el paciente, la calidad de vida, el costo, la mortalidad, la duración de la hospitalización y la aceptabilidad del paciente.
Se realizó un metanálisis en red con efectos aleatorios para analizar los datos del resultado primario y los resultados secundarios con una cantidad suficiente de datos. También se realizaron metanálisis de efectos aleatorios por pares con los datos de comparación directa. Si se consideró que las intervenciones no eran libremente asignadas al azar, o si los datos disponibles no eran suficientes, los resultados se informaron en una síntesis narrativa. Se realizaron análisis de sensibilidad para investigar la heterogeneidad y evaluar solo los agentes de pleurodesis administrados a través de una sonda torácica junto al enfermo.
Resultados principales
De los 1888 registros identificados, 62 ensayos aleatorios, con un total de 3428 pacientes, fueron elegibles para la inclusión. Todos los estudios tenían un riesgo de sesgo alto o incierto respecto de al menos un dominio.
El metanálisis en red que evaluó la tasa de fracaso de la pleurodesis indicó que el talco pulverizado era un método muy efectivo (ocupó el segundo lugar de 16 [intervalo de confianza del 95%: 1 a 5]) y proporcionó pruebas de que provocó menos fracasos de la pleurodesis que otros ocho métodos. Las posiciones estimadas de otros agentes de uso frecuente eran las siguientes: suspensión de talco (cuarto; IC del 95%: 2 a 8), mepacrina (cuarto; IC del 95%: 1 a 10), yodo (quinto; IC del 95%: 1 a 12), bleomicina (octavo; IC del 95%: 5 a 11) y doxiciclina (décimo; IC del 95%: 4 a 15). Las estimaciones eran imprecisas, como pudo observarse en los amplios intervalos de confianza y en las altas heterogeneidades estadística y clínica.
La mayoría de las medidas de resultado secundarias, incluidos los eventos adversos, fueron informadas de manera desigual por los estudios incluidos y los métodos utilizados para describirlas difirieron mucho. En consecuencia, en esta revisión la mayoría de las medidas de resultado secundarias se informaron de manera descriptiva. Se obtuvieron suficientes datos para realizar un metanálisis en red de los eventos adversos informados con mayor frecuencia: dolor, fiebre y mortalidad. La red de la fiebre fue poco precisa y exhibió una heterogeneidad significativa, aunque sugirió que el placebo causó la cantidad más baja de fiebre (ocupó el primer lugar de 11 [IC del 95%: 1 a 7]) y la mepacrina y el Corynebacterium parvum (C. parvum) parecían relacionarse con la cantidad más alta de fiebre (ocuparon los lugares décimo [IC del 95%: 6 a 11] y undécimo [IC del 95%: 7 a 11], respectivamente). El metanálisis en red no reveló diferencias entre las intervenciones respecto de los datos de dolor. La única posible diferencia de mortalidad identificada en la red de mortalidad fue que quienes se trataron con tetraciclina parecían tener una mayor supervivencia que los tratados con mitoxantrona (OR 0,16 [intervalo de confianza del 95%: 0,03 a 0,72]). Dos estudios aleatorios investigaron los drenajes pleurales permanentes y ambos informaron una mejoría en la disnea en comparación con la pleurodesis con suspensión de talco, a pesar de las menores tasas de éxito de la pleurodesis.
El riesgo de sesgo en una cantidad de estudios incluidos fue significativo; por ejemplo, la gran mayoría de los estudios fueron desenmascarados y con frecuencia los métodos usados para la generación de la secuencia y la ocultación de la asignación eran inciertos. Sin embargo, en general el riesgo de sesgo de todos los estudios fue moderado. No se informó la calidad de las pruebas GRADE de los resultados, ya que la función de la GRADE no está bien establecida en el contexto del metanálisis en Red (NMA, por sus siglas en inglés).
Conclusiones de los autores
En función de las pruebas disponibles, el talco pulverizado es un método de pleurodesis más efectivo en el DPM que muchos otros métodos de uso frecuente, incluida la tetraciclina y la bleomicina. Sin embargo, se necesitan más datos para confirmar en forma definitiva si es más efectivo que ciertas intervenciones de uso frecuente como la suspensión de talco y la doxiciclina, sobre todo en vista de la alta heterogeneidad estadística y clínica dentro de la red y el elevado riesgo de sesgo de varios de los estudios incluidos. Sobre la base de la potencia de las pruebas, tanto de comparaciones directas como indirectas de datos aleatorios de esclerosantes administrados junto al paciente, no hay pruebas que indiquen grandes diferencias entre los otros métodos muy efectivos (suspensión de talco, mepacrina, yodo y C. parvum). Sin embargo, la disponibilidad local, la experiencia global de estos agentes y sus eventos adversos, que tal vez no hayan sido identificados en los ensayos aleatorios, también deben tenerse en cuenta a la hora de elegir un esclerosante. Se necesita una mayor investigación para definir los roles de los diferentes tratamientos según las características del paciente (p.ej., según el pronóstico o la presencia de atrapamiento pulmonar) e investigar, en más detalle, los resultados centrados en el paciente, como la disnea y la calidad de vida. En los futuros diseños de los ensayos resultará fundamental prestar mucha atención en la minimización del riesgo de sesgo y la estandarización de las medidas de resultado.
PICO
Resumen en términos sencillos
Intervenciones para el tratamiento del líquido que rodea los pulmones (líquido pleural) producido por el cáncer
Se evaluaron las pruebas sobre la efectividad de diferentes métodos para tratar los líquidos que rodean el pulmón en pacientes con una acumulación de líquido provocada por el cáncer.
El derrame pleural maligno (DPM) es una afección a través de la cual el cáncer del revestimiento pulmonar produce una acumulación de líquidos en el espacio entre el pulmón y la caja torácica (cavidad pleural), y suele manifestarse como disnea. Las opciones de tratamiento incluyen la eliminación del líquido ya sea con drenaje torácico temporal, una exploración endoscópica de la cavidad pleural (toracoscopia) o un drenaje torácico semipermanente tunelizado debajo de la piel (una sonda pleural permanente). También puede recurrirse a la introducción de un producto químico en la cavidad pleural para prevenir que vuelva a llenarse de líquido (pleurodesis). Se trató de hallar cuál método era más efectivo en cuanto a la prevención de la acumulación de líquido y cuál era el mejor en cuanto a los efectos secundarios y los resultados informados por el paciente como dolor, fiebre, disnea y calidad de vida.
Se realizaron búsquedas en bases de datos de ensayos que compararon diferentes intervenciones en adultos con DPM sintomático hasta abril de 2015, escritos en cualquier idioma. Ya que solo estábamos interesados en investigaciones realizadas con rigurosidad, se restringió la búsqueda a los ensayos controlados aleatorios (en los que los participantes se asignaron al azar a los métodos analizados). La mayor parte de los datos se analizó con una técnica denominada "metanálisis en red" que permite que en un solo análisis se comparen muchas intervenciones diferentes. Este análisis categoriza las intervenciones según el orden de su efectividad.
Se encontraron 62 estudios con 3428 pacientes.
En el metanálisis en red, la utilización de la toracoscopia para eliminar el líquido y esparcir talco en la cavidad pleural (talco pulverizado) parecía ser más efectiva para prevenir la acumulación de líquido que varios otros métodos utilizados con frecuencia. Sin embargo, no se pudo afirmar con certeza que sea mejor que otros métodos como la administración de talco o doxiciclina a través de un drenaje pleural.
Los efectos secundarios, la calidad de vida y la satisfacción del paciente fueron informados de manera desigual en los estudios incluidos, aunque son factores importantes a tener en cuenta para elegir la mejor estrategia de tratamiento para el paciente. Hubo suficientes datos para realizar el metanálisis en red para el dolor, la fiebre y la mortalidad. El placebo provocó la fiebre más baja mientras que Corynebacterium parvum (C. parvum) y la mepacrina podrían provocar la fiebre más alta. No se encontraron diferencias entre el dolor causado por las intervenciones evaluadas. Solo una comparación demostró una posible diferencia, la cual reveló que quienes se trataron con tetraciclina podrían vivir más tiempo que los tratados con mitoxantrona. Como solo se evaluaron ensayos controlados aleatorios, es posible que esta revisión no haya identificado ciertos perjuicios de los tratamientos.
Muchos de los estudios eran de baja calidad y las características de los estudios individuales diferían bastante entre ellos. El riesgo de sesgo elevado dificulta la extracción de conclusiones definitivas.
Las pruebas disponibles revelan que el talco pulverizado puede detener la acumulación de líquidos. Sin embargo, no podemos garantizar que este sea definitivamente el mejor método y, por tanto, se necesita una mayor investigación. También es importante tener en cuenta la experiencia global de estos agentes y la información sobre su seguridad y efectos secundarios a la hora de elegir el método de pleurodesis más adecuado. Los drenajes pleurales permanentes pueden ayudar a aliviar la disnea, aunque podrían ser menos efectivos para evitar el retorno de los líquidos.
También se necesita mayor investigación en grupos específicos de pacientes, así como una evaluación más detallada de los resultados centrados en el paciente como la disnea y la calidad de vida. Lo ideal sería tener una comprensión más cabal de los posibles perjuicios de los tratamientos, desde la perspectiva de los pacientes.
Conclusiones de los autores
Antecedentes
El derrame pleural maligno (DPM) es una afección clínica frecuente, con una incidencia anual estimada de al menos 150 000 pacientes, solamente en los EE. UU. (American Thoracic Society 2000). El 15% de las personas con diagnóstico de cáncer presentará derrame pleural durante la evolución de la enfermedad, provocado por la infiltración maligna de la pleura. Por lo general tiene un mal pronóstico (Rodrîguez‐Panadero 1989). La disnea es provocada por la compresión del pulmón subyacente y por una deficiente movilidad torácica y diafragmática, y suele aliviarse con la aspiración del líquido pleural.
Descripción de la afección
El DPM es una afección que produce acumulación del líquido excedente en la cavidad pleural, es causado por la invasión tumoral directa de la pleura, lo que provoca un aumento en la permeabilidad de la microvasculatura y el compromiso de los ganglios linfáticos locales, con lo cual se reduce la reabsorción de líquidos (Rodrîguez‐Panadero 2008). Los sitios primarios más frecuentes que hacen metástasis a la pleura son el cáncer de pulmón en los hombres y el cáncer de mama en las mujeres, aunque otros sitios primarios incluyen el linfoma y las neoplasias malignas genitourinarias y gastrointestinales (DiBonito 1992; Sears 1987). Además, la pleura puede ser el sitio primario de la neoplasia maligna, como es el caso del mesotelioma. En la mayoría de los casos, el diagnóstico de la neoplasia pleural maligna se efectúa mediante el análisis citológico del líquido pleural o a través de la biopsia pleural. En función del cuadro clínico, la confirmación de la neoplasia maligna en cualquier otro lugar y, en caso contrario, de un derrame idiopático (generalmente exudativo) también podría atribuirse a la neoplasia maligna. La supervivencia de estos pacientes varía enormemente (Bielsa 2008; Burrows 2000) y la estimación del pronóstico individual podría colaborar con la selección de la estrategia de abordaje más apropiada (Clive 2014).
El atrapamiento pulmonar puede presentarse cuando la expansión pulmonar completa está limitada por la exfoliación de la pleura visceral o la obstrucción endobronquial y, en esta situación, incluso cuando se haya drenado el líquido, no ocurre la aposición de la pleura visceral y parietal. Como consecuencia, los intentos de una pleurodesis son menos efectivos y suelen limitar las opciones de tratamiento ya sea a un drenaje pleural permanente o a una cirugía.
Descripción de la intervención
Se puede recurrir a varios abordajes diferentes para tratar el DPM y el método elegido puede depender de los factores clínicos, las preferencias del paciente y la disponibilidad local de varias técnicas. La instilación de un esclerosante en la cavidad pleural a través de un drenaje pleural intercostal, después de un drenaje de líquido completo, ha sido una parte fundamental del tratamiento durante muchos años (conocida como pleurodesis con "suspensión" o "junto al paciente"). Esta técnica tiene como objetivo fusionar las capas entre sí, a través de una inflamación local inducida por el agente de pleurodesis, con lo cual se previene la reacumulación de líquido pleural. La estrategia de tratamiento óptima para maximizar el éxito de la pleurodesis en cuanto a la magnitud del drenaje pleural, la posición del paciente, el uso de anestesia y el tipo de esclerosante sigue siendo un tema de debate (Roberts 2010). También queda por resolver formalmente el rol de los fibrinolíticos intrapleurales usados para desintegrar las tabicaciones en el derrame antes de la administración del agente de pleurodesis (Davies 1999; Gilkeson 1999; Hsu 2006).
La toracoscopia es un método alternativo que se utiliza para drenar el derrame y administrar un esclerosante en la cavidad pleural. Este procedimiento se puede realizar bajo sedación consciente (toracoscopia con anestesia local) o en un procedimiento quirúrgico bajo anestesia general (Videotoracoscopia [VATS, por sus siglas en inglés]). Ambas técnicas drenan el líquido pleural y la cavidad pleural se puede visualizar a través de una cámara de fibra óptica. Se pueden desintegrar los tabiques y se pueden tomar muestras para biopsia y obtener un diagnóstico histológico. Después puede administrarse un agente de pleurodesis a través de insuflación (pulverizado) antes de insertar un drenaje pleural (Rahman 2010).
Un abordaje alternativo para el tratamiento del DPM son los drenajes pleurales permanentes (DPP). Se trata de sondas de drenaje pleural que van por debajo de la piel y permiten realizar un drenaje torácico intermitente y prolongado en el ámbito extrahospitalario, por tanto, se reducen las visitas hospitalarias recurrentes. Tienen una función establecida en el tratamiento de los drenajes pleurales en pacientes con atrapamiento pulmonar, aunque cada vez se los utiliza más para el tratamiento primario de los drenajes malignos como alternativa de la pleurodesis química (Davies 2012; Demmy 2012). En una parte de los pacientes con DPP ocurre la pleurodesis espontánea, lo cual permite retirar el drenaje sin recurrencia del derrame (Tremblay 2006).
En determinados contextos clínicos, ninguna de las opciones anteriores podría ser adecuada y tal vez resulte más apropiada la simple aspiración del líquido pleural o el tratamiento médico de la disnea del paciente (por ejemplo con opiáceos). Este puede ser el caso de los pacientes en la fase terminal de la enfermedad, donde podría considerarse que las técnicas invasivas generan una molestia innecesaria.
De qué manera podría funcionar la intervención
La pleurodesis tiene como objetivo fibrosar las capas de la pleura para obliterar el espacio pleural y de esta manera prevenir la recurrencia de los líquidos. Para que la pleurodesis sea exitosa deben enfrentarse las superficies visceral y parietal de la pleura y, por lo tanto, si la expansión pulmonar es incompleta (por ejemplo si el drenaje está muy tabicado o si el paciente posee atrapamiento pulmonar), hay más posibilidades de un fracaso de la pleurodesis. El esclerosante estimula una reacción inflamatoria dentro de la cavidad pleural, esto produce una fusión de la pleura visceral y parietal.
Los drenajes pleurales permanentes permitan realizar un drenaje intermitente del líquido pleural, esto alivia la presión sobre el diafragma y la pared torácica y promueve la reexpansión pulmonar. Al realizar dicho procedimiento mejora la disnea y ocurre una pleurodesis espontánea en hasta un 50% de los pacientes (Putnam 2000).
Por qué es importante realizar esta revisión
Debido a la mayor disponibilidad de intervenciones pleurales, como la toracoscopia y los drenajes pleurales permanentes, las opciones de tratamiento disponibles para los pacientes con DPM son cada vez más. Esta revisión ayudará a determinar las funciones específicas de las diferentes técnicas y a identificar los factores que podrían mejorar las tasas de pleurodesis para quienes se someten a pleurodesis junto al paciente. Esta revisión incluye una actualización de la revisión sistemática Cochrane publicada por primera vez en 2004, "pleurodesis para los derrames pleurales malignos" (Shaw 2004) y en el futuro aportara información para las guías nacionales en esta área.
Debido a la disponibilidad de muchas comparaciones por pares acerca del método de administración de la pleurodesis y el tipo de agente de pleurodesis, esta es una revisión de varias intervenciones. Se realizó un metanálisis en red para sintetizar todas las pruebas disponibles e investigar una jerarquía del tratamiento.
Objetivos
Garantizar la estrategia de tratamiento óptima en adultos con derrame pleural maligno en función de una pleurodesis exitosa. Además, cuantificar las diferencias en los resultados informados por el paciente y los efectos adversos entre las estrategias de tratamiento.
Métodos
Criterios de inclusión de estudios para esta revisión
Tipos de estudios
En esta revisión sólo se incluyeron informes de ensayos controlados aleatorios (ECA). Se habrían incluido los ensayos cruzados aleatorios y los ensayos con asignación al azar por grupos, aunque no se identificaron estudios de este tipo. Se incluyeron tanto los estudios simples como los multicéntricos. Se excluyeron los estudios que declararon una asignación aleatoria, pero que se descubrió que tenían un alto riesgo de sesgo respecto de una adecuada generación de la secuencia o en la ocultación de la asignación.
Tipos de participantes
Inclusión
-
Adultos mayores de 16 años de edad.
-
Derrame pleural sintomático provocado por un proceso maligno subyacente (de cualquier tipo y estadio).
Exclusión
-
Estudios que incluyeron tanto a participantes con un proceso maligno como no maligno sin una distinción clara entre ambos grupos en la sección de resultados.
-
Estudios que evaluaron el efecto de un fármaco administrado a través de cualquier método diferente de la vía intrapleural.
-
Estudios que incluyeron a participantes con derrames en diferentes cavidades corporales (p.ej., cavidad pleural, peritoneal, pericárdica), donde el efecto de los tratamientos en el subgrupo de pacientes con drenaje pleural no puede distinguirse en la sección de resultados.
Tipos de intervenciones
Se identificaron los estudios que comparan la siguiente.
-
Tipo de esclerosante.
-
Modalidad de administración del esclerosante (pleurodesis toracoscópica y pleurodesis junto al paciente).
-
Pleurodesis junto al paciente o toracoscópica e inserción del drenaje pleural permanente.
-
Técnicas utilizadas para optimizar la tasa de éxito de la pleurodesis, a saber:
-
tamaño del drenaje pleural;
-
tipo de analgesia administrada;
-
duración del drenaje después de la instilación del esclerosante;
-
posición del paciente después de la pleurodesis (por ejemplo, rotación del paciente);
-
uso de fibrinolíticos intrapleurales.
-
Se generó una red de intervenciones, incluidas las comparaciones entre los tipos de esclerosante, la vía de administración y el uso de IPC. Se asumió que cualquier participante que cumpliera con los criterios de inclusión podría, en principio, ser asignado al azar a cualquiera de las intervenciones elegibles. Se hace referencia este concepto como que las intervenciones son "libremente asignadas al azar". Sin embargo, sí no se consideró que una intervención fuera libremente asignada al azar el tratamiento fue específico para determinado tipo de tumor, los resultados se informaron de manera independiente de la red (Salanti 2012).
Intervenciones de interés directo
Se incluyeron ECA que evaluaron una o más de las siguientes intervenciones intrapleurales: talco pulverizado, suspensión de talco, tetraciclina, doxiciclina, yodo, C.parvum, IPC, mitoxantrona, mustina, mepacrina, interferón, trietilenotiofosforamida y adriamicina, en comparación con otra intervención o placebo. En caso de identificar otros esclerosantes de los cuales no se tenía conocimiento, se los consideró elegibles y se los incluyó en la red, tras evaluar la comparabilidad con el grupo preespecificado de intervenciones en competencia. Se informaron los hallazgos de estas intervenciones en los resultados y las conclusiones de la revisión.
Tipos de medida de resultado
Resultados primarios
La eficacia de la pleurodesis fue nuestra medida de resultado primaria.
Las definiciones del fracaso de la pleurodesis variaron entre los estudios y si bien la práctica actual definiría esta situación como una falta de recurrencia de síntomas o la necesidad de repetir la intervención pleural para tratar el derrame, en algunos estudios más antiguos se utilizaron definiciones con menor relevancia clínica (por ejemplo, reacumulación de derrame en la imagenología). Todavía se incluyen estos estudios en la revisión y se documentó el método utilizado para definir la pleurodesis de todos los estudios en la evaluación del riesgo de sesgo.
A los fines de la medida de resultado primaria, se utilizó la siguiente jerarquía de preferencias para considerar el fracaso de la pleurodesis (si un estudio informó más de una definición del fracaso de la pleurodesis, para esta jerarquía se utilizó el valor más alto):
-
necesidad de repetir el procedimiento pleural para tratar la recurrencia del derrame o drenaje en curso del líquido pleural proveniente de un drenaje pleural permanente (si corresponde);
-
pruebas de reacumulación significativa de líquido pleural en imagen radiológica (por ejemplo, radiografía de tórax o ecografía);
-
Fracaso de la pleurodesis según la opinión de los investigadores del ensayo.
Asimismo, se eligió el punto temporal utilizado para definir la eficacia de la pleurodesis empleando la siguiente jerarquía de preferencias:
-
2 ‐ 4 meses;
-
> 4 ‐ 7 meses;
-
> 7 ‐ 11 meses;
-
> 11 ‐ 12 meses;
-
< 2 meses;
-
> 12 meses.
Los participantes que murieron antes del punto temporal en que se evaluó la eficacia de la pleurodesis se clasificaron según el último resultado conocido de la pleurodesis antes del deceso (es decir: la última observación considerada). Si no se aportaron estos datos se utilizaron los datos informados que estaban disponibles.
Resultados secundarios
-
Efectos adversos y complicaciones de las intervenciones, especialmente la presencia o ausencia de dolor y fiebre después de la intervención.
-
Control de la disnea informado por el paciente, medido con una escala válida y fiable (por ejemplo, escala analógica visual [EAV], escala de calificación numérica o escala multidimensional específica de disnea/dificultad para respirar)*
-
La calidad de vida de los participantes y el control de los síntomas (incluido el dolor), según la medición con una escala válida y fiable*
-
Costos relativos de las técnicas comparativas, según el informe de los ensayos individuales. Para la facilidad de la comparación, los datos informados en otras monedas se convirtieron a dólares estadounidenses.*
-
Mortalidad global (se utilizaron los datos de los resultados informados más próximos a los tres meses).
-
Mediana de supervivencia.
-
Duración de la estancia hospitalaria en días (tanto la duración total como la duración desde el momento de la intervención hasta el alta).*
-
Aceptabilidad del paciente respecto de las intervenciones según una escala válida (por ejemplo, escala analógica visual o escala de calificación numérica).*
* si estaban disponibles
Results
Description of studies
Results of the search
We performed the literature search in April 2015 (see Figure 1).
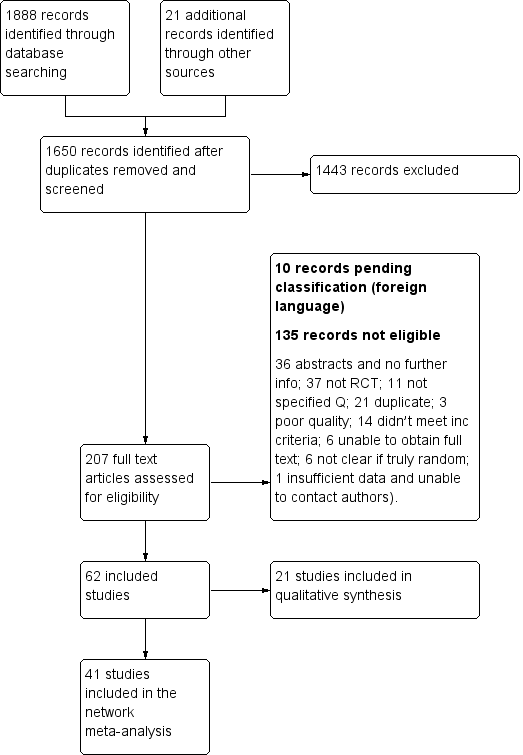
Study flow diagram
We identified 1888 records from database searches and 21 records from other sources before exclusion of duplicates. We screened 1650 abstracts, of which 207 full text articles were retrieved and assessed for eligibility by two independent researchers (AOC, NAM). Of these, 62 met the eligibility criteria (Characteristics of included studies) and 10 are pending classification as they are awaiting translation (Characteristics of studies awaiting classification). Six on‐going studies were also identified (Characteristics of ongoing studies).
Across the 62 included studies, a total of 3428 participants were randomised between 1977 and 2015. There was one foreign language study which was translated from the German (Schmidt 1997).
Included studies
The majority of studies (39/62) explored the efficacy of a variety of pleurodesis agents. Talc was evaluated in 23 trials, making it the most studied agent. The other most commonly examined agents were bleomycin and tetracycline. Two studies compared indwelling pleural catheters with talc slurry (Davies 2012; Demmy 2012).
Four studies evaluated the mode of administration of the pleurodesis agent (three studies comparing talc poudrage with talc slurry (Dresler 2005; Terra 2009; Yim 1996) and one comparing instillation of tetracycline thoracoscopically or through an intercostal cannula (Evans 1993)). A number of studies evaluated alternative methods to improve pleurodesis (one study examined catheter size (Clementsen 1998); three evaluated the duration of drainage after pleurodesis (Goodman 2006; Villanueva 1994; Yildirim 2005); one evaluated the duration of drainage prior to instillation of the sclerosant (Ozkul 2014); one assessed whether patient rotation improved pleurodesis rate (Mager 2002) and one evaluated the effect of talc particle size (Maskell 2004)). We identified one RCT which examined the role of intrapleural fibrinolytics (Okur 2011). One RCT evaluated administration of three different doses of silver nitrate through a chest tube (Terra 2015).
Two studies compared talc pleurodesis with surgical methods to treat malignant effusion (one comparing either talc pleurodesis with pleurectomy (Rintoul 2014) and one comparing talc slurry with thoracoscopic mechanical pleurodesis (Crnjac 2004)).
Additionally, we identified seven studies of agents specifically for the treatment of effusions due to lung cancer (Du 2013; Ishida 2006; Kasahara 2006; Luh 1992; Masuno 1991; Yoshida 2007; Zhao 2009).
There were a number of methodological differences between the included studies. Forty five of 62 studies included all tumour types; two included all except mesothelioma, one included only mesothelioma; one included only adenocarcinoma; six only breast cancer, and in seven studies only lung cancer patients were included.
The methods to define pleurodesis failure varied between studies. Eighteen of 62 studies used radiological criteria only to define a pleurodesis failure, 44 of 62 studies also incorporated symptomatic recurrence or need for a repeat pleural intervention into their definition. The time point at which pleurodesis was defined varied widely between studies, from 1 to 12 months.
The pleurodesis techniques were not standardised. Studies used a variety of chest drain sizes and durations of pleural fluid drainage after the sclerosant was administered. Additionally, patients with trapped lung were excluded from 25 of 62 studies, but not from the others.
Excluded studies
We placed 11 studies in the excluded studies section, having initially identified them as eligible for inclusion but with reasons for exclusion identified later (Characteristics of excluded studies). One study had insufficient data for extraction (Tattersall 1982). Three studies included data for patients with ascites, which could not be separated from those with pleural effusions even after attempting to contact the study authors (Kwasniewska‐Rokicinska 1979; Lissoni 1995; Nio 1999). As per the published protocol, seven studies were found to be high risk of bias for sequence generation and therefore excluded (Caglayan 2008; Dryzer 1993; Elayouty 2012; Engel 1981; Gust 1990; Maiche 1993; Manes 2000). Causes of the inadequate sequence generation included allocating patients to groups using alternation (Caglayan 2008); or according to certain clinical criteria (Maiche 1993), patient hospital number (Dryzer 1993), date of consent (Engel 1981) or date of diagnosis (Manes 2000). We excluded one study as the data contained both randomised and non‐randomised data, which was not distinguishable (Gust 1990) and we could not obtain contact details for the study authors. Another stated patients were ‘divided’ between groups, not mentioning if this process was random (Elayouty 2012) and there was no response from the study authors when contacted to clarify this further.
Risk of bias in included studies
A summary assessment of the risk of bias is presented in the Characteristics of included studies, Figure 2 and Figure 3. No studies were at low risk of bias for all domains.
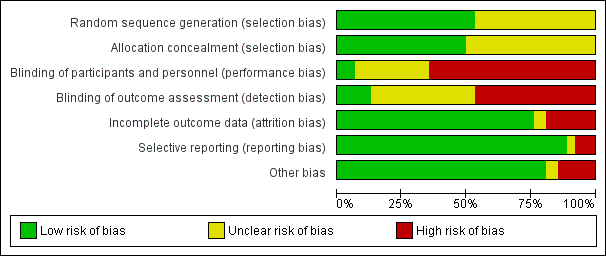
Risk of bias graph: review authors' judgements about each risk of bias item presented as percentages across all included studies.
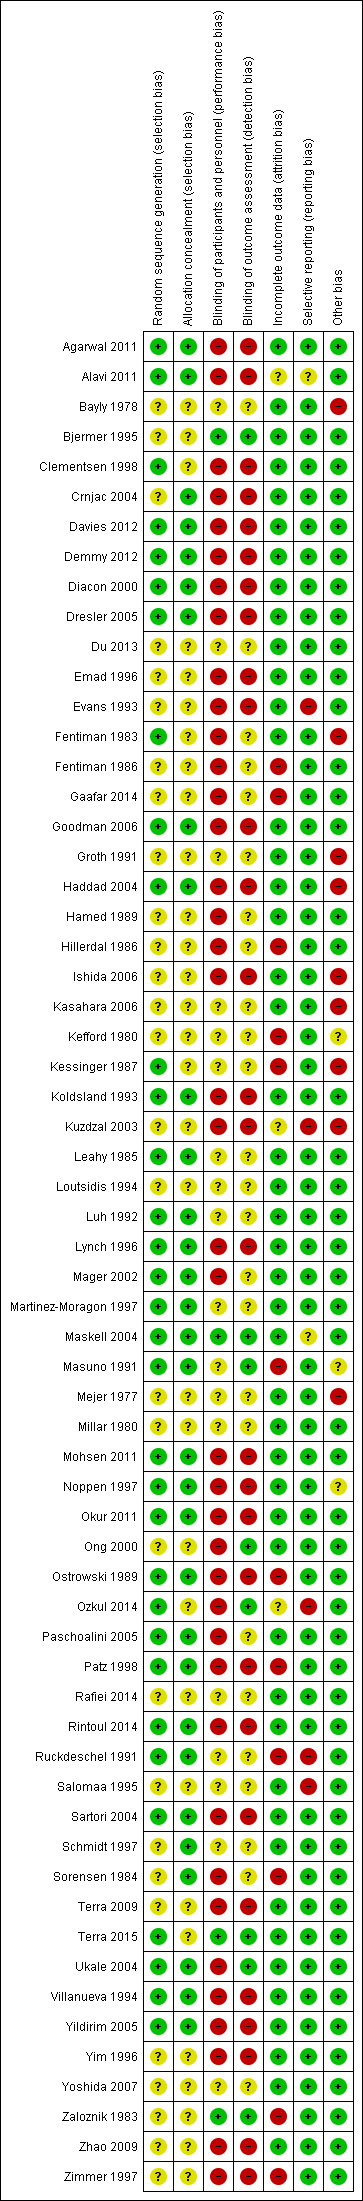
Risk of bias summary: review authors' judgements about each risk of bias item for each included study.
Allocation
Thirty three of 62 studies documented adequate sequence generation. The most commonly used methods were computer or telephone randomisation services, block randomisation, stratification, opaque sealed envelopes or a random number generator. Since studies with inadequate sequence generation were excluded as per the protocol, we assessed sequence generation as unclear in the remaining 29 studies. In all cases, the study was stated to have been randomised.
Regarding allocation concealment, we assessed 31 studies as low risk of bias for this domain. Since studies with inadequate allocation concealment were excluded as per the protocol, allocation concealment was ‘unclear’ for the remaining 31 studies.
Blinding
Blinding of participants and personnel (performance bias)
Due to the nature of many of the interventions evaluated in this review, blinding of the participants and clinicians was often not possible and therefore we assessed 40 of 62 studies as high risk of bias for this domain. Many of the pleurodesis agents have differing visual appearances and those studies randomising patients to different modes of administration of a pleurodesis agent, an indwelling pleural catheter or surgery, could not feasibly be blinded.
Four studies were assessed as low risk of performance bias (Bjermer 1995; Maskell 2004; Terra 2015; Zaloznik 1983).
Blinding of outcome assessment (detection bias)
The assessment of pleurodesis success could often not be blinded as it was reliant on participants (who were not blinded) reporting symptoms, in association with the radiological findings of effusion recurrence. Very few studies reported whether the radiological assessments were performed in a blinded fashion. Twenty nine of 62 studies were at high risk of detection bias, and a further 25 of 62 studies had an unclear risk of bias for this domain. Eight studies were low risk of detection bias (Bjermer 1995; Maskell 2004; Masuno 1991; Ong 2000; Ozkul 2014; Terra 2015; Ukale 2004; Zaloznik 1983).
Incomplete outcome data
The majority of studies were low risk of bias because although some inevitable attrition due to death was reported, the rates were comparable for the treatment arms and were deemed reasonable for the size of the population. We classified 12 studies as high risk of bias (eight due to very high attrition rates (Kefford 1980; Kessinger 1987; Masuno 1991; Ostrowski 1989; Patz 1998; Ruckdeschel 1991; Sorensen 1984; Zaloznik 1983; Kefford 1980); one due to very imbalanced loss to follow up (LTFU) between the treatment arms (Fentiman 1986); one the number randomised was not stated (Zimmer 1997); one the numbers provided did not add up (Hillerdal 1986); one excluded patients from the analysis who discontinued treatment due to an allergic reaction (Gaafar 2014)). Three were unclear risk of bias (Kuzdzal 2003: number of randomised patients not stated, only number analysed; Alavi 2011: unable to access tables, and numbers only given as percentages, rather than absolute values; Ozkul 2014: numbers of patients lost to follow up not stated).
Selective reporting
The majority of studies were assessed to be at low risk of bias for selective outcome reporting. We classified two studies as unclear, one as minimal raw data were presented in the text and the tables could not be accessed (Alavi 2011) and the other because pleurodesis success data were not collected in an RCT of talc and tetracycline pleurodesis (although the study was not designed to evaluate this) (Maskell 2004). Five studies were high risk (four provided minimal or no data regarding side effects or survival, or both (Evans 1993; Kuzdzal 2003; Ozkul 2014; Salomaa 1995) and one did not report data on 15 of the randomised patients (Ruckdeschel 1991).
Other potential sources of bias
We classified nine of 62 studies as high risk of bias in the ‘other’ domain and three of 62 studies as unclear. This was for a variety of reasons (see Characteristics of included studies). The remaining studies had a low risk of bias for this domain.
Effects of interventions
PRIMARY OUTCOME
Selection of trials for inclusion in the network
All the interventions from the included studies were evaluated and assessed for inclusion in the network. A number of interventions were not felt to be jointly randomisable and hence were not included in the network. This was the case for specific surgical techniques (Crnjac 2004; Rintoul 2014), different talc particle sizes (Maskell 2004), interventions aimed to improve the efficacy of pleurodesis (Clementsen 1998; Evans 1993; Goodman 2006; Mager 2002; Okur 2011; Ozkul 2014; Villanueva 1994; Yildirim 2005), tumour‐specific intra‐pleural therapy (Du 2013; Ishida 2006; Kasahara 2006; Luh 1992; Masuno 1991; Yoshida 2007; Zhao 2009) and different doses of silver nitrate (Terra 2015).
Two interventions (silver nitrate and combined tetracycline and bleomycin), which we initially felt to be eligible for inclusion in the network had to be removed for the evaluation of pleurodesis efficacy. These agents were only evaluated in one trial each and no participants who received these agents had a pleurodesis failure, which led to computational problems such that a treatment effect could not be estimated (Emad 1996; Paschoalini 2005). One study was not included in the analysis of pleurodesis efficacy as there were no pleurodesis failures in either study arm (Yim 1996). Such studies cannot statistically contribute to the estimate of relative intervention effects (Higgins 2011b).
The majority of studies included all cell types and 36 of 62 trials (58%) did not exclude patients with trapped lung. Pleurodesis was defined using symptom recurrence and radiology in 44 of 62 studies (71%) and it was usually defined within four months of the intervention. It was very difficult to assess whether the distribution of potential effect modifiers was comparable for all the direct treatment comparisons because there were few studies per direct comparison (see Appendix 2).
The final network can be seen in Figure 4. Any studies in the systematic review which were not included in the network were reported descriptively.
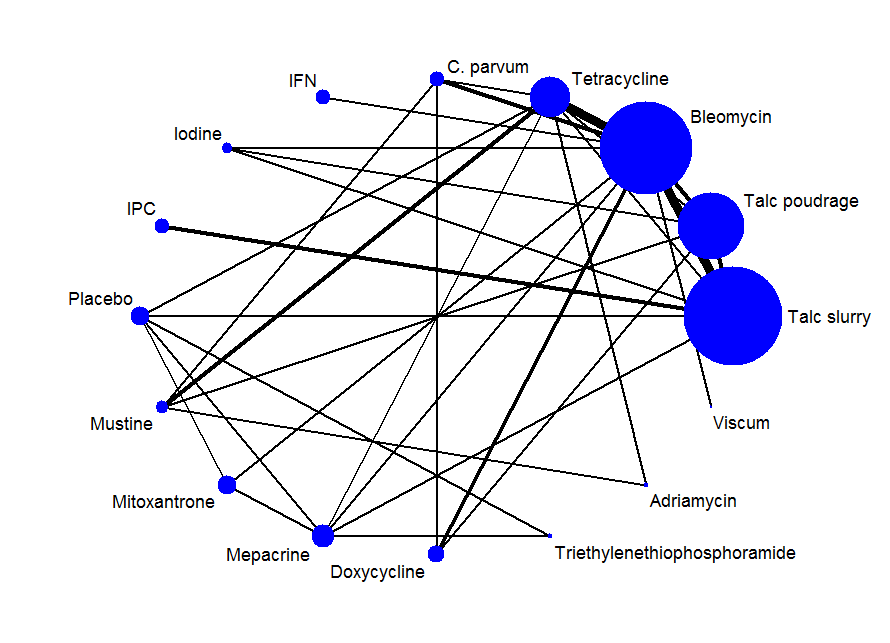
Network plot of the pleurodesis efficacy network. The nodes are weighted according to the number of participants randomised to the intervention. The edges (line thicknesses) are weighted according to the number of studies included in each comparison.
Primary outcomes for the methods included in the network meta‐analysis
Direct meta‐analysis
Results of the direct, pair‐wise random‐effects meta‐analysis of the main pleurodesis agents are presented in Table 1. Given the small number of studies making the same direct comparisons, meta‐analysis was only possible for eight direct comparisons.
| Treatment | Talc slurry | Talc poudrage | Bleomycin | Tetracycline | C. parvum | Placebo | Mustine | Mitoxantrone | Mepacrine |
| Talc poudrage | 0.76 (0.54, 1.09); n = 3; Tau2 = 0; I2 = 0% | NA | ‐ | ‐ | ‐ | ‐ | ‐ | ‐ | ‐ |
| Bleomycin | 1.22 (0.55, 2.70); n = 5*; Tau2 = 0.1; I2 = 12% | 9.70 (2.10, 44.78); n = 2; Tau2 = 0; I2= 0% | NA | ‐ | ‐ | ‐ | ‐ | ‐ | ‐ |
| Tetracycline | 0.78 (0.19, 3.13); n = 1* | 12.10 (1.32, 111.30); n = 1 | 2.00 (1.07, 3.75); n = 5*; Tau2 = 0; I2 = 0% | NA | ‐ | ‐ | ‐ | ‐ | ‐ |
| C. parvum | NA | NA | 0.55 (0.01, 57.48); n = 2; Tau2 = 11; I2 = 94% | 0.31 (0.05, 1.94); n = 1 | NA | ‐ | ‐ | ‐ | ‐ |
| Interferon | NA | NA | 3.25 (1.54, 6.89); n = 1 | NA | NA | ‐ | ‐ | ‐ | ‐ |
| Iodine | 0.47 (0.04, 5.71); n = 1 | 1.76 (0.26, 11.83); n = 1 | 1.25 (0.28, 5.59); n = 1 | NA | NA | ‐ | ‐ | ‐ | ‐ |
| Indwelling pleural catheter | 3.35 (1.64, 6.83); n = 2 Tau2 = 0; I2 = 0% | NA | NA | NA | NA | ‐ | ‐ | ‐ | ‐ |
| Placebo | 13.93 (0.66, 293.99); n = 1 | NA | NA | 3.33 (0.51, 21.58); n = 1 | NA | NA | ‐ | ‐ | ‐ |
| Mustine | NA | 8.00 (1.40, 45.76); n = 1 | NA | 2.72 (0.74, 9.98) n = 2*; Tau2= 0; I2= 0% | 3.00 (0.40, 22.71); n = 1 | NA | NA | ‐ | ‐ |
| Mitoxantrone | NA | NA | 3.18 (1.17, 8.65); n = 1 | NA | NA | 0.75 (0.32, 1.79); n = 1 | NA | NA | ‐ |
| Mepacrine | 2.08 (0.62, 6.96); n = 1 | NA | 0.16 (0.03, 0.89); n = 1 | 0.63 (0.05, 8.20); n = 1 | NA | 0.15 (0.03, 0.64); n = 1* | NA | 7.61 (0.35, 163.82); n = 1 | NA |
| Doxycycline | NA | 42.69 (2.13, 856.61); n = 1 | 0.67 (0.24, 1.86); n = 2; Tau2= 0; I2= 0% | NA | 1.91 (0.43, 8.48); n = 1 | NA | NA | NA | NA |
| Triethylenethiophosphoramide | NA | NA | NA | NA | NA | 2.06 (0.43, 9.80); n = 1* | NA | NA | 4.95 (1.02, 24.10); n = 1* |
| Adriamycin | NA | NA | NA | 1.11 (0.06, 20.49); n = 1* | NA | NA | 0.37 (0.01, 10.18); n = 1* | NA | NA |
| n = the number of studies included in the pair‐wise comparison. * Indicates that the comparison included a three‐arm study. NA = no direct pair‐wise comparison available. Results that are statistically significant at the conventional level of P < 0.05 are shaded in grey. ‐ indicates the odds ratio is already expressed elsewhere in the table comparing the interventions the other way around. | |||||||||
In the majority of cases, there was no evidence against the null hypothesis of no true difference between interventions (Table 1). However in 10 of the direct comparisons, the OR and 95% CI lay away from the null value of 1, giving evidence against the null hypothesis of no difference. A number of methods were less effective than talc poudrage at inducing pleurodesis, including bleomycin (OR 9.70 (95% CI 2.10 to 44.78), participants = 57; studies = 2) (Analysis 1.1), tetracycline (OR 12.10 (95% CI 1.32 to 111.30), participants = 33; studies = 1) (Analysis 4.1), mustine (OR 8.00 (95% CI 1.40 to 45.76), participants = 37; studies = 1) (Analysis 17.1) and doxycycline (OR 42.69 (95% CI 2.13 to 856.61), participants = 31; studies = 1) (Analysis 8.1). Interferon was less effective than bleomycin (OR 3.25 (95% CI 1.54 to 6.89), participants = 160; studies = 1) (Analysis 13.1). Bleomycin was less effective than mepacrine (OR 0.16 (0.03, 0.89), participants = 36; studies = 1) (Analysis 12.3).
Those treated with an IPC had more pleurodesis failures than those receiving talc slurry (OR 3.35 (95% CI 1.64 to 6.83), participants = 160; studies = 2) (Analysis 6.1). Triethylenephosphoramide was less effective than mepacrine (OR 4.95 (95% CI 1.02 to 24.10), participants = 29; studies = 1) (Analysis 14.1). There was also some evidence that tetracycline and mitoxantrone were less effective than bleomycin (OR 2.00 (95% CI 1.07 to 3.75); participants = 220; studies = 5) ) (Analysis 4.1) and OR 3.18 (95% CI 1.17 to 8.65); participants = 85; studies = 1 (Analysis 18.1) respectively). The comparison between talc slurry and talc poudrage gave some weak evidence that talc slurry may be less effective as the 95% CI was close to one (OR 1.31 (95% CI 0.92 to 1.85); participants = 599; studies = 3) (Analysis 2.1).
The heterogeneity between studies making similar comparisons was generally low. However, the comparison between C. parvum and bleomycin revealed a very high level of heterogeneity (Tau2 = 10.59, I2 = 94%) because the two included studies had conflicting results: (OR 0.05 (95% CI 0.01 to 0.29) in Hillerdal 1986; OR 5.69 (95% CI 1.38 to 23.48) in Ostrowski 1989) (Analysis 5.1). The number of participants in the comparison was small (98 patients randomised across the two studies; 78 of whom had sufficient data to be included in the primary outcome analysis) and Hillerdal 1986 was high risk of bias for two domains and unclear risk of bias for a further two. Hillerdal 1986 only included patients with adenocarcinoma or bronchogenic carcinoma, whereas Ostrowski 1989 included all cell types.
Sensitivity analysis of the direct comparisons using the fixed effect meta‐analysis model did not reveal any clinically or statistically meaningful differences (see Appendix 3).
Network meta‐analysis
The results of the relative efficacies of the pleurodesis methods generated by the network meta‐analysis, which comprised 41 studies of 16 agents, including 2345 participants are shown in Table 2. The estimated ranks for each of the methods in terms of pleurodesis success are shown in Figure 5.
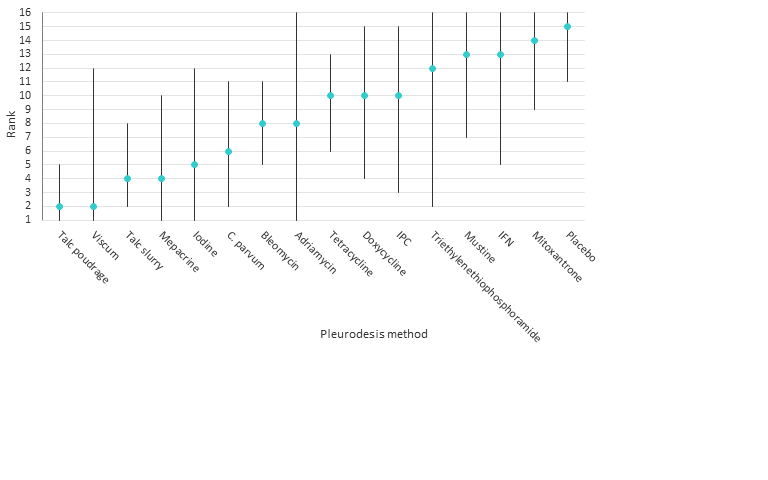
Estimated (95% Cr‐I) ranks for each of the pleurodesis methods from the main network
| Talc slurry | Talc poudrage | Bleomycin | Tetracycline | C. parvum | Interferon | Iodine | Indwelling pleural catheter | Placebo | Mustine | Mitoxantrone | Mepacrine | Doxycyline | Triethylenethiophosphoramide | viscum | |
| Talc poudrage | 0.42 (0.13, 1.19) | NA | ‐ | ‐ | ‐ | ‐ | ‐ | ‐ | ‐ | ‐ | ‐ | ‐ | ‐ | ‐ | ‐ |
| Bleomycin | 2.56 (1.05, 6.67) | 6.03 (2.19, 20.46) | NA | ‐ | ‐ | ‐ | ‐ | ‐ | ‐ | ‐ | ‐ | ‐ | ‐ | ‐ | ‐ |
| Tetracycline | 3.71 (1.22, 11.67) | 8.77 (2.74, 33.01) | 1.45 (0.59, 3.46) | NA | ‐ | ‐ | ‐ | ‐ | ‐ | ‐ | ‐ | ‐ | ‐ | ‐ | ‐ |
| C. parvum | 1.48 (0.34, 6.57) | 3.49 (0.79, 17.64) | 0.58 (0.16, 1.95) | 0.40 (0.10, 1.52) | NA | ‐ | ‐ | ‐ | ‐ | ‐ | ‐ | ‐ | ‐ | ‐ | ‐ |
| Interferon | 8.49 (0.94, 82.98) | 19.96 (2.22, 229.60) | 3.33 (0.43, 25.66) | 2.29 (0.26, 21.65) | 5.75 (0.55, 64.16) | NA | ‐ | ‐ | ‐ | ‐ | ‐ | ‐ | ‐ | ‐ | ‐ |
| Iodine | 1.25 (0.22, 6.77) | 2.97 (0.55, 17.21) | 0.49 (0.09, 2.49) | 0.34 (0.05, 2.04) | 0.85 (0.11, 6.35) | 0.15 (0.01, 1.90) | NA | ‐ | ‐ | ‐ | ‐ | ‐ | ‐ | ‐ | ‐ |
| Indwelling pleural catheter | 3.47 (0.75, 16.46) | 8.19 (1.32, 59.02) | 1.36 (0.22, 8.01) | 0.94 (0.14, 6.27) | 2.36 (0.28, 19.88) | 0.41 (0.03, 5.96) | 2.76 (0.29, 28.48) | NA | ‐ | ‐ | ‐ | ‐ | ‐ | ‐ | ‐ |
| Placebo | 19.50 (3.73, 128.50) | 46.51 (7.86, 375.90) | 7.64 (1.55, 44.22) | 5.29 (1.04, 31.95) | 13.28 (1.91, 110.80) | 2.29 (0.18, 34.14) | 15.63 (1.72, 179.10) | 5.61 (0.59, 65.18) | NA | ‐ | ‐ | ‐ | ‐ | ‐ | ‐ |
| Mustine | 7.50 (1.35, 43.86) | 17.75 (3.59, 105.70) | 2.94 (0.58, 14.84) | 2.02 (0.43, 9.79) | 5.07 (0.91, 29.81) | 0.88 (0.06, 11.71) | 5.98 (0.68, 58.17) | 2.16 (0.22, 22.76) | 0.38 (0.04, 3.32) | NA | ‐ | ‐ | ‐ | ‐ | ‐ |
| Mitoxantrone | 12.87 (2.36, 89.02) | 30.53 (5.11, 259.50) | 5.04 (1.04, 28.67) | 3.48 (0.64, 22.72) | 8.76 (1.24, 73.66) | 1.51 (0.12, 22.89) | 10.28 (1.12, 119.70) | 3.71 (0.38, 44.85) | 0.66 (0.13, 3.52) | 1.73 (0.19, 17.80 | NA | ‐ | ‐ | ‐ | ‐ |
| Mepacrine | 0.98 (0.22, 4.15) | 2.32 (0.45, 12.99) | 0.38 (0.09, 1.52) | 0.27 (0.05, 1.17) | 0.67 (0.10, 4.06) | 0.12 (0.01, 1.31) | 0.78 (0.09, 6.55) | 0.28 (0.03, 2.32) | 0.05 (0.01, 0.28) | 0.13 (0.02, 0.99) | 0.08 (0.01, 0.47) | NA | ‐ | ‐ | ‐ |
| Doxycycline | 3.49 (0.68, 19.56) | 8.23 (1.70, 50.18) | 1.37 (0.31, 6.09) | 0.94 (0.18, 5.09) | 2.36 (0.46, 13.09) | 0.41 (0.03, 5.14) | 2.78 (0.33, 26.50) | 1.00 (0.11, 10.23) | 0.18 (0.02, 1.53) | 0.47 (0.06, 3.77) | 0.27 (0.03, 2.31) | 3.56 (0.50, 28.59) | NA | ‐ | ‐ |
| Triethylenethiophosphoramide | 5.53 (0.40, 80.97) | 13.07 (0.89, 227.30) | 2.16 (0.16, 29.77) | 1.50 (0.10, 21.61) | 3.74 (0.21, 66.99) | 0.65 (0.02, 17.63) | 4.40 (0.22, 98.58) | 1.59 (0.08, 35.28) | 0.28 (0.02, 3.62) | 0.74 (0.04, 15.00) | 0.43 (0.02, 6.80) | 5.60 (0.55, 63.81) | 1.59 (0.08, 31.05) | NA | ‐ |
| Adriamycin | 2.31 (0.03, 165.40) | 5.53 (0.08, 403.50) | 0.90 (0.01, 59.43) | 0.62 (0.01, 38.58) | 1.57 (0.02, 114.20) | 0.27 (0.00, 27.43) | 1.85 (0.02, 162.70) | 0.67 (0.01, 62.01) | 0.12 (0.00, 9.46) | 0.31 (0.00, 20.50) | 0.18 (0.00, 14.59) | 2.36 (0.03, 191.30) | 0.66 (0.01, 52.71) | 0.42 (0.00, 54.35) | NA |
| Viscum | 0.39 (0.01, 8.23) | 0.92 (0.03, 21.77) | 0.15 (0.01, 2.73) | 0.10 (0.00, 2.17) | 0.26 (0.01, 6.21) | 0.04 (0.00, 1.55) | 0.31 (0.01, 9.07) | 0.11 (0.00, 3.44) | 0.02 (0.00, 0.53) | 0.05 (0.00, 1.41) | 0.03 (0.00, 0.79) | 0.39 (0.01, 10.28) | 0.11 (0.00, 2.83) | 0.07 (0.00, 3.48) | 0.16 (0.00, 26.60) |
| Results that are statistically significant at the conventional level of P < 0.05 are shaded in grey. ‐ indicates the odds ratio is already expressed elsewhere in the table comparing the interventions the other way around. NA= not applicable. | |||||||||||||||
The network comparisons between talc poudrage and bleomycin, tetracycline, interferon (IFN), IPC, placebo, mustine, mitoxantrone and doxycycline, all provided evidence against the null hypotheses of no difference in favour of talc poudrage resulting in fewer pleurodesis failures (See Table 2). The estimated rank of talc poudrage was second of 16 pleurodesis methods (95% Cr‐I 1 to 5).
Other potentially efficacious agents were viscum, talc slurry, mepacrine, iodine and C. parvum, with estimated ranks of second (95% Cr‐I 1 to 12), fourth (95% Cr‐I 2 to 8), fourth (95% Cr‐I 1 to 10), fifth (95% Cr‐I 1 to 12) and sixth (95% Cr‐I 2 to 11) respectively (see Figure 5). The ORs and 95% Cr‐Is comparing talc slurry with tetracycline, placebo, mustine and mitoxantrone, lay far away from the null value of 1, providing evidence that talc slurry is more effective than these other agents. The comparisons between talc slurry and bleomycin and IFN had 95% Cr‐I close to 1, providing some evidence that talc slurry may result in fewer pleurodesis failures.
The network provides some evidence that viscum is more effective than placebo and mitoxantrone, with ORs and 95% Cr‐Is lying far away from the null value of 1. However, the direct evidence on this agent was from only a single small study of 17 patients and the confidence intervals for its estimated rank are very wide, reflecting uncertainty within the network as to its true rank.
Placebo was most probably the least successful pleurodesis agent, with an estimated rank of fifteenth of 16 methods (95% Cr‐I 11 to 16). The ORs and 95% Cr‐Is comparing placebo with talc slurry, talc poudrage, bleomycin, C. parvum, iodine and mepacrine were all far away from 1, providing evidence that placebo is less effective.
Heterogeneity
The between‐study standard deviation in treatment effect estimates (log odds ratios) across the whole network was estimated to be Tau = 0.88 (95% Cr‐I 0.42 to 1.48), suggesting a high degree of heterogeneity, although the wide credible interval indicates a substantial degree of uncertainty around this.
We performed a number of sensitivity analyses to explore the heterogeneity found in the main network based on pre‐defined potential clinical effect modifiers (see Appendix 4). Due to the smaller number of studies in these analyses, many of them contained fewer pleurodesis methods than the main network.
The majority of the sensitivity analyses found less evidence of true differences between the efficacies of individual methods. The estimated ranks were generally similar to the main network, although all ranks had very wide credible intervals and therefore were imprecise. The sensitivity analyses showed very wide credible intervals for the between‐study standard deviation (representing heterogeneity), with the upper limits of 95% Cr‐Is often being close to 2. Since a uniform(0,2) prior distribution was assumed for Tau in each analysis, it is likely that the upper limits would increase further still if a wider prior distribution was assumed.
However, the estimate of the between‐studies standard deviation was reduced when we restricted analysis to those studies with a lower risk of bias (defined as two or fewer ‘high risk’ domains in the risk of bias tool). The credible intervals for Tau did however overlap, so it is unclear whether heterogeneity was truly reduced (Tau 0.46 (95% Cr‐I 0.03 to 1.09)) for the low risk of bias subgroup vs Tau 0.88 (95% Cr‐I 0.43 to 1.49) for the main network) (Appendix 4, Appendix 5, Appendix 6). However, the overlapping credible intervals reflect considerable uncertainty about this. Results were fairly robust to exclusion of the higher risk studies, although with doxycycline and C. parvum perhaps appearing a little better, probably due to the removal of two particular studies (Kuzdzal 2003; Ostrowski 1989).
Due to the diversity of doses used for many of the pleurodesis agents evaluated, we were unable to examine the effect of dose on the degree of heterogeneity observed. This is one potential cause for the unexplained heterogeneity, which was not feasible to examine in the network.
Inconsistency
Several estimated loop‐specific inconsistency factors (Chaimani 2013) were very large, suggesting potential inconsistencies between the direct and indirect evidence (see Figure 6). The CIs around the estimated inconsistency factors were also very wide, due to the small volume of evidence per loop. Only two inconsistency factors had 95% CIs which did not cross the null value of 1. The loop involving talc slurry, talc poudrage and bleomycin did provide evidence of a difference between the direct and indirect evidence, with a ratio of odds ratios (ROR) of 7.0 (95% Cr‐I 1.1 to 43.8). The talc slurry, bleomycin and mepacrine loop also showed significant inconsistency (ROR 10.2 (95% Cr‐I 1.1 to 96.9). There were no obvious differences between the distribution of potential effect modifiers between the three direct comparisons (see Appendix 2; Appendix 4) and hence these inconsistencies could not be explained.
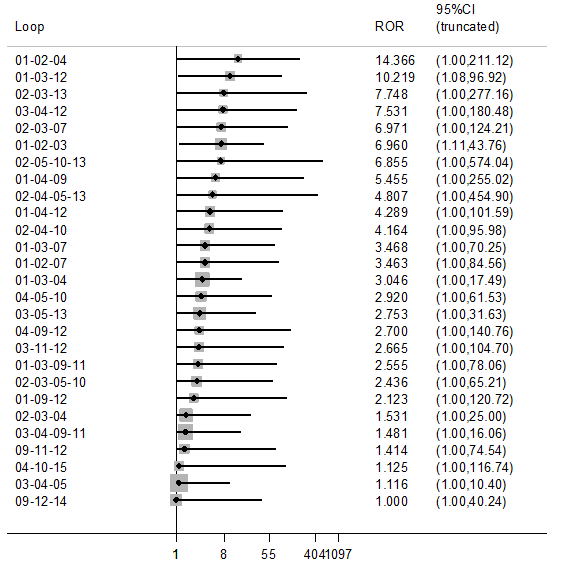
Inconsistency plot for the main network. Treatment codes: 01 = Talc slurry; 02 = Talc poudrage; 03 = Bleomycin; 04 = Tetracycline; 05 = C. parvum; 06 = Interferon; 07 = Iodine; 08 = Indwelling pleural catheter; 09 = Placebo; 10 = Mustine; 11 = Mitoxantrone; 12 = Mepacrine; 13 = Doxycyline; 14 = Triethylenethiophosphoramide; 15 = Adriamycin. Abbreviations: ROR = Ratio of Odds Ratios; 95% CI = 95% Confidence interval. Heterogeneity variance was set at 0.8847 (reflecting the estimation of Tau from the network)
Across the entire network, there was no evidence of global inconsistency. The Deviance Information Criterion (DIC) was 398 for the consistency model and 404 for the inconsistency model, suggesting that the consistency model fits the data marginally better.
Similarly, there was no evidence of global inconsistency for any of the subgroup or sensitivity network meta‐analyses (Appendix 4).
Additional post‐hoc sensitivity analysis
The sensitivity analysis that only evaluated agents given through an intercostal chest tube included 29 studies of 13 agents (see Appendix 7 and Appendix 8). There was very little evidence of substantial differences between the agents, the credible intervals were wide and the estimated rankings for the individual agents were also very imprecise.
The degree of heterogeneity was even higher than the main network (Tau 0.98 (95% Cr‐I 0.45 to 1.72). There was no evidence of global inconsistency (DICs for the consistency and inconsistency models were 271 and 276 respectively). Similar to the main network, there was evidence of loop‐specific inconsistency for the talc slurry, bleomycin and mepacrine loop (ROR 10.2 (95% Cr‐I 1.1 to 96.5)).
Primary outcomes for the methods not included in the network meta‐analysis
Pleurodesis methods
The results of the pair‐wise comparisons of the pleurodesis methods not included in the network meta‐analysis are shown in Table 3.
| Study | Reason study excluded from network | Intrapleural agent or intervention 1 | Pleurodesis failure rate for agent 1 | Intrapleural agent or intervention 2 | Pleurodesis failure rate for agent 2 | OR (95% CI) of agent 1 compared with agent 2*** |
| Du 2013 | Lung cancer specific therapy | Cisplatin and bevacizumab | 6/36 | Cisplatin | 17/34 | 0.20 (0.07, 0.60) |
| Emad 1996* | No pleurodesis failures in the Combined group | Tetracycline** | 3/19 | Combined tetracycline and bleomycin | 0/19 | 8.27 (0.40, 172.05) |
| Bleomycin** | 2/19 | Combined tetracycline and bleomycin | 0/19 | 5.57 (0.25, 124.19) | ||
| Ishida 2006* | Lung cancer specific therapy | OK‐432 | 8/17 | Cisplatin | 11/17 | 0.48 (0.12, 1.92) |
| OK‐432 | 8/17 | OK‐432 and cisplatin | 1/15 | 12.44 (1.32, 117.03) | ||
| Cisplatin | 11/17 | OK‐432 and cisplatin | 1/15 | 25.67 (2.68, 245.84) | ||
| Kasahara 2006 | Lung cancer specific therapy | High dose OK‐432 | 5/19 | Low dose OK‐432 | 3/19 | 1.90 (0.38, 9.44) |
| Luh 1992 | Lung cancer specific therapy | OK‐432 | 3/26 | Mitomycin C | 9/27 | 0.26 (0.06, 1.11) |
| Maskell 2004 | Two Talc slurry preparations | Mixed particle talc | 3/14 | Graded talc (particles >20µm) | 2/14 | 1.64 (0.23, 11.70)) |
| Masuno 1991 | Lung cancer specific therapy | LC9018 and Adriamycin | 10/38 | Adriamycin | 23/38 | 0.23 (0.09, 0.62) |
| Paschoalini 2005 | No pleurodesis failures in Silver Nitrate group | Talc slurry | 1/9 | Silver nitrate | 0/16 | 5.85 (0.21, 158.82) |
| Rintoul 2014 | MPM specific surgical technique | Talc pleurodesis (slurry or poudrage) | 25/62 | VATS pleurectomy | 24/60 | 0.88 (0.43, 1.82) |
| Terra 2015* | Comparison of different doses of Silver Nitrate | 90 mg silver nitrate | 0/20 | 150 mg silver nitrate | 0/20 | not estimable |
| 90 mg silver nitrate | 0/20 | 180 mg silver nitrate | 2/20 | 0.18 (0.01, 4.01) | ||
| 150 mg silver nitrate | 0/20 | 180 mg silver nitrate | 2/20 | 0.19 (0.01, 4.01) | ||
| Yoshida 2007* | Lung cancer specific therapy | OK‐432 | 8/33 | Bleomycin | 11/35 | 0.70 (0.24, 2.03) |
| OK‐432 | 8/33 | Cisplatin and etoposide | 10/34 | 0.77 (0.26, 2.27) | ||
| Bleomycin | 11/35 | Cisplatin and etoposide | 10/34 | 1.10 (0.39, 3.07) | ||
| Zhao 2009 | Lung cancer specific therapy | rAd‐p53 and cisplatin | 3/17 | Cisplatin | 9/18 | 0.21 (0.05, 1.01) |
| *Three‐arm study. **The results for the pair‐wise comparison between tetracycline and bleomycin are included in the network meta‐analysis. ***Results that are statistically significant at the conventional level of P < 0.05 are shaded in grey | ||||||
Two agents (silver nitrate and the combination of bleomycin and tetracycline together) were excluded as there were no pleurodesis failures for the agents, resulting in numerical difficulties when we attempted to include them in the network meta‐analysis model. The pair‐wise comparisons in these studies did not provide evidence against the null hypothesis of no true difference between interventions (see Table 3).
One study was not included in the network as it was a three‐arm trial evaluating different doses of silver nitrate administered via a chest tube (Terra 2015). There were only two of 60 participants who had a failed pleurodesis, both in the group receiving the highest dose of silver nitrate.
Seven studies could not be included in the network meta‐analysis as they evaluated tumour‐specific therapies for patients with MPE due to non‐small cell lung cancer (NSCLC) (Du 2013; Ishida 2006; Kasahara 2006; Luh 1992; Masuno 1991; Yoshida 2007; Zhao 2009). The results could not be generalised to patients with other tumour types and hence these interventions were not deemed jointly randomisable. All the studies randomised only small numbers of participants. However in four of the direct comparisons, the OR and 95% CI lay far away from the null value of 1, giving evidence against the null hypothesis of no difference.
Du 2013 randomised patients with NSCLC to receive three cycles of either cisplatin and intra‐pleural bevacizumab (a humanised monoclonal antibody to VEGF) or cisplatin alone. More patients in the cisplatin‐alone group had pleurodesis failure than in the combination group (6/36 vs 17/34 respectively; OR 5.00 (95% CI 1.66 to 15.09); participants = 70; studies = 1) (Analysis 23.1) (Du 2013).
Masuno 1991 randomised NSCLC patients with MPE to receive up to two doses of either intra‐pleural LC9018 (lyophilised Lactobacillus casei) and Adriamycin or Adriamycin alone. There were more pleurodesis failures in the control group compared to those who received LC9018 (23/38 vs 10/38 respectively; OR 4.29 (95% CI 1.62 to 11.35); participants = 76; studies = 1) (Analysis 15.1) (Masuno 1991).
Finally, Ishida 2006 conducted a three‐arm trial, comparing intrapleural OK‐432, an inactivated product of Streptococcus pyogenes A3 with anti‐tumour immune‐modulatory effects in lung cancer, with cisplatin and combined therapy (both OK‐432 and cisplatin). Those treated with OK‐432 alone had a higher pleurodesis failure rate than those receiving combination treatment (OR 12.44 (95% CI 1.32 to 117.03; participants = 32; studies = 1) but a lower failure rate than those receiving cisplatin alone (OR 0.48 (95% CI 0.12 to 1.92); participants = 34; studies = 1) (Analysis 11.1).
Other methods to optimise pleurodesis
We evaluated a number of methods to optimise pleurodesis, but these were not included in the network because they were not considered jointly randomisable (see Table 4). All the studies included very small numbers of patients and none provided evidence of a difference in pleurodesis failure rates between the treatments being compared (see Table 4). The results of the ongoing TIME‐1 and TIME‐3 studies will provide additional data regarding the effect of drain size, analgesia use and intrapleural fibrinolytics in the future. No randomised controlled trials examining the role of pleuro‐peritoneal shunts were identified.
| Type of method to optimise pleurodesis | Study | Intervention 1 | Pleurodesis failure rate for intervention 1 | Intervention 2 | Pleurodesis failure rate for intervention 2 | OR (95% CI) of intervention 1 compared with intervention 2* |
| Mode of administration | Evans 1993 | Tetracycline pleurodesis at the end of thoracoscopy | 2/15 | Tetracycline pleurodesis through an intercostal cannula | 5/14 | 0.28 (0.04, 1.76) |
| Chest tube size | Clementsen 1998 | Small‐bore chest drain | 2/9 | Large‐bore chest drain | 3/9 | 0.57 (0.07, 4.64) |
| Patient rotation | Mager 2002 | Rotation after instillation of talc | 2/10 | No rotation after instillation of talc | 1/10 | 2.25 (0.17, 29.77) |
| Duration of drainage after administration of the sclerosant | Goodman 2006 | Drain removed 24 hours after pleurodesis | 2/16 | Drain removed 72 hours after pleurodesis | 4/19 | 0.54 (0.08, 3.40) |
| Villanueva 1994 | Drain removal the day after pleurodesis | 2/9 | Drain removal when < 150 ml/day output | 3/15 | 1.14 (0.15, 8.59) | |
| Yildirim 2005 | Fractionated dose oxytetracycline (4 divided doses at 6‐hourly intervals) | 0/12 | Single bedside instillation of oxytetracycline | 2/8 | 0.10 (0.00, 2.50) | |
| Duration of drainage prior to administration of the sclerosant | Ozkul 2014 | Early instillation of talc slurry after drain insertion | 5/40 | Instillation of talc slurry when daily drainage from chest tube < 300 ml/day | 6/39 | 0.79 (0.22, 2.82) |
| Intrapleural fibrinolytics | Okur 2011 | Intrapleural streptokinase | 14/19 | No intrapleural streptokinase | 9/16 | 2.18 (0.53, 9.02) |
| Pleural abrasion at thoracoscopy | Crnjac 2004 | Talc slurry | 11/42 | Thoracoscopic mechanical pleurodesis | 6/45 | 2.31 (0.77, 6.93) |
| * Results that are statistically significant at the conventional level of P < 0.05 are shaded in grey | ||||||
SECONDARY OUTCOMES
Due to the diversity of reporting techniques and outcome measures, it was not possible to perform a formal statistical analysis of many of the pre‐defined secondary outcomes.
Adverse effects/complications
The majority of studies reported data on adverse effects of the interventions, however three studies did not (Evans 1993; Kuzdzal 2003; Villanueva 1994). Kefford 1980 reported side effects but the patients with pleural effusions could not be differentiated from those with ascites or pericardial effusions . Data on side effects were provided in personal communications with two study authors (Goodman 2006; Mager 2002). The methods used to describe the side effects observed varied widely between studies.
Network meta‐analysis was used to compare rates of the most commonly reported side effects, fever and pain.
Fever
The direct evidence regarding fever is shown in Appendix 9. The fever network consisted of 23 trials of 11 different treatments, including 1518 participants. The odds ratios are shown in Table 5 and estimated rankings of the interventions in Figure 7. All the estimates had very wide credible intervals, indicating a large degree of imprecision. However, placebo appeared to be associated with the least fever (estimated rank first of 11 interventions (95% Cr‐I 1 to 7)). The methods associated with the most fever appeared to be C. parvum and mepacrine, with estimated ranks of eleventh (95% Cr‐I 7 to 11) and tenth (95% Cr‐I 6 to 11) respectively. However, the between‐studies standard deviation (Tau) for the whole network was 1.35 (95% Cr‐I 0.58 to 1.95), suggesting a very high degree of heterogeneity. There was no evidence for global inconsistency (DIC for consistency and inconsistency models was 230 and 231 respectively). However, the loop‐specific inconsistency factors were large, suggesting potential inconsistencies between the direct and indirect evidence. The 95% CIs around the inconsistency factors were wide and crossed the null value of 1 in all but one loop. There was strong evidence of inconsistency regarding fever in the bleomycin/tetracycline/C. parvum loop (ROR 59.2 (95% CI 2.6 to 1353.7)).
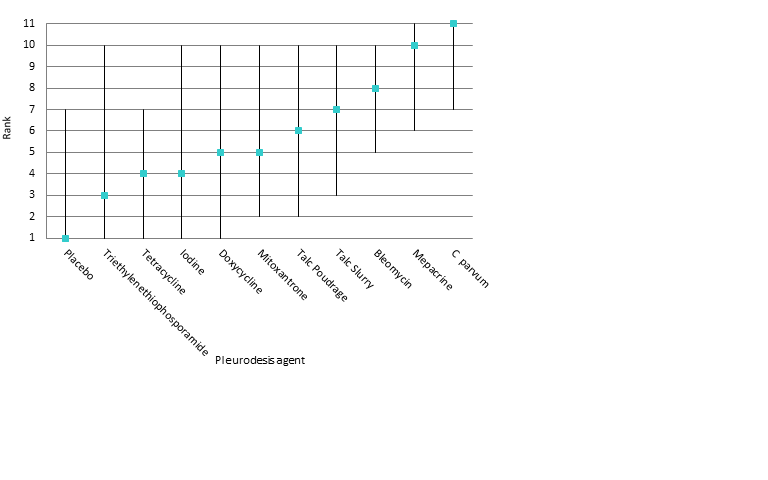
Estimated rank (95% Cr‐I) for causing fever (a low rank suggests less fever)
| Talc slurry | Talc poudrage | Bleomycin | Tetracycline | C. parvum | Iodine | Mepacrine | Placebo | Mitoxantrone | Doxycycline | |
| Talc poudrage | 0.66 (0.09, 3.98) | NA | ‐ | ‐ | ‐ | ‐ | ‐ | ‐ | ‐ | ‐ |
| Bleomycin | 1.26 (0.24, 6.82) | 1.93 (0.22, 19.42) | NA | ‐ | ‐ | ‐ | ‐ | ‐ | ‐ | ‐ |
| Tetracycline | 0.29 (0.04, 2.09) | 0.45 (0.04, 5.74) | 0.23 (0.06, 0.88) | NA | ‐ | ‐ | ‐ | ‐ | ‐ | ‐ |
| C. parvum | 6.31 (0.61, 70.69) | 9.71 (0.65, 176.70) | 5.01 (0.92, 29.12) | 21.46 (3.10, 175.70) | NA | ‐ | ‐ | ‐ | ‐ | ‐ |
| Iodine | 0.27 (0.02, 3.69) | 0.42 (0.03, 6.09) | 0.21 (0.01, 4.25) | 0.93 (0.03, 23.41) | 0.04 (0.00, 1.29) | NA | ‐ | ‐ | ‐ | ‐ |
| Mepacrine | 4.52 (0.30, 76.00) | 6.95 (0.34, 182.20) | 3.58 (0.40, 36.59) | 15.41 (1.62, 178.80) | 0.71 (0.05, 11.99) | 16.72 (0.43, 831.10) | NA | ‐ | ‐ | ‐ |
| Placebo | 0.06 (0.00, 2.00) | 0.10 (0.00, 4.27) | 0.05 (0.00, 1.08) | 0.22 (0.00, 5.71) | 0.01 (0.00, 0.32) | 0.23 (0.00, 17.55) | 0.01 (0.00, 0.30) | NA | ‐ | ‐ |
| Mitoxantrone | 0.48 (0.02, 10.24) | 0.73 (0.02, 22.95) | 0.38 (0.02, 5.02) | 1.64 (0.07, 29.71) | 0.08 (0.00, 1.60) | 1.75 (0.03, 99.74) | 0.11 (0.00, 2.16) | 7.57 (0.59, 138.80) | NA | ‐ |
| Doxycycline | 0.49 (0.03, 6.13) | 0.75 (0.04, 14.68) | 0.39 (0.05, 2.66) | 1.67 (0.14, 17.22) | 0.08 (0.01, 0.63) | 1.81 (0.05, 69.03) | 0.11 (0.00, 1.93) | 7.69 (0.19, 539.10) | 1.02 (0.04, 33.23) | NA |
| Triethylenephosphoramide | 0.24 (0.00, 17.04) | 0.37 (0.00, 35.93) | 0.19 (0.00, 9.80) | 0.81 (0.02, 47.08) | 0.04 (0.00, 2.63) | 0.88 (0.01, 139.50) | 0.05 (0.00, 1.49) | 3.62 (0.07, 529.40) | 0.49 (0.01, 49.44 | 0.49 (0.01, 45.90) |
| Results that are statistically significant at the conventional level of P < 0.05 are shaded in grey. ‐ indicates the odds ratio is already expressed elsewhere in the table comparing the interventions the other way around. NA= not applicable | ||||||||||
For those studies, which were not included in the network meta‐analysis but provided data on fever, the majority revealed no difference between the interventions (Emad 1996; Kasahara 2006; Masuno 1991; Paschoalini 2005; Terra 2015). Two studies evaluating OK‐432 revealed more fever in this group compared to the control groups (Ishida 2006; Luh 1992; Yoshida 2007) (Analysis 11.3). The mixed talc group had more fever than the graded talc group (OR 15.92 (95% CI 1.81 to 140.16; participants = 46; studies = 1) (Maskell 2004) (Analysis 21.3). The group who received cisplatin alone had less fever than those who also received rAd‐p53 (OR 0.09 (95% CI 0.02 to 0.51; participants = 35; studies = 1) (Zhao 2009) (Analysis 23.3)
Pain
Six studies were not included in the network meta‐analysis as they collected pain scores (rather than whether or not each patient had pain post procedure) (Agarwal 2011; Alavi 2011; Bjermer 1995; Davies 2012; Paschoalini 2005; Zimmer 1997). Bjermer 1995 reported higher levels of pain in the mepacrine group compared to the mitoxantrone group as measured by the WHO analgesic ladder (no raw figures provided) (WHO 2016). The other six studies did not provide evidence of a difference in pain between the methods studied.
Only 17 studies and nine treatments (including 1279 participants) could be included in the network meta‐analysis regarding pain (see Appendix 10, Appendix 11 and Appendix 12). There was no evidence to support a difference between the methods in terms of the proportion of participants complaining of pain after the intervention. All the estimates had very wide confidence intervals, indicating a large degree of imprecision. The between‐studies standard deviation (Tau) for the network was 0.65 (95% Cr‐I 0.05 to 1.63), indicating considerable heterogeneity. There was no evidence of global inconsistency (DIC 177 for the consistency model versus 177 for the inconsistency model). Several of the estimated inconsistency factors were large, although all had 95% CIs which crossed 1, indicating no clear evidence of loop‐specific inconsistency.
Of those studies which reported pain outcomes but were not included in the network for pain, the majority revealed no difference between interventions (Kasahara 2006; Luh 1992; Masuno 1991; Okur 2011; Paschoalini 2005; Terra 2015; Yoshida 2007; Zhao 2009). Those who underwent a small‐bore drain insertion had less pain at the time of insertion than those with a large‐bore drain (OR 0.08 (95% CI 0.01 to 0.75) (Clementsen 1998) (Analysis 19.2)). One study revealed more pain in the OK‐432 groups than controls (Ishida 2006) (Analysis 11.2).
Patient reported breathlessness
Eleven studies reported information regarding control of breathlessness, using a variety of techniques (MRC dyspnoea scale (Mohsen 2011); VAS score (Bjermer 1995; Davies 2012; Diacon 2000; Terra 2015); 'dyspnoea index' (Demmy 2012); QLQ‐C30/LC13 questionnaires (Rintoul 2014), functional class (Masuno 1991; Rafiei 2014; Zimmer 1997), scale of 0 ‐ 10 (Alavi 2011)).
The two studies comparing talc slurry with IPC reported breathlessness scores (Davies 2012 using a VAS score and Demmy 2012 using a 'dyspnoea index'). Davies 2012 found dyspnoea improved in both study arms, to a similar extent at 42 days. However the IPC group had a greater improvement at six months compared to the talc group (mean difference of ‐14 mm (95% CI ‐25.2 to ‐2.8) P = 0.01). Demmy 2012 found that the IPC group had better dyspnoea scores at 30 days than the talc slurry group (8.5 vs 6.1; P = 0.047).
Rafiei 2014 found more patients receiving doxycycline had severe dyspnoea at two months compared to those receiving bleomycin (5/20 (24%) vs 1/21 (5%) respectively; P = 0.01). Bjermer 1995 noted that those receiving mitoxantrone had a larger reduction in breathlessness than the mepacrine‐treated patients (absolute values not reported; P < 0.001). Masuno 1991 did not provide the absolute figures but reported “statistically significant” improvements in dyspnoea one week after treatment at ‘the final judgement’ in the LC9018 group. In the remaining studies reporting dyspnoea, no differences were identified between the study arms in terms of the degree of improvement of dyspnoea (Alavi 2011; Diacon 2000; Mohsen 2011; Rintoul 2014; Terra 2015; Zimmer 1997).
Quality of life and symptom control
Fifteen of 62 studies reported quality of life or assessed a symptoms score other than dyspnoea. The methods used were Karnofsky performance scale (Demmy 2012; Du 2013; Groth 1991; Masuno 1991; Zhao 2009), QLQ‐C30 questionnaire (Davies 2012, Dresler 2005, Rintoul 2014), SF36 scale (Terra 2009), WHOQoL‐bref scale (Terra 2015), EQ5D (Rintoul 2014), VAS Score (Diacon 2000), a symptom questionnaire (Bjermer 1995) and numeric pain scale (Alavi 2011; Paschoalini 2005; Zimmer 1997). Most studies did not report any evidence of a difference between the treatment groups (Alavi 2011; Davies 2012; Diacon 2000; Groth 1991; Paschoalini 2005; Terra 2009; Terra 2015Zimmer 1997). Bjermer 1995 reported a bigger improvement in tiredness in the mitoxatrone group compared to the mepacrine group (absolute figures not provided; P < 0.001). Dresler 2005 noted less fatigue in the talc poudrage group than the talc slurry group (absolute figures not provided; P = 0.016). Those participants who received LC9018 had better performance scores at one week than those who did not (absolute figures not provided; P < 0.05) (Masuno 1991). Zhao 2009 found that more patients who received combination treatment with cisplatin and Ad‐p53 had an improvement in their Performance Score at six weeks than those receiving cisplatin alone (11/17 (65%) vs 6/18 (33%) respectively, P < 0.05). The participants who underwent a VATS partial pleurectomy had better EQ5D scores at six months than the talc group in the MesoVATS study (MD 0.08 (0.003, 0.16); P = 0.042) but no difference in their QLQ‐C30 scores (Rintoul 2014). Demmy 2012 did not provide data by treatment group. Du 2013 reported 30 patients (83%) receiving bevacizumab and cisplatin had an improvement in their Karnofsky performance score as opposed to 15 (50%) in the cisplatin group.
Costs
Only seven of 62 trials reported the relative costs of the interventions. Rapid pleurodesis was found to be cheaper than standard care in Yildirim 2005 (USD 245 (SD 71.5) vs USD 860 (SD 496) respectively). Talc slurry was cheaper than bleomycin in three studies: Ong 2000 evaluated the cost per dose (USD 1 vs USD 309 per dose respectively); Haddad 2004 calculated the complete cost for the entire procedure (USD 488 (SD 212.5) vs USD 796 (SD 207.3) respectively) and Zimmer 1997 calculated the cost of each treatment (USD 12.36 vs USD 955.83 respectively). Talc poudrage was also cheaper than bleomycin in Diacon 2000 (CHF 3893 (Swiss Francs) (USD 4206) vs CHF 4169 (USD 4504) respectively). The total cost of VATS pleurectomy was more than talc pleurodesis (GBP 14,252 (USD 21,682) vs GBP 10,436 (USD 15,876)) (Rintoul 2014). Dresler 2005 reported no difference between the cost of talc slurry and poudrage (no figures quoted).
Mortality
Thirty‐four trials provided data on patient mortality. Evaluating the direct evidence, only two of these found evidence of a difference between the treatment arms. Evans 1993 found survival was longer after thoracoscopic tetracycline pleurodesis than bedside administration (total n = 34; P = 0.03 (raw data only available as a survival curve)). In the comparison between bleomycin and IFN, those receiving bleomycin appeared to live longer (OR 0.46 (95% CI 0.25 to 0.87); n = 160) (Analysis 1.3).
Twenty trials of 12 treatments, including 1430 participants, were incorporated into a network meta‐analysis looking at mortality (see Appendix 13; Appendix 14 and Appendix 15). All but one of the OR 95% Cr‐Is crossed 1, providing no evidence against the null hypothesis of no effect. There was limited evidence that those who received tetracycline lived longer than those receiving mitoxantrone (OR 0.16 (95% Cr‐I 0.03 to 0.72)) (see Appendix 14). Although some of the credible intervals were wide, they were generally narrower than those seen in the pleurodesis efficacy networks. The rankings were very imprecise, with wide confidence intervals: statistically there was no evidence that the rankings of any of the pleurodesis methods differed from each other. The degree of heterogeneity was low (Tau 0.40 (95% Cr‐I 0.02 to 1.21)). There was no evidence of global inconsistency (DIC 211 for the consistency model vs 217 for the inconsistency model) or loop‐specific inconsistency.
The majority of studies, which were not included in the network also showed no differences in mortality (Clementsen 1998; Crnjac 2004; Goodman 2006; Ishida 2006; Mager 2002; Maskell 2004; Rintoul 2014; Terra 2015; Villanueva 1994; Yildirim 2005; Yoshida 2007; Zhao 2009). Evans 1993 reported a longer survival after surgical administration of tetracycline than after medical treatment although no raw data were provided (P = 0.03).
Median survival
Twenty‐five studies reported median survivals for the treatment groups and only one of these found a survival difference between the treatment arms (Masuno 1991: median survival of 232 days in the LC9018 group versus 125 days in the control arm; n = 95; P = 0.008). Kasahara 2006 reported a longer median survival in those receiving high doseOK‐432 than low dose, but did not report the spread or whether this difference was significant (33.6 days versus 22.6 days respectively; n = 38).
Length of inpatient stay
Sixteen of 62 studies reported total length of hospital stay. Many reported no evidence of a statistically significant difference between the groups (Bayly 1978; Haddad 2004; Lynch 1996; Ong 2000; Paschoalini 2005; Schmidt 1997; Terra 2009; Yim 1996; Zimmer 1997). Yildirim 2005 and Goodman 2006 reported shorter length of stay in the group whose drains were removed earlier following sclerosant administration compared to standard care (Yildirim 2005 : mean 2.33 days (SD 0.62) vs 8.33 (SD 4.85) respectively (P < 0.001) 27 participants; Goodman 2006: median 4 days (IQR 4 ‐ 8) vs 8 (6 ‐ 9) respectively (P < 0.01) 41 participants). Ozkul 2014, which evaluated a rapid drainage strategy prior to sclerosant administration, also showed this group had a shorter length of stay than the standard care group (mean 2.2 days versus 9.0 days respectively (P < 0.001) 79 participants). The talc group had a shorter length of stay than the VATS partial pleurectomy group in the MesoVATS study (median 3 days (IQR 2 ‐ 5) vs 7 days (IQR 5 ‐ 11) respectively (P < 0.001); 196 participants) (Rintoul 2014). Those undergoing TMP had a shorter hospital stay than those receiving talc slurry in Crnjac 2004 (mean 5.5 days (SD 2.5) vs 7.5 (SD 3.3) respectively (P = 0.001); 87 participants). Mohsen 2011 found patients receiving iodine had a shorter length of stay than those undergoing talc poudrage (mean 4.5 days (SD 1.1) vs 5.7 (SD 2) respectively (P = 0.02); 42 participants). In TIME‐2, the IPC participants had a shorter inpatient stay than the talc slurry participants (‐3.5 days (95% CI ‐4.8 to ‐1.5) (P < 0.001); 106 participants) (Davies 2012).
There were insufficient data to report length of hospital stay from date of the intervention to discharge.
Patient acceptability
Two trials reported patient acceptability of the interventions (Demmy 2012, Dresler 2005). Demmy 2012 did not provide raw data by treatment group. There was no difference between talc slurry and poudrage in terms of patients’ perception of convenience in Dresler 2005 (no raw data provided).
The only trial evaluating the agent viscum reported that two of 13 participants in the viscum arm withdrew their consent for ongoing study participation after experiencing allergic reactions to the first dose. The outcomes for these participants were not available and hence the trial deemed them non‐evaluable.
Discusión
Resumen de los resultados principales
El tratamiento del DPM ha sido por mucho tiempo tema de debate e investigación. Esta revisión sistemática de la bibliografía actual intenta combinar todas las pruebas aleatorias disponibles acerca de la amplia variedad de intervenciones para esta afección.
Nuestra medida de resultado primaria fue la eficacia de la pleurodesis Nuestro análisis demostró que el talco pulverizado ocupó un lugar importante en comparación con otros agentes. Se estimó que ocupa el segundo lugar de 16 intervenciones (IC del 95%: 1 a 5) y se encontraron pruebas adecuadas (suficientemente robustas para pasar la exclusión de los estudios de mayores riesgos de sesgo) como para considerarlo mejor que otros siete métodos de pleurodesis, incluida la bleomicina y la tetraciclina. También hubo algunas pruebas en la red completa que apuntaban a que era más eficaz que la suspensión de talco y la doxiciclina, aunque estas pruebas resultaron considerablemente más débiles cuando se restringió el análisis solamente a los estudios de menor riesgo de sesgo. La incertidumbre acerca de la eficacia relativa del talco pulverizado en comparación con algunos otros agentes también se vio exacerbada por el alto grado relativo de heterogeneidad sin causa aparente dentro de las redes y ciertas inconsistencias específicas del asa. Los ensayos TAPPS actualmente abiertos al ingreso, que comparan el talco pulverizado con la suspensión de talco aportarán más datos para esta comparación en el futuro (TAPPS) y podrían arrojar más luz respecto de estas conclusiones.
La eficacia relativa de otros métodos examinados respecto del éxito de la pleurodesis también resulta poco concluyente. Una cantidad de agentes parecían poseer una eficacia similar, tanto en el análisis de sensibilidad como en la red principal, en el cual solo se consideraron los agentes para la pleurodesis junto al paciente. Esto puede deberse a que los agentes son verdaderamente equivalentes en cuanto a la capacidad para inducir una pleurodesis; sin embargo, estos hallazgos podrían también reflejar la falta de pruebas hasta la fecha (imprecisión estadística).
Todas las comparaciones revelaron un grado importante de heterogeneidad estadística y clínica. Aparte del análisis limitado a un riesgo de sesgo más bajo, que parecía reducir hasta cierto punto el grado de heterogeneidad, los otros análisis de sensibilidad, elegidos según los factores, que en teoría eran modificadores del efecto clínico, no parecían explicar el alto grado de heterogeneidad, ya que las estimaciones de la desviación estándar entre los estudios siguió siendo alta. Esto último ilustra la complejidad de esta afección y de los tratamientos y genera una importante heterogeneidad clínica. Las posibles explicaciones incluyen diferentes efectos de varios subtipos de tumores, el atrapamiento pulmonar temprano, que no se puede detectar clínicamente, las diversas dosis de los fármacos y los útiles factores de procedimiento, en términos de la técnica de pleurodesis, como la aptitud del drenaje del líquido pleural antes de la instilación del esclerosante.
Los datos disponibles de las medidas de resultados secundarias evaluadas fueron más restringidos. La red proporcionó algunas pruebas de que la mepacrina y C. parvum provocan más fiebre que muchos otros agentes; sin embargo, esta red poseía una heterogeneidad sin causa aparente muy alta e inconsistencia específica del asa. Solamente dos comparaciones directas y una del metanálisis de la red encontraron pruebas de una diferencia en la mortalidad entre los grupos de tratamiento.
Los estudios que comparan los IPC y la suspensión de talco sugirieron que quienes se sometieron a IPC presentaron menos disnea; sin embargo, se observa que el estudio AMPLE en curso puede aportar mayores datos al respecto en el futuro (Ensayo AMPLE). Los datos fueron insuficientes para hacer un análisis formal de otras medidas de resultado secundarias.
Si bien los datos eran insuficientes para realizar un metanálisis, también se evaluaron varias técnicas que podrían mejorar la efectividad de la pleurodesis si el agente se administraba a través de una sonda torácica. Hubo falta de pruebas en ambos sentidos sobre el efecto de la duración del drenaje antes y después de la administración de esclerosante, el tamaño de la sonda torácica, la administración de fibrinolíticos y la rotación de pacientes en la tasa de fracaso de la pleurodesis. Hay varios estudios en curso que aportarán más información acerca de estos factores en el futuro (TIME‐1; TIME‐3).
Compleción y aplicabilidad general de las pruebas
Esta es la revisión sistemática más amplia de la bibliografía publicada acerca de las pruebas relacionadas con las intervenciones en el DPM. Se utilizaron estrategias de búsqueda robustas para identificar todas las pruebas aleatorias disponibles y se estableció contacto inmediato con los revisores respecto de los datos faltantes, siempre que fue posible.
Sin embargo, a pesar de ello, fue necesario excluir varios estudios por la cantidad insuficiente de datos en los mismos. Durante el proceso de selección de estudios para la inclusión en la revisión, se identificaron varios resúmenes de congresos. Debido a la escasez de datos obtenidos a partir de ellos, se consideró que no era válido incluirlos sin antes obtener información más detallada. A pesar de los intentos de comunicación con los revisores, en 34 casos no se pudieron obtener datos adicionales no publicados y, por lo tanto, se excluyeron los estudios; lo que sugiere la presencia de sesgo de publicación potencial que podría afectar la validez de los resultados. La pequeña cantidad de estudios para cada comparación por pares (máximo de cinco) se tradujo en que los gráficos en embudo podrían no ser informativos (Sterne 2011). Debido a que no se pudo ordenar de manera lógica a las intervenciones, también se decidió que el gráfico en embudo ajustado para la comparación no era válido (Salanti 2014).
Varios estudios incluidos en esta revisión tenían números muy pequeño de participantes, lo que aumenta la posibilidad de efectos de estudio pequeños y la consecuente sobrestimación de la eficacia del tratamiento. Solamente cinco de los estudios incluidos tenían datos de resultados de más de 100 pacientes (Davies 2012; Dresler 2005; Rintoul 2014; Sartori 2004; Yoshida 2007). Sin embargo, el análisis de sensibilidad de las pruebas directas con los modelos de efectos aleatorios y fijos no reveló diferencias significativas.
Cuando se evaluaron diferentes agentes de pleurodesis, se optó por combinar diferentes dosis de cada agente de los estudios disponibles, con la intención de comparar. Esto fue necesario debido a la variación en las dosis entre los estudios, lo que hubiese hecho que la red fuese extremadamente compleja. Esta situación representa una limitación de la revisión, ya que podrían haberse pasado por alto efectos diferenciales del tratamiento según las dosis. La anterior es una posible explicación de los altos niveles de heterogeneidad observados en el estudio que resultaron imposibles de investigar en más detalle por la complejidad de los datos. Un estudio incluido se diseñó para comparar diferentes dosis de nitrato de plata y no reveló diferencias en cuanto a la eficacia de la pleurodesis ni de los eventos adversos (Terra 2015).
Muchos de los estudios incluidos no evaluaron la calidad de vida de los pacientes, el control de los síntomas, la aceptabilidad de la intervención por parte del paciente, la duración de hospitalización ni los costos. Si bien estos eran objetivos secundarios de la revisión, son factores importantes a la hora de elegir las estrategias de tratamiento y, por lo tanto, limitan la aplicabilidad de las pruebas de la revisión para la práctica clínica diaria. Esto puede revestir una especial importancia cuando se consideran los posibles beneficios de los IPC que, a pesar de poseer una baja tasa de pleurodesis, pueden ser similares a la suspensión de talco en cuanto al control de la disnea (Davies 2012; Demmy 2012) y puede resultar más aceptable para determinados pacientes, debido a la menor duración de la hospitalización.
También cabe considerar la disponibilidad global de algunos de estos agentes, a la hora de tener en cuenta la aplicabilidad clínica de nuestros hallazgos. En un cuestionario de cinco países de habla inglesa, los agentes de pleurodesis utilizados con mayor frecuencia fueron el talco pulverizado, la suspensión de talco, la tetraciclina, la doxiciclina y la bleomicina (Lee 2003). Los derivados de tetraciclina parenterales y C. parvum no poseen una amplia disponibilidad, lo que impide su administración habitual. Otros agentes incluidos en esta revisión no tienen licencia para su uso como agente de pleurodesis.
Nuestros datos acerca de los efectos adversos de estos tratamientos son limitados. Como sólo se eligieron ECA para su inclusión en esta revisión, es posible que con nuestra metodología no se hayan detectado algunos efectos secundarios poco frecuentes aunque importantes. Existen informes de efectos adversos de los agentes de pleurodesis provocados por la absorción del agente en la circulación sistémica. Por ejemplo, la absorción sistémica de talco con tamaño de la partícula mixto está relacionada con el síndrome de dificultad respiratoria aguda (SDRA) que es poco frecuente aunque potencialmente mortal, este riesgo se reduce con la administración de talco graduado (partícula gruesa) (Maskell 2004). La mepacrina se volvió popular en Escandinavia como agente de pleurodesis, aunque su uso estaría limitado por los episodios psicóticos y las crisis convulsivas poco frecuentes, que se creen que están relacionadas con la absorción sistémica de la administración en dosis altas (Bjorkman 1989).
Sólo logramos elaborar una síntesis de los datos sobre los eventos adversos principales y, por tanto, no se pueden inferir de manera fiable los perfiles de efectos secundarios completos de estos tratamientos a partir de esta revisión. Resulta vital contar con una apreciación del perfil de efectos secundarios de estas intervenciones para poder sopesar los riesgos y beneficios de los procedimientos, sobre todo porque muchos de los pacientes de esta población tienen una escasa esperanza de vida y en consecuencia es imprescindible disminuir las molestias durante el tiempo que les queda de vida.
El éxito de la pleurodesis es un factor importante en el tratamiento exitoso del DPM, aunque tal vez no sea "lo máximo". La definición de eficacia de la pleurodesis varió entre los estudios, muchos de estos dependían solamente de la radiología, y cada vez más se cree que esta herramienta es insuficiente si además no se tiene en cuenta la recurrencia de los síntomas. Muchos pacientes preferirían evitar la hospitalización y ser tratados como pacientes ambulatorios, con lo cual un drenaje pleural permanente resulta más interesante que una pleurodesis química. Además, quienes poseen un muy mal pronóstico tal vez prefieran tratar los síntomas con una simple toracocentesis y un control óptimo de los síntomas y, de este modo, evitar los procedimientos más invasivos. No fue posible incorporar estos factores subjetivos en el proceso de revisión, pero sin duda son un elemento primordial de la toma de decisión clínica para esta población. Por lo tanto, el "mejor" abordaje tal vez no sea el mismo para todos los grupos de pacientes; un tema que no hemos podido abordar adecuadamente en esta revisión.
Calidad de la evidencia
El riesgo de sesgo en una cantidad estudios incluidos es considerable. La gran mayoría de los estudios eran desenmascarados, esta situación en parte refleja la naturaleza de las intervenciones asignadas al azar, además de la naturaleza basada en los síntomas de los criterios de valoración medidos, lo que también impidió cegar el informe de los resultados. La documentación de los métodos utilizados para la generación de la secuencia y la ocultación de la asignación con frecuencia se omitieron y, por lo general, no se pudo obtener esta información en forma retrospectiva. El análisis de sensibilidad que evaluó solamente los estudios con menor riesgo de sesgo reveló que, en este subgrupo, el cálculo de la heterogeneidad se redujo y las calificaciones globales de la mayoría de las intervenciones eran relativamente robustas.
También hubo variación en los métodos utilizados por los diferentes estudios para determinar el fracaso de la pleurodesis, en cuanto a la definición, la forma en que se manejó el abandono de los pacientes y el punto temporal en el cual se evaluó. Se estableció de antemano cómo se manejaría esta situación, utilizando jerarquías de preferencias; sin embargo, estos factores pudieron haber afectado los resultados del metanálisis final.
Debido a la muerte inevitable de los pacientes dentro de la población paliativa, por lo general no se realizaron análisis por intención de tratar, con lo cual se agregó un sesgo de abandono potencial. Estos datos faltantes fueron tratados de diferentes maneras por los diversos estudios incluidos. Algunos estudios incluyeron pacientes sobre la base de la "última observación considerada" (es decir, el último resultado antes de la muerte) y otros directamente excluyeron a estos pacientes del análisis. Ningún estudio utilizó otros métodos de imputación para justificar estos datos faltantes.
La mayoría de los estudios informaron las medidas de resultado principales: éxito de la pleurodesis, efectos secundarios y mortalidad. Sin embargo, en una población paliativa, como esta, los resultados centrados en el paciente como la calidad de vida, el control de los síntomas, la duración de la hospitalización y la aceptabilidad del paciente proporcionan información valiosa y de importancia clínica, pero se informó de manera irregular en los estudios incluidos, y esto evitó una síntesis robusta. Los ECA más recientes y con un poder estadístico suficiente informarán estos resultados importantes y, por lo tanto, se espera que las futuras revisiones de esta revisión los incorporen dentro de sus hallazgos.
No se informaron las Grading of Recommendations, Assessment, Development and Evaluations (GRADE) de nuestros hallazgos en esta revisión y en el protocolo tampoco se declaró que se lo haría. No está bien establecido cuál es el rol de las GRADE en el contexto de un metanálisis en red (NMA, por sus siglas en inglés) y el abordaje acerca de cómo debe implementarse sigue siendo un tema de debate (Puhan 2014, Salanti 2014). Pensamos que su inclusión resultaría muy compleja y los resultados extremadamente subjetivos y, por lo tanto, decidimos no incorporarlos.
Sesgos potenciales en el proceso de revisión
Esta revisión se basa en las pruebas publicadas disponibles y no en datos individuales de los pacientes, que podrían proporcionar una estimación más precisa acerca del efecto del tratamiento y una comprensión más clara de la heterogeneidad (Deeks 2011). Sin embargo, como varios de los estudios se publicaron hace muchos años y por ende no había información disponible sobre los pacientes individuales, no resultaría posible realizar un metanálisis a nivel del paciente sin excluir la mayoría de las pruebas disponibles.
Para permitir la inclusión de la mayor cantidad posible de estudios elegibles, se combinaron los datos obtenidos con diferentes definiciones de fracaso de la pleurodesis y del momento adecuado en el mismo análisis. Para ello se predefinió la metodología en el protocolo, utilizando jerarquías de preferencias. Se realizaron análisis de sensibilidad para garantizar que los resultados fueran robustos.
Una posible fuente de sesgo en nuestra medida de resultado primaria, la eficacia de la pleurodesis, es el inevitable abandono de los pacientes debido a la mortalidad informado en muchos estudios. Si hubiera habido diferencias reales en la mortalidad (y por lo tanto abandonos) entre las intervenciones, esto podría sesgar las estimaciones de las tasas relativas del fracaso de la pleurodesis. Sin embargo el análisis de los datos sobre la mortalidad y la mediana de los tiempos de supervivencia no revelaron pruebas de diferencias en la gran mayoría de las comparaciones. Solamente dos de 33 estudios que informaron la mortalidad global hallaron una diferencia entre los brazos de tratamiento y solamente uno de los 24 estudios que informaron la mediana de tiempos de supervivencia informó una diferencia entre los brazos de tratamiento. El metanálisis en red de los datos de mortalidad solamente halló pruebas de una posible diferencia de supervivencia en la comparación entre tetraciclina y mitoxantrona.
Otra consideración muy importante es el alto grado de heterogeneidad entre los estudios en nuestras estimaciones del efecto del tratamiento. Se intentó explorar la heterogeneidad mediante análisis de subgrupos, pero no se pudo identificar ningún motivo específico para ello. Es probable que la heterogeneidad esté relacionada con una combinación de factores relacionados con la calidad del estudio y la diversidad de la metodología empleada en los ensayos incluidos.
También cabe destacar que la selección inicial de títulos y resúmenes fue realizada por un solo revisor.
Acuerdos y desacuerdos con otros estudios o revisiones
Se han publicado varias revisiones sistemáticas en esta área (Shaw 2004; Tan 2006; Xia 2014). Todas las revisiones solamente presentaron las comparaciones directas, en lugar de también incorporar las comparaciones indirectas de los agentes alternativos que empleaban métodos de metanálisis en red. Creemos que el metanálisis en red es más válido en este campo, debido a que la diversidad en los grupos de control utilizados para comparar un agente con "todos los otros" significa que los efectos relativos importantes del tratamiento podrían estar siendo sobre o subestimados.
Se utilizaron criterios de exclusión e inclusión robustos para identificar los estudios elegibles, como resultado se excluyeron algunos estudios incluidos en otras revisiones sistemáticas sobre este tema. Estos estudios se ingresaron en la sección "Estudios excluidos" de esta revisión, y se proporcionaron la justificaciones de su exclusión. Los motivos principales fueron la incapacidad de utilizar un verdadero proceso de asignación al azar para asignar los grupos de tratamiento y la inclusión de ascitis o acumulación de líquido pericárdico, que no pudo diferenciarse en la sección de resultados.
Todos los metanálisis publicados anteriormente sugirieron que el talco es el agente más efectivo y la mejor vía de administración es la toracoscópica. En general nuestros datos respaldan la administración toracoscópica de talco pulverizado como un método de pleurodesis efectivo, si bien se halló una falta de pruebas concluyentes para sugerir que es más efectivo que ciertos otros métodos. La elección del agente administrado a través de una sonda torácica basada en nuestra red de pruebas no es concluyente, lo que difiere de las conclusiones extraídas por otras revisiones sistemáticas en este campo. El talco parece ser efectivo, aunque otros agentes como la mepacrina y el C. parvum podrían ser igualmente efectivos.

Study flow diagram

Risk of bias graph: review authors' judgements about each risk of bias item presented as percentages across all included studies.

Risk of bias summary: review authors' judgements about each risk of bias item for each included study.

Network plot of the pleurodesis efficacy network. The nodes are weighted according to the number of participants randomised to the intervention. The edges (line thicknesses) are weighted according to the number of studies included in each comparison.

Estimated (95% Cr‐I) ranks for each of the pleurodesis methods from the main network

Inconsistency plot for the main network. Treatment codes: 01 = Talc slurry; 02 = Talc poudrage; 03 = Bleomycin; 04 = Tetracycline; 05 = C. parvum; 06 = Interferon; 07 = Iodine; 08 = Indwelling pleural catheter; 09 = Placebo; 10 = Mustine; 11 = Mitoxantrone; 12 = Mepacrine; 13 = Doxycyline; 14 = Triethylenethiophosphoramide; 15 = Adriamycin. Abbreviations: ROR = Ratio of Odds Ratios; 95% CI = 95% Confidence interval. Heterogeneity variance was set at 0.8847 (reflecting the estimation of Tau from the network)

Estimated rank (95% Cr‐I) for causing fever (a low rank suggests less fever)

Comparison 1 Bleomycin, Outcome 1 Pleurodesis failure.
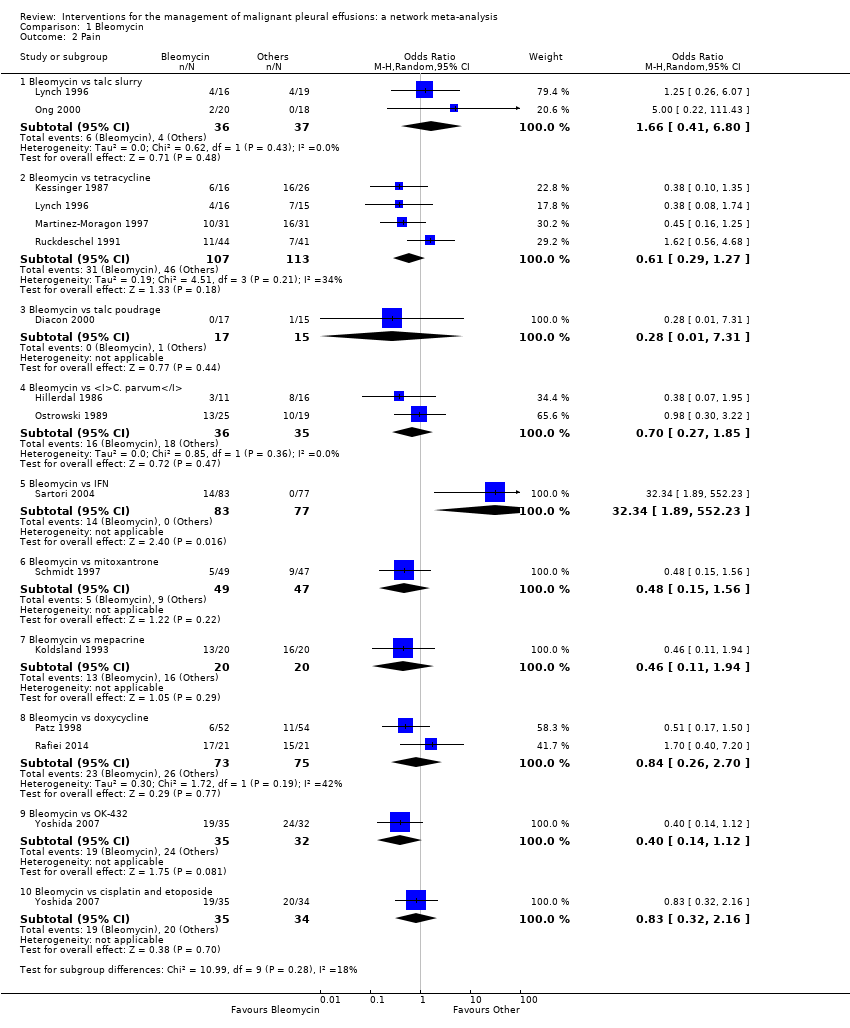
Comparison 1 Bleomycin, Outcome 2 Pain.

Comparison 1 Bleomycin, Outcome 3 Mortality.

Comparison 1 Bleomycin, Outcome 4 Fever.

Comparison 2 Talc slurry, Outcome 1 Pleurodesis failure.

Comparison 2 Talc slurry, Outcome 2 Mortality.

Comparison 2 Talc slurry, Outcome 3 Pain.

Comparison 2 Talc slurry, Outcome 4 Fever.

Comparison 3 Talc poudrage, Outcome 1 Pleurodesis failure.

Comparison 3 Talc poudrage, Outcome 2 Mortality.
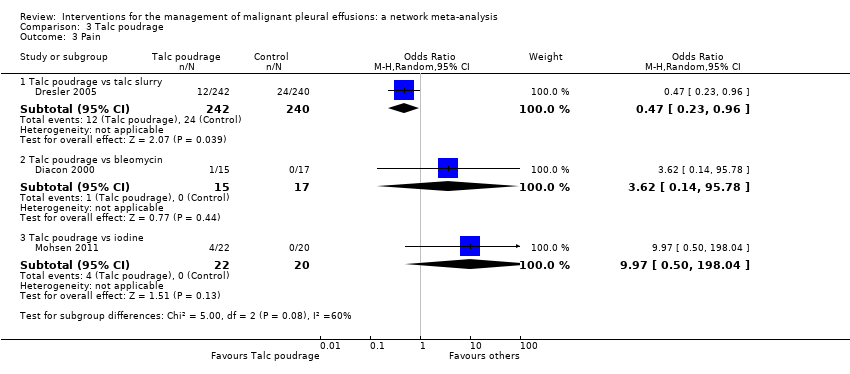
Comparison 3 Talc poudrage, Outcome 3 Pain.

Comparison 3 Talc poudrage, Outcome 4 Fever.
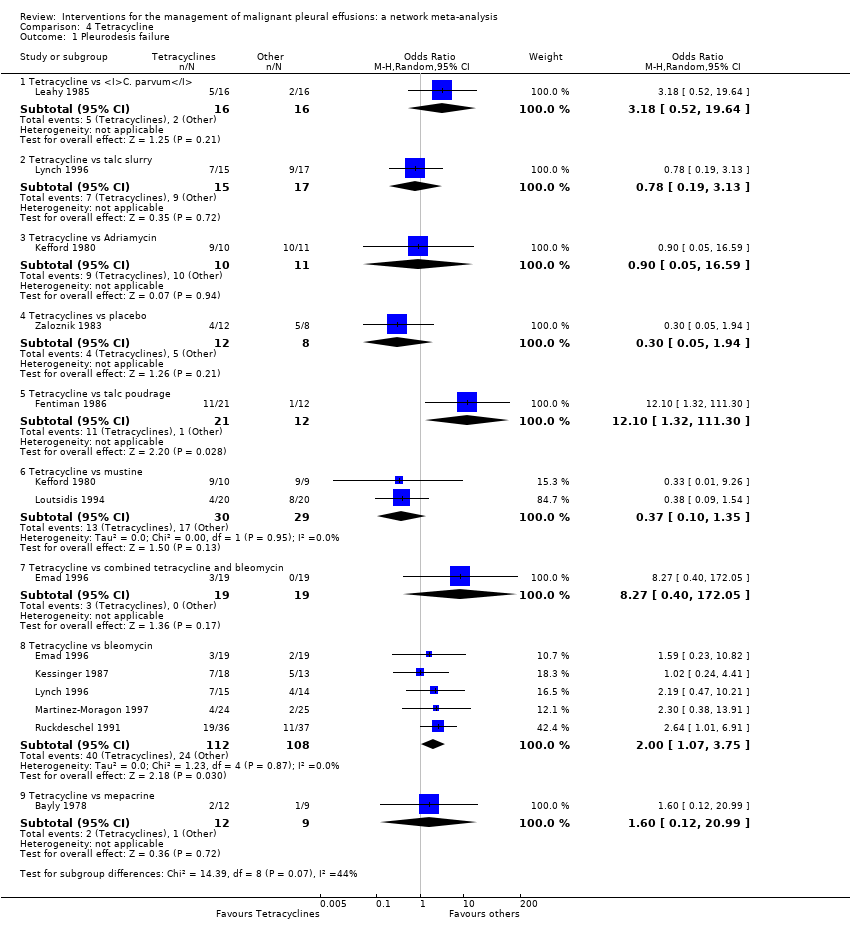
Comparison 4 Tetracycline, Outcome 1 Pleurodesis failure.
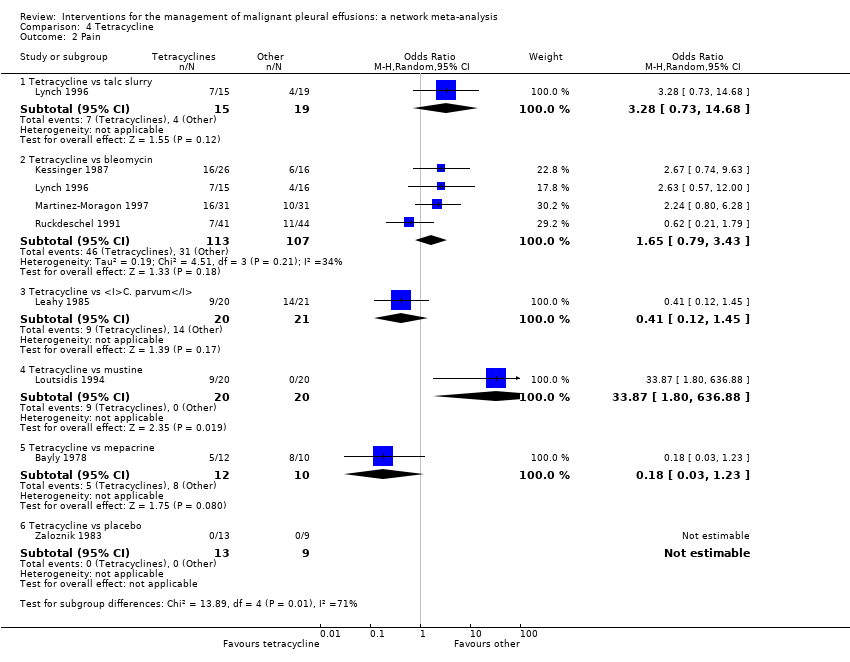
Comparison 4 Tetracycline, Outcome 2 Pain.

Comparison 4 Tetracycline, Outcome 3 Fever.
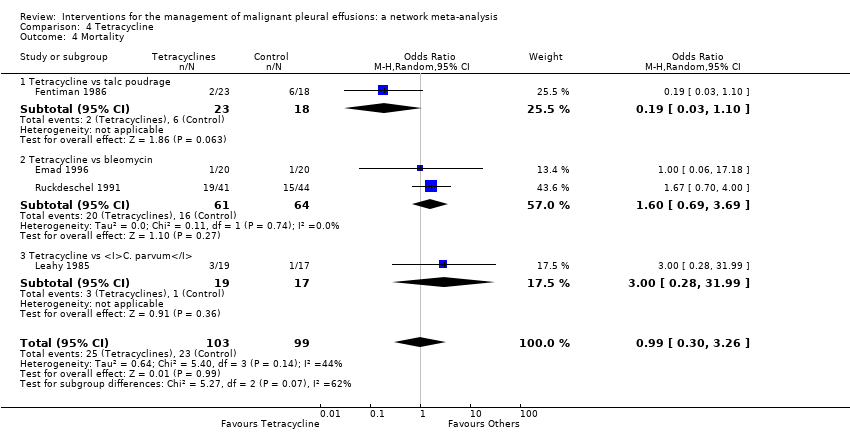
Comparison 4 Tetracycline, Outcome 4 Mortality.

Comparison 5 C. parvum, Outcome 1 Pleurodesis failure.

Comparison 5 C. parvum, Outcome 2 Pain.

Comparison 5 C. parvum, Outcome 3 Fever.

Comparison 5 C. parvum, Outcome 4 Mortality.

Comparison 6 Indwelling pleural catheter (IPC), Outcome 1 Pleurodesis failure.

Comparison 6 Indwelling pleural catheter (IPC), Outcome 2 Mortality.

Comparison 6 Indwelling pleural catheter (IPC), Outcome 3 Pain.

Comparison 7 Iodine, Outcome 1 Pleurodesis failure.

Comparison 7 Iodine, Outcome 2 Fever.

Comparison 7 Iodine, Outcome 3 Mortality.

Comparison 7 Iodine, Outcome 4 Pain.

Comparison 8 Doxycycline, Outcome 1 Pleurodesis failure.

Comparison 8 Doxycycline, Outcome 2 Pain.

Comparison 8 Doxycycline, Outcome 3 Fever.

Comparison 8 Doxycycline, Outcome 4 Mortality.

Comparison 9 Mode of administration, Outcome 1 Pleurodesis failure.

Comparison 10 Duration of drainage after pleurodesis administration, Outcome 1 Pleurodesis failure.

Comparison 10 Duration of drainage after pleurodesis administration, Outcome 2 Mortality.

Comparison 11 OK‐432, Outcome 1 Pleurodesis failure.

Comparison 11 OK‐432, Outcome 2 Pain.

Comparison 11 OK‐432, Outcome 3 Fever.

Comparison 11 OK‐432, Outcome 4 Mortality.

Comparison 12 Mepacrine, Outcome 1 Pain.

Comparison 12 Mepacrine, Outcome 2 Fever.

Comparison 12 Mepacrine, Outcome 3 Pleurodesis failure.

Comparison 12 Mepacrine, Outcome 4 Mortality.

Comparison 13 Interferon (IFN), Outcome 1 Pleurodesis failure.

Comparison 13 Interferon (IFN), Outcome 2 Pain.

Comparison 13 Interferon (IFN), Outcome 3 Fever.

Comparison 13 Interferon (IFN), Outcome 4 Mortality.

Comparison 14 Triethylenethiophophoramide, Outcome 1 Pleurodesis failure.

Comparison 14 Triethylenethiophophoramide, Outcome 2 Pain.
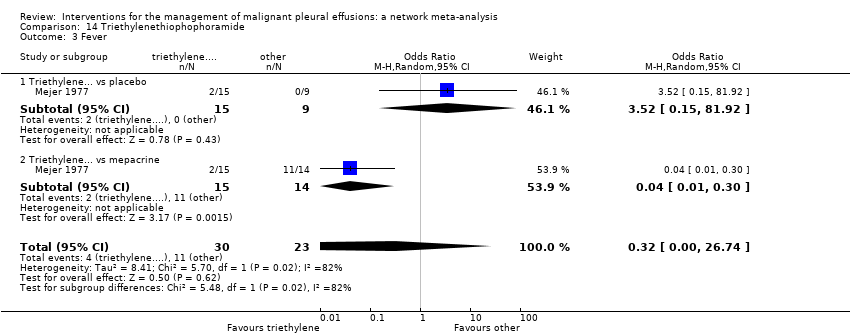
Comparison 14 Triethylenethiophophoramide, Outcome 3 Fever.

Comparison 15 Adriamycin, Outcome 1 Pleurodesis failure.

Comparison 15 Adriamycin, Outcome 2 Fever.

Comparison 15 Adriamycin, Outcome 3 Pain.

Comparison 16 Placebo, Outcome 1 Pleurodesis failure.

Comparison 16 Placebo, Outcome 2 Pain.

Comparison 16 Placebo, Outcome 3 Fever.
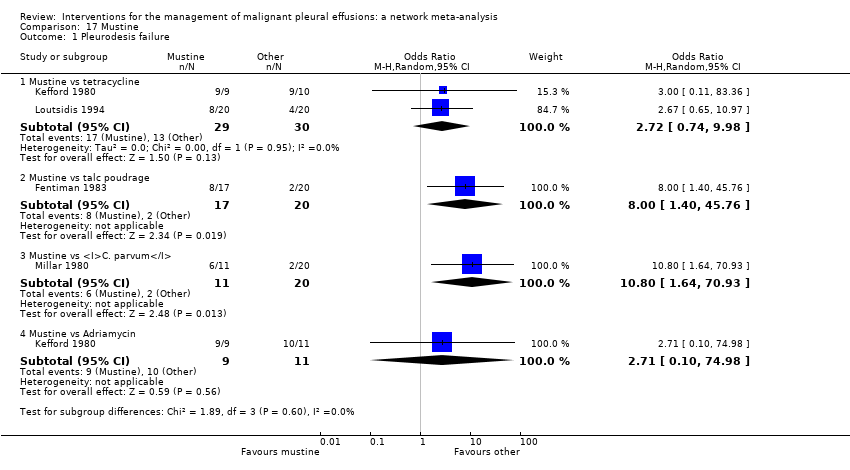
Comparison 17 Mustine, Outcome 1 Pleurodesis failure.

Comparison 17 Mustine, Outcome 2 Fever.

Comparison 17 Mustine, Outcome 3 Mortality.

Comparison 17 Mustine, Outcome 4 Pain.

Comparison 18 Mitoxantrone, Outcome 1 Pleurodesis failure.

Comparison 18 Mitoxantrone, Outcome 2 Pain.

Comparison 18 Mitoxantrone, Outcome 3 Fever.
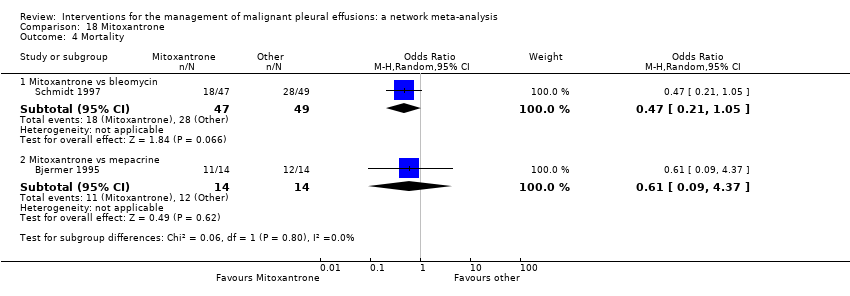
Comparison 18 Mitoxantrone, Outcome 4 Mortality.

Comparison 19 Drain size, Outcome 1 Pleurodesis failure.

Comparison 19 Drain size, Outcome 2 Pain.

Comparison 19 Drain size, Outcome 3 Mortality.

Comparison 20 Thoracoscopic mechanical pleurodesis (TMP), Outcome 1 Pleurodesis failure.

Comparison 20 Thoracoscopic mechanical pleurodesis (TMP), Outcome 2 Mortality.

Comparison 21 Other, Outcome 1 Pleurodesis failure.
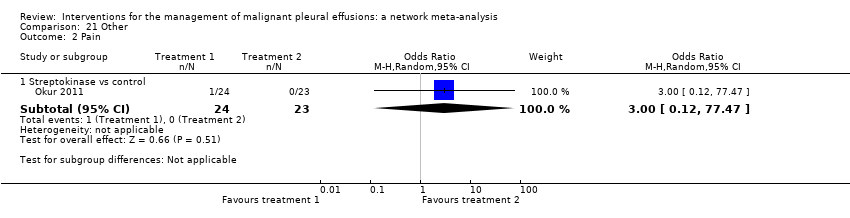
Comparison 21 Other, Outcome 2 Pain.

Comparison 21 Other, Outcome 3 Fever.

Comparison 21 Other, Outcome 4 Mortality.

Comparison 22 Silver nitrate, Outcome 1 Pleurodesis failure.

Comparison 22 Silver nitrate, Outcome 2 Fever.

Comparison 23 Cisplatin, Outcome 1 Pleurodesis failure.

Comparison 23 Cisplatin, Outcome 2 Pain.

Comparison 23 Cisplatin, Outcome 3 Fever.

Comparison 23 Cisplatin, Outcome 4 Mortality.

Comparison 24 Duration of drainage prior to administration of sclerosant, Outcome 1 Pleurodesis failure.

Comparison 25 Dose of silver nitrate, Outcome 1 Pleurodesis failure.

Comparison 25 Dose of silver nitrate, Outcome 2 Mortality.

Comparison 25 Dose of silver nitrate, Outcome 3 Pain.

Comparison 25 Dose of silver nitrate, Outcome 4 Fever.
| Treatment | Talc slurry | Talc poudrage | Bleomycin | Tetracycline | C. parvum | Placebo | Mustine | Mitoxantrone | Mepacrine |
| Talc poudrage | 0.76 (0.54, 1.09); n = 3; Tau2 = 0; I2 = 0% | NA | ‐ | ‐ | ‐ | ‐ | ‐ | ‐ | ‐ |
| Bleomycin | 1.22 (0.55, 2.70); n = 5*; Tau2 = 0.1; I2 = 12% | 9.70 (2.10, 44.78); n = 2; Tau2 = 0; I2= 0% | NA | ‐ | ‐ | ‐ | ‐ | ‐ | ‐ |
| Tetracycline | 0.78 (0.19, 3.13); n = 1* | 12.10 (1.32, 111.30); n = 1 | 2.00 (1.07, 3.75); n = 5*; Tau2 = 0; I2 = 0% | NA | ‐ | ‐ | ‐ | ‐ | ‐ |
| C. parvum | NA | NA | 0.55 (0.01, 57.48); n = 2; Tau2 = 11; I2 = 94% | 0.31 (0.05, 1.94); n = 1 | NA | ‐ | ‐ | ‐ | ‐ |
| Interferon | NA | NA | 3.25 (1.54, 6.89); n = 1 | NA | NA | ‐ | ‐ | ‐ | ‐ |
| Iodine | 0.47 (0.04, 5.71); n = 1 | 1.76 (0.26, 11.83); n = 1 | 1.25 (0.28, 5.59); n = 1 | NA | NA | ‐ | ‐ | ‐ | ‐ |
| Indwelling pleural catheter | 3.35 (1.64, 6.83); n = 2 Tau2 = 0; I2 = 0% | NA | NA | NA | NA | ‐ | ‐ | ‐ | ‐ |
| Placebo | 13.93 (0.66, 293.99); n = 1 | NA | NA | 3.33 (0.51, 21.58); n = 1 | NA | NA | ‐ | ‐ | ‐ |
| Mustine | NA | 8.00 (1.40, 45.76); n = 1 | NA | 2.72 (0.74, 9.98) n = 2*; Tau2= 0; I2= 0% | 3.00 (0.40, 22.71); n = 1 | NA | NA | ‐ | ‐ |
| Mitoxantrone | NA | NA | 3.18 (1.17, 8.65); n = 1 | NA | NA | 0.75 (0.32, 1.79); n = 1 | NA | NA | ‐ |
| Mepacrine | 2.08 (0.62, 6.96); n = 1 | NA | 0.16 (0.03, 0.89); n = 1 | 0.63 (0.05, 8.20); n = 1 | NA | 0.15 (0.03, 0.64); n = 1* | NA | 7.61 (0.35, 163.82); n = 1 | NA |
| Doxycycline | NA | 42.69 (2.13, 856.61); n = 1 | 0.67 (0.24, 1.86); n = 2; Tau2= 0; I2= 0% | NA | 1.91 (0.43, 8.48); n = 1 | NA | NA | NA | NA |
| Triethylenethiophosphoramide | NA | NA | NA | NA | NA | 2.06 (0.43, 9.80); n = 1* | NA | NA | 4.95 (1.02, 24.10); n = 1* |
| Adriamycin | NA | NA | NA | 1.11 (0.06, 20.49); n = 1* | NA | NA | 0.37 (0.01, 10.18); n = 1* | NA | NA |
| n = the number of studies included in the pair‐wise comparison. * Indicates that the comparison included a three‐arm study. NA = no direct pair‐wise comparison available. Results that are statistically significant at the conventional level of P < 0.05 are shaded in grey. ‐ indicates the odds ratio is already expressed elsewhere in the table comparing the interventions the other way around. | |||||||||
| Talc slurry | Talc poudrage | Bleomycin | Tetracycline | C. parvum | Interferon | Iodine | Indwelling pleural catheter | Placebo | Mustine | Mitoxantrone | Mepacrine | Doxycyline | Triethylenethiophosphoramide | viscum | |
| Talc poudrage | 0.42 (0.13, 1.19) | NA | ‐ | ‐ | ‐ | ‐ | ‐ | ‐ | ‐ | ‐ | ‐ | ‐ | ‐ | ‐ | ‐ |
| Bleomycin | 2.56 (1.05, 6.67) | 6.03 (2.19, 20.46) | NA | ‐ | ‐ | ‐ | ‐ | ‐ | ‐ | ‐ | ‐ | ‐ | ‐ | ‐ | ‐ |
| Tetracycline | 3.71 (1.22, 11.67) | 8.77 (2.74, 33.01) | 1.45 (0.59, 3.46) | NA | ‐ | ‐ | ‐ | ‐ | ‐ | ‐ | ‐ | ‐ | ‐ | ‐ | ‐ |
| C. parvum | 1.48 (0.34, 6.57) | 3.49 (0.79, 17.64) | 0.58 (0.16, 1.95) | 0.40 (0.10, 1.52) | NA | ‐ | ‐ | ‐ | ‐ | ‐ | ‐ | ‐ | ‐ | ‐ | ‐ |
| Interferon | 8.49 (0.94, 82.98) | 19.96 (2.22, 229.60) | 3.33 (0.43, 25.66) | 2.29 (0.26, 21.65) | 5.75 (0.55, 64.16) | NA | ‐ | ‐ | ‐ | ‐ | ‐ | ‐ | ‐ | ‐ | ‐ |
| Iodine | 1.25 (0.22, 6.77) | 2.97 (0.55, 17.21) | 0.49 (0.09, 2.49) | 0.34 (0.05, 2.04) | 0.85 (0.11, 6.35) | 0.15 (0.01, 1.90) | NA | ‐ | ‐ | ‐ | ‐ | ‐ | ‐ | ‐ | ‐ |
| Indwelling pleural catheter | 3.47 (0.75, 16.46) | 8.19 (1.32, 59.02) | 1.36 (0.22, 8.01) | 0.94 (0.14, 6.27) | 2.36 (0.28, 19.88) | 0.41 (0.03, 5.96) | 2.76 (0.29, 28.48) | NA | ‐ | ‐ | ‐ | ‐ | ‐ | ‐ | ‐ |
| Placebo | 19.50 (3.73, 128.50) | 46.51 (7.86, 375.90) | 7.64 (1.55, 44.22) | 5.29 (1.04, 31.95) | 13.28 (1.91, 110.80) | 2.29 (0.18, 34.14) | 15.63 (1.72, 179.10) | 5.61 (0.59, 65.18) | NA | ‐ | ‐ | ‐ | ‐ | ‐ | ‐ |
| Mustine | 7.50 (1.35, 43.86) | 17.75 (3.59, 105.70) | 2.94 (0.58, 14.84) | 2.02 (0.43, 9.79) | 5.07 (0.91, 29.81) | 0.88 (0.06, 11.71) | 5.98 (0.68, 58.17) | 2.16 (0.22, 22.76) | 0.38 (0.04, 3.32) | NA | ‐ | ‐ | ‐ | ‐ | ‐ |
| Mitoxantrone | 12.87 (2.36, 89.02) | 30.53 (5.11, 259.50) | 5.04 (1.04, 28.67) | 3.48 (0.64, 22.72) | 8.76 (1.24, 73.66) | 1.51 (0.12, 22.89) | 10.28 (1.12, 119.70) | 3.71 (0.38, 44.85) | 0.66 (0.13, 3.52) | 1.73 (0.19, 17.80 | NA | ‐ | ‐ | ‐ | ‐ |
| Mepacrine | 0.98 (0.22, 4.15) | 2.32 (0.45, 12.99) | 0.38 (0.09, 1.52) | 0.27 (0.05, 1.17) | 0.67 (0.10, 4.06) | 0.12 (0.01, 1.31) | 0.78 (0.09, 6.55) | 0.28 (0.03, 2.32) | 0.05 (0.01, 0.28) | 0.13 (0.02, 0.99) | 0.08 (0.01, 0.47) | NA | ‐ | ‐ | ‐ |
| Doxycycline | 3.49 (0.68, 19.56) | 8.23 (1.70, 50.18) | 1.37 (0.31, 6.09) | 0.94 (0.18, 5.09) | 2.36 (0.46, 13.09) | 0.41 (0.03, 5.14) | 2.78 (0.33, 26.50) | 1.00 (0.11, 10.23) | 0.18 (0.02, 1.53) | 0.47 (0.06, 3.77) | 0.27 (0.03, 2.31) | 3.56 (0.50, 28.59) | NA | ‐ | ‐ |
| Triethylenethiophosphoramide | 5.53 (0.40, 80.97) | 13.07 (0.89, 227.30) | 2.16 (0.16, 29.77) | 1.50 (0.10, 21.61) | 3.74 (0.21, 66.99) | 0.65 (0.02, 17.63) | 4.40 (0.22, 98.58) | 1.59 (0.08, 35.28) | 0.28 (0.02, 3.62) | 0.74 (0.04, 15.00) | 0.43 (0.02, 6.80) | 5.60 (0.55, 63.81) | 1.59 (0.08, 31.05) | NA | ‐ |
| Adriamycin | 2.31 (0.03, 165.40) | 5.53 (0.08, 403.50) | 0.90 (0.01, 59.43) | 0.62 (0.01, 38.58) | 1.57 (0.02, 114.20) | 0.27 (0.00, 27.43) | 1.85 (0.02, 162.70) | 0.67 (0.01, 62.01) | 0.12 (0.00, 9.46) | 0.31 (0.00, 20.50) | 0.18 (0.00, 14.59) | 2.36 (0.03, 191.30) | 0.66 (0.01, 52.71) | 0.42 (0.00, 54.35) | NA |
| Viscum | 0.39 (0.01, 8.23) | 0.92 (0.03, 21.77) | 0.15 (0.01, 2.73) | 0.10 (0.00, 2.17) | 0.26 (0.01, 6.21) | 0.04 (0.00, 1.55) | 0.31 (0.01, 9.07) | 0.11 (0.00, 3.44) | 0.02 (0.00, 0.53) | 0.05 (0.00, 1.41) | 0.03 (0.00, 0.79) | 0.39 (0.01, 10.28) | 0.11 (0.00, 2.83) | 0.07 (0.00, 3.48) | 0.16 (0.00, 26.60) |
| Results that are statistically significant at the conventional level of P < 0.05 are shaded in grey. ‐ indicates the odds ratio is already expressed elsewhere in the table comparing the interventions the other way around. NA= not applicable. | |||||||||||||||
| Study | Reason study excluded from network | Intrapleural agent or intervention 1 | Pleurodesis failure rate for agent 1 | Intrapleural agent or intervention 2 | Pleurodesis failure rate for agent 2 | OR (95% CI) of agent 1 compared with agent 2*** |
| Du 2013 | Lung cancer specific therapy | Cisplatin and bevacizumab | 6/36 | Cisplatin | 17/34 | 0.20 (0.07, 0.60) |
| Emad 1996* | No pleurodesis failures in the Combined group | Tetracycline** | 3/19 | Combined tetracycline and bleomycin | 0/19 | 8.27 (0.40, 172.05) |
| Bleomycin** | 2/19 | Combined tetracycline and bleomycin | 0/19 | 5.57 (0.25, 124.19) | ||
| Ishida 2006* | Lung cancer specific therapy | OK‐432 | 8/17 | Cisplatin | 11/17 | 0.48 (0.12, 1.92) |
| OK‐432 | 8/17 | OK‐432 and cisplatin | 1/15 | 12.44 (1.32, 117.03) | ||
| Cisplatin | 11/17 | OK‐432 and cisplatin | 1/15 | 25.67 (2.68, 245.84) | ||
| Kasahara 2006 | Lung cancer specific therapy | High dose OK‐432 | 5/19 | Low dose OK‐432 | 3/19 | 1.90 (0.38, 9.44) |
| Luh 1992 | Lung cancer specific therapy | OK‐432 | 3/26 | Mitomycin C | 9/27 | 0.26 (0.06, 1.11) |
| Maskell 2004 | Two Talc slurry preparations | Mixed particle talc | 3/14 | Graded talc (particles >20µm) | 2/14 | 1.64 (0.23, 11.70)) |
| Masuno 1991 | Lung cancer specific therapy | LC9018 and Adriamycin | 10/38 | Adriamycin | 23/38 | 0.23 (0.09, 0.62) |
| Paschoalini 2005 | No pleurodesis failures in Silver Nitrate group | Talc slurry | 1/9 | Silver nitrate | 0/16 | 5.85 (0.21, 158.82) |
| Rintoul 2014 | MPM specific surgical technique | Talc pleurodesis (slurry or poudrage) | 25/62 | VATS pleurectomy | 24/60 | 0.88 (0.43, 1.82) |
| Terra 2015* | Comparison of different doses of Silver Nitrate | 90 mg silver nitrate | 0/20 | 150 mg silver nitrate | 0/20 | not estimable |
| 90 mg silver nitrate | 0/20 | 180 mg silver nitrate | 2/20 | 0.18 (0.01, 4.01) | ||
| 150 mg silver nitrate | 0/20 | 180 mg silver nitrate | 2/20 | 0.19 (0.01, 4.01) | ||
| Yoshida 2007* | Lung cancer specific therapy | OK‐432 | 8/33 | Bleomycin | 11/35 | 0.70 (0.24, 2.03) |
| OK‐432 | 8/33 | Cisplatin and etoposide | 10/34 | 0.77 (0.26, 2.27) | ||
| Bleomycin | 11/35 | Cisplatin and etoposide | 10/34 | 1.10 (0.39, 3.07) | ||
| Zhao 2009 | Lung cancer specific therapy | rAd‐p53 and cisplatin | 3/17 | Cisplatin | 9/18 | 0.21 (0.05, 1.01) |
| *Three‐arm study. **The results for the pair‐wise comparison between tetracycline and bleomycin are included in the network meta‐analysis. ***Results that are statistically significant at the conventional level of P < 0.05 are shaded in grey | ||||||
| Type of method to optimise pleurodesis | Study | Intervention 1 | Pleurodesis failure rate for intervention 1 | Intervention 2 | Pleurodesis failure rate for intervention 2 | OR (95% CI) of intervention 1 compared with intervention 2* |
| Mode of administration | Evans 1993 | Tetracycline pleurodesis at the end of thoracoscopy | 2/15 | Tetracycline pleurodesis through an intercostal cannula | 5/14 | 0.28 (0.04, 1.76) |
| Chest tube size | Clementsen 1998 | Small‐bore chest drain | 2/9 | Large‐bore chest drain | 3/9 | 0.57 (0.07, 4.64) |
| Patient rotation | Mager 2002 | Rotation after instillation of talc | 2/10 | No rotation after instillation of talc | 1/10 | 2.25 (0.17, 29.77) |
| Duration of drainage after administration of the sclerosant | Goodman 2006 | Drain removed 24 hours after pleurodesis | 2/16 | Drain removed 72 hours after pleurodesis | 4/19 | 0.54 (0.08, 3.40) |
| Villanueva 1994 | Drain removal the day after pleurodesis | 2/9 | Drain removal when < 150 ml/day output | 3/15 | 1.14 (0.15, 8.59) | |
| Yildirim 2005 | Fractionated dose oxytetracycline (4 divided doses at 6‐hourly intervals) | 0/12 | Single bedside instillation of oxytetracycline | 2/8 | 0.10 (0.00, 2.50) | |
| Duration of drainage prior to administration of the sclerosant | Ozkul 2014 | Early instillation of talc slurry after drain insertion | 5/40 | Instillation of talc slurry when daily drainage from chest tube < 300 ml/day | 6/39 | 0.79 (0.22, 2.82) |
| Intrapleural fibrinolytics | Okur 2011 | Intrapleural streptokinase | 14/19 | No intrapleural streptokinase | 9/16 | 2.18 (0.53, 9.02) |
| Pleural abrasion at thoracoscopy | Crnjac 2004 | Talc slurry | 11/42 | Thoracoscopic mechanical pleurodesis | 6/45 | 2.31 (0.77, 6.93) |
| * Results that are statistically significant at the conventional level of P < 0.05 are shaded in grey | ||||||
| Talc slurry | Talc poudrage | Bleomycin | Tetracycline | C. parvum | Iodine | Mepacrine | Placebo | Mitoxantrone | Doxycycline | |
| Talc poudrage | 0.66 (0.09, 3.98) | NA | ‐ | ‐ | ‐ | ‐ | ‐ | ‐ | ‐ | ‐ |
| Bleomycin | 1.26 (0.24, 6.82) | 1.93 (0.22, 19.42) | NA | ‐ | ‐ | ‐ | ‐ | ‐ | ‐ | ‐ |
| Tetracycline | 0.29 (0.04, 2.09) | 0.45 (0.04, 5.74) | 0.23 (0.06, 0.88) | NA | ‐ | ‐ | ‐ | ‐ | ‐ | ‐ |
| C. parvum | 6.31 (0.61, 70.69) | 9.71 (0.65, 176.70) | 5.01 (0.92, 29.12) | 21.46 (3.10, 175.70) | NA | ‐ | ‐ | ‐ | ‐ | ‐ |
| Iodine | 0.27 (0.02, 3.69) | 0.42 (0.03, 6.09) | 0.21 (0.01, 4.25) | 0.93 (0.03, 23.41) | 0.04 (0.00, 1.29) | NA | ‐ | ‐ | ‐ | ‐ |
| Mepacrine | 4.52 (0.30, 76.00) | 6.95 (0.34, 182.20) | 3.58 (0.40, 36.59) | 15.41 (1.62, 178.80) | 0.71 (0.05, 11.99) | 16.72 (0.43, 831.10) | NA | ‐ | ‐ | ‐ |
| Placebo | 0.06 (0.00, 2.00) | 0.10 (0.00, 4.27) | 0.05 (0.00, 1.08) | 0.22 (0.00, 5.71) | 0.01 (0.00, 0.32) | 0.23 (0.00, 17.55) | 0.01 (0.00, 0.30) | NA | ‐ | ‐ |
| Mitoxantrone | 0.48 (0.02, 10.24) | 0.73 (0.02, 22.95) | 0.38 (0.02, 5.02) | 1.64 (0.07, 29.71) | 0.08 (0.00, 1.60) | 1.75 (0.03, 99.74) | 0.11 (0.00, 2.16) | 7.57 (0.59, 138.80) | NA | ‐ |
| Doxycycline | 0.49 (0.03, 6.13) | 0.75 (0.04, 14.68) | 0.39 (0.05, 2.66) | 1.67 (0.14, 17.22) | 0.08 (0.01, 0.63) | 1.81 (0.05, 69.03) | 0.11 (0.00, 1.93) | 7.69 (0.19, 539.10) | 1.02 (0.04, 33.23) | NA |
| Triethylenephosphoramide | 0.24 (0.00, 17.04) | 0.37 (0.00, 35.93) | 0.19 (0.00, 9.80) | 0.81 (0.02, 47.08) | 0.04 (0.00, 2.63) | 0.88 (0.01, 139.50) | 0.05 (0.00, 1.49) | 3.62 (0.07, 529.40) | 0.49 (0.01, 49.44 | 0.49 (0.01, 45.90) |
| Results that are statistically significant at the conventional level of P < 0.05 are shaded in grey. ‐ indicates the odds ratio is already expressed elsewhere in the table comparing the interventions the other way around. NA= not applicable | ||||||||||
| Outcome or subgroup title | No. of studies | No. of participants | Statistical method | Effect size |
| 1 Pleurodesis failure Show forest plot | 21 | Odds Ratio (M‐H, Random, 95% CI) | Subtotals only | |
| 1.1 Bleomycin vs iodine | 1 | 39 | Odds Ratio (M‐H, Random, 95% CI) | 0.8 [0.18, 3.57] |
| 1.2 Bleomycin vs talc slurry | 5 | 199 | Odds Ratio (M‐H, Random, 95% CI) | 1.22 [0.55, 2.70] |
| 1.3 Bleomycin vs tetracycline | 5 | 220 | Odds Ratio (M‐H, Random, 95% CI) | 0.50 [0.27, 0.93] |
| 1.4 Bleomycin vs talc poudrage | 2 | 57 | Odds Ratio (M‐H, Random, 95% CI) | 9.70 [2.10, 44.78] |
| 1.5 Bleomycin vs C. parvum | 2 | 78 | Odds Ratio (M‐H, Random, 95% CI) | 1.81 [0.02, 189.25] |
| 1.6 Bleomycin vs doxycycline | 2 | 122 | Odds Ratio (M‐H, Random, 95% CI) | 1.50 [0.54, 4.20] |
| 1.7 Bleomycin vs IFN | 1 | 160 | Odds Ratio (M‐H, Random, 95% CI) | 0.31 [0.15, 0.65] |
| 1.8 Bleomycin vs mitoxantrone | 1 | 85 | Odds Ratio (M‐H, Random, 95% CI) | 0.31 [0.12, 0.86] |
| 1.9 Bleomycin vs mepacrine | 1 | 36 | Odds Ratio (M‐H, Random, 95% CI) | 6.40 [1.12, 36.44] |
| 1.10 Bleomycin vs combined tetracycline and bleomycin | 1 | 38 | Odds Ratio (M‐H, Random, 95% CI) | 5.57 [0.25, 124.19] |
| 1.11 Bleomycin vs cisplatin and etoposide | 1 | 69 | Odds Ratio (M‐H, Random, 95% CI) | 1.1 [0.39, 3.07] |
| 1.12 Bleomycin vs OK‐432 | 1 | 68 | Odds Ratio (M‐H, Random, 95% CI) | 1.43 [0.49, 4.17] |
| 1.13 Bleomycin vs viscum | 1 | 17 | Odds Ratio (M‐H, Random, 95% CI) | 5.33 [0.62, 45.99] |
| 2 Pain Show forest plot | 14 | Odds Ratio (M‐H, Random, 95% CI) | Subtotals only | |
| 2.1 Bleomycin vs talc slurry | 2 | 73 | Odds Ratio (M‐H, Random, 95% CI) | 1.66 [0.41, 6.80] |
| 2.2 Bleomycin vs tetracycline | 4 | 220 | Odds Ratio (M‐H, Random, 95% CI) | 0.61 [0.29, 1.27] |
| 2.3 Bleomycin vs talc poudrage | 1 | 32 | Odds Ratio (M‐H, Random, 95% CI) | 0.28 [0.01, 7.31] |
| 2.4 Bleomycin vs C. parvum | 2 | 71 | Odds Ratio (M‐H, Random, 95% CI) | 0.70 [0.27, 1.85] |
| 2.5 Bleomycin vs IFN | 1 | 160 | Odds Ratio (M‐H, Random, 95% CI) | 32.34 [1.89, 552.23] |
| 2.6 Bleomycin vs mitoxantrone | 1 | 96 | Odds Ratio (M‐H, Random, 95% CI) | 0.48 [0.15, 1.56] |
| 2.7 Bleomycin vs mepacrine | 1 | 40 | Odds Ratio (M‐H, Random, 95% CI) | 0.46 [0.11, 1.94] |
| 2.8 Bleomycin vs doxycycline | 2 | 148 | Odds Ratio (M‐H, Random, 95% CI) | 0.84 [0.26, 2.70] |
| 2.9 Bleomycin vs OK‐432 | 1 | 67 | Odds Ratio (M‐H, Random, 95% CI) | 0.40 [0.14, 1.12] |
| 2.10 Bleomycin vs cisplatin and etoposide | 1 | 69 | Odds Ratio (M‐H, Random, 95% CI) | 0.83 [0.32, 2.16] |
| 3 Mortality Show forest plot | 11 | Odds Ratio (M‐H, Random, 95% CI) | Subtotals only | |
| 3.1 Bleomycin vs combined tetracycline and bleomycin | 1 | 40 | Odds Ratio (M‐H, Random, 95% CI) | 1.0 [0.06, 17.18] |
| 3.2 Bleomycin vs talc slurry | 2 | 116 | Odds Ratio (M‐H, Random, 95% CI) | 0.89 [0.29, 2.75] |
| 3.3 Bleomycin vs tetracycline | 2 | 125 | Odds Ratio (M‐H, Random, 95% CI) | 0.63 [0.27, 1.44] |
| 3.4 Bleomycin vs talc poudrage | 1 | 32 | Odds Ratio (M‐H, Random, 95% CI) | 0.82 [0.20, 3.43] |
| 3.5 Bleomycin vs C. parvum | 1 | 55 | Odds Ratio (M‐H, Random, 95% CI) | 0.60 [0.19, 1.94] |
| 3.6 Bleomycin vs IFN | 1 | 160 | Odds Ratio (M‐H, Random, 95% CI) | 0.46 [0.25, 0.87] |
| 3.7 Bleomycin vs mitoxantrone | 1 | 96 | Odds Ratio (M‐H, Random, 95% CI) | 2.15 [0.95, 4.86] |
| 3.8 Bleomycin vs OK‐432 | 1 | 68 | Odds Ratio (M‐H, Random, 95% CI) | 2.66 [0.98, 7.23] |
| 3.9 Bleomycin vs doxycycline | 2 | 122 | Odds Ratio (M‐H, Random, 95% CI) | 1.44 [0.53, 3.90] |
| 3.10 Bleomycin vs cisplatin and etoposide | 1 | 69 | Odds Ratio (M‐H, Random, 95% CI) | 2.22 [0.82, 6.01] |
| 4 Fever Show forest plot | 16 | Odds Ratio (M‐H, Random, 95% CI) | Subtotals only | |
| 4.1 Bleomycin vs talc Slurry | 3 | 99 | Odds Ratio (M‐H, Random, 95% CI) | 0.90 [0.31, 2.56] |
| 4.2 Bleomycin vs talc poudrage | 1 | 32 | Odds Ratio (M‐H, Random, 95% CI) | 0.87 [0.11, 7.05] |
| 4.3 Bleomycin vs tetracycline | 5 | 250 | Odds Ratio (M‐H, Random, 95% CI) | 2.05 [0.67, 6.34] |
| 4.4 Tetracycline vs C. parvum | 2 | 80 | Odds Ratio (M‐H, Random, 95% CI) | 0.43 [0.17, 1.12] |
| 4.5 Bleomycin vs IFN | 1 | 160 | Odds Ratio (M‐H, Random, 95% CI) | 151.35 [9.08, 2522.62] |
| 4.6 Bleomycin vs mitoxantrone | 1 | 96 | Odds Ratio (M‐H, Random, 95% CI) | 1.11 [0.37, 3.36] |
| 4.7 Bleomycin vs mepacrine | 1 | 40 | Odds Ratio (M‐H, Random, 95% CI) | 0.52 [0.14, 1.92] |
| 4.8 Bleomycin vs doxycycline | 2 | 148 | Odds Ratio (M‐H, Random, 95% CI) | 2.69 [0.08, 89.51] |
| 4.9 Bleomycin vs combined tetracycline and bleomycin | 1 | 40 | Odds Ratio (M‐H, Random, 95% CI) | 0.47 [0.04, 5.69] |
| 4.10 Bleomycin vs OK432 | 1 | 67 | Odds Ratio (M‐H, Random, 95% CI) | 0.7 [0.23, 2.13] |
| 4.11 Bleomycin vs cisplatin and etoposide | 1 | 69 | Odds Ratio (M‐H, Random, 95% CI) | 2.22 [0.82, 6.01] |
| Outcome or subgroup title | No. of studies | No. of participants | Statistical method | Effect size |
| 1 Pleurodesis failure Show forest plot | 15 | Odds Ratio (M‐H, Random, 95% CI) | Subtotals only | |
| 1.1 Talc slurry vs talc poudrage | 3 | 599 | Odds Ratio (M‐H, Random, 95% CI) | 1.31 [0.92, 1.85] |
| 1.2 Talc slurry vs bleomycin | 5 | 199 | Odds Ratio (M‐H, Random, 95% CI) | 0.82 [0.37, 1.82] |
| 1.3 Talc slurry vs IPC | 2 | 160 | Odds Ratio (M‐H, Random, 95% CI) | 0.30 [0.15, 0.61] |
| 1.4 Talc slurry vs mepacrine | 1 | 89 | Odds Ratio (M‐H, Random, 95% CI) | 0.48 [0.14, 1.60] |
| 1.5 Talc slurry vs placebo | 1 | 21 | Odds Ratio (M‐H, Random, 95% CI) | 0.07 [0.00, 1.51] |
| 1.6 Talc slurry vs iodine | 1 | 36 | Odds Ratio (M‐H, Random, 95% CI) | 2.13 [0.18, 25.78] |
| 1.7 Talc slurry vs tetracycline | 1 | 32 | Odds Ratio (M‐H, Random, 95% CI) | 1.29 [0.32, 5.17] |
| 1.8 Talc slurry vs silver nitrate | 1 | 25 | Odds Ratio (M‐H, Random, 95% CI) | 5.82 [0.21, 158.82] |
| 1.9 Talc slurry vs TMP | 1 | 87 | Odds Ratio (M‐H, Random, 95% CI) | 2.31 [0.77, 6.93] |
| 2 Mortality Show forest plot | 9 | Odds Ratio (M‐H, Random, 95% CI) | Subtotals only | |
| 2.1 Talc slurry vs talc poudrage | 2 | 397 | Odds Ratio (M‐H, Random, 95% CI) | 0.98 [0.33, 2.85] |
| 2.2 Talc slurry vs bleomycin | 2 | 116 | Odds Ratio (M‐H, Random, 95% CI) | 1.12 [0.36, 3.46] |
| 2.3 Talc slurry vs iodine | 1 | 36 | Odds Ratio (M‐H, Random, 95% CI) | 0.0 [0.0, 0.0] |
| 2.4 Talc slurry vs IPC | 2 | 163 | Odds Ratio (M‐H, Random, 95% CI) | 0.97 [0.45, 2.10] |
| 2.5 Talc slurry vs mepacrine | 1 | 89 | Odds Ratio (M‐H, Random, 95% CI) | 1.88 [0.70, 5.02] |
| 2.6 Talc slurry vs TMP | 1 | 87 | Odds Ratio (M‐H, Random, 95% CI) | 10.64 [0.55, 203.85] |
| 3 Pain Show forest plot | 7 | Odds Ratio (M‐H, Random, 95% CI) | Subtotals only | |
| 3.1 Talc slurry vs bleomycin | 3 | 99 | Odds Ratio (M‐H, Random, 95% CI) | 0.60 [0.15, 2.46] |
| 3.2 Talc slurry vs talc poudrage | 1 | 482 | Odds Ratio (M‐H, Random, 95% CI) | 2.13 [1.04, 4.36] |
| 3.3 Talc slurry vs tetracycline | 1 | 34 | Odds Ratio (M‐H, Random, 95% CI) | 0.30 [0.07, 1.36] |
| 3.4 Talc slurry vs iodine | 1 | 36 | Odds Ratio (M‐H, Random, 95% CI) | 0.0 [0.0, 0.0] |
| 3.5 Talc slurry vs IPC | 1 | 57 | Odds Ratio (M‐H, Random, 95% CI) | 0.31 [0.01, 7.95] |
| 3.6 Talc slurry vs placebo | 1 | 31 | Odds Ratio (M‐H, Random, 95% CI) | 0.0 [0.0, 0.0] |
| 4 Fever Show forest plot | 7 | Odds Ratio (M‐H, Random, 95% CI) | Subtotals only | |
| 4.1 Talc slurry vs talc poudrage | 2 | 479 | Odds Ratio (M‐H, Random, 95% CI) | 1.65 [0.42, 6.48] |
| 4.2 Talc slurry vs bleomycin | 3 | 98 | Odds Ratio (M‐H, Random, 95% CI) | 0.95 [0.36, 2.51] |
| 4.3 Talc slurry vs tetracycline | 1 | 34 | Odds Ratio (M‐H, Random, 95% CI) | 1.09 [0.28, 4.32] |
| 4.4 Talc slurry vs iodine | 1 | 36 | Odds Ratio (M‐H, Random, 95% CI) | 1.6 [0.23, 10.94] |
| 4.5 Talc slurry vs silver nitrate | 1 | 60 | Odds Ratio (M‐H, Random, 95% CI) | 0.7 [0.15, 3.24] |
| Outcome or subgroup title | No. of studies | No. of participants | Statistical method | Effect size |
| 1 Pleurodesis failure Show forest plot | 9 | Odds Ratio (M‐H, Fixed, 95% CI) | Subtotals only | |
| 1.1 Talc poudrage vs talc slurry | 3 | 599 | Odds Ratio (M‐H, Fixed, 95% CI) | 0.77 [0.54, 1.09] |
| 1.2 Talc poudrage vs bleomycin | 2 | 57 | Odds Ratio (M‐H, Fixed, 95% CI) | 0.10 [0.02, 0.48] |
| 1.3 Talc poudrage vs tetracycline | 1 | 33 | Odds Ratio (M‐H, Fixed, 95% CI) | 0.08 [0.01, 0.76] |
| 1.4 Talc poudrage vs iodine | 1 | 42 | Odds Ratio (M‐H, Fixed, 95% CI) | 0.57 [0.08, 3.80] |
| 1.5 Talc poudrage vs mustine | 1 | 37 | Odds Ratio (M‐H, Fixed, 95% CI) | 0.13 [0.02, 0.71] |
| 1.6 Talc poudrage vs doxycycline | 1 | 31 | Odds Ratio (M‐H, Fixed, 95% CI) | 0.02 [0.00, 0.47] |
| 2 Mortality Show forest plot | 6 | Odds Ratio (M‐H, Random, 95% CI) | Subtotals only | |
| 2.1 Talc poudrage vs talc slurry | 2 | 397 | Odds Ratio (M‐H, Random, 95% CI) | 1.02 [0.35, 3.00] |
| 2.2 Talc poudrage vs bleomycin | 1 | 32 | Odds Ratio (M‐H, Random, 95% CI) | 1.22 [0.29, 5.13] |
| 2.3 Talc poudrage vs tetracycline | 1 | 41 | Odds Ratio (M‐H, Random, 95% CI) | 5.25 [0.91, 30.22] |
| 2.4 Talc poudrage vs iodine | 1 | 42 | Odds Ratio (M‐H, Random, 95% CI) | 2.64 [0.58, 12.09] |
| 2.5 Talc poudrage vs mustine | 1 | 46 | Odds Ratio (M‐H, Random, 95% CI) | 0.43 [0.09, 1.96] |
| 3 Pain Show forest plot | 3 | Odds Ratio (M‐H, Random, 95% CI) | Subtotals only | |
| 3.1 Talc poudrage vs talc slurry | 1 | 482 | Odds Ratio (M‐H, Random, 95% CI) | 0.47 [0.23, 0.96] |
| 3.2 Talc poudrage vs bleomycin | 1 | 32 | Odds Ratio (M‐H, Random, 95% CI) | 3.62 [0.14, 95.78] |
| 3.3 Talc poudrage vs iodine | 1 | 42 | Odds Ratio (M‐H, Random, 95% CI) | 9.97 [0.50, 198.04] |
| 4 Fever Show forest plot | 4 | Odds Ratio (M‐H, Random, 95% CI) | Subtotals only | |
| 4.1 Talc poudrage vs talc slurry | 2 | 479 | Odds Ratio (M‐H, Random, 95% CI) | 0.60 [0.15, 2.37] |
| 4.2 Talc poudrage vs bleomycin | 1 | 32 | Odds Ratio (M‐H, Random, 95% CI) | 1.15 [0.14, 9.38] |
| 4.3 Talc poudrage vs iodine | 1 | 42 | Odds Ratio (M‐H, Random, 95% CI) | 4.22 [0.43, 41.45] |
| Outcome or subgroup title | No. of studies | No. of participants | Statistical method | Effect size |
| 1 Pleurodesis failure Show forest plot | 11 | Odds Ratio (M‐H, Random, 95% CI) | Subtotals only | |
| 1.1 Tetracycline vs C. parvum | 1 | 32 | Odds Ratio (M‐H, Random, 95% CI) | 3.18 [0.52, 19.64] |
| 1.2 Tetracycline vs talc slurry | 1 | 32 | Odds Ratio (M‐H, Random, 95% CI) | 0.78 [0.19, 3.13] |
| 1.3 Tetracycline vs Adriamycin | 1 | 21 | Odds Ratio (M‐H, Random, 95% CI) | 0.9 [0.05, 16.59] |
| 1.4 Tetracyclines vs placebo | 1 | 20 | Odds Ratio (M‐H, Random, 95% CI) | 0.30 [0.05, 1.94] |
| 1.5 Tetracycline vs talc poudrage | 1 | 33 | Odds Ratio (M‐H, Random, 95% CI) | 12.10 [1.32, 111.30] |
| 1.6 Tetracycline vs mustine | 2 | 59 | Odds Ratio (M‐H, Random, 95% CI) | 0.37 [0.10, 1.35] |
| 1.7 Tetracycline vs combined tetracycline and bleomycin | 1 | 38 | Odds Ratio (M‐H, Random, 95% CI) | 8.27 [0.40, 172.05] |
| 1.8 Tetracycline vs bleomycin | 5 | 220 | Odds Ratio (M‐H, Random, 95% CI) | 2.00 [1.07, 3.75] |
| 1.9 Tetracycline vs mepacrine | 1 | 21 | Odds Ratio (M‐H, Random, 95% CI) | 1.6 [0.12, 20.99] |
| 2 Pain Show forest plot | 8 | Odds Ratio (M‐H, Random, 95% CI) | Subtotals only | |
| 2.1 Tetracycline vs talc slurry | 1 | 34 | Odds Ratio (M‐H, Random, 95% CI) | 3.28 [0.73, 14.68] |
| 2.2 Tetracycline vs bleomycin | 4 | 220 | Odds Ratio (M‐H, Random, 95% CI) | 1.65 [0.79, 3.43] |
| 2.3 Tetracycline vs C. parvum | 1 | 41 | Odds Ratio (M‐H, Random, 95% CI) | 0.41 [0.12, 1.45] |
| 2.4 Tetracycline vs mustine | 1 | 40 | Odds Ratio (M‐H, Random, 95% CI) | 33.87 [1.80, 636.88] |
| 2.5 Tetracycline vs mepacrine | 1 | 22 | Odds Ratio (M‐H, Random, 95% CI) | 0.18 [0.03, 1.23] |
| 2.6 Tetracycline vs placebo | 1 | 22 | Odds Ratio (M‐H, Random, 95% CI) | 0.0 [0.0, 0.0] |
| 3 Fever Show forest plot | 9 | Odds Ratio (M‐H, Random, 95% CI) | Subtotals only | |
| 3.1 Tetracycline vs talc slurry | 1 | 34 | Odds Ratio (M‐H, Random, 95% CI) | 0.92 [0.23, 3.63] |
| 3.2 Tetracycline vs bleomycin | 5 | 250 | Odds Ratio (M‐H, Random, 95% CI) | 0.49 [0.16, 1.50] |
| 3.3 Tetracycline vs C. parvum | 1 | 36 | Odds Ratio (M‐H, Random, 95% CI) | 0.00 [0.00, 0.06] |
| 3.4 Tetracycline vs mepacrine | 1 | 22 | Odds Ratio (M‐H, Random, 95% CI) | 0.13 [0.02, 0.89] |
| 3.5 Tetracycline vs combination tetracycline and bleomycin | 1 | 40 | Odds Ratio (M‐H, Random, 95% CI) | 0.47 [0.04, 5.69] |
| 3.6 Tetracycline vs placebo | 1 | 22 | Odds Ratio (M‐H, Random, 95% CI) | 0.0 [0.0, 0.0] |
| 3.7 Tetracycline vs mustine | 1 | 40 | Odds Ratio (M‐H, Random, 95% CI) | 0.0 [0.0, 0.0] |
| 4 Mortality Show forest plot | 4 | 202 | Odds Ratio (M‐H, Random, 95% CI) | 0.99 [0.30, 3.26] |
| 4.1 Tetracycline vs talc poudrage | 1 | 41 | Odds Ratio (M‐H, Random, 95% CI) | 0.19 [0.03, 1.10] |
| 4.2 Tetracycline vs bleomycin | 2 | 125 | Odds Ratio (M‐H, Random, 95% CI) | 1.60 [0.69, 3.69] |
| 4.3 Tetracycline vs C. parvum | 1 | 36 | Odds Ratio (M‐H, Random, 95% CI) | 3.0 [0.28, 31.99] |
| Outcome or subgroup title | No. of studies | No. of participants | Statistical method | Effect size |
| 1 Pleurodesis failure Show forest plot | 5 | Odds Ratio (M‐H, Random, 95% CI) | Subtotals only | |
| 1.1 C. parvum vs bleomycin | 2 | 78 | Odds Ratio (M‐H, Random, 95% CI) | 0.55 [0.01, 57.48] |
| 1.2 C. parvum vs tetracycline | 1 | 32 | Odds Ratio (M‐H, Random, 95% CI) | 0.31 [0.05, 1.94] |
| 1.3 C. parvum vs doxycycline | 1 | 35 | Odds Ratio (M‐H, Random, 95% CI) | 0.52 [0.12, 2.33] |
| 1.4 C. parvum vs mustine | 1 | 18 | Odds Ratio (M‐H, Random, 95% CI) | 0.33 [0.04, 2.52] |
| 2 Pain Show forest plot | 4 | 153 | Odds Ratio (M‐H, Random, 95% CI) | 2.51 [1.10, 5.75] |
| 2.1 C. parvum vs bleomycin | 2 | 71 | Odds Ratio (M‐H, Random, 95% CI) | 1.42 [0.54, 3.75] |
| 2.2 C . parvum vs tetracycline | 1 | 41 | Odds Ratio (M‐H, Random, 95% CI) | 2.44 [0.69, 8.66] |
| 2.3 C. parvum vs doxycycline | 1 | 41 | Odds Ratio (M‐H, Random, 95% CI) | 7.37 [1.84, 29.55] |
| 3 Fever Show forest plot | 5 | Odds Ratio (M‐H, Random, 95% CI) | Subtotals only | |
| 3.1 C. parvum vs bleomycin | 2 | 80 | Odds Ratio (M‐H, Random, 95% CI) | 2.30 [0.90, 5.92] |
| 3.2 C. parvum vs tetracycline | 1 | 36 | Odds Ratio (M‐H, Random, 95% CI) | 288.00 [16.62, 4991.05] |
| 3.3 C. parvum vs mustine | 1 | 21 | Odds Ratio (M‐H, Random, 95% CI) | 4.41 [0.16, 121.68] |
| 3.4 C. parvum vs doxycycline | 1 | 41 | Odds Ratio (M‐H, Random, 95% CI) | 7.37 [1.84, 29.55] |
| 4 Mortality Show forest plot | 3 | Odds Ratio (M‐H, Random, 95% CI) | Subtotals only | |
| 4.1 C. parvum vs bleomycin | 1 | 55 | Odds Ratio (M‐H, Random, 95% CI) | 1.66 [0.51, 5.38] |
| 4.2 C. parvum vs tetracycline | 1 | 36 | Odds Ratio (M‐H, Random, 95% CI) | 0.33 [0.03, 3.55] |
| 4.3 C. parvum vs mustine | 1 | 21 | Odds Ratio (M‐H, Random, 95% CI) | 0.42 [0.07, 2.66] |
| Outcome or subgroup title | No. of studies | No. of participants | Statistical method | Effect size |
| 1 Pleurodesis failure Show forest plot | 2 | Odds Ratio (M‐H, Random, 95% CI) | Subtotals only | |
| 1.1 IPC vs talc slurry | 2 | 160 | Odds Ratio (M‐H, Random, 95% CI) | 3.35 [1.64, 6.83] |
| 2 Mortality Show forest plot | 2 | 163 | Odds Ratio (M‐H, Random, 95% CI) | 1.03 [0.48, 2.23] |
| 3 Pain Show forest plot | 1 | Odds Ratio (M‐H, Random, 95% CI) | Subtotals only | |
| Outcome or subgroup title | No. of studies | No. of participants | Statistical method | Effect size |
| 1 Pleurodesis failure Show forest plot | 3 | Odds Ratio (M‐H, Random, 95% CI) | Subtotals only | |
| 1.1 Iodine vs talc poudrage | 1 | 42 | Odds Ratio (M‐H, Random, 95% CI) | 1.76 [0.26, 11.83] |
| 1.2 Iodine vs talc slurry | 1 | 36 | Odds Ratio (M‐H, Random, 95% CI) | 0.47 [0.04, 5.71] |
| 1.3 Iodine vs bleomycin | 1 | 39 | Odds Ratio (M‐H, Random, 95% CI) | 1.25 [0.28, 5.59] |
| 2 Fever Show forest plot | 2 | Odds Ratio (M‐H, Random, 95% CI) | Subtotals only | |
| 2.1 Iodine vs talc slurry | 1 | 36 | Odds Ratio (M‐H, Random, 95% CI) | 0.63 [0.09, 4.28] |
| 2.2 Iodine vs talc poudrage | 1 | 42 | Odds Ratio (M‐H, Random, 95% CI) | 0.24 [0.02, 2.33] |
| 3 Mortality Show forest plot | 1 | Odds Ratio (M‐H, Random, 95% CI) | Subtotals only | |
| 3.1 Iodine vs talc poudrage | 1 | 42 | Odds Ratio (M‐H, Random, 95% CI) | 0.38 [0.08, 1.73] |
| 4 Pain Show forest plot | 2 | Odds Ratio (M‐H, Random, 95% CI) | Subtotals only | |
| 4.1 Iodine vs talc slurry | 1 | 36 | Odds Ratio (M‐H, Random, 95% CI) | 0.0 [0.0, 0.0] |
| 4.2 Iodine vs talc poudrage | 1 | 42 | Odds Ratio (M‐H, Random, 95% CI) | 0.10 [0.01, 1.99] |
| Outcome or subgroup title | No. of studies | No. of participants | Statistical method | Effect size |
| 1 Pleurodesis failure Show forest plot | 4 | Odds Ratio (M‐H, Fixed, 95% CI) | Subtotals only | |
| 1.1 Doxycycline vs talc poudrage | 1 | 31 | Odds Ratio (M‐H, Fixed, 95% CI) | 42.69 [2.13, 856.61] |
| 1.2 Doxycycline vs bleomycin | 2 | 122 | Odds Ratio (M‐H, Fixed, 95% CI) | 0.66 [0.24, 1.83] |
| 1.3 Doxycycline vs C. parvum | 1 | 35 | Odds Ratio (M‐H, Fixed, 95% CI) | 1.91 [0.43, 8.48] |
| 2 Pain Show forest plot | 3 | Odds Ratio (M‐H, Random, 95% CI) | Subtotals only | |
| 2.1 Doxycycline vs bleomycin | 2 | 148 | Odds Ratio (M‐H, Random, 95% CI) | 1.19 [0.37, 3.80] |
| 2.2 Doxycycline vs C. parvum | 1 | 41 | Odds Ratio (M‐H, Random, 95% CI) | 0.10 [0.01, 0.96] |
| 3 Fever Show forest plot | 3 | 189 | Odds Ratio (M‐H, Random, 95% CI) | 0.28 [0.04, 2.16] |
| 3.1 Doxycycline vs bleomycin | 2 | 148 | Odds Ratio (M‐H, Random, 95% CI) | 0.37 [0.01, 12.35] |
| 3.2 Doxycycline vs C. parvum | 1 | 41 | Odds Ratio (M‐H, Random, 95% CI) | 0.14 [0.03, 0.54] |
| 4 Mortality Show forest plot | 1 | Odds Ratio (M‐H, Random, 95% CI) | Subtotals only | |
| 4.1 Doxycycline vs bleomycin | 1 | 80 | Odds Ratio (M‐H, Random, 95% CI) | 0.69 [0.26, 1.87] |
| Outcome or subgroup title | No. of studies | No. of participants | Statistical method | Effect size |
| 1 Pleurodesis failure Show forest plot | 4 | 628 | Odds Ratio (M‐H, Random, 95% CI) | 0.74 [0.52, 1.04] |
| 1.1 Talc | 3 | 599 | Odds Ratio (M‐H, Random, 95% CI) | 0.76 [0.54, 1.09] |
| 1.2 Tetracycline | 1 | 29 | Odds Ratio (M‐H, Random, 95% CI) | 0.28 [0.04, 1.76] |
| Outcome or subgroup title | No. of studies | No. of participants | Statistical method | Effect size |
| 1 Pleurodesis failure Show forest plot | 3 | Odds Ratio (M‐H, Fixed, 95% CI) | Subtotals only | |
| 2 Mortality Show forest plot | 3 | Odds Ratio (M‐H, Random, 95% CI) | Subtotals only | |
| Outcome or subgroup title | No. of studies | No. of participants | Statistical method | Effect size |
| 1 Pleurodesis failure Show forest plot | 4 | Odds Ratio (M‐H, Random, 95% CI) | Subtotals only | |
| 1.1 OK‐432 and mitomycin C | 1 | 53 | Odds Ratio (M‐H, Random, 95% CI) | 0.26 [0.06, 1.11] |
| 1.2 OK‐432 vs cisplatin and etoposide | 1 | 67 | Odds Ratio (M‐H, Random, 95% CI) | 0.77 [0.26, 2.27] |
| 1.3 OK‐432 and cisplatin | 1 | 34 | Odds Ratio (M‐H, Random, 95% CI) | 0.48 [0.12, 1.92] |
| 1.4 High dose vs low dose | 1 | 38 | Odds Ratio (M‐H, Random, 95% CI) | 1.90 [0.38, 9.44] |
| 1.5 OK‐432 vs bleomycin | 1 | 68 | Odds Ratio (M‐H, Random, 95% CI) | 0.70 [0.24, 2.03] |
| 1.6 OK‐432 vs OK‐432 and cisplatin | 1 | 32 | Odds Ratio (M‐H, Random, 95% CI) | 12.44 [1.32, 117.03] |
| 2 Pain Show forest plot | 3 | Odds Ratio (M‐H, Random, 95% CI) | Subtotals only | |
| 2.1 OK‐432 vs cisplatin | 1 | 34 | Odds Ratio (M‐H, Random, 95% CI) | 6.67 [1.15, 38.60] |
| 2.2 OK‐432 vs OK‐432 and cisplatin | 1 | 32 | Odds Ratio (M‐H, Random, 95% CI) | 1.33 [0.33, 5.43] |
| 2.3 OK‐432 vs mitomycin C | 1 | 53 | Odds Ratio (M‐H, Random, 95% CI) | 1.04 [0.14, 8.00] |
| 2.4 OK‐432 vs bleomycin | 1 | 67 | Odds Ratio (M‐H, Random, 95% CI) | 2.53 [0.89, 7.15] |
| 2.5 OK‐432 vs cisplatin and etoposide | 1 | 66 | Odds Ratio (M‐H, Random, 95% CI) | 2.1 [0.73, 6.01] |
| 3 Fever Show forest plot | 3 | Odds Ratio (M‐H, Random, 95% CI) | Subtotals only | |
| 3.1 OK‐432 vs cisplatin | 1 | 34 | Odds Ratio (M‐H, Random, 95% CI) | 256.00 [14.70, 4457.27] |
| 3.2 OK‐432 vs OK‐432 and cisplatin | 1 | 32 | Odds Ratio (M‐H, Random, 95% CI) | 14.00 [1.46, 134.25] |
| 3.3 OK‐432 vs mitomycin C | 1 | 53 | Odds Ratio (M‐H, Random, 95% CI) | 26.67 [5.91, 120.42] |
| 3.4 OK‐432 vs bleomycin | 1 | 67 | Odds Ratio (M‐H, Random, 95% CI) | 1.43 [0.47, 4.35] |
| 3.5 OK‐432 vs cisplatin and etoposide | 1 | 66 | Odds Ratio (M‐H, Random, 95% CI) | 3.17 [1.08, 9.30] |
| 4 Mortality Show forest plot | 2 | Odds Ratio (M‐H, Random, 95% CI) | Subtotals only | |
| 4.1 OK‐432 vs cisplatin | 1 | 34 | Odds Ratio (M‐H, Random, 95% CI) | 1.31 [0.31, 5.53] |
| 4.2 OK‐432 vs combined OK‐432 and cisplatin | 1 | 32 | Odds Ratio (M‐H, Random, 95% CI) | 2.18 [0.44, 10.91] |
| 4.3 OK‐432 vs bleomycin | 1 | 68 | Odds Ratio (M‐H, Random, 95% CI) | 0.38 [0.14, 1.03] |
| 4.4 OK‐432 vs cisplatin and etoposide | 1 | 67 | Odds Ratio (M‐H, Random, 95% CI) | 0.84 [0.32, 2.18] |
| Outcome or subgroup title | No. of studies | No. of participants | Statistical method | Effect size |
| 1 Pain Show forest plot | 3 | 114 | Odds Ratio (M‐H, Random, 95% CI) | 4.56 [1.66, 12.52] |
| 1.1 Mepacrine vs bleomycin | 1 | 40 | Odds Ratio (M‐H, Random, 95% CI) | 2.15 [0.52, 9.00] |
| 1.2 Mepacrine vs tetracycline | 1 | 22 | Odds Ratio (M‐H, Random, 95% CI) | 5.6 [0.81, 38.51] |
| 1.3 Mepacrine vs placebo | 1 | 23 | Odds Ratio (M‐H, Random, 95% CI) | 14.53 [0.71, 298.21] |
| 1.4 Mepacrine vs triethylenethiophosphoramide | 1 | 29 | Odds Ratio (M‐H, Random, 95% CI) | 23.71 [1.19, 474.06] |
| 2 Fever Show forest plot | 3 | Odds Ratio (M‐H, Random, 95% CI) | Subtotals only | |
| 2.1 Mepacrine vs bleomycin | 1 | 40 | Odds Ratio (M‐H, Random, 95% CI) | 1.91 [0.52, 7.01] |
| 2.2 Mepacrine vs tetracycline | 1 | 22 | Odds Ratio (M‐H, Random, 95% CI) | 8.00 [1.13, 56.79] |
| 2.3 Mepacrine vs placebo | 1 | 23 | Odds Ratio (M‐H, Random, 95% CI) | 62.43 [2.85, 1365.52] |
| 2.4 Mepacrine vs triethylene... | 1 | 29 | Odds Ratio (M‐H, Random, 95% CI) | 23.83 [3.35, 169.39] |
| 3 Pleurodesis failure Show forest plot | 5 | Odds Ratio (M‐H, Random, 95% CI) | Subtotals only | |
| 3.1 Mepacrine vs talc slurry | 1 | 89 | Odds Ratio (M‐H, Random, 95% CI) | 2.08 [0.62, 6.96] |
| 3.2 Mepacrine vs bleomycin | 1 | 36 | Odds Ratio (M‐H, Random, 95% CI) | 0.16 [0.03, 0.89] |
| 3.3 Mepacrine vs tetracycline | 1 | 21 | Odds Ratio (M‐H, Random, 95% CI) | 0.63 [0.05, 8.20] |
| 3.4 Mepacrine vs placebo | 1 | 23 | Odds Ratio (M‐H, Random, 95% CI) | 0.07 [0.01, 0.73] |
| 3.5 Mepacrine vs mitoxantrone | 1 | 26 | Odds Ratio (M‐H, Random, 95% CI) | 7.61 [0.35, 163.82] |
| 3.6 Mepacrine vs triethylene... | 1 | 29 | Odds Ratio (M‐H, Random, 95% CI) | 0.20 [0.04, 0.98] |
| 4 Mortality Show forest plot | 2 | Odds Ratio (M‐H, Random, 95% CI) | Subtotals only | |
| 4.1 Mepacrine vs talc slurry | 1 | 89 | Odds Ratio (M‐H, Random, 95% CI) | 0.53 [0.20, 1.43] |
| 4.2 Mepacrine vs mitoxantrone | 1 | 28 | Odds Ratio (M‐H, Random, 95% CI) | 1.64 [0.23, 11.70] |
| Outcome or subgroup title | No. of studies | No. of participants | Statistical method | Effect size |
| 1 Pleurodesis failure Show forest plot | 1 | Odds Ratio (M‐H, Random, 95% CI) | Subtotals only | |
| 1.1 IFN vs bleomycin | 1 | 160 | Odds Ratio (M‐H, Random, 95% CI) | 3.25 [1.54, 6.89] |
| 2 Pain Show forest plot | 1 | 160 | Odds Ratio (M‐H, Random, 95% CI) | 0.03 [0.00, 0.53] |
| 3 Fever Show forest plot | 1 | 160 | Odds Ratio (M‐H, Random, 95% CI) | 0.01 [0.00, 0.11] |
| 4 Mortality Show forest plot | 1 | Odds Ratio (M‐H, Random, 95% CI) | Subtotals only | |
| Outcome or subgroup title | No. of studies | No. of participants | Statistical method | Effect size |
| 1 Pleurodesis failure Show forest plot | 1 | Odds Ratio (M‐H, Random, 95% CI) | Subtotals only | |
| 1.1 Triethylene... vs placebo | 1 | 24 | Odds Ratio (M‐H, Random, 95% CI) | 0.34 [0.03, 3.69] |
| 1.2 Triethylene... vs mepacrine | 1 | 29 | Odds Ratio (M‐H, Random, 95% CI) | 4.95 [1.02, 24.10] |
| 2 Pain Show forest plot | 1 | 53 | Odds Ratio (M‐H, Random, 95% CI) | 1.39 [0.10, 20.15] |
| 2.1 Triethylene... vs mepacrine | 1 | 29 | Odds Ratio (M‐H, Random, 95% CI) | 0.48 [0.10, 2.30] |
| 2.2 Triethylene... vs placebo | 1 | 24 | Odds Ratio (M‐H, Random, 95% CI) | 7.43 [0.35, 156.28] |
| 3 Fever Show forest plot | 1 | 53 | Odds Ratio (M‐H, Random, 95% CI) | 0.32 [0.00, 26.74] |
| 3.1 Triethylene... vs placebo | 1 | 24 | Odds Ratio (M‐H, Random, 95% CI) | 3.52 [0.15, 81.92] |
| 3.2 Triethylene... vs mepacrine | 1 | 29 | Odds Ratio (M‐H, Random, 95% CI) | 0.04 [0.01, 0.30] |
| Outcome or subgroup title | No. of studies | No. of participants | Statistical method | Effect size |
| 1 Pleurodesis failure Show forest plot | 2 | Odds Ratio (M‐H, Random, 95% CI) | Subtotals only | |
| 1.1 Adriamycin vs mustine | 1 | 20 | Odds Ratio (M‐H, Random, 95% CI) | 0.37 [0.01, 10.18] |
| 1.2 Adriamycin vs tetracycline | 1 | 21 | Odds Ratio (M‐H, Random, 95% CI) | 1.11 [0.06, 20.49] |
| 1.3 Adriamycin vs LC9018 and Adriamycin | 1 | 76 | Odds Ratio (M‐H, Random, 95% CI) | 4.29 [1.62, 11.35] |
| 2 Fever Show forest plot | 1 | Odds Ratio (M‐H, Random, 95% CI) | Subtotals only | |
| 3 Pain Show forest plot | 1 | Odds Ratio (M‐H, Random, 95% CI) | Subtotals only | |
| Outcome or subgroup title | No. of studies | No. of participants | Statistical method | Effect size |
| 1 Pleurodesis failure Show forest plot | 4 | Odds Ratio (M‐H, Random, 95% CI) | Subtotals only | |
| 1.1 Placebo vs mepacrine | 1 | 23 | Odds Ratio (M‐H, Random, 95% CI) | 14.40 [1.37, 150.81] |
| 1.2 Placebo vs mitoxantrone | 1 | 95 | Odds Ratio (M‐H, Random, 95% CI) | 1.33 [0.56, 3.17] |
| 1.3 Placebo vs triethylene... | 1 | 24 | Odds Ratio (M‐H, Random, 95% CI) | 2.91 [0.27, 31.21] |
| 1.4 Placebo vs talc slurry | 1 | 21 | Odds Ratio (M‐H, Random, 95% CI) | 13.93 [0.66, 293.99] |
| 1.5 Placebo vs tetracycline | 1 | 20 | Odds Ratio (M‐H, Random, 95% CI) | 3.33 [0.51, 21.58] |
| 2 Pain Show forest plot | 3 | 100 | Odds Ratio (M‐H, Random, 95% CI) | 0.10 [0.01, 0.82] |
| 2.1 Placebo vs talc slurry | 1 | 31 | Odds Ratio (M‐H, Random, 95% CI) | 0.0 [0.0, 0.0] |
| 2.2 Placebo vs tetracycline | 1 | 22 | Odds Ratio (M‐H, Random, 95% CI) | 0.0 [0.0, 0.0] |
| 2.3 Placebo vs mepacrine | 1 | 23 | Odds Ratio (M‐H, Random, 95% CI) | 0.07 [0.00, 1.41] |
| 2.4 Placebo vs triethylene... | 1 | 24 | Odds Ratio (M‐H, Random, 95% CI) | 0.13 [0.01, 2.83] |
| 3 Fever Show forest plot | 2 | Odds Ratio (M‐H, Random, 95% CI) | Subtotals only | |
| 3.1 Placebo vs mepacrine | 1 | 95 | Odds Ratio (M‐H, Random, 95% CI) | 0.31 [0.12, 0.79] |
| 3.2 Placebo vs mitoxantone | 1 | 23 | Odds Ratio (M‐H, Random, 95% CI) | 0.02 [0.00, 0.35] |
| 3.3 Placebo vs triethylene... | 1 | 24 | Odds Ratio (M‐H, Random, 95% CI) | 0.28 [0.01, 6.62] |
| Outcome or subgroup title | No. of studies | No. of participants | Statistical method | Effect size |
| 1 Pleurodesis failure Show forest plot | 4 | Odds Ratio (M‐H, Random, 95% CI) | Subtotals only | |
| 1.1 Mustine vs tetracycline | 2 | 59 | Odds Ratio (M‐H, Random, 95% CI) | 2.72 [0.74, 9.98] |
| 1.2 Mustine vs talc poudrage | 1 | 37 | Odds Ratio (M‐H, Random, 95% CI) | 8.00 [1.40, 45.76] |
| 1.3 Mustine vs C. parvum | 1 | 31 | Odds Ratio (M‐H, Random, 95% CI) | 10.8 [1.64, 70.93] |
| 1.4 Mustine vs Adriamycin | 1 | 20 | Odds Ratio (M‐H, Random, 95% CI) | 2.71 [0.10, 74.98] |
| 2 Fever Show forest plot | 2 | Odds Ratio (M‐H, Random, 95% CI) | Subtotals only | |
| 2.1 Mustine vs tetracycline | 1 | 40 | Odds Ratio (M‐H, Random, 95% CI) | 0.0 [0.0, 0.0] |
| 2.2 Mustine vs C. parvum | 1 | 21 | Odds Ratio (M‐H, Random, 95% CI) | 0.23 [0.01, 6.25] |
| 3 Mortality Show forest plot | 2 | Odds Ratio (M‐H, Random, 95% CI) | Subtotals only | |
| 3.1 Mustine vs talc poudrage | 1 | 46 | Odds Ratio (M‐H, Random, 95% CI) | 2.35 [0.51, 10.86] |
| 3.2 Mustine vs C. parvum | 1 | 21 | Odds Ratio (M‐H, Random, 95% CI) | 2.4 [0.38, 15.32] |
| 4 Pain Show forest plot | 1 | Odds Ratio (M‐H, Random, 95% CI) | Subtotals only | |
| Outcome or subgroup title | No. of studies | No. of participants | Statistical method | Effect size |
| 1 Pleurodesis failure Show forest plot | 3 | Odds Ratio (M‐H, Random, 95% CI) | Subtotals only | |
| 1.1 Mitoxantrone vs placebo | 1 | 95 | Odds Ratio (M‐H, Random, 95% CI) | 0.75 [0.32, 1.79] |
| 1.2 Mitoxantrone vs mepacrine | 1 | 26 | Odds Ratio (M‐H, Random, 95% CI) | 7.61 [0.35, 163.82] |
| 1.3 Mitoxantrone vs bleomycin | 1 | 85 | Odds Ratio (M‐H, Random, 95% CI) | 3.18 [1.17, 8.65] |
| 2 Pain Show forest plot | 1 | 96 | Odds Ratio (M‐H, Random, 95% CI) | 2.08 [0.64, 6.76] |
| 3 Fever Show forest plot | 2 | Odds Ratio (M‐H, Random, 95% CI) | Subtotals only | |
| 3.1 Mitoxantrone vs bleomycin | 1 | 96 | Odds Ratio (M‐H, Random, 95% CI) | 0.90 [0.30, 2.71] |
| 3.2 Mitoxantrone vs placebo | 1 | 95 | Odds Ratio (M‐H, Random, 95% CI) | 3.28 [1.26, 8.49] |
| 4 Mortality Show forest plot | 2 | Odds Ratio (M‐H, Random, 95% CI) | Subtotals only | |
| 4.1 Mitoxantrone vs bleomycin | 1 | 96 | Odds Ratio (M‐H, Random, 95% CI) | 0.47 [0.21, 1.05] |
| 4.2 Mitoxantrone vs mepacrine | 1 | 28 | Odds Ratio (M‐H, Random, 95% CI) | 0.61 [0.09, 4.37] |
| Outcome or subgroup title | No. of studies | No. of participants | Statistical method | Effect size |
| 1 Pleurodesis failure Show forest plot | 1 | 18 | Odds Ratio (M‐H, Random, 95% CI) | 0.57 [0.07, 4.64] |
| 2 Pain Show forest plot | 1 | Odds Ratio (M‐H, Random, 95% CI) | Subtotals only | |
| 3 Mortality Show forest plot | 1 | Odds Ratio (M‐H, Random, 95% CI) | Subtotals only | |
| Outcome or subgroup title | No. of studies | No. of participants | Statistical method | Effect size |
| 1 Pleurodesis failure Show forest plot | 1 | 87 | Odds Ratio (M‐H, Random, 95% CI) | 0.43 [0.14, 1.30] |
| 2 Mortality Show forest plot | 1 | Odds Ratio (M‐H, Random, 95% CI) | Subtotals only | |
| Outcome or subgroup title | No. of studies | No. of participants | Statistical method | Effect size |
| 1 Pleurodesis failure Show forest plot | 4 | 205 | Odds Ratio (M‐H, Random, 95% CI) | 1.26 [0.70, 2.30] |
| 1.1 Rotation vs no rotation | 1 | 20 | Odds Ratio (M‐H, Random, 95% CI) | 2.25 [0.17, 29.77] |
| 1.2 Streptokinase vs no streptokinase | 1 | 35 | Odds Ratio (M‐H, Random, 95% CI) | 2.18 [0.53, 9.02] |
| 1.3 Mixed particle talc vs graded talc | 1 | 28 | Odds Ratio (M‐H, Random, 95% CI) | 1.64 [0.23, 11.70] |
| 1.4 Talc pleurodesis vs VATS parietal pleurectomy | 1 | 122 | Odds Ratio (M‐H, Random, 95% CI) | 1.01 [0.49, 2.09] |
| 2 Pain Show forest plot | 1 | Odds Ratio (M‐H, Random, 95% CI) | Subtotals only | |
| 2.1 Streptokinase vs control | 1 | 47 | Odds Ratio (M‐H, Random, 95% CI) | 3.0 [0.12, 77.47] |
| 3 Fever Show forest plot | 1 | Odds Ratio (M‐H, Random, 95% CI) | Subtotals only | |
| 3.1 Mixed particle talc vs graded talc | 1 | 46 | Odds Ratio (M‐H, Random, 95% CI) | 15.92 [1.81, 140.16] |
| 4 Mortality Show forest plot | 2 | Odds Ratio (M‐H, Random, 95% CI) | Subtotals only | |
| 4.1 Mixed particle talc vs graded talc | 1 | 43 | Odds Ratio (M‐H, Random, 95% CI) | 0.88 [0.25, 3.07] |
| 4.2 Talc pleurodesis vs VATS partial pleurectomy | 1 | 175 | Odds Ratio (M‐H, Random, 95% CI) | 0.92 [0.45, 1.90] |
| Outcome or subgroup title | No. of studies | No. of participants | Statistical method | Effect size |
| 1 Pleurodesis failure Show forest plot | 1 | Odds Ratio (M‐H, Random, 95% CI) | Subtotals only | |
| 2 Fever Show forest plot | 1 | Odds Ratio (M‐H, Random, 95% CI) | Subtotals only | |
| Outcome or subgroup title | No. of studies | No. of participants | Statistical method | Effect size |
| 1 Pleurodesis failure Show forest plot | 3 | Odds Ratio (M‐H, Random, 95% CI) | Subtotals only | |
| 1.1 Cisplatin vs cisplatin and bevacizumab | 1 | 70 | Odds Ratio (M‐H, Random, 95% CI) | 5.0 [1.66, 15.09] |
| 1.2 Cisplatin vs OK‐432 | 1 | 34 | Odds Ratio (M‐H, Random, 95% CI) | 2.06 [0.52, 8.17] |
| 1.3 Cisplatin vs OK‐432 and cisplatin | 1 | 32 | Odds Ratio (M‐H, Random, 95% CI) | 25.67 [2.68, 245.84] |
| 1.4 Cisplatin vs rAd‐p53 and cisplatin | 1 | 35 | Odds Ratio (M‐H, Random, 95% CI) | 4.67 [0.99, 22.03] |
| 2 Pain Show forest plot | 1 | Odds Ratio (M‐H, Random, 95% CI) | Subtotals only | |
| 2.1 Cisplatin vs OK‐432 | 1 | 34 | Odds Ratio (M‐H, Random, 95% CI) | 0.15 [0.03, 0.87] |
| 2.2 Cisplatin vs OK‐432 and cisplatin | 1 | 32 | Odds Ratio (M‐H, Random, 95% CI) | 0.2 [0.03, 1.21] |
| 3 Fever Show forest plot | 2 | Odds Ratio (M‐H, Random, 95% CI) | Subtotals only | |
| 3.1 Cisplatin vs OK‐432 | 1 | 34 | Odds Ratio (M‐H, Random, 95% CI) | 0.00 [0.00, 0.07] |
| 3.2 Cisplatin vs OK‐432 and cisplatin | 1 | 32 | Odds Ratio (M‐H, Random, 95% CI) | 0.05 [0.01, 0.52] |
| 3.3 Cisplatin vs rAd‐p53 and cisplatin | 1 | 35 | Odds Ratio (M‐H, Random, 95% CI) | 0.09 [0.02, 0.51] |
| 4 Mortality Show forest plot | 2 | Odds Ratio (M‐H, Random, 95% CI) | Subtotals only | |
| 4.1 Cisplatin vs OK‐432 | 1 | 34 | Odds Ratio (M‐H, Random, 95% CI) | 0.76 [0.18, 3.23] |
| 4.2 Cisplatin vs combination OK‐432 and cisplatin | 1 | 32 | Odds Ratio (M‐H, Random, 95% CI) | 1.67 [0.32, 8.59] |
| 4.3 Cisplatin vs combination rAd‐p53 and cisplatin | 1 | 35 | Odds Ratio (M‐H, Random, 95% CI) | 0.0 [0.0, 0.0] |
| Outcome or subgroup title | No. of studies | No. of participants | Statistical method | Effect size |
| 1 Pleurodesis failure Show forest plot | 1 | 79 | Odds Ratio (M‐H, Random, 95% CI) | 0.79 [0.22, 2.82] |
| Outcome or subgroup title | No. of studies | No. of participants | Statistical method | Effect size |
| 1 Pleurodesis failure Show forest plot | 1 | Odds Ratio (M‐H, Random, 95% CI) | Subtotals only | |
| 1.1 Silver nitrate 90 mg vs 150 mg | 1 | 40 | Odds Ratio (M‐H, Random, 95% CI) | 0.0 [0.0, 0.0] |
| 1.2 Silver nitrate 90 mg vs 180 mg | 1 | 40 | Odds Ratio (M‐H, Random, 95% CI) | 0.18 [0.01, 4.01] |
| 1.3 Silver nitrate 150 mg vs 180 mg | 1 | 40 | Odds Ratio (M‐H, Random, 95% CI) | 0.18 [0.01, 4.01] |
| 2 Mortality Show forest plot | 1 | Odds Ratio (M‐H, Random, 95% CI) | Subtotals only | |
| 2.1 Silver nitrate 90 mg vs 150 mg | 1 | 39 | Odds Ratio (M‐H, Random, 95% CI) | 3.18 [0.30, 33.58] |
| 2.2 Silver nitrate 90 mg vs 180 mg | 1 | 39 | Odds Ratio (M‐H, Random, 95% CI) | 7.80 [0.38, 161.87] |
| 2.3 Silver nitrate 150 mg vs 180 mg | 1 | 38 | Odds Ratio (M‐H, Random, 95% CI) | 3.16 [0.12, 82.64] |
| 3 Pain Show forest plot | 1 | Odds Ratio (M‐H, Random, 95% CI) | Subtotals only | |
| 3.1 Silver nitrate 90 mg vs 150 mg | 1 | 40 | Odds Ratio (M‐H, Random, 95% CI) | 1.0 [0.13, 7.89] |
| 3.2 Silver nitrate 90 mg vs 180 mg | 1 | 40 | Odds Ratio (M‐H, Random, 95% CI) | 1.0 [0.13, 7.89] |
| 3.3 Silver nitrate 150 mg vs 180 mg | 1 | 40 | Odds Ratio (M‐H, Random, 95% CI) | 1.0 [0.13, 7.89] |
| 4 Fever Show forest plot | 1 | Odds Ratio (M‐H, Random, 95% CI) | Subtotals only | |
| 4.1 Silver nitrate 90 mg vs 150 mg | 1 | 40 | Odds Ratio (M‐H, Random, 95% CI) | 0.63 [0.09, 4.24] |
| 4.2 Silver nitrate 90 mg vs 180 mg | 1 | 40 | Odds Ratio (M‐H, Random, 95% CI) | 1.0 [0.13, 7.89] |
| 4.3 Silver nitrate 150 mg vs 180 mg | 1 | 40 | Odds Ratio (M‐H, Random, 95% CI) | 1.59 [0.24, 10.70] |