Intervenciones para el tratamiento de los derrames pleurales malignos: un metanálisis en red
Resumen
Antecedentes
El derrame pleural maligno (DPM) es un trastorno frecuente de los pacientes oncológicos y suele asociarse con una disnea importante. Existen varias opciones terapéuticas disponibles para la acumulación descontrolada de líquido pleural, incluida la administración de un agente de pleurodesis (ya sea a través de un drenaje torácico o de una toracoscopia) o la inserción de un drenaje pleural permanente (DPP). Esta es una actualización de una revisión publicada en el número 5 de 2016, que reemplazó a la original, publicada en 2004.
Objetivos
Determinar la estrategia de tratamiento óptima para los adultos con derrame pleural maligno en términos de éxito de la pleurodesis y cuantificar las diferencias en los resultados y los efectos adversos comunicados por el paciente entre las intervenciones.
Métodos de búsqueda
Se hicieron búsquedas en CENTRAL, MEDLINE (Ovid), Embase (Ovid) y en otras tres bases de datos, hasta junio 2019. Se cribaron las listas de referencias de otras publicaciones relevantes y se realizaron búsquedas en los registros de ensayos.
Criterios de selección
Se incluyeron ensayos controlados aleatorizados de intervenciones intrapleurales para adultos con DPM sintomático que compararon los tipos de esclerosante, el modo de administración y la utilización del DPP.
Obtención y análisis de los datos
Dos autores de la revisión extrajeron los datos, de forma independiente, sobre el diseño del estudio, las características del estudio, las medidas de resultado, los posibles modificadores del efecto y el riesgo de sesgo.
El resultado primario fue la tasa de fracaso de la pleurodesis. Los resultados secundarios fueron los eventos adversos, el control de la disnea notificado por el paciente, la calidad de vida, el costo, la mortalidad, la supervivencia, la duración de la estancia hospitalaria y la aceptabilidad del paciente.
Se realizaron metanálisis en red con los datos de los resultados primarios y los resultados secundarios con suficientes datos. También se realizaron metanálisis por pares de datos de comparación directa. Si se consideró que las intervenciones conjuntas no eran aleatorizadas, o si no se encontraron suficientes datos disponibles, se informó sobre los resultados mediante una síntesis narrativa. Para el resultado primario, se realizaron análisis de sensibilidad para explorar las posibles causas de heterogeneidad y también para evaluar los agentes de pleurodesis administrados exclusivamente a través de un drenaje torácico.
La certeza de la evidencia se evaluó con criterios GRADE.
Resultados principales
Se identificaron 80 ensayos aleatorizados (18 nuevos), con 5507 participantes. Se encontró que todos los estudios, excepto tres, tenían un riesgo de sesgo alto o incierto para al menos un dominio. Debido a la naturaleza de las intervenciones, se desenmascaró la mayoría de los estudios.
Tasa de fracaso de la pleurodesis
Se incluyeron 55 estudios de 21 intervenciones en el metanálisis primario en red. Se estimó la posición de la efectividad de cada intervención. La suspensión de talco (posición 6, intervalo de credibilidad [ICr] del 95%: 3 a 10) es un agente eficaz de pleurodesis (certeza moderada en comparación con el placebo) y podría producir menos fracasos de la pleurodesis que la bleomicina y la doxiciclina (bleomicina frente a suspensión de talco: odds ratio [OR] 2,24; ICr del 95%: 1,10 a 4,68; certeza baja; posición 11, ICr del 95%: 7 a 15; doxiciclina frente a la suspensión de talco: OR 2,51; ICr del 95%: 0,81 a 8,40; certeza baja; posición 12, ICr del 95%: 5 a 18).
Hay escasa evidencia de una diferencia entre la tasa de fracaso de la pleurodesis con talco respecto de la pleurodesis con suspensión de talco (OR 0,50; ICr del 95%: 0,21 a 1,02; certeza moderada). La evidencia de que alguna diferencia se haya reducido aún más cuando se restringió el análisis a los estudios de riesgo de sesgo bajo (definido como un máximo de un dominio de riesgo alto en la evaluación del riesgo de sesgo) (fracaso de la pleurodesis con talco versus la suspensión de talco: OR 0,78; ICr del 95%: 0,16 a 2,08).
Los DPP sin drenaje diario probablemente son menos eficaces para obtener una pleurodesis definitiva (cese del drenaje del líquido pleural que facilita la retirada del DPP) que la suspensión de talco (OR 7,60; ICr del 95%: 2,96 a 20,47; posición = 18/21, ICr del 95%: 13 a 21; certeza moderada). El DPP con drenaje diario o la instilación de suspensión de talco a través del DPP probablemente reducirán las tasas de fracaso de la pleurodesis.
Efectos adversos
Los efectos adversos se informaron de manera irregular. Se realizaron metanálisis en red para el riesgo de dolor y de fiebre relacionado con el procedimiento.
La evidencia del riesgo de presentar fiebre tuvo una certeza baja, aunque se indicó que podría haber una escasa diferencia entre las intervenciones en relación con la suspensión de talco (pleurodesis con talco): OR 0,89; ICr del 95%: 0,11 a 6,67; bleomicina: OR 2,33; ICr del 95%: 0,45 a 12,50; DPP: OR 0,41; ICr del 95%: 0,00 a 50,00; doxiciclina: OR 0,85; ICr del 95%: 0,05 a 14,29).
La evidencia también indicó que podría haber una pequeña diferencia entre las intervenciones, en cuanto al riesgo de padecer dolor relacionado con el procedimiento, en relación con la suspensión de talco (pleurodesis con talco): OR 1,26; ICr del 95%: 0,45 a 6,04; certeza muy baja; bleomicina: OR 2,85; ICr del 95%: 0,78 a 11,53; certeza baja; DPP: OR 1,30; ICr del 95%: 0,29 a 5,87; certeza baja; doxiciclina: OR 3,35; ICr del 95%: 0,64 a 19,72; certeza baja).
Control de la disnea comunicado por el paciente
El metanálisis por pares indica que probablemente no hay diferencias en el control de la disnea, en relación con la suspensión de talco, de la pleurodesis con talco (diferencia de medias [DM] 4,00 mm, IC del 95%: ‐6,26 a 14,26) en una escala analógica visual de 100 mm para la disnea; estudios = 1; participantes = 184; certeza moderada) y las DPP sin drenaje diario (DM ‐6,12 mm, IC del 95%: ‐16,32 a 4,08; estudios = 2; participantes = 160; certeza baja).
Mortalidad global
Es posible que una pequeña diferencia entre las intervenciones en comparación con la suspensión de talco (bleomicina y DPP sin drenaje diario; certeza baja), aunque la evidencia es incierta en el caso de la pleurodesis con talco y la doxiciclina.
Aceptabilidad del paciente
El metanálisis por pares demostró que los DPP probablemente representan un menor riesgo de tener que volver a requerir una intervención pleural invasiva (OR 0,25; ICr del 95%: 0,13 a 0,48; certeza moderada) en relación con la suspensión de talco. Es probable que haya escasa diferencia en el riesgo de que de tener que volver a realizar una intervención pleural invasiva con la pleurodesis con talco en relación con la suspensión de talco (OR 0,96; IC del 95%: 0,59 a 1,56; certeza moderada).
Conclusiones de los autores
Sobre la base de la evidencia disponible, la pleurodesis con talco y la suspensión de talco son métodos eficaces para lograr la pleurodesis, con tasas de fracaso inferiores a las de otras intervenciones de uso frecuente.
Los DPP proporcionan un enfoque alternativo; aunque se asocian con tasas inferiores de pleurodesis definitiva, probablemente se puede obtener un control similar a la disnea, con un menor riesgo de requerir una nueva intervención pleural invasiva.
A la hora de elegir una intervención hay que tener en cuenta la disponibilidad local, la experiencia mundial con los agentes y los eventos adversos (que tal vez no se identificaron en los ensayos aleatorizados) y la preferencia del paciente.
Se necesitan estudios de investigación adicionales para delinear las funciones de los diferentes tratamientos según las características del paciente, como la presencia de atrapamiento pulmonar. Para fundamentar la adopción de las decisiones clínicas, es primordial prestar más atención a los resultados centrados en el paciente, como la disnea, la calidad de vida y la preferencia del paciente. En los futuros diseños de los ensayos será fundamental prestar mucha atención a la minimización del riesgo de sesgo y a la estandarización de las medidas de resultado.
PICO
Resumen en términos sencillos
Intervenciones para el tratamiento del líquido que rodea los pulmones (líquido pleural) producido por el cáncer
Pregunta de la revisión
Se revisó la evidencia sobre la efectividad de diferentes métodos para tratar la acumulación de líquido alrededor de los pulmones en pacientes cuya causa fue el cáncer.
Antecedentes
El derrame pleural maligno (DPM) es una enfermedad que afecta a los pacientes con cáncer del revestimiento del pulmón. Esto puede provocar una acumulación de líquido en el espacio entre la parte exterior de los pulmones y la caja torácica (cavidad pleural), lo que a menudo produce disnea. Las opciones terapéuticas se centran en el control de los síntomas. Estas opciones incluyen la eliminación del líquido ya sea mediante drenaje torácico temporal, una exploración endoscópica de la cavidad pleural (toracoscopia) o un drenaje torácico semipermanente tunelizado debajo de la piel (drenaje pleural permanente). También puede recurrirse a la introducción de un producto químico en la cavidad pleural para evitar que vuelva a llenarse de líquido (pleurodesis). Se trató de averiguar cuál método era el más efectivo para evitar que se vuelva a acumular líquido (fracaso de la pleurodesis) y cuál era el mejor en cuanto a los efectos secundarios (incluidos el dolor y la fiebre) y otros resultados importantes, como la disnea y la calidad de vida.
Características de los estudios
Para responder esta pregunta, se recopilaron y analizaron todos los estudios relevantes. Resultó de interés la investigación de alta calidad, por lo tanto solo se buscaron ensayos controlados aleatorizados (en los que los participantes se asignan al azar a los tratamientos que se están investigando). Se analizó la mayoría de los datos con el «metanálisis en red», que permite comparar muchas intervenciones diferentes en un solo análisis. Este análisis jerarquiza las intervenciones según el orden de efectividad.
Certeza de la evidencia
La certeza de la evidencia de los estudios se clasificó en cuatro niveles: muy baja, baja, moderada o alta. La evidencia de certeza muy baja significa que hay muy poca seguridad en los resultados. La evidencia de certeza alta significa que hay mucha confianza en los resultados. Muchos de los estudios eran de calidad baja y los estudios individuales diferían bastante entre sí. Esto dificultó la extracción de conclusiones definitivas.
Resultados clave
De las búsquedas realizadas en junio 2019, se encontraron 80 estudios (18 nuevos) con 5507 participantes (2079 nuevos).
En el metanálisis en red, se encontró que la administración de talco a través de un tubo torácico después de drenar el fluido (suspensión de talco) provocó menos fracasos de la pleurodesis que otros métodos de uso frecuente, como los medicamentos doxiciclina o bleomicina a través de un drenaje torácico (certeza baja). Es probable que un procedimiento de toracoscopia para extraer el líquido e insuflar talco en el tórax (pleurodesis con talco) sea igual de efectivo que la suspensión de talco (certeza moderada).
Hubo un nivel de certeza bajo de que el riesgo de presentar fiebre sea similar entre los tratamientos. Tal vez haya escasa diferencia entre los tratamientos en cuanto a la posibilidad de presentar dolor (certeza baja para la bleomicina, los DPP y la doxiciclina; certeza muy baja para la pleurodesis con talco ).
Un DPP, que permite el drenaje intermitente de líquido domiciliario, podría aliviar la disnea al igual que un procedimiento de suspensión de talco (certeza baja).
Tal vez haya escasa diferencia en el riesgo de muerte entre los tratamientos cuando se comparan con la suspensión de talco (certeza baja para la bleomicina y el DPP sin drenaje diario; certeza muy baja para la pleurodesis con talco y la doxiciclina).
La probabilidad de necesitar otro procedimiento invasivo para eliminar el líquido fue menor después de un DPP que después de una pleurodesis con talco (certeza moderada).
Conclusiones
La evidencia disponible muestra que la pleurodesis con talco y la suspensión de talco son formas eficaces para tratar los DPM, con tasas de fracaso de la pleurodesis inferiores a las de otros métodos utilizados con frecuencia. Sin embargo, también es importante tener en cuenta la experiencia global de estos agentes y la información sobre la seguridad y los efectos secundarios cuando se elige el método de pleurodesis más adecuado.
Es menos probable que los DPP impidan que el líquido pleural se vuelva a acumular que la suspensión de talco, pero podrían ser igual de efectivos para ayudar con la disnea. Los pacientes con un DPP tienen menos probabilidades de requerir otro procedimiento invasivo para tratar el derrame pleural en el futuro.
Se necesitan estudios de investigación adicionales para explorar en mayor detalle a determinados grupos de pacientes y analizar los resultados como la disnea y la calidad de vida. Lo ideal sería tener una comprensión más cabal de los posibles efectos perjudiciales de los tratamientos, desde la perspectiva de los pacientes.
Authors' conclusions
Summary of findings
| Patient or population: adults with malignant pleural effusion Interventions: talc poudrage, bleomycin, IPC – not daily drainage, doxycycline, placebo Comparator (reference): talc slurry Outcome: pleurodesis failure rate Setting: inpatient and outpatients Data: based on network meta‐analysis of eligible studies | |||||||
| Total studies: 55* Total participants: 3758 No. interventions in network: 21 | Relative effect** Odds ratio (95% Cr‐I) Network estimate | Relative effect^^ Odds ratio (95% Cr‐I) Network estimate from studies at low risk of bias | Anticipated absolute effect (95% Cr‐I)*** | Certainty of evidence | Interpretation of findings | ||
| With talc slurry^ | With intervention | Difference | |||||
| Talc slurry (19 RCTs, 907 participants) Follow‐up: up to 12 months | Reference comparator | Reference comparator | 18 failures per 100 participants (11 to 24) | Not estimable | Not estimable | Moderatea | Reference comparator |
| Talc poudrage (9 RCTs, 530 participants) Follow‐up: up to 24 months | 0.50 (0.21 to 1.02) | 0.78 (0.16 to 2.08) | 18 failures per 100 participants (11 to 24) | 10 failures per 100 participants (4 to 19) | –8 (–15 to 0) i.e. 8 fewer failures per 100 participants | Moderateb | Probably comparable |
| Bleomycin (21 RCTs, 528 participants) Follow‐up: up to 24 months | 2.24 (1.10 to 4.68) | 3.93 (1.10 to 16.94) | 18 failures per 100 participants (11 to 24) | 32 failures per 100 participants (17 to 52) | 15 (2 to 32) i.e. 15 more failures per 100 participants | Lowa,b | May be inferior |
| IPC –not daily drainage (6 RCTs, 405 participants) Follow‐up: up to 12 months | 7.60 (2.96 to 20.47) | 8.60 (2.26 to 30.15) | 18 failures per 100 participants (11 to 24) | 62 failures per 100 participants (36 to 82) | 44 (20 to 63) i.e. 44 more failures per 100 participants | Moderatec | Probably inferior |
| Doxycycline (5 RCTs, 117 participants) Follow‐up: up to 12 months | 2.51 (0.81 to 8.40) | 1.89 (0.32 to 8.84) | 18 failures per 100 participants (11 to 24) | 35 failures per 100 participants (13 to 65) | 17 (–3 to 46) i.e. 17 more failures per 100 participants | Lowa,d | May be inferior |
| Placebo (4 RCTs, 159 participants) Follow‐up: up to 3 months | 15.90 (3.76 to 79.90) | 17.46 (3.33 to 97.26) | 18 failures per 100 participants (11 to 24) | 77 failures per 100 participants | 59 (26 to 77) i.e. 59 more failures per 100 participants | Moderated | Probably inferior |
| Network meta‐analysis summary of findings definitions: *Information is reported from studies included in the network meta‐analysis for pleurodesis failure. **Network meta‐analysis estimates are reported as ORs. ***Calculated using data from primary outcome network of pleurodesis failure. Anticipated absolute effect: compares two risks by calculating the difference between the risk of the intervention group with the risk of the control group. 'Absolute effect' and 'difference' estimates are posterior medians from a Bayesian statistical analysis. These may not sum exactly, due to skew in the posterior distributions. ^Reference comparator absolute event rate estimates are based on a random‐effects meta‐analysis of arm‐level data from all trials including a talc slurry arm and reporting the relevant outcome. Cr‐Is around 'differences' allow for sampling uncertainty in this baseline parameter, as well as uncertainty in the OR. ^^Network estimate from sensitivity analysis of studies at low risk of bias. These data are included within the summary of findings to reflect the ORs and Cr‐Is from the network estimates in which we have the greatest level of certainty in the evidence. Cr‐I: credible interval; IPC: indwelling pleural catheter; OR: odds ratio; RCT: randomised controlled trial. | |||||||
| GRADE Working Group grades of evidence (or certainty in the evidence): High certainty: we are very confident that the true effect lies close to that of the estimate effect. Moderate certainty: we are moderately confident in the effect estimate: the true effect is likely to be close to the estimate of the effect but there is a possibility that it is substantially different. Low certainty: our confidence in the effect estimate in limited: the true effect may be substantially different from the estimate of the effect. Very low certainty: we have little confidence in the effect estimate: the true effect is likely to be substantially different from the estimate of effect. | |||||||
| aDowngraded one level: evidence of indirectness. Of the studies evaluating talc slurry, 13/19 excluded trapped lung and 12/19 used a clinical definition of pleurodesis success. Of the studies in the network evaluating bleomycin, 9/21 excluded trapped lung and 12/21 used a clinical definition of pleurodesis success and variability in the dose of bleomycin noted. | |||||||
| Patient or population: adults with malignant pleural effusion Interventions: talc poudrage, bleomycin, IPC – not daily drainage, doxycycline, placebo Comparator (reference): talc slurry Outcome: fever Setting: inpatient and outpatients Data: based on network meta‐analysis of eligible studies | ||||||
| Total studies: 30 * Total participants: 2004 No. interventions in network: 14 | Relative effect** OR (95% Cr‐I) Network estimate | Anticipated absolute effect (95% Cr‐I)*** | Certainty of evidence | Interpretation of findings | ||
| With talc slurry^ | With intervention | Difference | ||||
| Talc slurry (9 RCTs; 823 participants) | Reference comparator | 21 cases in every 100 participants (11 to 33) | Not estimable | Not estimable | Lowa,b | Reference comparator |
| Talc poudrage (4 RCTs; 553 participants) | 0.89 (0.11 to 6.67) | 21 cases in every 100 participants (11 to 33) | 19 cases in every 100 participants (3 to 67) | 2 (–21 to 43) i.e. 2 fewer cases per 100 participants | Lowa,b | May be comparable |
| Bleomycin (14 RCTs; 774 participants) | 2.33 (0.45 to 12.50) | 21 cases in every 100 participants (11 to 33) | 39 cases in every 100 participants (10 to 79) | 17 (–10 to 55) i.e. 17 more cases per 100 participants | Lowa,b | May be comparable |
| IPC – not daily drainage (1 RCT; 101 participants) | 0.41 (0.00 to 50.00) | 21 cases in every 100 participants (11 to 33) | 10 cases in every 100 participants (0 to 93) | –10 (–28 to 70) i.e. 10 fewer cases per 100 participants | Lowa,b | May be comparable |
| Doxycycline (4 RCTs; 308 participants) | 0.85 (0.05 to 14.29) | 21 cases in every 100 participants (11 to 33) | 19 cases in every 100 participants (1 to 80) | –2 (–23 to 56) i.e. 2 fewer cases per 100 participants | Lowa,b | May be comparable |
| Placebo (2 RCTs; 118 participants) | 0.09 (0.00 to 5.00) | 21 cases in every 100 participants (11 to 33) | 2 cases in every 100 participants (0 to 59) | –17 (–30 to 36) i.e. 17 fewer cases per 100 participants | Lowa,b | May be comparable |
| Network meta‐analysis summary of findings definitions: *Information is reported from studies included in the network meta‐analysis for fever. **Network meta‐analysis estimates are reported as odds ratios. ***Anticipated absolute effect: compares two risks by calculating the difference between the risk of the intervention group with the risk of the control. group. 'Absolute effect' and 'difference' estimates are posterior medians from a Bayesian statistical analysis. These may not sum exactly, due to skew in the posterior distributions. ^Reference comparator absolute event rate estimates are based on a random‐effects meta‐analysis of arm‐level data from all trials including a talc slurry arm and reporting the relevant outcome. Cr‐Is around 'differences' allow for sampling uncertainty in this baseline parameter, as well as uncertainty in the OR. Cr‐I: credible interval; IPC: indwelling pleural catheter; OR: odds ratio; RCT: randomised controlled trial. | ||||||
| GRADE Working Group grades of evidence (or certainty in the evidence): High certainty: we are very confident that the true effect lies close to that of the estimate effect. Moderate certainty: we are moderately confident in the effect estimate: the true effect is likely to be close to the estimate of the effect but there is a possibility that it is substantially different. Low certainty: our confidence in the effect estimate in limited: the true effect may be substantially different from the estimate of the effect. Very low certainty: we have little confidence in the effect estimate: the true effect is likely to be substantially different from the estimate of effect. | ||||||
| aDowngraded one level for imprecision due to wide credible intervals of all network estimates. | ||||||
| Patient or population: adults with malignant pleural effusion Interventions: talc poudrage, bleomycin IPC – not daily drainage, doxycycline, placebo Comparator (reference): talc slurry Outcome: procedure‐related pain Setting: inpatient and outpatient Data: based on network meta‐analysis of eligible studies | ||||||
| Total studies: 31* Total participants: 2753 No. interventions in network: 14 | Relative effect** Odds ratio (95% Cr‐I) Network estimate | Anticipated absolute effect (95% Cr‐I)*** | Certainty of evidence | Interpretation of findings | ||
| With talc slurry^ | With intervention | Difference | ||||
| Talc slurry (9 RCTs, 1320 participants) | Reference comparator | 8 out of every 100 participants experiencing pain (1 to 35) | Not estimable | Not estimable | Lowa,b | Reference comparator |
| Talc poudrage (4 RCTs, 886 participants) | 1.26 (0.45 to 6.04) | 8 out of every 100 participants experiencing pain (1 to 35) | 10 out of every 100 participants experiencing pain (1 to 55) | 2 additional participants experiencing pain per 100 participants (–6 to 30) | Very lowa,b,c | May be comparable but evidence uncertain |
| Bleomycin (13 RCTs, 724 participants) | 2.85 (0.78 to 11.53) | 8 out of every 100 participants experiencing pain (1 to 35) | 19 out of every 100 participants experiencing pain (1 to 71) | 10 additional participants experiencing pain per 100 participants (–1 to 46) | Lowa,b | May be comparable |
| IPC – not daily drainage (6 RCTs, 738 participants) | 1.30 (0.29 to 5.87) | 8 out of every 100 participants experiencing pain (1 to 35) | 10 out of every 100 participants experiencing pain (1 to 55) | 1 additional participant experiencing pain per 100 participants (–9 to 30) | Lowa,b | May be comparable |
| Doxycycline (4 RCTs, 308 participants) | 3.35 (0.64 to 19.72) | 8 out of every 100 participants experiencing pain (1 to 35) | 22 out of every 100 participants experiencing pain (1 to 79) | 13 additional participants experiencing pain per 100 participants (–3 to 56) | Lowa,b | May be comparable |
| Placebo | 3 studies reported data for procedure‐related pain in participants receiving placebo but could not be included in the network as no events occurred in each study arm, causing computational problems. 1 study compared placebo with talc slurry and reported 0/17 participants receiving placebo and 0/14 receiving talc slurry required analgesia post procedure (Sorensen 1984). | — | — | |||
| Network meta‐analysis summary of findings definitions: *Information is reported from studies included in the network meta‐analysis for pain. **Network meta‐analysis estimates are reported as odds ratios. Cr‐I: credible interval. ***Anticipated absolute effect: compares two risks by calculating the difference between the risk of the intervention group with the risk of the control group. 'Absolute effect' and 'difference' estimates are posterior medians from a Bayesian statistical analysis. These may not sum exactly, due to skew in the posterior distributions. ^Reference comparator absolute event rate estimates are based on a random‐effects meta‐analysis of arm‐level data from all trials including a talc slurry arm and reporting the relevant outcome. Cr‐Is around 'differences' allow for sampling uncertainty in this baseline parameter, as well as uncertainty in the OR. Cr‐I: credible interval; IPC: indwelling pleural catheter; OR: odds ratio; RCT: randomised controlled trial. | ||||||
| GRADE Working Group grades of evidence (or certainty in the evidence): High certainty: we are very confident that the true effect lies close to that of the estimate effect. Moderate certainty: we are moderately confident in the effect estimate: the true effect is likely to be close to the estimate of the effect but there is a possibility that it is substantially different. Low certainty: our confidence in the effect estimate in limited: the true effect may be substantially different from the estimate of the effect. Very low certainty: we have little confidence in the effect estimate: the true effect is likely to be substantially different from the estimate of effect. | ||||||
| aDowngraded one level for imprecision due to wide credible intervals of network estimates. | ||||||
| Patient or population: adults with malignant pleural effusion Interventions: talc poudrage, bleomycin, IPC – not daily drainage, doxycycline, placebo Comparator (reference): talc slurry Outcome: postintervention patient‐reported control of breathlessness? Setting: inpatient and outpatient Data: based on direct meta‐analysis of 100‐mm VAS breathless score | |||||
| Intervention Total studies: 4* Total participants: 379 | Relative effect mean difference** (95% CI)*** | Anticipated absolute effect**** Change from baseline VAS score in mm (mean (95% CI)) | Certainty of evidence | Interpretation of findings | |
| With talc slurry | With intervention | ||||
| Talc slurry (2 RCTs, 248 participants) | Reference comparator | –26.29 (–35.26 to –17.34) | Not estimable | Moderatea | Reference comparator |
| Talc poudrage (1 RCT, 184 participants) 90‐day VAS score | 4.00 (–6.26 to 14.26) | –26.29 (–35.26 to –17.34) | –22.29 (–39.93 to –8.70) | Moderatea | Probably comparable |
| Bleomycin (1 RCT, 35 participants) | 1 study assessed breathlessness by functional class score (numerical scale 1–4, where 1 = none and 4 = breathless at rest) and found no difference between talc slurry and bleomycin (Zimmer 1997). | Very lowc,d,e | Uncertain | ||
| IPC –not daily drainage (2 RCTs, 160 participants) VAS scores at 42 days and 180 days | –6.12 (–16.32 to 4.08) | –26.29 (–35.26 to –17.34) | –32.41 (–45.98 to –18.86) | Lowa,b | May be comparable |
| Doxycycline | There was no direct evidence comparing talc slurry and doxycycline | — | — | ||
| Placebo | There were no data reported on breathlessness improvement in people receiving placebo | — | — | ||
| Direct meta‐analysis summary of findings definitions: *Information is included from direct meta‐analysis of studies using a 100‐mm VAS breathlessness scale. **The minimum clinically important difference for dyspnoea in malignant pleural effusion using the VAS breathlessness scale was 19 mm (95% CI 14 to 24) (Mishra 2015). ***Direct meta‐analysis results are reported as standardised mean difference. ****Anticipated absolute effect: compares two risks by calculating the difference between the risk of the intervention group with the risk of the control group. 'Absolute effect' and 'difference' estimates are posterior medians from a Bayesian statistical analysis. These may not sum exactly, due to skew in the posterior distributions. ^Reference comparator absolute event rate estimates are based on a random‐effects meta‐analysis of arm‐level data from all trials including a talc slurry arm and reporting the relevant outcome. CI: confidence interval; IPC: indwelling pleural catheter; OR: odds ratio; RCT: randomised controlled trial; VAS: visual analogue scale. | |||||
| GRADE Working Group grades of evidence (or certainty in the evidence): High certainty: we are very confident that the true effect lies close to that of the estimate effect. Moderate certainty: we are moderately confident in the effect estimate: the true effect is likely to be close to the estimate of the effect but there is a possibility that it is substantially different. Low certainty: our confidence in the effect estimate in limited: the true effect may be substantially different from the estimate of the effect. Very low certainty: we have little confidence in the effect estimate: the true effect is likely to be substantially different from the estimate of effect. | |||||
| aDowngraded one level for study limitations: lack of blinding of participants and clinicians (due to nature of trial interventions) leading to increased risk of bias in VAS score reporting. | |||||
| Patient or population: adults with malignant pleural effusion Interventions: talc poudrage, bleomycin IPC – not daily drainage, doxycycline, placebo Comparator (reference): talc slurry Outcome: mortality Setting: inpatient and outpatient Data: based on network meta‐analysis of eligible studies | ||||||
| Total studies: 31* Total participants: 2816 No. interventions in network: 15 | Relative effect** Odds ratio (95% Cr‐I) Network estimate | Anticipated absolute effect (95% Cr‐I)*** | Certainty of evidence | Interpretation of findings | ||
| With talc slurry^ | With intervention | Difference | ||||
| Talc slurry (13 RCTs, 1574 participants) Follow‐up: up to 12 months | Reference comparator | 31 deaths out of every 100 participants (14 to 55) | Not estimable | Not estimable | Lowa,b | Reference comparator |
| Talc poudrage (7 RCTs, 878 participants) Follow‐up: up to 10 months | 0.87 (0.53 to 1.43) | 31 deaths out of every 100 participants (14 to 55) | 28 deaths out of every 100 participants (11 to 55) | –3 (–12 to 8) i.e. 3 fewer deaths per 100 participants | Very lowa,b,c | May be comparable but evidence uncertain |
| Bleomycin (9 RCTs, 664 participants) Follow‐up: up to 9 months | 1.03 (0.45 to 2.41) | 31 deaths out of every 100 participants (14 to 55) | 32 deaths out of every 100 participants (11 to 63) | 1 (–15 to 21) i.e. 1 additional death per 100 participants | Lowa,b | May be comparable |
| IPC – not daily drainage 6 RCTs, 587 participants Follow‐up: up to 12 months | 0.80 (0.47 to 1.40) | 31 deaths out of every 100 participants (14 to 55) | 26 deaths out of every 100 participants (10 to 53) | –4 (–14 to 7) i.e. 4 fewer deaths per 100 participants | Lowa,b | May be comparable |
| Doxycycline (1 RCT, 80 participants) Follow‐up 30 days | 0.70 (0.16 to 3.00) | 31 deaths out of every 100 participants (14 to 55) | 24 deaths out of every 100 participants (5 to 64) | –6 (–28 to 25) i.e. 6 fewer deaths per 100 participants | Very lowa,b,d | May be comparable but evidence uncertain |
| Placebo | No studies reported mortality data for participants receiving placebo | — | — | |||
| Network meta‐analysis summary of findings definitions: *Information is reported from studies included in the network meta‐analysis for mortality. **Network meta‐analysis estimates are reported as ORs. ***Anticipated absolute effect: compares two risks by calculating the difference between the risk of the intervention group with the risk of the control group. 'Absolute effect' and 'difference' estimates are posterior medians from a Bayesian statistical analysis. These may not sum exactly, due to skew in the posterior distributions. ^Reference comparator absolute event rate estimates are based on a random‐effects meta‐analysis of arm‐level data from all trials including a talc slurry arm and reporting the relevant outcome. Cr‐Is around 'differences' allow for sampling uncertainty in this baseline parameter, as well as uncertainty in the OR Cr‐I: credible interval; IPC: indwelling pleural catheter; OR: odds ratio; RCT: randomised controlled trial. | ||||||
| GRADE Working Group grades of evidence (or certainty in the evidence): High certainty: we are very confident that the true effect lies close to that of the estimate effect. Moderate certainty: we are moderately confident in the effect estimate: the true effect is likely to be close to the estimate of the effect but there is a possibility that it is substantially different. Low certainty: our confidence in the effect estimate in limited: the true effect may be substantially different from the estimate of the effect. Very low certainty: we have little confidence in the effect estimate: the true effect is likely to be substantially different from the estimate of effect. | ||||||
| aDowngraded one level for imprecision due to wide credible intervals of all network estimates. In the talc poudrage to talc slurry comparison 3/7 RCTs included only people with breast cancer. | ||||||
| Patient or population: adults with malignant pleural effusion Interventions: talc poudrage, bleomycin, IPC – not daily drainage, doxycycline, placebo Comparator (reference): talc slurry Outcome: patient acceptability (need for repeat invasive pleural intervention) Setting: inpatient and outpatient Data: based on available direct evidence* | ||||||
| Intervention Total studies: 9 Total participants: 883 | Relative effect** Odds ratio (95% CI) | Anticipated absolute effect (95% CI)*** | Certainty of evidence | Interpretation of findings | ||
| With talc slurry^ | With intervention | Difference | ||||
| Talc slurry (8 RCTs, 850 participants) Follow‐up: 12 months | Reference comparator | 20 out of every 100 participants requiring repeat invasive interventions (16 to 24) | Not estimable | Not estimable | Moderatea,b | Reference comparator |
| Talc poudrage (2 RCTs, 380 participants) Follow‐up: 6 months | 0.96 (0.59 to 1.56) | 20 out of every 100 participants requiring repeat invasive interventions (16 to 24) | 19 out of every 100 participants (11 to 30) | –1 out of every 100 participants (–7 to +8) i.e. 1 less per 100 participants | Moderateb,c | Probably comparable |
| Bleomycin (1 RCT, 33 participants) Follow‐up to 8 months | 4.33 (0.16 to 114.58) | 20 out of every 100 participants requiring repeat invasive interventions (16 to 24) | 52 out of every 100 participants (4 to 97) | +32 out of every 100 participants (–16 to 77) i.e. 32 more repeat procedures required per 100 participants | Very lowd,e | May be inferior but the evidence is uncertain |
| IPC –not daily drainage (3 RCTs, 343 participants) Follow‐up: 12 months | 0.25 (0.13 to 0.48) | 20 out of every 100 participants requiring repeat invasive interventions (16 to 24) | 6 out of every 100 participants (3 to 11) | –14 out of every 100 participants (–19 to –8) i.e. 14 less per 100 participants | Moderatea,b | Probably superior |
| Doxycycline | There were no direct data comparing doxycycline and talc slurry. | — | — | |||
| Placebo | There were no direct data comparing placebo and talc slurry. | — | — | |||
| Direct meta‐analysis summary of findings definitions: *Based on direct meta‐analysis. **Estimates are reported as ORs. ***Anticipated absolute effect: compares two risks by calculating the difference between the risk of the intervention group with the risk of the control group. 'Absolute effect' and 'difference' estimates are posterior medians from a Bayesian statistical analysis. These may not sum exactly, due to skew in the posterior distributions. ^Reference comparator absolute event rate estimates are based on a random‐effects meta‐analysis of arm‐level data from all trials including a talc slurry arm and reporting the relevant outcome. CI: confidence interval; IPC: indwelling pleural catheter; OR: odds ratio; RCT: randomised controlled trial. | ||||||
| GRADE Working Group grades of evidence (or certainty in the evidence): High certainty: we are very confident that the true effect lies close to that of the estimate effect. Moderate certainty: we are moderately confident in the effect estimate: the true effect is likely to be close to the estimate of the effect but there is a possibility that it is substantially different. Low certainty: our confidence in the effect estimate in limited: the true effect may be substantially different from the estimate of the effect. Very low certainty: we have little confidence in the effect estimate: the true effect is likely to be substantially different from the estimate of effect. | ||||||
| aDowngraded one level: evidence of indirectness: people with trapped lung excluded by Thomas 2017, but not Boshuizen 2017 or Davies 2012. | ||||||
Background
Malignant pleural effusion (MPE) is a common clinical problem, with an estimated annual incidence of at least 150,000 in the USA (American Thoracic Society 2000). Fifteen percent of people diagnosed with cancer will develop pleural effusion during the course of their disease as a result of malignant infiltration of the pleura. It often confers a poor prognosis (Rodrîguez‐Panadero 1989). Breathlessness results from compression of the underlying lung and impaired diaphragmatic and chest wall movement and is often relieved by pleural fluid aspiration.
This is the first update of the review published in Issue 5, 2016 (Clive 2016), which replaced the original review published in 2004 (Shaw 2004).
Description of the condition
MPE is a condition whereby excess fluid accumulates in the pleural cavity. It is thought to be caused by a combination of direct pleural tumour invasion, resulting in increased permeability of the pleural microvessels and obstruction of local lymph drainage channels causing reduced fluid re‐absorption (Rodrîguez‐Panadero 2008). The most common primary sites which metastasise to the pleura are lung cancer in men and breast cancer in women, but other primary sites include lymphoma, genitourinary and gastrointestinal malignancy (DiBonito 1992; Sears 1987). In addition, the pleura may be the primary site of the malignancy, as is the case in mesothelioma. In the majority of cases, the diagnosis of pleural malignancy is made by cytological analysis of the pleural fluid or pleural biopsy. Depending on the clinical situation, confirmation of malignancy elsewhere and an otherwise unexplained (usually exudative) effusion may also be attributed to malignancy. Survival of these patients varies widely (Bielsa 2008; Burrows 2000). Tools have been developed to aid estimation of an individual's prognosis, which may in turn help with selection of the most appropriate management strategy (Clive 2014; Psallidas 2018).
Description of the intervention
A number of different approaches may be used to manage MPE and the chosen method is likely to depend on clinical factors, patient preferences and local availability of the various techniques. Instillation of a sclerosant into the pleural cavity through an intercostal chest drain, after complete fluid drainage has been the mainstay of treatment for many years (known as 'bedside' or 'slurry' pleurodesis). This technique aims to fuse the pleural layers together by means of local inflammation induced by the pleurodesis agent, thereby preventing pleural fluid re‐accumulation. The optimal management strategy to maximise pleurodesis success in terms of the size of chest drain, patient positioning, use of analgesia and type of sclerosant has historically been the subject of debate (Roberts 2010).
Thoracoscopy is a method which can be used to drain an effusion and, during the same procedure, deliver a sclerosant into the pleural cavity with a view to achieving pleurodesis (Rahman 2010). Thoracoscopy can either be performed under moderate sedation (medical thoracoscopy), or as a surgical procedure under general anaesthetic (video‐assisted thoracoscopic surgery (VATS)). In both techniques, the pleural fluid is drained and the pleural cavity is visualised using a fibreoptic camera. Loculations can be broken down and biopsies may be taken to gain a histological diagnosis. At the end of the procedure, a temporary chest tube is left in place to allow the lung to re‐expand.
An alternative approach in the management of MPE is the use of indwelling pleural catheters (IPCs). These are long‐term chest tubes which are tunnelled under the skin and therefore allow regular, intermittent fluid drainage to be performed in the community, potentially minimising recurrent hospital attendances. They have an established role in the management of pleural effusions in people with trapped lung, but are increasingly being used for the primary management of malignant effusions as an alternative to chemical pleurodesis (Davies 2012; Demmy 2012; Thomas 2017). Spontaneous pleurodesis may occur, allowing the drain to be removed without recurrence of the effusion (Tremblay 2006).
In certain clinical scenarios, none of the above options may be suitable and simple pleural fluid aspiration or medical management of a patient's breathlessness (e.g., using opiates) may be deemed more appropriate. This may be the case for people in the terminal phase of their illness where invasive techniques may be considered to confer unnecessary discomfort.
How the intervention might work
Pleurodesis aims to induce inflammation between the pleural layers causing them to become adhered. This effectively obliterates the pleural space and by so doing, prevents fluid recurrence. For pleurodesis to be successful, the visceral and parietal pleural surfaces must be opposed, hence if lung expansion is incomplete, pleurodesis is more likely to fail.
Trapped lung (also known as 'entrapped' or 'non‐expandable' lung) can occur when full lung expansion is limited by either a visceral pleural peel or endobronchial obstruction. In this situation, even once the fluid is drained, visceral and parietal pleural apposition does not readily occur, with attempts at inflating the lung potentially distressing for patients. This results in pleurodesis attempts being less effective and often limits the treatment options to either an IPC or surgery.
IPCs allow regular, intermittent pleural fluid drainage, which relieves the pressure on the diaphragm and chest wall, and promotes lung re‐expansion. By so doing, breathlessness is improved and, in a small proportion of people, autopleurodesis may occur (Dipper 2019).
Why it is important to do this review
Due to wider availability of pleural interventions, such as thoracoscopy under sedation and IPCs, the management options available to people with MPE are expanding. This review will help to define the most effective pleurodesis approach, primarily addressing the type of agent used.
Given the availability of many pair‐wise comparisons for the method of pleurodesis administration, type of pleurodesis agent and approaches to IPC use, this is a multiple interventions review. We performed network meta‐analysis (NMA) to synthesise all the available evidence and determine a treatment hierarchy.
In 2019, the National Institute for Health and Care Excellence (NICE) in the UK commissioned the priority updating of this review to inform the guideline Lung cancer: diagnosis and management [NG122] (NICE 2019).
Objectives
To ascertain the optimal management strategy for adults with malignant pleural effusion in terms of pleurodesis success and to quantify differences in patient‐reported outcomes and adverse effects between interventions.
Methods
Criteria for considering studies for this review
Types of studies
We included reports of randomised controlled trials (RCTs) in this review. This included randomised cross‐over trials and cluster randomised trials, although we did not identify any studies of these types. We included both single‐ and multicentre studies. We excluded studies that were stated to be randomised, but were at high risk of bias for adequate sequence generation or allocation concealment.
Types of participants
Inclusion
-
Adults over the age of 16 years.
-
Symptomatic pleural effusion resulting from an underlying malignant process (of any type and stage).
Exclusion
-
Studies recruiting both malignant and non‐malignant participants with no clear distinction between the two groups in the results section.
-
Studies evaluating the effect of a drug administered via any method other than the intrapleural route.
-
Studies including participants with effusions within a variety of body cavities (e.g. pleural, peritoneal, pericardial), where the effect of the treatments in the subgroup of participants with pleural effusions could not be distinguished in the results section.
Types of interventions
We identified studies comparing the following.
-
Type of sclerosant.
-
Mode of administration of sclerosant (thoracoscopic pleurodesis and bedside pleurodesis).
-
Bedside or thoracoscopic pleurodesis and IPC insertion.
-
Techniques used to optimise pleurodesis success rate, namely:
-
chest drain size;
-
type of analgesia given;
-
duration of drainage after instillation of sclerosant;
-
patient positioning after pleurodesis (e.g. patient rotation);
-
use of intrapleural fibrinolytics;
-
methods to optimise IPC use including IPC drainage regimen and combined talc administration via IPC.
-
We generated a network of interventions, including comparisons between the types of sclerosant, mode of administration and IPC use. We assumed that any participant meeting the inclusion criteria could be, in principle, randomised to any of the eligible interventions. This is referred to as the interventions being 'jointly randomisable'. However, if we considered an intervention was not jointly randomisable, for example the treatment was specific to a certain tumour type, we reported the results separately from the network (Salanti 2012).
Interventions of direct interest
We included RCTs that evaluated one or more of the following intrapleural interventions: talc poudrage, talc slurry, bleomycin, tetracycline, doxycycline, iodine, C parvum, IPC (both daily drainage and without daily drainage), talc administered via IPC, mitoxantrone, mustine, mepacrine, interferon, triethylenethiophosphoramide and adriamycin compared with another intervention or placebo. If we identified other sclerosants that we were not aware of, we considered them as eligible and included them in the network after assessing their comparability with the prespecified set of competing interventions. We reported the findings for these interventions in the results and the conclusions of the review.
Types of outcome measures
Primary outcomes
Efficacy of pleurodesis was our primary outcome measure.
Definitions of pleurodesis failure varied between studies and although current practice would define this by a lack of recurrence of symptoms or need for a repeat pleural intervention to manage the effusion, some older studies used less clinically relevant definitions (e.g. re‐accumulation of effusion on imaging). We still included these studies in the review, and documented the method used to define pleurodesis for all studies in the assessment of the risk of bias.
For the purposes of the primary outcome, we used the following hierarchy of preferences to judge pleurodesis failure (if a study reported more than one definition of pleurodesis failure, the highest of these according to this hierarchy was used):
-
need for a repeat pleural procedure to manage recurrence of the effusion, or continued drainage of pleural fluid from an IPC (if applicable);
-
evidence of significant pleural fluid re‐accumulation on radiological imaging (e.g. chest X‐ray or ultrasound);
-
pleurodesis failure in the opinion of the trial investigators.
For studies evaluating IPCs, we judged that an effective pleurodesis was achieved when there was cessation of pleural fluid drainage or device removal due to cessation of drainage, or both.
Similarly, we selected the time point used to define pleurodesis efficacy using the following hierarchy of preferences:
-
2 ‐ 4 months;
-
more than 4 ‐ 7 months;
-
more than 7 ‐ 11 months;
-
more than 11‐12 months;
-
less than 2 months;
-
more than 12 months.
For participants who died before the time point at which pleurodesis efficacy was assessed, we classified these according to their last known pleurodesis outcome prior to their death (i.e. their last observation carried forward). If these data were not provided, we used the available reported data.
Secondary outcomes
-
Adverse effects and complications due to interventions, specifically the presence or absence of pain and fever after the intervention.
-
Patient‐reported control of breathlessness, as measured by a valid and reliable scale (e.g. visual analogue scale (VAS), numerical rating scale or dyspnoea/breathlessness‐specific multidimensional scale).
-
Participants' quality of life and symptom control (including pain), measured by a valid and reliable scale.
-
Relative costs of the comparative techniques as reported by the individual trials. For ease of comparison, data reported in other currencies were converted to USD.
-
Overall mortality (we used the data for the reported outcomes closest to three months).
-
Median survival.
-
Duration of inpatient stay in days (both total length of stay and from time of intervention until discharge).
-
Patient acceptability of the interventions as judged by a valid scale (e.g. VAS or numerical rating scale). Within this, we included the need for repeat invasive pleural intervention.
Search methods for identification of studies
Trials that compared at least two of the interventions (including placebo) were eligible. We included all possible comparisons formed by the interventions of interest.
Electronic searches
To identify studies for inclusion in this review, we searched the following databases:
-
Cochrane Central Register of Controlled Trials (CENTRAL) (the Cochrane Library) 2019, Issue 5;
-
MEDLINE (Ovid) 1948 to 24 June 2019;
-
Embase (Ovid) 1974 to week 25 2019;
-
CINAHL (EBSCO) 1980 to June 2019;
-
Web of Science Science Citation Index Expanded (SCI‐EXPANDED) and Social Sciences Citation Index (SSCI) searched to 2015. (Due to a change in library provision we did not have access beyond 2015.)
The search strategies can be viewed in Appendix 1. There were no language restrictions. We included single and multicentre studies.
Searching other resources
We screened the reference lists from the included studies for additional publications. We searched the reference lists from relevant chapters in key resources, such as the British Thoracic Society Pleural Disease Guidelines (Roberts 2010). We searched clinicaltrials.gov (www.clinicaltrials.gov), and the World Health Organization International Clinical Trials Registry Platform (ICTRP) (apps.who.int/trialsearch/) for ongoing trials.
Data collection and analysis
Selection of studies
One author screened all titles and abstracts retrieved by the search for relevance (AOC). For the 2020 update, this was performed by two authors (AOC and AD) using the Covidence platform. We identified potentially eligible studies and obtained the full papers. Two review authors (AOC and NAM or AD) independently assessed each full text for inclusion in the review and resolved any disagreement through discussion or by a third review author (NP).
Data extraction and management
Two review authors (two of AOC, RB, NP and NAM up to 2016; two of AOC, AD and RB; and NP and NAM from 2016 to 2020) extracted data from each included study.
We resolved disagreements through discussion and referral to one of the other review authors. If a review author was involved in one of the included studies, they did not perform the data extraction for that study. Data collected included the following.
-
Publication details including:
-
title, author(s), date, country and other citation details;
-
study aim and design;
-
study funding sources and author declarations of conflicts of interest;
-
primary and secondary outcomes;
-
number of participants randomised.
-
-
Details of the interventions and comparison group including type of intervention, duration, dose, mode of administration and number of doses.
-
Primary and secondary outcomes (as detailed in Primary outcomes; Secondary outcomes), and data on adverse effects and complications.
-
Assessment of the study's risk of bias.
-
Data on potential effect modifiers including the following study and participant characteristics:
-
how pleurodesis was defined (radiology only or including clinical need as well as radiology);
-
whether people with trapped lung were included or not;
-
size of the chest tube through which bedside pleurodesis was administered (defined as small (less than 20‐French (Fr)), large (20‐Fr or greater) or unknown);
-
time point at which pleurodesis was defined;
-
tumour types included in the study.
-
We requested additional data from the study authors as required. One review author (AOC or AD) entered outcome data suitable for pooling into Cochrane's statistical software (RevMan Web). Where we performed a NMA, we transferred data to the WinBUGS software (Lunn 2000).
Assessment of risk of bias in included studies
We limited inclusion to studies that were randomised as a minimum. Two review authors (two of AOC, RB, NP and NAM up to 2016; two of AOC, AD, RB, NP and NAM from 2016 to 2020) independently assessed risk of bias for each study, using the criteria outlined in the Cochrane Handbook for Systematic Reviews of Interventions (Higgins 2011a), with any disagreements resolved by discussion. In our original protocol, we had planned to include sample size in our risk of bias assessment. However, in view of Cochrane guidance stating imprecision should not be considered a risk of bias, we did not perform this assessment (Higgins 2011a). We assessed the following for each study.
Random sequence generation (checking for possible selection bias)
We assessed the method used to generate the allocation sequence as: low risk of bias (any truly random process, e.g. random number table; computer random‐number generator); unclear risk of bias (method used to generate sequence not clearly stated). We excluded studies using a non‐random process, that is, at high risk of bias (e.g. odd or even date of birth; hospital or clinic record number).
Allocation concealment (checking for possible selection bias)
The method used to conceal allocation to interventions prior to assignment determines whether intervention allocation could have been foreseen in advance of, or during, recruitment, or changed after assignment. We assessed the methods as: low risk of bias (e.g. telephone or central randomisation; consecutively numbered sealed opaque envelopes); unclear risk of bias (method not clearly stated). We excluded studies at high risk of bias that did not conceal allocation (e.g. open list).
Blinding of participants and personnel (checking for possible performance bias)
We assessed the methods used to blind study participants and personnel from knowledge of which intervention a participant received. We assessed the methods as: low risk of bias (study stated there was blinding of participants and key study personnel and unlikely blinding could be broken, or no blinding or incomplete blinding but the outcome not likely to be influenced by lack of blinding); unclear risk of bias (insufficient information to permit judgement of low or high risk of bias); high risk of bias (no blinding or incomplete blinding, which is likely to influence the trial outcome or blinding attempted but likely it could have been broken and the outcome is likely to be influenced by lack of blinding).
Blinding of outcome assessment (checking for possible detection bias)
We assessed the methods used to blind outcome assessors from knowledge of which intervention a participant received. We assessed the methods as: low risk of bias (study stated that it was not blinded but the review authors judged that the outcome measurement was not likely to be influenced by lack of blinding or blinding of outcome assessment was ensured); unclear risk of bias (study provided an inadequate description to permit judgement of low risk or high risk); high risk of bias (no blinding of outcome assessment and outcome likely to be influenced by lack of blinding, or there was blinding of the outcome assessment but likely that the blinding could have been broken).
Incomplete outcome data (checking for possible attrition bias due to the amount, nature and handling of incomplete outcome data)
We assessed the methods used to deal with loss to follow‐up (LTFU) for each of the given studies. Due to the challenges of inevitable missing outcome data given the predictable attrition of patients due to death in the palliative care population, we took into account whether missing data had been justified, whether the rate was similar in the different treatment arms, whether the treatment being evaluated was felt to have an impact on the degree of missing outcome data and whether an intention‐to‐treat (ITT) analysis had been attempted. We assessed the methods used to deal with incomplete data as: low risk (rate of missing data were balanced between the treatment arms, seemed reasonable and had been justified; data had been analysed according to the participants' randomised treatment allocation; a suitable imputation method may have been used to account for missing data); unclear risk of bias (insufficient information given to allocate trial to high‐ or low‐risk group); high risk of bias (imbalanced missing outcome data between the treatment arms or missing outcome data felt to be related to the true outcome; reasons for LTFU poorly justified; no attempt at ITT analysis; inappropriate imputation used).
Selective outcome reporting
We assessed the studies for selective outcome reporting using the following criteria: low risk of bias (all outcomes predefined and reported, e.g. in a published protocol, or all clinically relevant and reasonably expected outcomes were reported); uncertain risk of bias (unclear whether all predefined and clinically relevant outcomes were reported); high risk of bias (one or more clinically relevant and reasonably expected outcome was not reported and data on these outcomes were likely to have been recorded).
Other sources of bias
This section was used to report other biases, which were detected but did not fit into the above categories (e.g. industry bias, academic bias or other methodological flaws that may have caused bias). We assessed the methods used to deal with other sources of bias as: low risk of bias (the trial appeared free from other potential biases); unclear risk of bias; high risk of bias (other source of bias was identified).
Measures of treatment effect
Relative treatment effects
For proportions (dichotomous outcomes), such as pleurodesis efficacy and mortality, we calculated the odds ratio (OR) with 95% confidence intervals (CIs). For continuous data (such as length of hospital stay and cost), we planned to use the mean difference (MD) with 95% CIs and the number needed to treat for an additional beneficial efficacy outcome (NNTB), and the number needed to treat for an additional harmful outcome (NNTH) for adverse effects.
We planned to treat ordinal outcome measures (e.g. breathlessness scales and quality of life data) as continuous so long as the scale was sufficiently long. If different scales were used by the included studies, we planned to use the standardised mean difference (SMD) in meta‐analyses.
We presented results from both pair‐wise standard meta‐analysis (both random and fixed effect) and NMA (random effects only) as summary relative effect sizes (OR, MD or SMD with 95% CIs) for each possible pair of treatments (Deeks 2011).
Relative treatment ranking
Based on the results of the NMA, we estimated the rank of each competing intervention's effectiveness. We presented estimated ranks (medians) with 95% credible intervals (Cr‐Is) (representing uncertainty about the true rank) produced from the Bayesian analyses (Higgins 2011b).
Unit of analysis issues
If repeated observations on the same participants occurred during the trial (e.g. pleurodesis success rate at different time points), we analysed these separately. We used only one measure per participant for the primary endpoint (according to the hierarchy of preferences detailed above Primary outcomes).
For the purpose of meta‐analysis, if a study had multiple doses for a certain substance, we combined and compared all relevant experimental intervention groups with the combination of all relevant control groups. We reported any evidence for effects of the different doses descriptively.
For cross‐over trials, we planned to analyse data using pair‐wise meta‐analysis, taking into account the cross‐over design. If meta‐analysis had been performed containing cluster randomised trials and the presented results had not accounted for clustering, then we planned to make an appropriate adjustment, as described in the Cochrane Handbook for Systematic Reviews of Interventions (Higgins 2011b).
We treated multi‐arm studies as multiple independent two‐arm studies in the standard pair‐wise meta‐analysis. In the NMA, we accounted for the correlation between the effect sizes from multi‐arm studies.
In meta‐analysis of continuous outcomes, we pooled differences in change from baseline, rather than differences in final values (Higgins 2019).
Dealing with missing data
We attempted to contact the authors of included studies to clarify any missing data.
We imputed missing standard deviations (SD) based on the mean SDs from the other included studies if SDs for mean scores had not been reported and it had not been possible to obtain the information from the study authors. We only included data for those participants whose results were known if an ITT analysis was not reported by the study. However, we assessed the potential impact of these missing data in the 'Risk of bias' table.
For continuous outcomes, where baseline and final values were reported without a SD of change score or correlation coefficient, we imputed correlation coefficients based on other studies in order to estimate the SD of change.
Assessment of heterogeneity
Assessment of clinical and methodological heterogeneity within treatment comparisons
We extracted data from study reports regarding clinical heterogeneity such as details on the intervention and control treatments, participant characteristics and the outcomes evaluated.
We assessed the presence of clinical heterogeneity within each pair‐wise comparison by comparing the study population characteristics across all eligible trials. We only performed meta‐analysis when considered reasonable based on the degree of heterogeneity.
Assessment of transitivity across treatment comparisons
We assessed the assumption of transitivity by comparing the distribution of the potential effect modifiers across the different pair‐wise comparisons (Jansen 2013).
Assessment of reporting biases
We performed searches in multiple databases to ensure all potentially eligible studies were identified (Electronic searches). The review authors were alert to duplicated publication of results when analysing the studies to ensure each participant was only included once in the analysis.
If unpublished studies were identified, we tried to obtain sufficient information in order for them to be included in the analysis. The same applied for data published in abstract format.
In studies published in a language other than English, we made every effort to obtain a translation of at least the abstract. If sufficient information was available, we included the study in the analysis.
Data synthesis
Methods for direct treatment comparisons
Since we expected some clinical heterogeneity between studies (e.g. due to different definitions of pleurodesis success, different time points and doses used), we believed that the assumption of a single fixed intervention effect across included studies was unlikely to be valid. Our primary analyses therefore employed random‐effects models. Since pooled effect estimates from random‐effects models give relatively more weight to smaller studies, which is often considered undesirable, we performed sensitivity analyses using fixed‐effect meta‐analysis models. We performed standard pair‐wise meta‐analysis using a random‐effects model in Cochrane's statistical software, RevMan Web, for every treatment comparison with two or more studies.
For binary outcome data, we meta‐analysed ORs. For continuous data, we planned to use the MD or SMD and perform a check to identify if continuous outcome data were skewed. If this was the case, we planned to analyse the data on a log scale. If we assessed studies as unsuitable for meta‐analysis, or insufficient studies were identified for meta‐analysis to be performed, we planned to present data by means of a narrative synthesis. If sufficient data were available, we used similar analysis methods to analyse the adverse effects data. Alternatively, we summarised this qualitatively.
Methods for indirect and mixed comparisons
Wherever possible, we performed a multiple‐intervention, NMA of primary and (separately) of each secondary outcome measure. We used a Bayesian random‐effects model, fitted using the WinBUGS software (Dias 2018; Lunn 2000). We assumed binomial likelihoods for count data, and modelled log ORs as random effects across studies. We assigned vague prior distributions with mean 0 and SD of 100 to all mean log ORs and to baseline event rates in each study on the logit scale. We assumed a common between‐studies SD within a network, represented by the parameter Tau which was assigned a Uniform (0.2) prior distribution.
For each NMA, we used the Stata software to generate a network plot (using the networkplot command) and inconsistency plot (using the ifplot command) (Chaimani 2013).
Subgroup analysis and investigation of heterogeneity
Assessment of statistical heterogeneity
In pair‐wise meta‐analyses, we estimated the between‐study SD (Tau2) separately for each intervention comparison. We also reported the I2 statistic for each pair‐wise meta‐analysis, which is an estimate of the proportion of variability in effect estimates that is due to heterogeneity (Higgins 2003).
The assessment of statistical heterogeneity in the NMA was based on the magnitude of and Cr‐Is for the between‐studies SD (Tau), which was assumed to be common across all comparisons within a network.
As described below, reasons for heterogeneity were investigated using subgroup or sensitivity analyses.
Assessment of statistical inconsistency
Inconsistency in the network refers to differences between the direct and indirect effect estimates for the same comparison (Donegan 2013). We used both a loop‐specific approach and a global approach to evaluate these effects.
To evaluate the presence of inconsistency locally we used the loop‐specific approach. This assesses the consistency assumption in each closed loop of the network separately. We identified all the triangular loops (comprising three direct treatment comparisons, all compared with each other) and all the quadratic loops (involving four comparisons) in the network. We compared the differences between the direct and indirect estimates for these loops to generate inconsistency factors, with 95% CIs, calculated and displayed graphically using the 'ifplot' command in Stata (Chaimani 2013; Chaimani 2015). We assumed the estimated between‐study SD (Tau) from the Bayesian analysis of the full network for each loop. We used the magnitude of the inconsistency factors to infer the presence and degree of inconsistency in each loop.
In addition to this, we used a global approach, involving formally comparing the fit of the NMA model (which assumes consistency) with that of an 'inconsistency' model (in which all consistency constraints are removed). The inconsistency model used is equivalent to fitting a random‐effects meta‐analysis model for all pair‐wise comparisons, with a shared between‐studies variance parameter but no assumptions about direct and indirect evidence forming coherent 'loops'. We calculated the mean residual deviance and the deviance information criterion (DIC) for each model (mean residual difference +pD). If the DIC for the inconsistency model was more than five units higher than that of the consistency model, this was viewed as evidence of inconsistency (Dias 2013). We further examined differences in the estimated between‐study SD parameter (Tau) across the two models: a reduced estimate of Tau in the inconsistency relative to the NMA model may also be indicative of inconsistency (Dias 2018).
Further, for the main analyses, we plotted the mean residual deviance contributions of each data point under the inconsistency versus NMA models. This allows identification of specific data points for which the inconsistency model has improved fit, that is, data points that are potentially inconsistent with the network (Dias 2018).
Assessment of statistical imprecision
We evaluated precision of results, and subsequent rankings, based on their 95% CIs (for pair‐wise analysis) or Cr‐Is (for Bayesian NMA).
Sensitivity analysis
Sensitivity analysis and investigation of heterogeneity and inconsistency
We conducted subgroup or sensitivity network meta‐analyses by re‐running the model on restricted numbers of studies according to the following potential effect modifiers, which we felt could be sources of inconsistency or heterogeneity, or both:
-
analysis only including studies which used a clinico‐radiological definition of pleurodesis failure;
-
analysis only including studies which analysed pleurodesis efficacy at one month after the intervention;
-
analysis only including studies which analysed pleurodesis efficacy at three months after the intervention;
-
analysis only including studies which analysed pleurodesis efficacy at more than six months after the intervention;
-
analysis only including studies which excluded participants with trapped lung;
-
analysis only including studies which administered pleurodesis through a large‐bore chest tube (greater than 20‐Fr)
-
analysis only including studies which administered pleurodesis through a chest tube (any size)
-
analysis only including studies at a low risk of bias (maximum of one domain assessed as high risk of bias).
In the protocol, we planned to investigate different tumour types, age of participants and baseline performance status, although there were insufficient data on this in the included studies to perform these subgroup analyses.
We performed a post‐hoc sensitivity NMA evaluating only pleurodesis agents delivered via a chest tube (as opposed to being given at thoracoscopy). We removed the trials evaluating talc poudrage and IPC use from the main network and repeated the analysis.
We performed sensitivity analyses of direct evidence on pleurodesis failure using fixed‐effect meta‐analysis models, since pooled effect estimates from random‐effects models give relatively more weight to smaller studies, which is often considered undesirable.
We performed an additional post‐hoc pair‐wise meta‐analysis comparing ipsilateral repeat invasive pleural intervention rates (where data were available).
Summary of findings and assessment of the certainty of the evidence
We created 'summary of findings' tables for the most clinically relevant outcomes: pleurodesis failure and breathlessness. We summarised adverse event data for procedure‐related pain and fever. Data on mortality were also included. We included the need for an additional invasive pleural procedure, due to failure of the initial intervention for pleural fluid control, as this is an important outcome of relevance to both patients and clinicians.
We used talc slurry as our reference comparator. We graded evidence relating to the most commonly compared interventions with the most widespread availability. We calculated anticipated absolute effect estimates using data from NMA for pleurodesis failure, pain, mortality and fever. We used pair‐wise analysis results for breathlessness and repeat pleural intervention.
We followed the approach proposed by Yepes‐Nunez and colleagues and the methods and recommendations described in Chapter 14 of the Cochrane Handbook of Systematic Reviews of Interventions (Higgins 2019; Yepes‐Nunez 2019). Two review authors (AD and AOC) rated the quality of the direct and indirect evidence using GRADE methodology. We considered study limitations (overall risk of bias), assessments of inconsistency (heterogeneity), indirectness and intransitivity, imprecision and publication bias. We justified and documented judgements, which have been incorporated into the reporting of results for each outcome.
We reached an overall judgement on the certainty in the estimate of the effect across these considerations, classified as 'high', 'moderate', 'low' or 'very low'. Our 'interpretation of findings' reflects this certainty of evidence outcome and, where available, this was combined with the overall ranking of each intervention in our NMA.
Results
Description of studies
Results of the search
We performed the literature search in June 2019, covering the period from April 2015 when searches for the previous edition of this review were conducted (Figure 1). We identified 1396 records from database searches before exclusion of three duplicates. We identified one additional record from references listed in a systematic review (Putnam 1999, referenced in Sivakumar 2019). From trials registry searches, we identified 21 records.
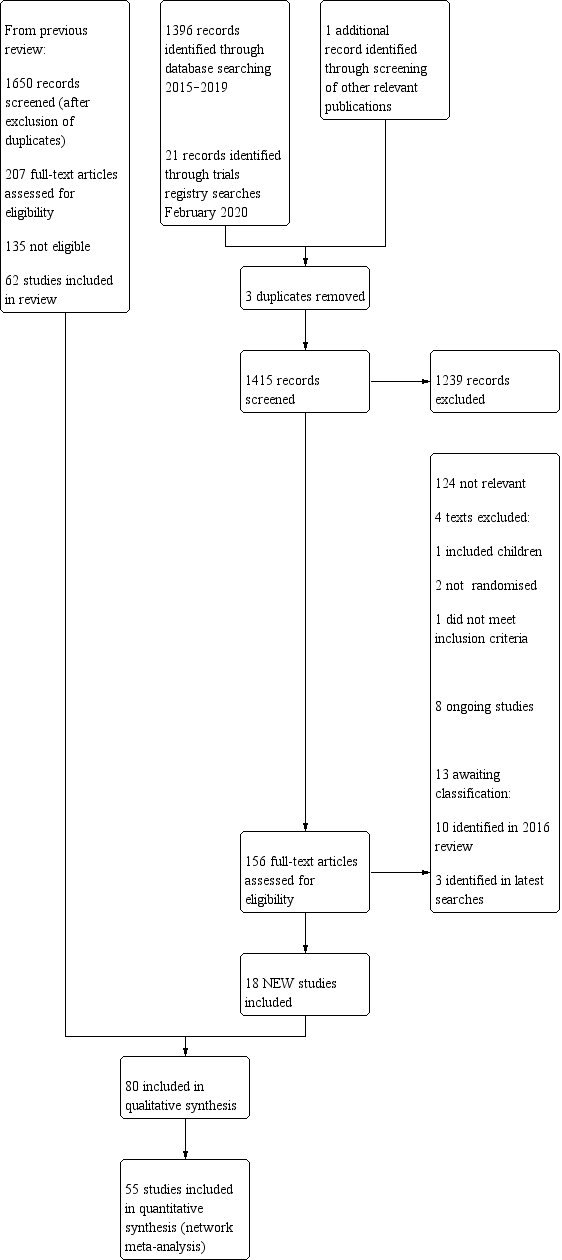
Study flow diagram.
We screened 1415 abstracts, of which 156 full‐text articles were retrieved and assessed for eligibility. A total of 18 studies met eligibility criteria (see Characteristics of included studies table).
The 18 studies identified in our updated literature search were combined with the 62 studies from the previous Cochrane Review (Clive 2016). From the combined total of 3065 records screened and 363 full‐text reviews across the two searches, we included 80 studies (5507 participants randomised between 1977 and 2018) in this review.
We excluded 15 studies (four identified from the 2019 literature search), following an initial assessment that they were eligible for inclusion (see Characteristics of excluded studies table). Thirteen texts are awaiting classification (see Characteristics of studies awaiting classification table). Eight studies are ongoing (see Characteristics of ongoing studies table).
Included studies
Forty‐six studies analysed the efficacy of a variety of pleurodesis agents. Twenty‐seven trials evaluated talc, which was the most studied agent. Bleomycin and tetracycline were other commonly studied agents. Eight studies evaluated IPCs. Four studies compared IPCs with talc slurry (Boshuizen 2017; Davies 2012; Demmy 2012; Thomas 2017), and one with doxycycline pleurodesis (Putnam 1999). Techniques to optimise outcomes from IPCs were also considered; two examined IPC drainage regimens (daily drainage versus symptom‐guided or alternate day regimens) (Muruganandan 2018; Wahidi 2017), and one randomised participants to talc slurry administered via IPC or IPC with saline placebo (Bhatnagar 2018).
Five studies evaluated the mode of administration of the pleurodesis agent; four compared talc poudrage with talc slurry (Bhatnagar 2020; Dresler 2005; Terra 2009; Yim 1996), and one compared instillation of tetracycline thoracoscopically or through an intercostal cannula (Evans 1993). Some studies evaluated alternative techniques to improve pleurodesis success rates; one study examined catheter size (Clementsen 1998); one examined a combination of chest drain size and analgesia (non‐steroidal anti‐inflammatory drugs (NSAIDs) versus opiates) (Rahman 2015); three evaluated the duration of drainage after pleurodesis (Goodman 2006; Villanueva 1994; Yildirim 2005); one evaluated the duration of drainage prior to instillation of the sclerosant (Ozkul 2014); one assessed whether participant rotation improved pleurodesis rate (Mager 2002); and one evaluated the effect of talc particle size (Maskell 2004). Three studies evaluated intrapleural fibrinolytics (Mishra 2018; Okur 2011; Saydam 2015). One RCT evaluated administration of three different doses of silver nitrate through a chest tube (Terra 2015), and one evaluated two different doses of iodine through a chest tube (Neto 2015).
Three studies compared surgical techniques to talc pleurodesis; one comparing talc pleurodesis with pleurectomy (Rintoul 2014), and two comparing talc slurry with thoracoscopic mechanical pleurodesis (TMP) (Crnjac 2004; Hojski 2015).
Additionally, we identified eight studies of agents specifically for the treatment of effusions due to lung cancer (Du 2013; Ishida 2006; Kasahara 2006; Luh 1992; Masuno 1991; Wang 2018; Yoshida 2007; Zhao 2009).
There were a number of methodological differences between the included studies. Fifty‐nine of 80 studies included all tumour types. Two included all except mesothelioma; one included only mesothelioma; one included all except lymphoma and small cell lung cancer; two included only adenocarcinoma; eight included only breast cancer; and seven studies included only participants with lung cancer.
The time point at which pleurodesis was evaluated varied widely between studies, from one to 12 months. In addition, the methods used to define pleurodesis failure varied. Nineteen of the 80 studies used radiological criteria only to define a pleurodesis failure. The remaining 61 studies incorporated symptomatic recurrence or need for a repeat pleural intervention into their definition. Six studies evaluating IPCs defined pleurodesis success by cessation of drainage from the catheter.
Pleurodesis techniques were not standardised. Studies used a variety of chest drain sizes and durations of drainage after sclerosant administration. Participants with trapped lung were excluded from 38/80 studies.
Excluded studies
We excluded 15 studies in total after initially being considered eligible for inclusion, but with reasons for exclusion identified later (Characteristics of excluded studies table). Three studies included data for participants with ascites, which could not be separated from participants with pleural effusions (Kwasniewska‐Rokicinska 1979; Lissoni 1995; Nio 1999).
Ten studies were not randomised (high risk of bias for sequence generation) and therefore excluded as per protocol (Caglayan 2008; Dryzer 1993; Elayouty 2012; Engel 1981; Gust 1990; Kleontas 2019; Liu 2017; Maiche 1993; Manes 2000; Tattersall 1982). One study combined data for adults and children (Ogunrombi 2014). One study, initially included as an ongoing study, was published during the process of this review. On full‐text review of the published paper, it did not meet criteria for inclusion, as the primary outcome was recruitment rate for a future multicenter phase 3 trial (Martin 2019).
Studies awaiting classification
Thirteen texts are awaiting classification (Characteristics of studies awaiting classification table).
Ongoing studies
Eight studies are ongoing (Characteristics of ongoing studies table).
Risk of bias in included studies
A summary assessment of the risk of bias is presented in the Characteristics of included studies table, Figure 2 and Figure 3. Three studies were at low risk of bias in all domains (Bhatnagar 2018; Keeratichananont 2018; Mishra 2018).
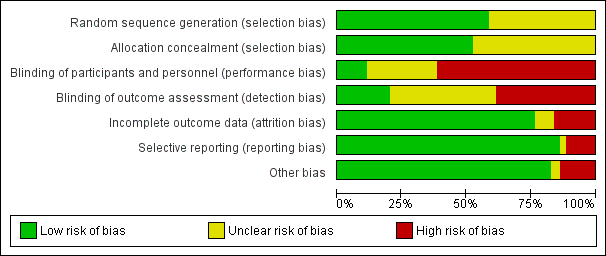
Risk of bias graph: review authors' judgements about each risk of bias item presented as percentages across all included studies.
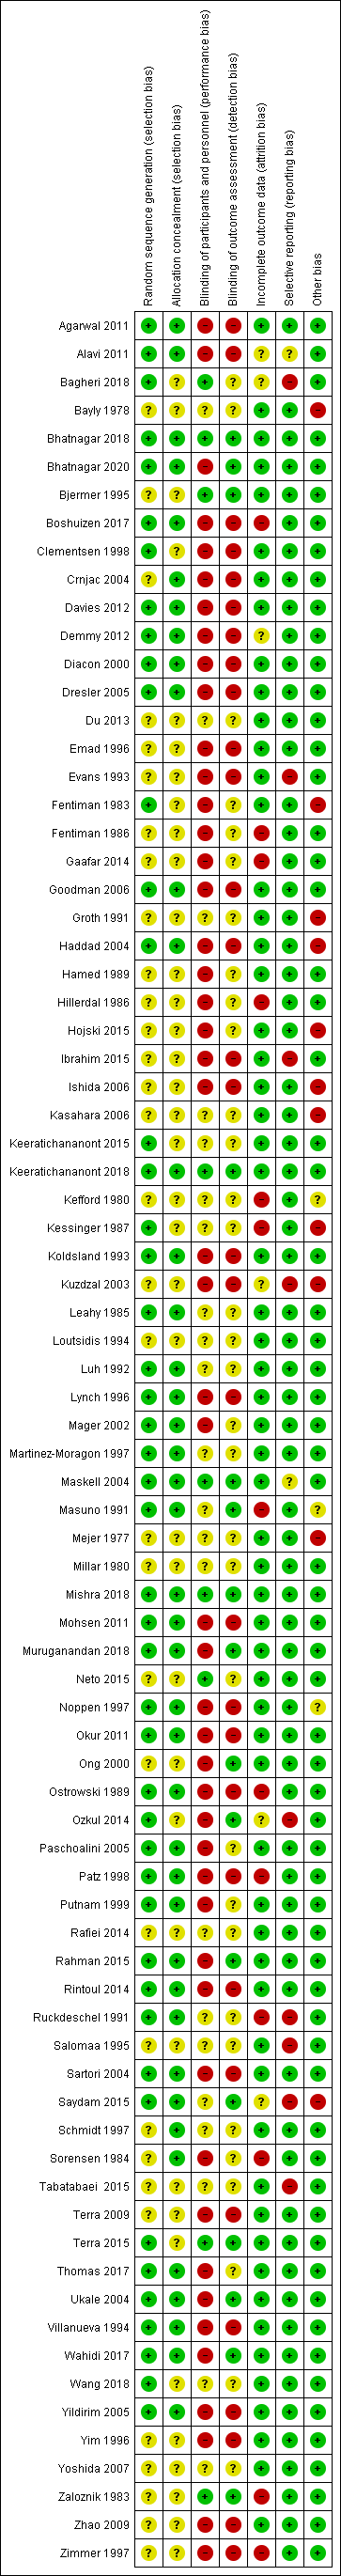
Risk of bias summary: review authors' judgements about each risk of bias item for each included study.
Allocation
All 80 studies were stated to have been randomised. Forty‐seven of these documented adequate sequence generation. The most commonly used methods were computer or telephone randomisation services, block randomisation, stratification, opaque sealed envelopes or a random number generator. Since we excluded studies with inadequate methods of sequence generation as per the protocol, sequence generation was unclear in the remaining 33 studies.
Allocation concealment was at low risk of bias in 42 studies. Since we excluded studies with inadequate allocation concealment, as per the protocol, allocation concealment was unclear for the remaining 38 studies.
Blinding
Blinding of participants and personnel (performance bias)
Due to the nature of many of the interventions evaluated in this review, blinding of the participants and clinicians was often not possible. Thus, 49/80 studies were at high risk of bias for this domain. Many of the pleurodesis agents have differing visual appearances and those studies randomising participants to different modes of administration, an IPC or surgery could not feasibly be blinded.
We assessed nine studies as low risk of performance bias and 22 as unclear.
Blinding of outcome assessment (detection bias)
The assessment of pleurodesis success could often not be blinded, as it was reliant on symptom reporting from unblinded participants, in association with the radiological findings of effusion recurrence. Few studies reported whether the radiological assessments were performed using a blinded method. Thirty‐one of 80 studies were at high risk of detection bias, and a further 33 of 80 studies had an unclear risk of bias for this domain. Sixteen studies were low risk of detection bias.
Incomplete outcome data
Most studies were at low risk of bias because although there was some inevitable attrition due to death, the rates were comparable for the treatment arms. We classified 13 studies at high risk of bias; nine due to very high attrition rates (Boshuizen 2017; Kefford 1980; Kessinger 1987; Masuno 1991; Ostrowski 1989; Patz 1998; Ruckdeschel 1991; Sorensen 1984; Zaloznik 1983); one due to very imbalanced LTFU between the treatment arms (Fentiman 1986); in one the number randomised was not stated (Zimmer 1997); for one the numbers provided did not add up (Hillerdal 1986); and one excluded participants from the analysis who discontinued treatment due to an allergic reaction (Gaafar 2014).
The risk of bias was unclear in six (Kuzdzal 2003: number of randomised participants not stated, only stated number of participants analysed; Alavi 2011: unable to access tables, and numbers only given as percentages, rather than absolute values; Demmy 2012: duration of trial follow‐up unclear; Bagheri 2018 and Ozkul 2014: numbers of participants LTFU not stated; Saydam 2015: withdrawals not stated, and unclear how many participants included in final outcome analysis).
Selective reporting
Most studies were at low risk of bias for selective outcome reporting. We classified two studies as unclear; one as minimal raw data were presented in the text and the tables could not be accessed (Alavi 2011), and the other because pleurodesis success data were not collected in an RCT of talc and tetracycline pleurodesis (although the study was not designed to evaluate this) (Maskell 2004).
Nine studies were at high risk; four provided minimal or no data regarding adverse effects or survival, or both (Evans 1993; Kuzdzal 2003; Ozkul 2014; Salomaa 1995); one did not report data on 15/100 participants randomised (Ruckdeschel 1991); one did not report pleurodesis outcomes for 11/40 participants and did not give information on LTFU (Saydam 2015); one did not report how long participants were followed up for or state the time at which pleurodesis failure was assessed (Ibrahim 2015); and two did not report on a stated outcome (Bagheri 2018: time to pleural effusion relapse; Tabatabaei 2015: breathlessness).
Other potential sources of bias
We classified 11/80 studies at high risk of bias in the 'other' domain. The risk of bias was unclear in three studies. This was for a variety of reasons (see Characteristics of included studies table). The remaining studies had a low risk of bias for this domain.
Effects of interventions
See: Summary of findings for the main comparison Pleurodesis failure rate in adults with malignant pleural effusion; Summary of findings 2 Adverse effects: procedure‐related fever in adults with malignant pleural effusion; Summary of findings 3 Adverse effects: procedure‐related pain in adults with malignant pleural effusion; Summary of findings 4 Patient‐reported control of breathlessness in adults with malignant pleural effusion; Summary of findings 5 Overall mortality in adults with malignant pleural effusion; Summary of findings 6 Patient acceptability: need for repeat invasive pleural intervention in adults with malignant pleural effusion
Primary outcome: pleurodesis failure rate
Pair‐wise (direct) meta‐analysis
Results of the direct, pair‐wise random‐effects meta‐analysis of the main pleurodesis techniques for the primary outcome of pleurodesis failure are presented in Table 1. Few studies made the same direct comparisons; meta‐analysis was therefore only possible for 12 direct comparisons. Results are also displayed for an additional 30 direct comparisons that were each made in only one study (Table 1).
| Adriamycin | Autologous blood | Bleomycin | C parvum | Doxycycline | IFN | IPC – daily drainage | IPC – not daily drainage | Iodine | Mepacrine | Mitoxantrone | Mustine | Placebo | Silver nitrate | TMP | Talc poudrage | Talc slurry | Talc via IPC | Tetracycline | |
| Autologous blood | NA | NA | NA | NA | NA | NA | NA | NA | NA | NA | NA | NA | NA | NA | NA | NA | / | NA | / |
| Bleomycin | NA | NA | NA | / | / | / | NA | NA | / | / | / | NA | NA | NA | NA | / | / | NA | / |
| C parvum | NA | NA | 0.55 (0.01 to 57.48); n = 2; Tau2 = 10.59; I2 = 94% | NA | / | NA | NA | NA | NA | NA | NA | / | NA | NA | NA | NA | NA | NA | / |
| Doxycycline | NA | NA | 0.67 (0.24 to 1.86); n = 2; Tau2 = 0; I2 = 0% | 1.91 (0.43 to 8.48); n = 1 | NA | NA | NA | / | NA | NA | NA | NA | NA | NA | NA | / | NA | NA | NA |
| IFN | NA | NA | 3.25 (1.54 to 6.89); n = 1 | NA | NA | NA | NA | NA | NA | NA | NA | NA | NA | NA | NA | NA | NA | NA | NA |
| IPC – daily drainage | NA | NA | NA | NA | NA | NA | NA | / | NA | NA | NA | NA | NA | NA | NA | NA | / | NA | NA |
| IPC – not daily drainage | NA | NA | NA | NA | 4.28 (1.59 to 11.54); n = 1 | NA | 3.23 (1.79 to 5.85); n = 2; Tau2 = 0; I2 = 0% | NA | NA | NA | NA | NA | NA | NA | NA | NA | / | / | NA |
| Iodine | NA | NA | 0.65 (0.22 to 1.96); n = 2; Tau2 = 0.16; I2 = 25% | NA | NA | NA | NA | NA | NA | NA | NA | NA | NA | NA | NA | / | / | NA | NA |
| Mepacrine | NA | NA | 0.16 (0.03 to 0.89); n = 1 | NA | NA | NA | NA | NA | NA | NA | / | NA | / | NA | NA | NA | / | NA | / |
| Mistletoe (viscum) | NA | NA | 0.19 (0.02 to 1.62); n = 1 | NA | NA | NA | NA | NA | NA | NA | NA | NA | NA | NA | NA | NA | NA | NA | NA |
| Mitoxantrone | NA | NA | 3.18 (1.17 to 8.65); n = 1 | NA | NA | NA | NA | NA | NA | 7.61 (0.35to 163.82); n = 1 | NA | NA | / | NA | NA | NA | NA | NA | NA |
| Mustine | 2.71 (0.1 to 74.98); n = 1 | NA | NA | 10.80 (1.64 to 70.93); n = 1 | NA | NA | NA | NA | NA | NA | NA | NA | NA | NA | NA | / | NA | NA | / |
| Placebo | NA | NA | NA | NA | NA | NA | NA | NA | NA | 14.4 (1.37 to 150.81); n = 1 | 1.33 (0.56 to 3.17); n = 1 | NA | NA | NA | NA | NA | / | NA | / |
| Silver nitrate | NA | NA | NA | NA | NA | NA | NA | NA | NA | NA | NA | NA | NA | NA | NA | NA | / | NA | / |
| TMP | NA | NA | NA | NA | NA | NA | NA | NA | NA | NA | NA | NA | NA | NA | NA | NA | / | NA | NA |
| Talc poudrage | NA | NA | 0.1 (0.02 to 0.48); n = 2; Tau2 = 0; I2 = 0 | NA | 0.02 (0.00 to 0.47); n = 1 | NA | NA | NA | 0.57 (0.08 to 3.80); n = 1 | NA | NA | 0.13 (0.02 to 0.71); n = 1 | NA | NA | NA | NA | / | NA | / |
| Talc slurry | NA | 0.69 (0.24 to 1.95); n = 1 | 0.82 (0.37 to 1.82); n = 5; Tau2 = 0.1; I2 = 12% | NA | NA | NA | 0.30 (0.08 to 1.14); n = 1 | 0.18 (0.07 to 0.45); n = 2; Tau2 = 0.26; I2 = 61% | 0.85 (0.24 to 3.08); n = 2; Tau2 = 0; I2 = 0% | 0.48 (0.14 to 1.60); n = 1 | NA | NA | 0.07 (0.00 to 1.51); n = 1 | 5.82 (0.21 to 158.82); n = 1 | 2.28 (0.83 to 6.23); n = 2; Tau2 = 0; I2 = 0% | 1.24 (0.92 to 1.65); n = 4; Tau = 0; I22 = 0% | NA | NA | / |
| Talc via IPC | NA | NA | NA | NA | NA | NA | NA | 0.36 (0.18 to 0.73); n = 1 | NA | NA | NA | NA | NA | NA | NA | NA | NA | NA | NA |
| Tetracycline | 0.90 (0.05 to 16.59); n = 1 | 0.71 (0.14 to 3.60); n = 1 | 2.00 (1.07 to 3.75); n = 5; Tau2 = 0; I2 = 0% | 3.18 (0.52 to 19.64); n = 1 | NA | NA | NA | NA | NA | 1.60 (0.12 to 20.99); n = 1 | NA | 0.37 (0.10 to 1.35); n = 2; Tau2 = 0; I2 = 0% | 0.30 (0.05 to 1.94); n = 1 | 0.60 (0.15 to 2.47); n = 1 | NA | 12.10 (1.32 to 111.30); n = 1 | 0.78 (0.19 to 3.13); n = 1 | NA | NA |
| Triethylenethiophosphoramide | NA | NA | NA | NA | NA | NA | NA | NA | NA | 4.95 (1.02 to 24.10); n = 1 | NA | NA | 0.34 (0.03 to 3.69); n = 1 | NA | NA | NA | NA | NA | NA |
| * Indicates that the comparison included a three‐arm study. Results that are significant at the conventional level of P ≤ 0.05 are in bold. / indicates the odds ratio is already expressed elsewhere in the table comparing the interventions the other way around. | |||||||||||||||||||
IFN: interferon; IPC: indwelling pleural catheter; n: number of studies included in the pair‐wise comparison; NA: no direct pair‐wise comparison available; TMP: thoracoscopic mechanical pleurodesis.
In most cases, there was no evidence against the null hypothesis of no true difference between interventions (Table 1). However, in 14/42 direct comparisons made, the OR and 95% CI lay away from the null value of 1, giving evidence against the null hypothesis of no difference.
A number of interventions had a higher pleurodesis failure rate than talc poudrage. This included tetracycline (pleurodesis failure of tetracycline versus talc poudrage: OR 12.10, 95% CI 1.32 to 111.30; studies = 1; participants = 33; Analysis 4.1; bleomycin: OR 9.70, 95% CI 2.10 to 44.78; studies = 2, participants = 57; Analysis 1.1; doxycycline: OR 42.69, 95% CI 2.13 to 856.61; studies = 1, participants = 31; Analysis 8.1; mustine: OR 8.00, 95% CI 1.40 to 45.76; studies = 1, participants = 37; Analysis 16.1).
The evidence suggests that participants treated with an IPC had more pleurodesis failures than those receiving talc slurry. Two studies compared talc slurry to IPCs without daily drainage (OR 0.18, 95% CI 0.07 to 0.45; studies = 2, participants = 249; Analysis 2.1; Davies 2012; Thomas 2017). One study compared talc slurry to daily IPC drainage (Demmy 2012: OR 0.30, 95% CI 0.08 to 1.14; participants = 55; Analysis 2.1). Two studies comparing IPCs without daily drainage to IPCs with daily drainage suggested a higher pleurodesis failure rate in those without daily drainage (OR 3.23, 95% CI 1.79 to 5.85; participants = 236; Analysis 6.1; Muruganandan 2018; Wahidi 2017). Results from one study suggest that talc administration via IPC may result in fewer pleurodesis failures than drainage alone (OR 0.36, 95% CI 0.18 to 0.73; participants = 139; Analysis 25.1; Bhatnagar 2018).
There was evidence that tetracycline, mitoxantrone and interferon were less effective (i.e. associated with a higher likelihood of pleurodesis failure) than bleomycin (tetracycline: OR 2.00, 95% CI 1.07 to 3.75; studies = 5, participants = 220; Analysis 4.1; mitoxantrone: OR 3.18, 95% CI 1.17 to 8.65; studies = 1, participants = 85; Analysis 17.1; interferon: OR 3.25, 95% CI 1.54 to 6.89; studies = 1, participants = 160; Analysis 12.1). Bleomycin and triethylenephosphoramide were less effective than mepacrine (bleomycin: OR 6.40, 95% CI 1.12 to 36.44; studies = 1, participants = 36; Analysis 1.1; triethylenephosphoramide: OR 4.95, 95% CI 1.02 to 24.10; studies = 1, participants = 29; Analysis 13.1).
There was generally little evidence of statistical heterogeneity between studies making direct comparisons. However, the comparison between C parvum and bleomycin estimated a very high level of heterogeneity (Tau2 = 10.59, I2 = 94%) because the two included studies had conflicting results (C parvum versus bleomycin: OR 0.05, 95% CI 0.01 to 0.29 in Hillerdal 1986; OR 5.69, 95% CI 1.38 to 23.48 in Ostrowski 1989; Analysis 5.1). The number of participants in the comparison was small (98 participants randomised across the two studies; 78 of whom had sufficient data to be included in the primary outcome analysis) and Hillerdal 1986 was at high risk of bias for two domains and unclear risk of bias for a further two. Hillerdal 1986 only included people with adenocarcinoma or bronchogenic carcinoma, whereas Ostrowski 1989 included all cell types. The evidence suggests that there may be some heterogeneity in the direct comparison of IPC without daily drainage and talc slurry (I2 = 61%, Chi2 = 2.58, P = 0.11; studies = 2; participants = 249; Analysis 6.1).
Appendix 2 demonstrates no obvious difference in the distribution of potential effect modifiers between direct comparisons.
Sensitivity analysis of the direct comparisons using the fixed‐effect meta‐analysis model did not reveal any clinically or statistically meaningful differences (see Appendix 3).
Network meta‐analysis
Selection of trials for inclusion in the network meta‐analysis
We evaluated and assessed all the interventions from the included studies for inclusion in the network. We considered a number of interventions were not jointly randomisable and hence we did not include them. These interventions included specific surgical techniques (Rintoul 2014), different talc particle sizes (Maskell 2004), interventions to improve the efficacy of pleurodesis (Clementsen 1998; Evans 1993; Goodman 2006; Mager 2002; Mishra 2018; Okur 2011; Ozkul 2014; Rahman 2015; Saydam 2015; Villanueva 1994; Yildirim 2005), tumour‐specific intrapleural therapy (Du 2013; Ishida 2006; Kasahara 2006; Luh 1992; Masuno 1991; Wang 2018; Yoshida 2007; Zhao 2009), different doses of silver nitrate (Terra 2015), and different doses of iodine (Neto 2015).
For computational reasons, we could not include one intervention (combined tetracycline and bleomycin) in the NMA: this combination was evaluated in only one trial, with no pleurodesis failures occurring in the relevant study arm. Inclusion of this trial led to convergence problems (Emad 1996). We did not include an additional study in the analysis as there were no pleurodesis failures in either study arm (Yim 1996). Such studies cannot statistically contribute to the estimate of relative intervention effects (Higgins 2011b).
We included 55 studies in the primary NMA. Most studies included all cell types. Twenty‐six of 55 excluded participants with trapped lung. Pleurodesis was defined using symptom recurrence and radiology in 37/55 studies and usually defined within four months of the intervention.
It was difficult for us to assess whether the distribution of potential effect modifiers was comparable for all the direct treatment comparisons because there were few studies per direct comparison (at most five studies per comparison, seen in the bleomycin versus talc slurry and bleomycin versus tetracycline comparisons) (see Appendix 2).
The final network can be seen in Figure 4.
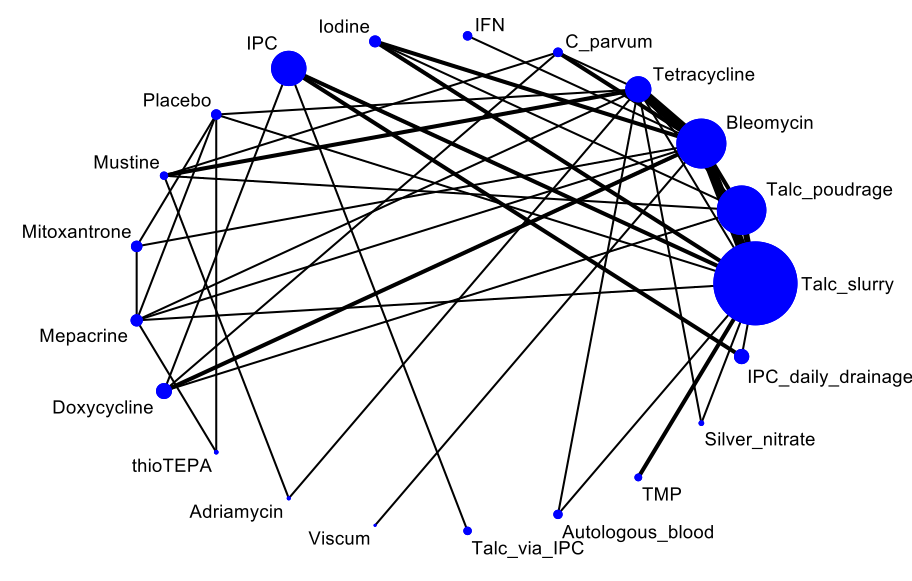
Network plot of the pleurodesis efficacy network. The nodes are weighted according to the number of participants randomised to the intervention. The edges (line thicknesses) are weighted according to the number of studies included in each comparison.
IFN: interferon; IPC: indwelling pleural catheter without daily drainage; thioTEPA: triethylenephosphoramide; TMP: thoracoscopic mechanical pleurodesis.
Results from network meta‐analysis
Estimated ORs for the pleurodesis failure outcome generated by the NMA, which comprised 55 studies of 21 agents and included 3758 participants, are shown in Table 2. The estimated ranks for each of the interventions in terms of pleurodesis success (i.e. lowest chance of failure) are shown in Figure 5. The summary of findings from the NMA of pleurodesis failure rate are shown in summary of findings Table for the main comparison.
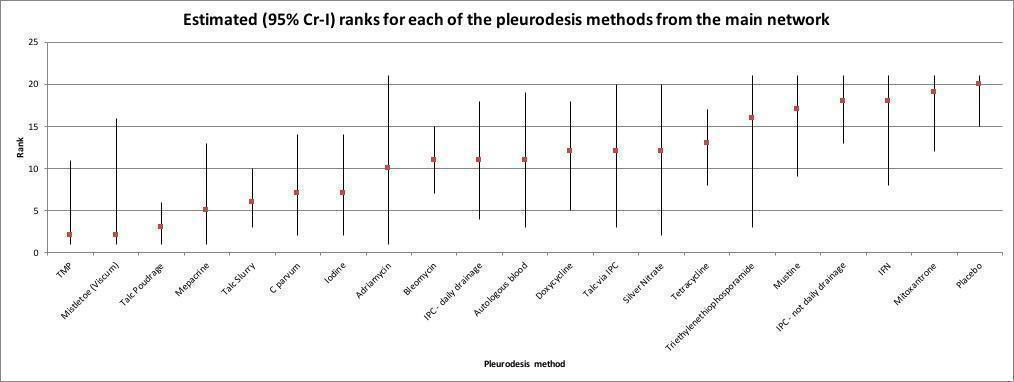
Estimated (95% credible interval (Cr‐I)) ranks for each of the pleurodesis methods from the main network. IFN: interferon; IPC: indwelling pleural catheter without daily drainage; thioTEPA: triethylenephosphoramide; TMP: thoracoscopic mechanical pleurodesis.
| Adriamycin | Autologous blood | Bleomycin | C parvum | Doxycycline | IFN | IPC – daily drainage | IPC – not daily drainage | Iodine | Mepacrine | Mistletoe (viscum) | Mitoxantrone | Mustine | Placebo | Silver nitrate | TMP | Talc poudrage | Talc slurry | Talc via IPC | Tetracycline | |
| Autologous blood | 1.16 (0.02 to 101.8) | NA | / | / | / | / | / | / | / | / | / | / | / | / | / | / | / | / | / | / |
| Bleomycin | 1.17 (0.02 to 83.72) | 1.02 (0.22 to 4.72) | NA | / | / | / | / | / | / | / | / | / | / | / | / | / | / | / | / | / |
| C parvum | 0.65 (0.01 to 49.54) | 0.56 (0.09 to 3.38) | 0.56 (0.18 to 1.60) | NA | / | / | / | / | / | / | / | / | / | / | / | / | / | / | / | / |
| Doxycycline | 1.32 (0.02 to 107.3) | 1.14 (0.19 to 7.07) | 1.12 (0.37 to 3.51) | 2.02 (0.53 to 8.43) | NA | / | / | / | / | / | / | / | / | / | / | / | / | / | / | / |
| IFN | 3.93 (0.05 to 379) | 3.39 (0.35 to 33.19) | 3.34 (0.63 to 18.08) | 6 (0.85 to 45.87) | 2.98 (0.39 to 22.38) | NA | / | / | / | / | / | / | / | / | / | / | / | / | / | / |
| IPC – daily drainage | 1.25 (0.02 to 111.4) | 1.10 (0.16 to 7.49) | 1.08 (0.26 to 4.46) | 1.94 (0.36 to 11.11) | 0.96 (0.20 to 4.53) | 0.32 (0.04 to 2.90) | NA | / | / | / | / | / | / | / | / | / | / | / | / | / |
| IPC – not daily drainage | 3.93 (0.06 to 325.5) | 3.43 (0.60 to 19.68) | 3.39 (1.10 to 10.68) | 6.09 (1.44 to 27.74) | 3.02 (0.85 to 10.54) | 1.01 (0.13 to 7.78) | 3.14 (1.07 to 9.35) | NA | / | / | / | / | / | / | / | / | / | / | / | / |
| Iodine | 0.63 (0.01 to 49.04) | 0.55 (0.09 to 3.16) | 0.54 (0.18 to 1.54) | 0.98 (0.22 to 4.29) | 0.48 (0.11 to 2.05) | 0.16 (0.02 to 1.15) | 0.50 (0.09 to 2.53) | 0.16 (0.04 to 0.65) | NA | / | / | / | / | / | / | / | / | / | / | / |
| Mepacrine | 0.48 (0.01 to 38.24) | 0.41 (0.06 to 2.59) | 0.41 (0.11 to 1.37) | 0.73 (0.14 to 3.64) | 0.36 (0.07 to 1.74) | 0.12 (0.01 to 0.94) | 0.38 (0.06 to 2.13) | 0.12 (0.02 to 0.55) | 0.75 (0.15 to 3.54) | NA | / | / | / | / | / | / | / | / | / | / |
| Mistletoe (viscum) | 0.18 (0.001 to 26.42) | 0.15 (0.006 to 3.25) | 0.15 (0.008 to 2.15) | 0.27 (0.01 to 4.85) | 0.14 (0.006 to 2.39) | 0.05 (0.002 to 1.03) | 0.14 (0.005 to 2.82) | 0.05 (0.002 to 0.8) | 0.28 (0.01 to 4.96) | 0.38 (0.02 to 7.19) | NA | / | / | / | / | / | / | / | / | / |
| Mitoxantrone | 5.62 (0.08 to 485.4) | 4.77 (0.65 to 38.43) | 4.7 (1.21 to 20.78) | 8.5 (1.58 to 53.76) | 4.22 (0.73 to 25.95) | 1.4 (0.17 to 13.52) | 4.38 (0.64 to 32.63) | 1.39 (0.25 to 8.62) | 8.71 (1.62 to 54.36) | 11.54 (2.37 to 70.61) | 31.44 (1.59 to 841.9) | NA | / | / | / | / | / | / | / | / |
| Mustine | 3.41 (0.06 to 246.5) | 2.96 (0.40 to 21.37) | 2.92 (0.70 to 12.46) | 5.26 (1.14 to 25.88) | 2.6 (0.46 to 14.5) | 0.88 (0.09 to 7.84) | 2.72 (0.39 to 18.45) | 0.86 (0.15 to 4.86) | 5.41 (0.98 to 30.75) | 7.2 (1.2 to 46.5) | 19.36 (0.93 to 502.7) | 0.62 (0.08 to 4.26) | NA | / | / | / | / | / | / | / |
| Placebo | 8.53 (0.13 to 713.2) | 7.21 (0.99 to 57.97) | 7.09 (1.74 to 33.09) | 12.82 (2.33 to 82.88) | 6.33 (1.09 to 40.23) | 2.12 (0.24 to 21) | 6.58 (0.98 to 49.75) | 2.09 (0.38 to 13.13) | 13.15 (2.39 to 83.82) | 17.44 (3.70 to 101.1) | 47.4 (2.32 to 1298) | 1.51 (0.37 to 6.14) | 2.43 (0.35 to 18.64) | NA | / | / | / | / | / | / |
| Silver nitrate | 1.28 (0.02 to 123.1) | 1.10 (0.09 to 11.67) | 1.08 (0.13 to 8.03) | 1.96 (0.20 to 17.79) | 0.96 (0.09 to 9.07) | 0.33 (0.02 to 4.24) | 1.0 (0.08 to 10.47) | 0.32 (0.03 to 2.9) | 1.999 (0.2 to 18.56) | 2.67 (0.26 to 26.41) | 7.21 (0.24 to 243.8) | 0.23 (0.02 to 2.44) | 0.37 (0.03 to 3.75) | 0.15 (0.01 to 1.59) | NA | / | / | / | / | / |
| TMP | 0.22 (0.003 to 21.16) | 0.19 (0.02 to 1.61) | 0.19 (0.03 to 1.04) | 0.34 (0.05 to 2.47) | 0.17 (0.02 to 1.15) | 0.06 (0.005 to 0.61) | 0.17 (0.02 to 1.26) | 0.06 (0.008 to 0.34) | 0.35 (0.05 to 2.34) | 0.46 (0.06 to 3.52) | 1.23 (0.05 to 36.67) | 0.04 (0.004 to 0.33) | 0.06 (0.007 to 0.55) | 0.03 (0.003 to 0.22) | 0.17 (0.01 to 2.46) | NA | / | / | / | / |
| Talc poudrage | 0.26 (0.004 to 18.64) | 0.23 (0.04 to 1.05) | 0.22 (0.08 to 0.50) | 0.4 (0.10 to 1.41) | 0.2 (0.05 to 0.64) | 0.07 (0.009 to 0.40) | 0.21 (0.04 to 0.82) | 0.07 (0.02 to 0.20) | 0.41 (0.12 to 1.29) | 0.55 (0.13 to 2.18) | 1.45 (0.09 to 30.25) | 0.05 (0.008 to 0.21) | 0.08 (0.02 to 0.31) | 0.03 (0.01 to 0.14) | 0.2 (0.03 to 1.7) | 1.19 (0.19 to 6.77) | NA | / | / | / |
| Talc slurry | 0.52 (0.01 to 38.37) | 0.45 (0.10 to 1.93) | 0.45 (0.21 to 0.91) | 0.8 (0.24 to 2.76) | 0.4 (0.12 to 1.24) | 0.13 (0.02 to 0.81) | 0.41 (0.12 to 1.43) | 0.13 (0.05 to 0.34) | 0.82 (0.28 to 2.47) | 1.1 (0.32 to 4.02) | 2.93 (0.19 to 60) | 0.10 (0.02 to 0.41) | 0.15 (0.03 to 0.66) | 0.06 (0.01 to 0.27) | 0.41 (0.05 to 3.43) | 2.38 (0.5 to 11.99) | 2.00 (0.98 to 4.79) | NA | / | / |
| Talc via IPC | 1.41 (0.02 to 153.1) | 1.22 (0.11 to 13.48) | 1.2 (0.16 to 9.03) | 2.17 (0.25 to 20.7) | 1.08 (0.13 to 8.46) | 0.36 (0.03 to 4.94) | 1.12 (0.16 to 8.14) | 0.36 (0.07 to 1.85) | 2.22 (0.26 to 20.4) | 2.96 (0.32 to 30.36) | 7.996 (0.29 to 276.8) | 0.26 (0.02 to 2.74) | 0.41 (0.04 to 4.61) | 0.17 (0.01 to 1.81) | 1.1 (0.07 to 20.18) | 6.47 (0.56 to 79.51) | 5.39 (0.77 to 46.87) | 2.7 (0.41 to 18.65) | NA | / |
| Tetracycline | 1.52 (0.03 to 100.3) | 1.32 (0.28 to 5.82) | 1.3 (0.60 to 2.73) | 2.34 (0.72 to 7.62) | 1.16 (0.31 to 4.01) | 0.39 (0.06 to 2.36) | 1.20 (0.26 to 5.33) | 0.38 (0.1 to 1.31) | 2.4 (0.7 to 8.26) | 3.19 (0.86 to 12.47) | 8.54 (0.54 to 176.8) | 0.28 (0.06 to 1.18) | 0.45 (0.11 to 1.73) | 0.18 (0.04 to 0.76) | 1.2 (0.18 to 8.71) | 6.95 (1.15 to 43.49) | 5.85 (2.28 to 16.87) | 2.91 (1.2 to 7.01) | 1.08 (0.13 to 8.3) | NA |
| Triethylenethiophosphoramide | 2.63 (0.03 to 310.8) | 2.23 (0.15 to 34.02) | 2.21 (0.22 to 23.08) | 3.98 (0.32 to 52.04) | 1.96 (0.15 to 25.22) | 0.66 (0.04 to 11.71) | 2.05 (0.15 to 28.96) | 0.65 (0.05 to 8.08) | 4.08 (0.34 to 52.3) | 5.41 (0.69 to 47.85) | 14.73 (0.42 to 634.9) | 0.47 (0.04 to 5.52) | 0.75 (0.05 to 11.16) | 0.31 (0.03 to 3.16) | 2.04 (0.1 to 45.98) | 11.87 (0.71 to 208.7) | 9.95 (0.95 to 121.2) | 4.95 (0.49 to 52.69) | 1.83 (0.09 to 36.76) | 1.7 (0.16 to 18.73) |
| Results that are significant at the conventional level of P < 0.05 are in bold. / indicates the odds ratio is already expressed elsewhere in the table comparing the interventions the other way around. | ||||||||||||||||||||
IFN: interferon; IPC: indwelling pleural catheter; NA: not applicable; TMP: thoracoscopic mechanical pleurodesis.
Based on the NMA, there was evidence that talc poudrage results in fewer pleurodesis failures than bleomycin, tetracycline, mustine, interferon, IPC not daily drainage, mitoxantrone and placebo (Table 2). The estimated (posterior median) rank of talc poudrage was third of 21 interventions, but with a much tighter Cr‐I than those interventions with median rank of 1 or 2 (estimated rank 3, 95% Cr‐I 1 to 6).
We had a moderate level of certainty in the network estimate of the pleurodesis failure rate of talc poudrage compared to talc slurry. We downgraded evidence by one level for serious study limitations due to an overall high risk of bias for trials forming direct and indirect evidence loops in the talc poudrage to talc slurry comparison. There was little evidence of a difference between these two interventions in the primary NMA (talc poudrage versus talc slurry: OR 0.50, 95% Cr‐I 0.21 to 1.02). Restricting analysis only to studies at low risk of bias provided greater certainty that these interventions have a comparable pleurodesis failure rate (OR 0.78, 95% Cr‐I 0.16 to 2.08).
The OR and 95% Cr‐I for IPC (without daily drainage) compared to talc slurry demonstrates that IPCs are likely to have a higher pleurodesis failure rate than talc slurry (OR 7.60, 95% Cr‐I 2.96 to 20.47). Our level of certainty in this result is moderate. We downgraded one level for inconsistency, due to a high I2 value (I2 = 61%) in the IPC without daily drainage to talc slurry comparison.
Talc slurry was associated with fewer pleurodesis failures than mitoxantrone and placebo (talc slurry versus mitoxantrone: OR 0.10, 95% Cr‐I 0.02 to 0.41; talc slurry versus placebo: OR 0.06, 95% Cr‐I 0.01 to 0.27). We had a low level of certainty that talc slurry may result in fewer pleurodesis failures than bleomycin and doxycycline (bleomycin versus talc slurry: OR 2.24, 95% Cr‐I 1.10 to 4.68; doxycycline versus talc slurry: OR 2.51, 95% Cr‐I 0.81 to 8.40). We downgraded by one level in the bleomycin to talc slurry comparison for serious study limitations due to an overall high risk of bias for trials forming direct and indirect evidence loops, and by one level for evidence of indirectness (due to variation in the dose of bleomycin used and different approaches between studies to inclusion of patients with trapped lung and definition of pleurodesis failure). We downgraded evidence in the doxycycline to talc slurry comparison for imprecision (due to the wide Cr‐I around the effect estimate) and indirectness (as there was no direct evidence comparing doxycycline and talc slurry, and evidence forming indirect evidence loops were based on few studies).
The NMA provides some evidence that mistletoe (viscum) may be associated with fewer pleurodesis failures than placebo, mitoxantrone and IPC without daily drainage, with ORs and 95% Cr‐Is lying away from the null value of 1. However, these comparisons are based only on indirect data with small sample sizes. The only direct evidence on mistletoe (viscum) was from a comparison with bleomycin made in a single study (OR 0.19, 95% Cr‐I 0.02 to 1.62; participants = 17). Mistletoe (viscum) was estimated to have a high rank (rank 2/21) but with a very wide Cr‐I (1 to 16) reflecting uncertainty within the network as to its true rank.
The NMA also provides some evidence that TMP may be more effective (i.e. result in fewer pleurodesis failures) than interferon, IPC – not daily drainage, mitoxantrone and placebo. TMP similarly ranked highly on average, but with a wide Cr‐I reflecting considerable uncertainty (ranked joint second with mistletoe (viscum), 95% Cr‐I 1 to 11). The evidence for TMP is based on two studies, recruiting a combined total of 123 participants. We considered both studies at high risk of bias and therefore we did not include them in the sensitivity analysis of studies at low risk of bias.
The NMA results are consistent with the pair‐wise meta‐analysis results in providing some evidence that a daily IPC drainage regimen (ranked joint 11th of 21 interventions, 95% Cr‐I 4 to 18) has increased chance of pleurodesis success compared with IPCs without daily drainage (ranked 18th, 95% Cr‐I 13 to 21). Talc administration combined with IPC ranked joint 12th but the very wide Cr‐I demonstrates uncertainty of its true rank (95% Cr‐I 3 to 20).
Placebo administration was associated with the highest likelihood of pleurodesis failure, with an estimated rank lowest of 21 interventions (95% Cr‐I 15 to 21). We had a moderate level of certainty that placebo is associated with more pleurodesis failures than talc slurry (OR 15.90, 95% Cr‐I 3.76 to 79.90) with evidence downgraded one level for imprecision due to the wide Cr‐I of this estimate. The ORs and 95% Cr‐Is comparing placebo with TMP, talc poudrage, mepacrine, talc slurry, C parvum and iodine were all far away from 1, providing evidence that placebo is less effective at achieving a pleurodesis.
Other potentially efficacious agents were mepacrine, iodine and C parvum, with estimated ranks of 5th (95% Cr‐I 1 to 13) for mepacrine and joint 7th (95% Cr‐I 2 to 14) for iodine and C parvum.
Heterogeneity within the network meta‐analysis
We estimated the between‐study SD in treatment effect estimates (log ORs) across the whole network to be Tau = 0.70 (95% Cr‐I 0.30 to 1.17), suggesting a high degree of heterogeneity, although the wide Cr‐I indicates a substantial degree of uncertainty around this.
We performed several sensitivity analyses to explore potential reasons for this heterogeneity, based on predefined potential clinical effect modifiers (see Appendix 4). Due to the smaller number of studies in these analyses, many of them contained fewer interventions than the main network. The estimated rank orders were generally similar to those in the main network (Appendix 5; Appendix 6).
The estimated between‐trial heterogeneity across the network remained high for most sensitivity analyses, but was reduced in the NMA restricted to trials at low risk of bias (Tau 0.37, 95% Cr‐I 0.02 to 1.47) and the NMA restricted to trials excluding people with trapped lung (Tau 0.31, 95% Cr‐I 0.01 to 1.19). We note however that the Cr‐Is around these estimates of Tau are very wide, indicating considerable uncertainty about the extent of heterogeneity. More generally, estimates of Tau in all sensitivity analyses were very imprecise. The upper limit of the 95% Cr‐Is for these values was often close to 2. Since we assumed a uniform (0.2) prior distribution for Tau in each analysis, it is likely that the upper limits would increase further still if we assumed a wider prior distribution (Appendix 4; Appendix 5; Appendix 7).
Results were fairly robust to exclusion of the higher risk of bias studies, although doxycycline and C parvum both ranked higher than in the main NMA, probably due to the removal of two particular studies (Kuzdzal 2003; Ostrowski 1989) (Appendix 5; Appendix 7). Talc poudrage and talc slurry were associated with the least pleurodesis failures and their Cr‐Is were the same (talc poudrage: rank 2, 95% Cr‐I 1 to 9; talc slurry: rank 4, 95% Cr‐I 1 to 9) with the OR and Cr‐I of talc poudrage versus talc slurry suggesting little difference between the two agents (OR 0.78, 95% Cr‐I 0.16 to 2.08). ).
We observed a diverse range of doses used for many of the pleurodesis agents evaluated, which is a potential cause for the unexplained heterogeneity. Unfortunately, it was not feasible to examine the effect of dose on comparative estimates (ORs).
Inconsistency within the network meta‐analysis
There was no statistical evidence for global inconsistency in the main network or in any of the subgroup or sensitivity NMAs (see Figure 6). For the primary outcome analysis of pleurodesis failure, the residual deviance was four points lower (indicating slightly better fit) for the 'inconsistency model' relative to the NMA. However, after penalising for the increased complexity of the inconsistency model (101 'effective parameters' required versus 91 for the NMA), the DIC indicated a preference for the NMA model (DIC of 209.3 relative to 214.9 for the inconsistency model).
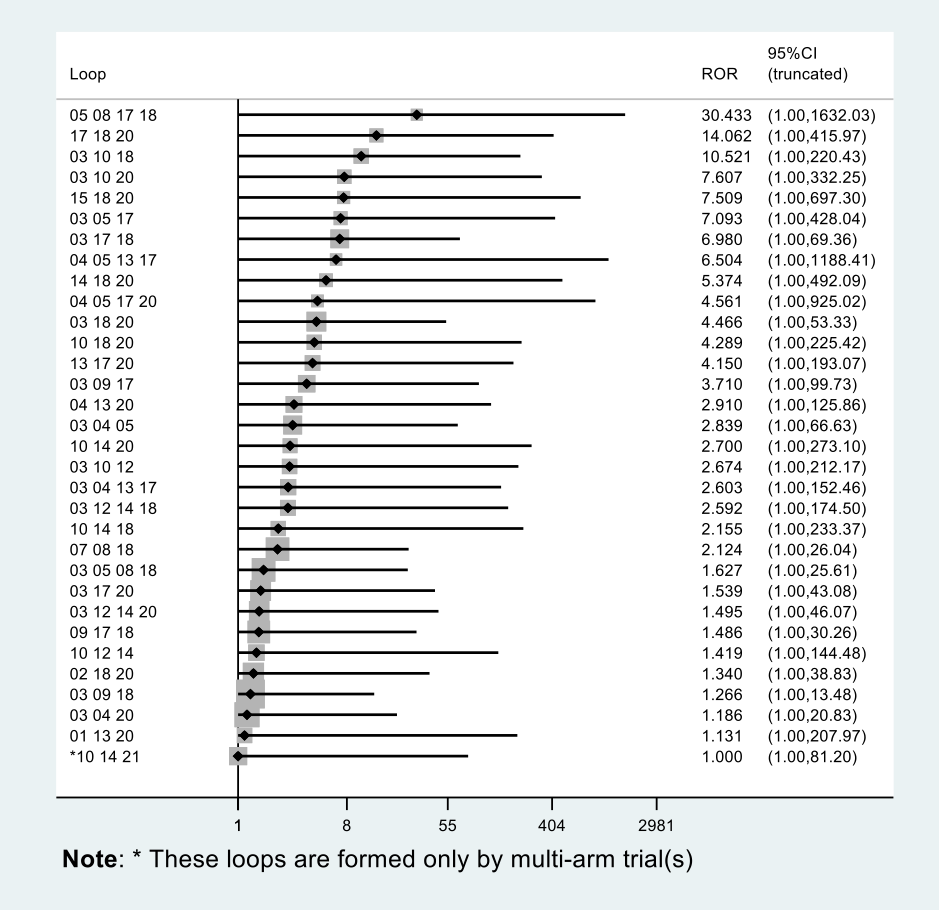
Inconsistency plot for the main network. Treatment codes: 01: adriamycin; 02:autologous blood; 03:bleomycin; 04:C parvum; 05:doxycycline; 06:interferon; 07:indwelling pleural catheter (IPC) –daily drainage; 08:IPC –not daily drainage; 09:iodine; 10:mepacrine; 11:mistletoe (viscum); 12:mitoxantrone; 13:mustine; 14:placebo; 15:silver nitrate; 16:thoracoscopic mechanical pleurodesis (TMP); 17:talc poudrage; 18:talc slurry; 19:talc via IPC; 20:tetracycline; 21:triethylenethiophosphoramide. Abbreviations: ROR:ratio of odds ratios; 95% CI:95% confidence interval. Heterogeneity variance was set at 0.4929 (reflecting the estimation of Tau from the network).
Similarly, there was no statistical evidence for loop‐specific inconsistency within any of the networks. Inconsistency factors (ratio of odds ratios (RORs)) with 95% CIs for the main network can be found in Figure 6. Although none of these CIs exclude the null value of 1, we note that some of the RORs are large, with extremely wide CIs, due to the small volume of evidence per loop. The possibility of true inconsistencies cannot therefore be excluded. The largest ROR (30.4, truncated 95% CI 1 to 1632.0) related to the loop doxycycline – IPC not daily drainage – talc slurry – talc poudrage. We note that the only direct evidence on doxycycline versus talc poudrage was from a small trial of 31 participants, with zero pleurodesis failures in the talc poudrage arm (Kuzdzal 2003), which appears to be the driver of this large ROR. The residual deviance contribution plot (Figure 7) indicates that the data points that were fitted 'better' by the inconsistency model relative to the NMA tended to similarly be those with zero cells: in particular, the Kuzdzal 2003 trial is highlighted again as potentially inconsistent from other evidence using this approach. As the residual deviance is known to be numerically unstable in the presence of zero cells, this does not cause concern (Dias 2018).
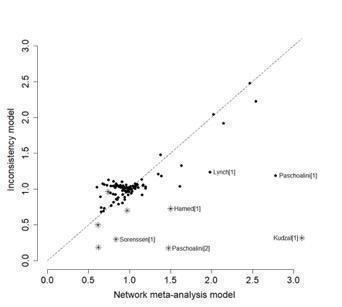
Residual deviance contribution plot for the main network meta‐analysis. * indicates 0 events.
Additional post‐hoc sensitivity analysis
The post‐hoc sensitivity analysis that only evaluated agents given through an intercostal chest tube included 37 studies of 16 agents (Appendix 7; Appendix 8). There was very little evidence of difference between the agents: Cr‐Is were wide and the estimated rankings for the individual agents were also very imprecise. The estimated degree of heterogeneity was even higher than the main network (Tau 0.87, 95% Cr‐I 0.37 to 1.52).
Primary outcomes for the methods not included in the network meta‐analysis
Pleurodesis techniques
The results of the pair‐wise comparisons of the interventions not included in the NMA are shown in Table 3.
| Study | Reason study excluded from network | Intrapleural agent or intervention 1 | Pleurodesis failure rate for agent 1 | Intrapleural agent or intervention 2 | Pleurodesis failure rate for agent 2 | OR (95% CI) of agent 1 compared with agent 2*** |
| Lung cancer‐specific therapy | Cisplatin and bevacizumab | 6/36 | Cisplatin | 17/34 | 0.20 (0.07 to 0.60) | |
| No pleurodesis failures in the combined group | Tetracycline** | 3/19 | Combined tetracycline and bleomycin | 0/19 | 8.27 (0.40 to 172.05) | |
| Bleomycin** | 2/19 | Combined tetracycline and bleomycin | 0/19 | 5.57 (0.25 to 124.19) | ||
| Lung cancer‐specific therapy | OK‐432 | 8/17 | Cisplatin | 11/17 | 0.48 (0.12 to 1.92) | |
| OK‐432 | 8/17 | OK‐432 and cisplatin | 1/15 | 12.44 (1.32 to 117.03) | ||
| Cisplatin | 11/17 | OK‐432 and cisplatin | 1/15 | 25.67 (2.68 to 245.84) | ||
| Lung cancer‐specific therapy | High‐dose OK‐432 | 5/19 | Low‐dose OK‐432 | 3/19 | 1.90 (0.38 to 9.44) | |
| Lung cancer‐specific therapy | OK‐432 | 3/26 | Mitomycin C | 9/27 | 0.26 (0.06 to 1.11) | |
| Two talc slurry preparations | Mixed‐particle talc | 3/14 | Graded talc (particles > 20 µm) | 2/14 | 1.64 (0.23 to 11.70) | |
| Lung cancer‐specific therapy | LC9018 and adriamycin | 10/38 | Adriamycin | 23/38 | 0.23 (0.09 to 0.62) | |
| Comparison of different doses of iodine | 1% iodine | 1/30 | 2% iodine | 1/30 | 1.00 (0.06 to 16.76) | |
| MPM specific surgical technique | Talc pleurodesis (slurry or poudrage) | 25/62 | VATS pleurectomy | 24/60 | 0.88 (0.43 to 1.82) | |
| Comparison of different doses of silver nitrate | 90 mg silver nitrate | 0/20 | 150 mg silver nitrate | 0/20 | Not estimable | |
| 90 mg silver nitrate | 0/20 | 180 mg silver nitrate | 2/20 | 0.18 (0.01 to 4.01) | ||
| 150 mg silver nitrate | 0/20 | 180 mg silver nitrate | 2/20 | 0.19 (0.01 to 4.01) | ||
| Lung cancer‐specific therapy | Cisplatin + 45 mg endostatin | 14/66 | Cisplatin | 24/62 | 0.43 (0.2 to 0.93) | |
| Lung cancer‐specific therapy | OK‐432 | 8/33 | Bleomycin | 11/35 | 0.70 (0.24 to 2.03) | |
| OK‐432 | 8/33 | Cisplatin and etoposide | 10/34 | 0.77 (0.26 to 2.27) | ||
| Bleomycin | 11/35 | Cisplatin and etoposide | 10/34 | 1.10 (0.39 to 3.07) | ||
| Lung cancer specific therapy | rAd‐p53 and cisplatin | 3/17 | Cisplatin | 9/18 | 0.21 (0.05 to 1.01) | |
| *Three‐arm study. **The results for the pair‐wise comparison between tetracycline and bleomycin are included in the network meta‐analysis. ***Results that are significant at the conventional level of P ≤ 0.05 are in bold. | ||||||
CI: confidence interval; IPC: indwelling pleural catheter; MPM: malignant pleural mesothelioma; OR: odds ratio; VATS: video‐assisted thoracoscopic surgery.
We did not include one study in the NMA as it was a three‐arm trial evaluating different doses of silver nitrate administered via a chest tube (Terra 2015). Only two of 60 participants had a failed pleurodesis, both in the group receiving the highest dose of silver nitrate.
We could not include eight studies in the NMA as they evaluated tumour‐specific therapies for people with MPE due to non‐small cell lung cancer (NSCLC) (Du 2013; Ishida 2006; Kasahara 2006; Luh 1992; Masuno 1991; Wang 2018; Yoshida 2007; Zhao 2009). The results could not be generalised to people with other tumour types and hence we did not consider these interventions to be jointly randomisable. All of these studies randomised only small numbers of participants. However, in five of the direct comparisons, the OR and 95% CI lay far away from the null value of 1, giving evidence against the null hypothesis of no difference (Table 3).
Du 2013 randomised people with NSCLC to receive three cycles of either cisplatin plus intrapleural bevacizumab (a humanised monoclonal antibody to vascular endothelial growth factor (VEGF)) or cisplatin alone. More participants in the cisplatin‐alone group had pleurodesis failure than in the combination group (6/36 with cisplatin plus bevacizumab versus 17/34 with cisplatin alone; OR 5.00, 95% CI 1.66 to 15.09; studies = 1; participants = 70; Analysis 22.1).
Masuno 1991 randomised people with NSCLC with MPE to receive up to two doses of either intrapleural LC9018 (lyophilised Lactobacillus casei) plus adriamycin or adriamycin alone. There were more pleurodesis failures in the control group compared to those who received LC9018 (23/38 with adriamycin alone versus 10/38 with LC9018 plus adriamycin; OR 4.29, 95% CI 1.62 to 11.35; studies = 1, participants = 76; Analysis 14.1).
Ishida 2006 conducted a three‐arm trial, comparing intrapleural OK‐432, an inactivated product of Streptococcus pyogenes A3 with antitumour immune‐modulatory effects in lung cancer, with cisplatin and combined therapy (both OK‐432 and cisplatin). People treated with OK‐432 alone had a higher pleurodesis failure rate than those receiving combination treatment (OR 12.44, 95% CI 1.32 to 117.03; studies = 1, participants = 32), but a lower failure rate than those receiving cisplatin alone (OR 0.48, 95% CI 0.12 to 1.92; studies = 1, participants = 34; Analysis 10.1).
Wang 2018 administered intrathoracic cisplatin in combination with intravenous pemetrexed as the control intervention for people with lung adenocarcinoma and compared this with the addition of intrathoracic Endostar. Participants in the intervention arm had a lower pleurodesis failure rate after three cycles of treatment (OR 0.43, 95% Cr‐I 0.20 to 0.93; participants = 128; Analysis 29.1).
Other methods to optimise pleurodesis
We evaluated several other methods to optimise pleurodesis, but did not include them in the NMA because we did not consider them to be jointly randomisable (see Table 4). Most studies included small numbers of participants and none provided evidence of a difference in pleurodesis failure rates between the treatments being compared (see Table 4).
| Type of method to optimise pleurodesis | Study | Intervention 1 | Pleurodesis failure rate for intervention 1 | Intervention 2 | Pleurodesis failure rate for intervention 2 | OR (95% CI) of intervention 1 compared with intervention 2* |
| Mode of administration | Tetracycline pleurodesis at the end of thoracoscopy | 2/15 | Tetracycline pleurodesis through an intercostal cannula | 5/14 | 0.28 (0.04 to 1.76) | |
| Chest tube size | Small‐bore chest drain | 2/9 | Large‐bore chest drain | 3/9 | 0.57 (0.07 to 4.64) | |
| Small‐bore chest drain | 15/50 | Large‐bore chest drain | 12/50 | 1.36 (0.56 to 3.30) | ||
| Type of analgesic agent | NSAID | 33/144 | Opiate | 30/150 | 1.19 (0.68 to 2.08) | |
| Patient rotation | Rotation after instillation of talc | 2/10 | No rotation after instillation of talc | 1/10 | 2.25 (0.17 to 29.77) | |
| Duration of drainage after administration of the sclerosant | Drain removed 24 hours after pleurodesis | 2/16 | Drain removed 72 hours after pleurodesis | 4/19 | 0.54 (0.08 to 3.40) | |
| Drain removal the day after pleurodesis | 2/9 | Drain removal when < 150 mL/day output | 3/15 | 1.14 (0.15 to 8.59) | ||
| Fractionated dose oxytetracycline (4 divided doses at 6‐hourly intervals) | 0/12 | Single bedside instillation of oxytetracycline | 2/8 | 0.10 (0.00 to 2.50) | ||
| Duration of drainage prior to administration of the sclerosant | Early instillation of talc slurry after drain insertion | 5/40 | Instillation of talc slurry when daily drainage from chest tube < 300 mL/day | 6/39 | 0.79 (0.22 to 2.82) | |
| Intrapleural fibrinolytics | Intrapleural streptokinase | 5/19 | No intrapleural streptokinase | 7/16 | 0.46 (0.11 to 1.90) | |
| Intrapleural streptokinase | 2/18 | 50 mL saline placebo | 5/11 | 0.15 (0.02 to 0.99) | ||
| Intrapleural urokinase | 13/35 | Placebo | 11/34 | 1.24 (0.46 to 3.34) | ||
| *Results that are significant at the conventional level of P ≤ 0.05 are in bold. **Studies with more than 2 comparison arms. | ||||||
CI: confidence interval; NSAID: non‐steroidal anti‐inflammatory drug; OR: odds ratio.
Three studies investigated the use of intrapleural fibrinolytics. Mishra 2018 recruited people with non‐draining MPE to receive either intrapleural urokinase or placebo with coprimary outcome measures of dyspnoea change and time to pleurodesis failure. Seventy‐one participants were randomised. The authors reported no significant difference between groups in time to pleurodesis failure over the 12‐month study period (13/35 failures in participants receiving urokinase compared with 11/34 receiving placebo; OR 1.24, 95% CI 0.46 to 3.34; Analysis 27.1), and no difference between groups in the number of participants achieving a clinically significant decrease in VAS dyspnoea scores.
Saydam 2015 randomised 40 participants to receive either streptokinase or saline placebo in people with multiloculated MPE. Pleurodesis outcome data were not presented for 11 participants, but failure occurred in 2/18 participants receiving streptokinase and 5/11 receiving placebo control (P = 0.07). In Okur 2011, the total volume of pleural fluid drained was higher in the streptokinase group than control; however, there was no difference observed between groups in pleurodesis failure rates (streptokinase versus control: OR 0.46, 95% CI 0.11 to 1.90; Analysis 28.1).
Two studies compared small‐ and large‐bore chest drains. Clementsen 1998 randomised 21 participants to receive tetracycline via 10‐Fr and 24‐Fr drains (administered at the end of medical thoracoscopy). They observed no difference in pleurodesis failures between groups (small‐bore versus large‐bore pleurodesis failure: OR 0.57, 95% CI 0.07 to 4.64; Analysis 18.1).
The TIME‐1 2×2 factorial study (Rahman 2015), compared the effect of small‐ and large‐bore drains and analgesia (NSAIDs versus opiates) on pain and pleurodesis outcomes in 320 people with MPE. Small chest tubes (12 Fr) failed to meet non‐inferiority for pleurodesis efficacy at three months when compared with large (24 Fr) drains, with 15/50 pleurodesis failures in the 12‐Fr group and 12/50 failures in the 24‐Fr group (small versus large bore: OR 1.36, 95% CI 0.56 to 3.30; Analysis 18.1).
We did not identify any RCTs examining the role of pleuroperitoneal shunts.
Secondary outcomes
Due to the diversity of reporting techniques and outcome measures, it was not possible to perform a formal statistical analysis of many of the predefined secondary outcomes.
Adverse effects and complications
Most studies reported data on adverse effects of the interventions, however four studies did not (Evans 1993; Kuzdzal 2003; Saydam 2015; Villanueva 1994). Kefford 1980 reported adverse events but we could not differentiate the participants with pleural effusions from those with ascites or pericardial effusions. Two study authors provided data on adverse events by personal communications (Goodman 2006; Mager 2002). The methods used to describe the adverse effects observed varied widely between studies.
One study demonstrated that mixed particle talc is associated with more lung and systemic inflammation, hypoxaemia and acute respiratory distress syndrome (ARDS) than graded talc (with its smallest particles removed) and tetracycline (Maskell 2004).
Other notable complications included a possible increased risk of cellulitis and pleural infection associated with IPCs. One study comparing IPCs without daily drainage to talc slurry pleurodesis reported more cases of infection in the IPC arm (five cases of pleural infection requiring admission for intravenous antibiotics, plus 2/52 participants who were managed as outpatients with oral antibiotics in the IPC arm, compared to 1/54 participants requiring hospital admission for pleural infection in the talc slurry arm). However, no IPCs were removed as a consequence of infection (Davies 2012). In another study, 2/74 participants developed a pleural infection and 3/74 developed cellulitis in the IPC arm compared with 1/72 participants with pleural infection in the talc slurry arm (Thomas 2017). Boshuizen 2017, however, reported no difference in the rate of infection between participants receiving an IPC without daily drainage and those receiving a chest drain and talc slurry pleurodesis, with two infections occurring in each group. One study comparing daily IPC drainage to talc slurry pleurodesis reported only one wound infection in the IPC group (Demmy 2012).
One study comparing IPCs without daily drainage to doxycycline pleurodesis reported 6/99 participants receiving an IPC had a local cellulitis infection, which responded to oral antibiotics. No participants with an infection required IPC removal (Putnam 1999). Neither study comparing daily IPC drainage to IPCs without daily drainage observed a difference in the rate of pleural infection between study arms (Muruganandan 2018; Wahidi 2017).
We used NMA to compare rates of the most commonly reported adverse effects: fever and pain.
Presence of procedure‐related fever
Pair‐wise (direct) meta‐analysis
The direct evidence regarding fever is shown in Appendix 9.
Twenty‐six direct comparisons were each informed by between one and five studies.
There was evidence that talc slurry may be associated with more fever than autologous blood (OR 3.92, 95% CI 1.31 to 11.72; studies = 1; participants = 110; Analysis 2.2) and that placebo, tetracycline and triethylenethiophosphoramide were associated with less fever than mepacrine (placebo: OR 0.31, 95% CI 0.12 to 0.79; Analysis 15.2; tetracycline: OR 0.13, 95% CI 0.02 to 0.89; Analysis 4.2; triethylenethiophosphoramide: OR 0.04, 95% CI 0.01 to 0.30; Analysis 13.2).
Network meta‐analysis
We performed NMA of fever data from 30 trials of 14 different treatments, including 2004 participants. ORs from the NMA are shown in Table 5 and estimated rankings of the interventions in Figure 8. The summary of findings from the NMA on risk of developing a fever can be seen in summary of findings Table 2.
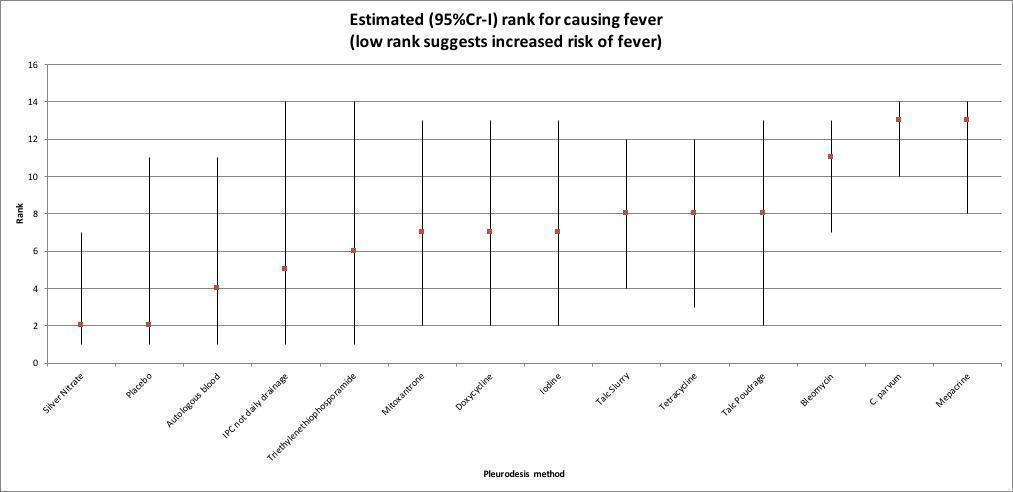
Estimated rank (95% credible interval (Cr‐I)) for causing fever (a low rank suggests increased risk of fever).
| Autologous blood | Bleomycin | C parvum | Doxycycline | IPC – not daily drainage | Iodine | Mepacrine | Mitoxantrone | Placebo | Silver nitrate | Talc poudrage | Talc slurry | Tetracycline | |
| Bleomycin | 11.53 (0.70 to 205.20) | NA | / | / | / | / | / | / | / | / | / | / | / |
| C parvum | 67.29 (2.44 to 2021) | 5.82 (0.82 to 41.96) | NA | / | / | / | / | / | / | / | / | / | / |
| Doxycycline | 4.21 (0.11 to 157) | 0.37 (0.03 to 3.49) | 0.063 (0.005 to 0.73) | NA | / | / | / | / | / | / | / | / | / |
| IPC – not daily drainage | 2.01 (0.01 to 401.30) | 0.17 (0.002 to 15.18) | 0.03 (0.00 to 2.93) | 0.48 (0.01 to 23.3) | NA | / | / | / | / | / | / | / | / |
| Iodine | 3.67 (0.14 to 101.60) | 0.32 (0.03 to 3.09) | 0.05 (0.003 to 1.05) | 0.87 (0.03 to 22.91) | 1.82 (0.01 to 281.7) | NA | / | / | / | / | / | / | / |
| Mepacrine | 53.76 (1.45 to 2277) | 4.65 (0.38 to 62.22) | 0.80 (0.04 to 19.28) | 12.72 (0.45 to 422.1) | 26.79 (0.16 to 4813) | 14.68 (0.52 to 452.2) | NA | / | / | / | / | / | / |
| Mitoxantrone | 3.90 (0.05 to 251.30) | 0.34 (0.01 to 7.14) | 0.06 (0.001 to 2.12) | 0.92 (0.02 to 43.82) | 1.91 (0.01 to 434.1) | 1.06 (0.02 to 47.81) | 0.07 (0.002 to 2.53) | NA | / | / | / | / | / |
| Placebo | 0.46 (0.003 to 46.52) | 0.04 (0.00 to 1.55) | 0.01 (0.00 to 0.42) | 0.12 (0.001 to 8.56) | 0.23 (0.001 to 73.08) | 0.13 (0.001 to 9.2) | 0.01 (0.00 to 0.34) | 0.12 (0.01 to 2.35) | NA | / | / | / | / |
| Silver nitrate | 0.28 (0.006 to 11.75) | 0.02 (0.001 to 0.47) | 0.00 (0.00 to 0.13) | 0.07 (0.002 to 2.85) | 0.14 (0.001 to 28.98) | 0.08 (0.002 to 2.27) | 0.01 (0.00 to 0.22) | 0.07 (0.00 to 5.58) | 0.62 (0.01 to 93.78) | NA | / | / | / |
| Talc poudrage | 4.41 (0.16 to 120.20) | 0.38 (0.04 to 3.72) | 0.07 (0.003 to 1.25) | 1.04 (0.04 to 27.59) | 2.18 (0.01 to 330.6) | 1.19 (0.10 to 14.14) | 0.08 (0.003 to 2.28) | 1.13 (0.02 to 58.56) | 9.57 (0.13 to 1083) | 15.42 (0.52 to 519.40) | NA | / | / |
| Talc slurry | 4.93 (0.34 to 74.37) | 0.43 (0.08 to 2.22) | 0.07 (0.01 to 0.88) | 1.17 (0.07 to 20.57) | 2.45 (0.02 to 289) | 1.35 (0.17 to 10.59) | 0.09 (0.005 to 1.69) | 1.26 (0.04 to 47.32) | 10.65 (0.20 to 931) | 17.33 (1.07 to 336.40) | 1.12 (0.15 to 9.12) | NA | / |
| Tetracycline | 4.37 (0.29 to 69.73) | 0.38 (0.09 to 1.62) | 0.07 (0.01 to 0.60) | 1.04 (0.08 to 15.55) | 2.16 (0.02 to 234.9) | 1.19 (0.10 to 15.28) | 0.08 (0.01 to 1.08) | 1.12 (0.04 to 37.43) | 9.45 (0.20 to 734.3) | 15.26 (0.88 to 331.70) | 0.1 (0.08 to 13.05) | 0.89 (0.13 to 5.81) | NA |
| Triethylenethiophosphoramide | 2.88 (0.02 to 523.50) | 0.25 (0.003 to 20.37) | 0.04 (0.00 to 5.12) | 0.69 (0.01 to 102.5) | 1.42 (0.003 to 786.5) | 0.78 (0.006 to 110.5) | 0.05 (0.001 to 2.24) | 0.72 (0.01 to 118.3) | 5.84 (0.07 to 1361) | 10.11 (0.06 to 2164) | 0.65 (0.005 to 94.31) | 0.58 (0.01 to 61.79) | 0.66 (0.01 to 58.19) |
| Results that are significant at the conventional level of P ≤ 0.05 are in bold. / indicates the odds ratio is already expressed elsewhere in the table comparing the interventions the other way round. | |||||||||||||
CI: confidence interval; IPC: indwelling pleural catheter; NA: not applicable.
Most estimates had very wide Cr‐Is, indicating a large degree of imprecision. Silver nitrate and placebo appeared to be associated with the least fever (estimated rank joint 2nd of 14 interventions (silver nitrate: 95% Cr‐I 1 to 7; placebo: 95% Cr‐I 1 to 11)) (talc slurry versus silver nitrate: OR 17.33, 95% CI 1.07 to 336.40; talc slurry versus placebo: OR 10.65, 95% CI 0.2 to 931). The interventions associated with the most fever appeared to be C parvum and mepacrine, with estimated ranks of joint 13th (C parvum: 95% Cr‐I 10 to 14; mepacrine: 95% Cr‐I 8 to 14) (talc slurry versus C parvum: OR 0.07, 95% CI 0.01 to 0.88; talc slurry versus mepacrine: OR 0.09, 95% CI 0.01 to 1.69).
There was no statistical evidence for a difference in the risk of fever, relative to talc slurry, of talc poudrage (OR 0.89, 95% Cr‐I 0.11 to 6.67)), bleomycin (OR 2.33, 95% Cr‐I 0.45 to 12.50)), IPC – not daily drainage (OR 0.41, 95% Cr‐I 0.00 to 50.00) and doxycycline (OR 0.85, 95% Cr‐I 0.05 to 14.29). We tentatively suggest that these interventions may be comparable to talc slurry, but we have a low level of certainty in this conclusion: we downgraded evidence for imprecision due to the wide Cr‐Is of all network estimates. We also downgraded evidence for indirectness, due to differences in adverse event reporting of procedure‐related fever, using different temperature thresholds and time frames for which a fever may be considered attributable to the intervention.
The between‐study SD (Tau) for the fever NMA was 1.67 (95% Cr‐I 1.08 to 1.98), indicating a very high degree of statistical heterogeneity. We note that the upper limit of the prior distribution was set to 2.
Comparison of DIC values for the NMA model versus the inconsistency model suggested comparable model fit after penalising for complexity (DIC 121.5 for the NMA model versus 121.2 for the inconsistency model). However, we noted a reduction in the SD when moving from the NMA to inconsistency model, which does indicate the possibility of inconsistency within the network. Comparison of residual deviance contributions of individual data points highlighted three studies as potentially inconsistent from the rest of the evidence, two of which included zero counts in the 2×2 outcome data (i.e. either all or no participants in one trial arm experienced fever, which leads to computational instability in residual deviance calculations) (Figure 9). The inconsistency factor method provided no evidence of loop inconsistency (Appendix 4).
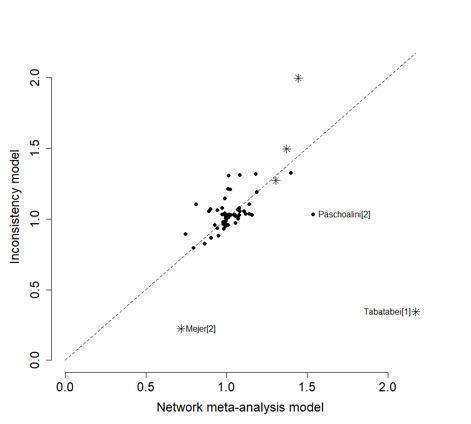
Residual deviance contribution plot for the fever network meta‐analysis. * indicates 0 events.
Other findings
For those studies that were not included in the NMA but provided data on fever, the majority revealed no difference between the interventions (Emad 1996; Kasahara 2006; Masuno 1991; Terra 2015). Two studies evaluating OK‐432 revealed more fever in this group compared to the control groups (Ishida 2006; Luh 1992; Yoshida 2007) (Analysis 10.2). The mixed talc group had more fever than the graded talc group (OR 15.92, 95% CI 1.81 to 140.16; participants = 46; studies = 1; Analysis 20.2; Maskell 2004). The group who received cisplatin alone had less fever than those who also received rAd‐p53 (OR 0.09, 95% CI 0.02 to 0.51; studies = 1, participants = 35; Analysis 22.2; Zhao 2009).
Presence of procedure‐related pain
We only included studies reporting dichotomous outcomes (presence or absence of pain post procedure) in the pair‐wise and NMA.
Pair‐wise (direct) meta‐analysis
The direct evidence regarding pain is shown in Appendix 10.
There was evidence that tetracycline pleurodesis may cause pain more frequently than autologous blood (OR 69.00, 95% CI 7.61 to 625; studies = 1), mustine (OR 33.87, 95% CI 1.80 to 636; studies = 1) and silver nitrate (OR 55.08, 95% CI 3.02 to 1003; studies = 1) (Analysis 4.3). One study provided evidence that talc slurry may cause pain more frequently than autologous blood (OR 3.57, 95% CI 1.19 to 10.74; participants = 110; Analysis 2.3).
Network meta‐analysis
We included 31 studies and 14 treatments (including 2753 participants) in the NMA regarding pain (Appendix 11; Appendix 12). The summary of findings from the NMA of risk of developing procedure‐related pain can be seen in summary of findings Table 3.
There was evidence to suggest that five agents, including bleomycin (OR 19.46, 95% Cr‐I 3.47 to 138.70), doxycycline (OR 22.87, 95% Cr‐I 2.99 to 223.60), talc poudrage (OR 8.64, 95% Cr‐I 1.45 to 96.71) and talc slurry (OR 6.77, 95% Cr‐I 1.40 to 39.01) may be associated with a higher number of participants having pain post procedure than autologous blood (estimated rank 1, 95% Cr‐I 1 to 4).
There was no statistical evidence for a difference in risk of procedure‐related pain, relative to talc slurry, of bleomycin (OR 2.85, 95% Cr‐I 0.78 to 11.53), IPC – not daily drainage (OR 1.30, 95% Cr‐I 0.29 to 5.87), doxycycline (OR 3.35, 95% Cr‐I 0.64 to 19.72) or talc poudrage (OR 1.26, 95% Cr‐I 0.45 to 6.04). We tentatively suggest that these interventions may have a comparable frequency of procedure‐related pain to talc slurry, but we have a low level of certainty in this conclusion. Estimates had very wide CIs; therefore, we downgraded by one level in all comparisons for imprecision. We also downgraded evidence for indirectness for all comparisons. The time point at which pain was reported, threshold for reporting and mode of assessment was often unstated by studies (as occurrence of pain was reported as an adverse event) and therefore we felt this was likely to differ between studies. In addition, we downgraded evidence one level for inconsistency in the talc poudrage to talc slurry comparison (I2 = 69%).
The between‐study SD (Tau) for the network was 0.69 (95% Cr‐I 0.11 to 1.51), indicating considerable heterogeneity. The DIC indicated comparable fit between the NMA and inconsistency models, with a difference in DIC of 4.8 points (marginally in favour of the inconsistency model, but not reaching the predefined cut‐off of 5 points' difference for global inconsistency). There was a slight reduction in estimated Tau when moving to the inconsistency model, which is however suggestive of possible global inconsistency (Appendix 4). Inspection of the contributions of individual data points to the mean residual deviance showed that the slightly better fit of the inconsistency model was driven by trials in which either all or no participants in one trial arm experienced pain post procedure (i.e. presence of a zero count in the 2×2 outcome data) (Figure 10).
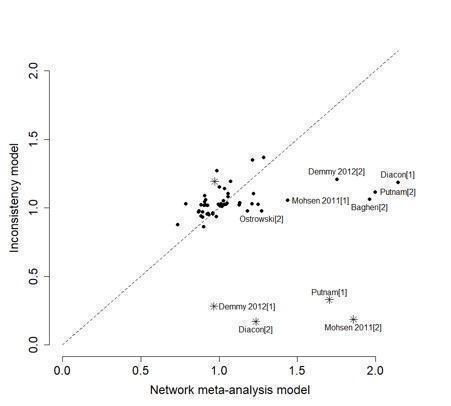
Residual deviance contribution plot for the pain network meta‐analysis. * indicates 0 events.
Other findings
Seven studies reported results from pain scales rather than dichotomous outcome data and , therefore, we could not include these in the pair‐wise analysis or NMA (Agarwal 2011; Alavi 2011; Bjermer 1995; Davies 2012; Hojski 2015; Paschoalini 2005; Zimmer 1997). Bjermer 1995 reported that "pain scores were significantly higher in the mepacrine group (p = < 0.001)" compared to the mitoxantrone group as measured by the WHO analgesic ladder (no raw figures provided) (WHO 2016). In Hojski 2015, VAS pain scores demonstrated that participants in the mechanical pleurodesis group had less pain than the talc slurry group at 12 hours' postpleurodesis; however, there was no difference between groups at 48 hours. The other six studies did not provide evidence of a difference in pain between the interventions studied.
Eight studies that we did not include in the network (as we did not consider interventions to be jointly randomisable) revealed no difference between interventions (Kasahara 2006; Luh 1992; Masuno 1991; Neto 2015; Okur 2011; Terra 2015; Yoshida 2007; Zhao 2009).
Two studies that evaluated interventions to optimise pleurodesis reported pain outcomes according to drain size. Clementsen 1998 reported fewer participants experienced pain at the time of drain insertion in those with small‐bore drains (10 Fr) compared with large‐bore drains (24 Fr) (OR 0.08, 95% CI 0.01 to 0.75; Analysis 18.2) and that smaller (10‐Fr) drains were better tolerated. Placement of large‐bore (24‐Fr) chest tubes was associated with more pain in the TIME‐1 study, but the study authors reported this was not clinically significant (Rahman 2015). There was no difference in pain scores between participants receiving NSAIDs and opiates, although participants in the NSAID group did require more rescue analgesia (Rahman 2015).
One study reported that more participants experienced pain in the OK‐432 group than control (Analysis 10.3; Ishida 2006).
Patient‐reported control of breathlessness
Twenty studies reported breathlessness outcomes, using a variety of scoring systems: Medical Research Council (MRC) Dyspnoea Scale (Mohsen 2011); VAS score (Bhatnagar 2018; Bhatnagar 2020; Bjermer 1995; Davies 2012; Diacon 2000; Mishra 2018; Muruganandan 2018; Terra 2015; Thomas 2017); 'dyspnoea index' (Demmy 2012); BORG score and Guyatt Chronic Respiratory Questionnaire (CRQ) (Putnam 1999); Modified Borg Score (Boshuizen 2017); EORTC Core Quality of Life Questionnaire (QLQ‐C30)/Lung Cancer Module (EORTC QLQ‐LC13) questionnaires (Hojski 2015; Rintoul 2014), functional class (Masuno 1991; Rafiei 2014; Zimmer 1997), scale 0 to 10 (Alavi 2011); and patient satisfaction questionnaire with breathlessness rating (Wahidi 2017).
Pair‐wise (direct) meta‐analysis
Results from meta‐analysis of patient‐reported control of breathlessness are presented in summary of findings Table 4.
We performed direct meta‐analysis of data from two studies which used a 100‐mm VAS breathlessness scale in participants undergoing talc slurry pleurodesis and IPC insertion without daily drainage. Davies 2012 used a scale with no breathlessness at 0 mm and maximum possible breathlessness at 100 mm. We inverted the results reported by Thomas 2017, since they used a scale where 0 mm represented "worst imaginable breathlessness" and 100 mm no breathlessness. The minimum clinically important difference using a 100‐mm VAS breathlessness scale in MPE was 19 mm (95% CI 14 to 24) (Mishra 2015). We had low certainty in the evidence from our results that IPC without daily drainage may offer comparable breathlessness improvement when compared to talc slurry (MD –6.12 mm, 95% CI –16.32 to 4.08) from a fixed‐effect meta‐analysis. We downgraded evidence for serious study limitations due to lack of blinding (which was not possible due to the nature of the interventions). We also downgraded for indirectness due to the different time points at which VAS data with total numbers of participants was reported by studies (Davies 2012: 42 days; Thomas 2017: 180 days).
One study used a 100‐mm VAS breathlessness scale (0 mm representing absence of breathlessness and 100 mm most severe symptoms) to compare talc poudrage with talc slurry pleurodesis (Bhatnagar 2020). The authors reported no significant difference in VAS dyspnoea scores between intervention arms at all time points (absolute difference in mean VAS score from baseline of talc poudrage versus talc slurry: 0.8, 95% CI –4.6 to 6.2; P = 0.78). Data from this study demonstrated an MD of 4 mm (95% CI –6.26 to 14.26) between talc poudrage and talc slurry. We had a moderate level of certainty in the evidence and downgraded for serious study limitations only, due to lack of blinding of participants and clinicians (which was not possible due to the nature of the interventions).
Network meta‐analysis
There were insufficient comparable data to perform an NMA.
Other findings
Two studies compared dyspnoea scores for participants with daily IPC drainage and IPCs without daily drainage. In the AMPLE‐2 study, authors reported that there was no significant difference between VAS breathlessness scores over the first 60 days postintervention (ratio of geometric means 1.32, 95% CI 0.88 to 1.97; P = 0.18; Muruganandan 2018). In the ASAP study, the proportion of participants with relief of breathlessness at two weeks was 0.65 in the aggressive (daily) drainage arm and 0.40 in the standard (alternate day drainage), with between‐group differences maintained at 12 weeks' postintervention (Wahidi 2017).
Putnam 1999 compared IPC without daily drainage and doxycycline pleurodesis, demonstrating an improvement in breathlessness in all groups and time points compared to baseline. The only between‐group difference identified was change in Borg score on exertion at 30 days, which appeared to favour IPC (mean 2.2 (SD 2.4) in IPC group versus mean 1.0 (SD 2.4) in doxycycline group; P = 0.05).
One study comparing talc slurry pleurodesis with IPC – not daily drainage found that participants from both groups reported less breathlessness at six weeks and the improvement was similar in both treatment arms (mean Modified Borg Score improvement: 2.2 in talc slurry group versus 1.6 in IPC group; P = 0.44), although there was substantial data attrition due to 35/94 participants dying within six weeks (Boshuizen 2017).
Demmy 2012 demonstrated that participants with an IPC drained on a daily basis had significantly better dyspnoea scores at 30 days than those in the talc slurry group (8.5 with IPC drained daily versus 6.1 with talc slurry; P = 0.047).
Participants receiving talc through their IPC had less breathlessness at day 56 than those with an IPC alone in the IPC Plus study (mean VAS score difference –7.9 points, 95% CI –15.5 to –0.3 in IPC plus talc group; P = 0.04). However, mean VAS dyspnoea scores over the 70‐day trial period did not differ between the treatment arms (–3.6 points, 95% CI –8.5 to 1.3; P = 0.15) (Bhatnagar 2018).
Urokinase for multi‐loculated malignant effusions had no significant impact on breathlessness when compared to placebo (adjusted MD from baseline between groups 23.8 mm, 95% CI 212 to 4.4; P = 0.36; Mishra 2018).
Rafiei 2014 found more participants receiving doxycycline had severe dyspnoea at two months compared to those receiving bleomycin (5/20 (24%) with doxycycline versus 1/21 (5%) with bleomycin; P = 0.01). Bjermer 1995 noted that participants receiving mitoxantrone had a larger reduction in breathlessness than the mepacrine‐treated participants (absolute values not reported; P ≤ 0.001). Masuno 1991 did not provide the absolute figures but reported "statistically significant" improvements in dyspnoea one week after treatment at "the final judgement" in the LC9018 group. Alavi 2011 observed lower dyspnoea scores for participants receiving bleomycin than those receiving iodine at one‐month postintervention, although no figures were included in the paper. Hojski 2015 observed improved QLQ‐C30 dyspnoea scores in the TMP group compared to talc slurry.
In the remaining studies reporting dyspnoea, there were no differences between the study arms in terms of the degree of improvement of dyspnoea (Diacon 2000; Mohsen 2011; Rintoul 2014; Terra 2015; Zimmer 1997).
Participants' quality of life and symptom control
Twenty‐four of 80 studies reported quality of life or assessed a symptom score other than dyspnoea. We did not perform pair‐wise (direct) meta‐analysis or NMA of quality of life scores as there was insufficient comparable data.
The methods used were Karnofsky Performance Score (KPS) (Demmy 2012; Du 2013; Groth 1991; Masuno 1991; Wahidi 2017; Zhao 2009), QLQ‐C30 questionnaire (Bagheri 2018; Davies 2012; Dresler 2005; Hojski 2015; Rintoul 2014; Wang 2018), SF36 scale (Bhatnagar 2020; Terra 2009; Wahidi 2017), WHOQOL‐BREF scale (Neto 2015; Terra 2015), EQ‐5D (Bagheri 2018; Bhatnagar 2020; Muruganandan 2018; Rintoul 2014; Thomas 2017), VAS Score (Diacon 2000; Thomas 2017), Guyatt CRQ (Putnam 1999), a symptom questionnaire (Bjermer 1995), and numerical pain scale (Alavi 2011; Paschoalini 2005; Zimmer 1997).
Five studies evaluating IPCs reported quality of life data. One study found no difference in the number of participants experiencing 'general malaise' between those randomised to IPC without daily drainage and talc slurry pleurodesis (Boshuizen 2017). Neither study comparing IPC (without daily drainage) to talc slurry observed a difference in quality of life between treatment arms (Davies 2012; Thomas 2017). KPS (MD 8.5, 95% CI –6.2 to 23.3; P = 0.24) and 36‐item Short Form (SF‐36) (MD –12.6, 95% CI –29.3 to 4.1) scores were similar in participants with daily IPC drainage versus IPC without daily drainage at 12 weeks in the ASAP trial (Wahidi 2017). Participants were asked to complete a 'social functioning score' as a component of the SF‐36 survey in Wahidi 2017. There were similar improvements across quality of life measures in participants with both daily and alternate day IPC drainage regimens. Participants in the daily IPC drainage group had a bigger improvement in EQ‐5D‐5L scores over the six‐month AMPLE‐2 study period, compared with those in the symptom‐guided drainage group, representing a better quality of life (estimated difference in means 0.112, 95% CI 0.0198 to 0.204; P = 0.0174; Muruganandan 2018). However, the authors reported no between‐group differences in the VAS quality of life scores (ratio of geometric means 1.220, 95% CI 0.871 to 1.709; P = 0.25; Muruganandan 2018). There was no difference in Guyatt CRQ scores between participants randomised to IPC (without daily drainage) and doxycycline pleurodesis (Putnam 1999).
Bhatnagar 2018 reported that participants who received talc via IPC had higher quality of life scores (with higher scores indicating a better quality of life) than those who received placebo at all time points. Differences in QLQ‐C30 scores reached significance at day 28 (difference 9.2 points, 95% CI 1.1 to 17.4; P = 0.03) and EQ‐5D‐5L at day 42 (difference 0.12 points, 95% CI 0.01 to 0.22; P = 0.03) (Bhatnagar 2018).
Most studies reported no difference in quality of life measures between the treatment groups (Alavi 2011; Bhatnagar 2020; Davies 2012; Diacon 2000; Groth 1991; Paschoalini 2005; Terra 2009; Terra 2015; Zimmer 1997). Bjermer 1995 reported a "larger reduction" in tiredness in the mitoxantrone group compared to the mepacrine group (absolute figures not provided; P ≤ 0.001). Dresler 2005 noted less fatigue in the talc poudrage group than the talc slurry group (absolute figures not provided; P = 0.016). Those participants who received LC9018 "demonstrated a significant improvement of PS (performance status) at 1 week" than those who did not (absolute figures not provided; P ≤ 0.05) (Masuno 1991). Zhao 2009 found that more participants who received combination treatment with cisplatin plus Ad‐p53 had a performance score "improvement rate that was significantly higher" at six weeks than those receiving cisplatin alone (11/17 (65%) with cisplatin plus Ad‐p53 versus 6/18 (33%) with cisplatin alone; P = < 0.05). The participants who underwent a video‐assisted thoracoscopic partial pleurectomy had "significantly better" EQ‐5D scores at six months than the talc group in the MesoVATS study (MD 0.08, 95% CI 0.003 to 0.16); P = 0.042), but no difference in their QLQ‐C30 scores (Rintoul 2014). Demmy 2012 did not provide data by treatment group. Du 2013 reported 30 participants (83%) receiving bevacizumab and cisplatin had an "improved quality of life" (measured by KPS) as opposed to 15 (50%) in the cisplatin group. Hojski 2015 observed an "improvement of quality of life" in both the TMP and talc slurry groups, but with pre‐ and post‐treatment QLQ‐C30 scores demonstrating higher global health scores and less fatigue in the TMP group compared to talc slurry.
No studies reported on the potential patient burden of community IPC drainages and impact this may have on quality of life.
Relative costs of the comparative techniques
Seven of 80 trials reported the relative costs of the interventions. Rapid pleurodesis was cheaper than standard care in Yildirim 2005 (USD 245 (SD 71.5) with rapid pleurodesis versus USD 860 (SD 496) with standard care). Talc slurry was cheaper than bleomycin in three studies: Ong 2000 evaluated the cost per dose (USD 1 per dose with talc slurry versus USD 309 per dose with bleomycin); Haddad 2004 calculated the complete cost for the entire procedure (USD 488 (SD 212.5) with talc slurry versus USD 796 (SD 207.3) with bleomycin) and Zimmer 1997 calculated the cost of each treatment (USD 12.36 with talc slurry versus USD 955.83 with bleomycin). Talc poudrage was also cheaper than bleomycin in Diacon 2000 (CHF 3893 (Swiss Francs) (USD 4206) with talc poudrage versus CHF 4169 (USD 4504) with bleomycin). The total cost of VATS pleurectomy was more than talc pleurodesis (GBP 14,252 (USD 21,682) with VATS pleurectomy versus GBP 10,436 (USD 15,876) with talc pleurectomy) (Rintoul 2014). Dresler 2005 reported no difference between the cost of talc slurry and poudrage (no figures quoted).
A costing study performed alongside the TIME‐2 study found IPCs to be a cost‐effective choice when compared to talc slurry and most economical in participants with limited survival. "Substantial uncertainty" about the longer‐term cost‐effectiveness of IPCs was acknowledged due to limitations including sample size of the study population (which was not powered to detect cost‐effectiveness differences) and variables such as nursing time required for IPC drainage and life‐expectancy (Olfert 2017).
At 12 weeks' postintervention, nine (69%) participants undergoing daily IPC drainage and seven (58%) participants with alternate‐day IPC drainage in the ASAP trial considered that catheter supplies posed no financial burden. Ten (77%) participants in the 'aggressive drainage' arm and six (50%) participants in the standard care arm had costs completely covered by insurance (Wahidi 2017).
Overall mortality
Forty‐five studies provided participant mortality data (number of study participants who had died).
Pair‐wise (direct) meta‐analysis
The direct evidence regarding mortality is shown in Appendix 13. Only one direct comparison found evidence of a difference between treatment arms; in the comparison between interferon and bleomycin those receiving interferon had a higher rate of mortality (OR 2.16, 95% CI 1.15 to 4.07; participants = 160; Analysis 12.4).
Network meta‐analysis
We incorporated 31 trials of 15 treatments, including 2816 participants, into an NMA analysing mortality (Appendix 14; Appendix 15). Results from the NMA are summarised in summary of findings Table 5.
Rankings within the network were imprecise, with wide CIs; for this reason, we downgraded certainty in the evidence by one level in all comparisons. We also downgraded for indirectness, due to the different time points at which studies reported mortality data.
Tetracycline may be associated with higher mortality rates than six agents including bleomycin (OR 2.58, 95% Cr‐I 1.09 to 6.76), talc poudrage (OR 3.06, 95% Cr‐I 1.05 to 9.76) and talc via IPC (OR 7.74, 95% Cr‐I 1.33 to 50.51). We tentatively suggest that bleomycin (OR 1.03, 95% Cr‐I 0.43 to 2.50) and IPC – not daily drainage (OR 0.80, 95% Cr‐I 0.42 to 1.61) may be comparable to talc slurry but have a low level of certainty in this conclusion.
We are uncertain whether talc poudrage may be comparable to talc slurry (OR 0.87, 95% Cr‐I 0.51 to 1.49; very‐low certainty). In addition to downgrading for imprecision and indirectness, we also downgraded the evidence for this comparison for inconsistency (I2 = 40%). We are uncertain whether doxycycline may be comparable to talc slurry (OR 0.71, 95% Cr‐I 0.15 to 3.23); very‐low certainty) and downgraded evidence for serious study limitations in addition to imprecision and indirectness.
The degree of heterogeneity was low (Tau 0.22, 95% Cr‐I 0.01 to 0.73).
There was no evidence of global inconsistency in this network: the DIC was 5 points lower (indicating better fit after penalising for complexity) for the NMA model than for the inconsistency model, and the estimate of between‐study heterogeneity (Tau) was very similar under both models. The residual deviance under each of the two models was almost identical (53.8 NMA versus 54.1 inconsistency model): therefore, we did not present plots of residual deviance contributions for this outcome, as these are uninformative. Similarly, there was no evidence of loop inconsistency (Appendix 4).
Other findings
Most studies that were not included in the network showed no differences in mortality (Clementsen 1998; Crnjac 2004; Goodman 2006; Ishida 2006; Mager 2002; Maskell 2004; Rahman 2015; Rintoul 2014; Terra 2015; Villanueva 1994; Yildirim 2005; Yoshida 2007; Zhao 2009).
Median survival
Thirty studies reported median survival (days) for the treatment groups. Two studies found a survival difference between the treatment arms. Masuno 1991 found a median survival of 232 days with LC9018 versus 125 days with control (participants = 95; P = 0.008). Mishra 2018 observed an increase in time to death in the urokinase group (median survival: 69 days with urokinase versus 48 days with placebo; P = 0.026).
Kasahara 2006 reported a longer median survival in participants receiving high‐dose OK‐432 than low‐dose OK‐432, but did not report the spread or whether this difference was significant (33.6 days with high dose versus 22.6 days with low dose; participants = 38). Evans 1993 found survival was longer after thoracoscopic tetracycline pleurodesis than bedside administration (total participants = 34; P = 0.03; raw data only available as a survival curve).
Duration of inpatient stay
Twenty‐eight of 80 studies reported data for duration of inpatient stay.
Total length of stay
Many studies reported no difference between interventions (Bayly 1978; Bhatnagar 2018; Bhatnagar 2020; Haddad 2004; Ibrahim 2015; Lynch 1996; Muruganandan 2018; Ong 2000; Paschoalini 2005; Rahman 2015; Schmidt 1997; Terra 2009; Yim 1996; Zimmer 1997).
Yildirim 2005 and Goodman 2006 reported a shorter length of stay when chest drains were removed earlier following sclerosant administration compared to standard care (Yildirim 2005: mean: 2.33 days (SD 0.62) with shorter versus 8.33 days (SD 4.85) with standard; P ≤ 0.001; participants = 27; Goodman 2006: median: 4 days (interquartile range (IQR) 4 to 8) with shorter versus 8 (IQR 6 to 9) with standard; P ≤ 0.01; participants = 41). Ozkul 2014, which evaluated a rapid drainage strategy prior to sclerosant administration, also showed this group had a shorter length of stay than the standard care group (mean: 2.2 days with rapid versus 9.0 days with standard; P ≤ 0.001; participants = 79). The talc group had a shorter length of stay than the VATS partial pleurectomy group in the MesoVATS study (median: 3 days (IQR 2 to 5) with talc versus 7 days (IQR 5 to 11) with VATS; P ≤ 0.001; participants = 196) (Rintoul 2014). Participants undergoing TMP had a shorter hospital stay than those receiving talc slurry in Crnjac 2004 (mean: 5.5 days (SD 2.5) with TMP versus 7.5 (SD 3.3) with talc slurry; P = 0.001; participants = 87). Although the mean duration of thoracic drainage was shorter for participants undergoing TMP in Hojski 2015, there was no difference in the total length of hospital stay.
Thomas 2017 reported that participants receiving an IPC (without daily drainage) spent fewer days in hospital from procedure to death or 12 months compared to those receiving talc slurry (10 days (IQR 3 to 17) with IPC (without daily drainage) versus 12 days (IQR 7 to 21) with talc slurry; P = 0.03; participants = 146). Over the 12‐month TIME‐2 study, participants receiving an IPC (without daily drainage) spent a median of 1 day (IQR 0 to 3 days) in hospital for drainage or drainage‐related complications compared to a median of 4.5 days (IQR 2.5 to 7.5) in the talc slurry pleurodesis group (P ≤ 0.001) (Davies 2012). Talc administration via IPC and daily IPC drainage did not result in a difference in the number of days spent in hospital when compared to IPC without daily drainage (Bhatnagar 2018; Muruganandan 2018).
Time from intervention to discharge
Putnam 1999 reported that participants randomised to receive an IPC had a reduced hospital admission time from randomisation to discharge compared to those receiving doxycycline pleurodesis (median: 1 day with IPC versus 6.5 with doxycycline; P ≤ 0.001; participants = 144). This was mirrored by Boshuizen 2017 who reported a median hospitalisation period of 4 days versus 0 days (P ≤ 0.0001) favouring participants in the IPC without daily drainage arm compared to those receiving talc slurry pleurodesis. Thomas 2017 reported a reduced length of initial hospital admission for IPC insertion (median stay: 1 day (IQR 1‐2 days) with IPC insertion versus 3 days (IQR 3‐4 days) with talc pleurodesis; P ≤ 0.001). In the TIME‐2 study, time from randomisation to discharge was a median of 0 days (IQR 0 to 1) in the IPC (without daily drainage) group and 4 days (IQR 2 to 6) in the talc pleurodesis group (difference: 3.5 days fewer, 95% CI –4.8 to –1.5; P ≤ 0.01) (Davies 2012).
Participants receiving urokinase for non‐draining MPE had a shorter length of hospital stay from randomisation to discharge compared to those receiving placebo (mean 6.2 days (SD 2.7) with urokinase versus 8.7 days (SD 6.5) with placebo; P = 0.049) (Mishra 2018).
Participants randomised to autologous blood pleurodesis had a shorter duration of postpleurodesis hospital stay than those receiving talc slurry (mean: 2.8 days (SD 0.9) with autologous blood pleurodesis versus 3.6 days (SD 1.8) with talc slurry; P = 0.04) (Keeratichananont 2018), and tetracycline (2.6 (SD 1.2) with autologous blood pleurodesis versus 4.3 days (SD 2.4) with tetracycline; P = 0.03) (Keeratichananont 2015).
Mohsen 2011 found participants receiving iodine had a shorter postprocedural length of stay than those undergoing talc poudrage (mean: 4.5 days (SD 1.1) with iodine versus 5.7 (SD 2) with talc poudrage; P = 0.02; participants = 42).
Patient acceptability
Three trials reported patient acceptability of the interventions (Demmy 2012; Dresler 2005; Wahidi 2017).
Participants recruited to the ASAP trial showed an overall high level of satisfaction with IPCs when asked to complete a patient satisfaction questionnaire. At 12 weeks' postintervention, 12 participants (92%) in the 'aggressive' daily drainage study arm and 11 participants (92%) in the standard (not daily drainage) arm felt they would choose an IPC again as a treatment for pleural effusion‐related breathlessness. When asked at 12 weeks' postintervention, nine (69%) participants in the daily drainage group and five (42%) participants in the standard care group reported it was 'extremely easy' to drain the catheter at home (Wahidi 2017).
No studies reported on the potential patient burden of community IPC drainages and the impact this may have on quality of life.
Demmy 2012 did not provide raw data by treatment group. Dresler 2005 reported no difference between talc slurry and talc poudrage in terms of participants' perception of convenience (no raw data provided).
The only trial evaluating mistletoe (viscum) reported that 2/13 participants in the mistletoe arm withdrew their consent for ongoing study participation after experiencing allergic reactions to the first dose. The outcomes for these participants were not available and hence the trial deemed them non‐evaluable (Gaafar 2014).
Need for repeat invasive pleural intervention
We considered that the risk of requiring a repeat invasive pleural procedure for symptomatic re‐accumulation of pleural fluid is an important factor when selecting an initial management strategy for MPE. Pleural fluid re‐accumulation, due to failure of the initial pleurodesis, is frequently associated with increasing breathlessness. Undergoing an additional procedure commonly incurs more time in hospital and re‐exposure to the risk of procedure‐related complications.
Direct (pair‐wise) meta‐analysis
We performed pair‐wise meta‐analyses comparing talc poudrage, bleomycin and IPCs without daily drainage to talc slurry, in terms of need for repeat invasive pleural intervention. Results are summarised in summary of findings Table 6.
We had a moderate level of certainty that participants receiving talc poudrage probably have a comparable risk of requiring repeat invasive pleural intervention than those receiving talc slurry (OR 0.96, 95% Cr‐I 0.59 to 1.56; studies = 2; participants = 380; Bhatnagar 2020; Terra 2009). We downgraded certainty in the evidence by one level for indirectness, due to differences between study protocols (Bhatnagar 2020 administered 4 g of graded talc by 12‐Fr to 14‐Fr drains in the talc slurry arm and by 16‐Fr to 24‐Fr drains in the talc poudrage arm, whereas Terra 2009 administered 5 g of 'non‐calibrated' talc via 28‐Fr drains).
Participants receiving an IPC (without daily drainage) are probably less likely to require repeat invasive pleural intervention than participants receiving talc slurry pleurodesis (OR 0.25, 95% Cr‐I 0.13 to 0.48; studies = 3; participants = 343; moderate certainty; Boshuizen 2017; Davies 2012; Thomas 2017). We downgraded evidence by one level for indirectness, as participants with trapped lung were excluded by one study (Thomas 2017), but included by Boshuizen 2017 and Davies 2012.
We made note of study limitations due to lack of blinding (which was not possible due to the nature of the study interventions) in the talc poudrage to talc slurry and IPC without daily drainage to talc slurry comparisons, but did not downgrade evidence as requirement for repeat intervention was guided by symptoms and radiology, with involvement of a second blinded clinician in one study (Bhatnagar 2020) prior to repeat intervention in participants with less than one‐third opacification of the hemithorax.
Data were also available from one study comparing bleomycin to talc slurry, but the result was very imprecise (OR for repeat procedure 4.33, 95% Cr‐I 0.16 to 114.58; participants = 33; very‐low certainty; Zimmer 1997). We downgraded evidence by one level for serious study limitations, as data comparing bleomycin to talc slurry were available from only one study, at high risk of bias in three domains. We downgraded evidence by two levels due to gross concerns of imprecision due to the small number of participants (33) and very wide CIs.
There was no direct evidence comparing doxycycline or placebo to talc slurry.
From these results, we estimated that 20/100 participants (95% CI 16 to 24) will require a repeat invasive procedure with talc slurry, 19/100 (95% CI 11 to 30) with talc poudrage, 6/100 (95% CI 3 to 11) with IPC without daily drainage and 52/100 (95% CI 4 to 97) with bleomycin.
Network meta‐analysis
We performed a post‐hoc NMA for requirement for ipsilateral repeat invasive pleural intervention. However, there were no meaningful results. There was only one evidence loop in the entire network and the indirect evidence was computationally unstable due to the presence of a zero cell count.
Discussion
This is the first update of the review published in Issue 5, 2016 (Clive 2016), which replaced the original review published in 2004 (Shaw 2004).
Summary of main results
The management of MPE has long been subject to debate and research. This systematic review of the current literature attempts to combine all the available randomised evidence regarding the wide variety of interventions for the condition.
Since the last iteration of this review in 2016, a number of robust, large randomised trials have been published evaluating some key, clinically important questions in this area. These have provided us with a wealth of new data, including more important patient‐reported outcomes and better insights into the role for IPCs in MPE management.
Our primary NMA evaluating pleurodesis failure indicated that talc poudrage may have fewer pleurodesis failures than talc slurry (OR 0.50, 95% Cr‐I 0.21 to 1.02; moderate‐certainty evidence). However, direct evidence from four statistically homogeneous trials (I2 = 0%) estimated an OR closer to the null value of 1 (OR 0.81, 95% CI 0.61 to 1.08; Analysis 3.1), indicating that the two interventions may have comparable efficacy. A sensitivity NMA restricted to studies at low risk of bias provided a similar effect estimate, with a wide Cr‐I (OR 0.78, 95% Cr‐I 0.16 to 2.08). Estimated ranks of talc poudrage and talc slurry were third (95% Cr‐I 1 to 6) and sixth (95% Cr‐I 3 to 10) of 21 interventions from the primary NMA and second (95% Cr‐I 1 to 9) and fourth (95% Cr‐I 1 to 9) of 18 interventions from the sensitivity analysis restricted to trials at low risk of bias.
A large number of trials estimated pleurodesis failure rates with talc slurry (907 participants randomised to this intervention across 19 studies): talc slurry was therefore used as the comparator intervention in the 'Summary of findings' tables (summary of findings Table for the main comparison;summary of findings Table 2; summary of findings Table 3; summary of findings Table 4; summary of findings Table 5; summary of findings Table 6). Although other interventions, such as mistletoe (viscum) and TMP, appeared to rank highly within the primary NMA, these interventions were only evaluated by very small studies (63 participants randomised to TMP and 10 to mistletoe (viscum) in total), all with an overall high risk of bias. Hence, estimates of the relative efficacy or rank of these interventions are very imprecise (wide Cr‐Is) and we excluded both of these agents from the low risk of bias sensitivity analysis. Given the very small number of participants randomised to these interventions, it is not possible to draw conclusions about their use in routine clinical practice.
Our results indicate that IPCs without daily drainage (rank 18th, 95% Cr‐I 13 to 21) of 21 interventions in the main network and rank 15th (95% Cr‐I 9 to 18) of 18 interventions in the sensitivity analysis excluding studies at high risk of bias) are less likely to effect a definitive pleurodesis allowing IPC removal than several other interventions, including talc poudrage and talc slurry (moderate certainty). However, pleurodesis efficacy may be increased with daily IPC drainage or by administration of talc slurry via the IPC. Importantly, direct meta‐analysis demonstrated that participants with an IPC (without daily drainage) were less likely to require repeat invasive pleural intervention than participants treated with talc slurry pleurodesis (OR 0.25, 95% CI 0.13 to 0.48; studies = 3, participants = 343; moderate‐certainty evidence). This is a potentially important finding for patients, since requirement of a repeat invasive pleural intervention may be a more relevant and meaningful outcome than obtaining a definitive pleurodesis. We considered this an important factor with regard to patient acceptability of the available interventions.
The networks evaluating fever and pain found only uncertain evidence of minimal differences between agents, with no evidence for differences between the most commonly used interventions reported in the 'Summary of findings' tables.
Five studies provided data on infection rates in participants receiving IPCs compared to chemical pleurodesis (Boshuizen 2017; Davies 2012; Demmy 2012; Putnam 1999; Thomas 2017). Data from three studies suggest participants receiving an IPC may have a higher risk of developing cellulitis or pleural infection. Notably, no IPCs were removed as a consequence of infection (Davies 2012; Putnam 1999; Thomas 2017).
There were insufficient comparable data to perform an NMA of breathlessness outcomes. However, the evidence suggests no difference in postintervention VAS breathlessness scores of participants receiving an IPC (without daily drainage) compared to talc slurry pleurodesis, based on a direct meta‐analysis of data from two studies (MD in change in 0‐mm to 100‐mm VAS score –6.12 mm, 95% CI –16.32 to 4.08; low‐certainty evidence) (minimum clinically important difference for dyspnoea in MPE using the VAS breathlessness scale 19 mm, 95% CI 14 to 24; Mishra 2015). Direct comparison from one study demonstrated likely comparable outcomes for breathlessness control between talc poudrage and talc slurry (MD 4.00 mm, 95% CI –6.26 to 14.26; moderate‐certainty evidence; Bhatnagar 2020).
There was also insufficient comparable data to perform an NMA of quality of life outcomes. Most studies reported no difference between interventions on quality of life outcomes.
Only seven studies reported the relative costs of interventions. Three studies found talc slurry to be cheaper than bleomycin. A costing study performed alongside the TIME‐2 trial found IPCs to be a cost‐effective choice when compared to talc slurry and most economical in participants with limited survival, but noted further research is needed about the longer‐term cost‐effectiveness of IPCs (Olfert 2017).
The NMA evaluating mortality found only uncertain evidence of minimal differences between agents, with no evidence for differences between the most commonly used interventions reported in the 'Summary of findings' tables.
Twenty‐eight of 30 studies reporting median survival (days) found no difference between interventions.
Participants receiving an IPC spent fewer days in hospital over the course of their remaining life, or until 12 months, in two studies (Davies 2012; Thomas 2017). Data also demonstrates that participants undergoing an IPC insertion had a faster time to hospital discharge than those admitted for a chemical pleurodesis (Boshuizen 2017; Davies 2012; Putnam 1999; Thomas 2017).
Overall completeness and applicability of evidence
This is the largest systematic review of the evidence surrounding interventions in MPE in the published literature. We used robust search strategies to identify all the available randomised evidence and diligently contacted the study authors regarding missing data where possible.
However, despite attempting to contact the study authors, we were unable to obtain additional information regarding 40 records during the full‐text screening process (36/207 records identified from searches in 2016, included within the 135 listed as 'not eligible' and a further 4/156 records identified in 2019 updated searches, included within the 124 'not relevant' records) in order to confirm whether eligibility criteria for inclusion in the review were met. We only included RCTs within this review. As per the protocol, we excluded studies which were not randomised (at high risk of bias for sequence generation, allocation concealment, or both). It is possible that publication bias may therefore affect the validity of the results.
The small number of studies for each pair‐wise comparison (maximum of five), meant funnel plots would not be informative (Sterne 2011). As the interventions could not be logically ordered, we also decided a comparison‐adjusted funnel plot for the network was not valid (Salanti 2014).
Several studies included in this review had very small numbers of participants, which raises the possibility of small‐study effects, which may have resulted in an overestimation of treatment efficacy. Only 13/80 included studies had outcome data for more than 100 participants (Bhatnagar 2018; Bhatnagar 2020; Davies 2012; Dresler 2005; Keeratichananont 2018; Putnam 1999; Rahman 2015; Rintoul 2014; Sartori 2004; Thomas 2017; Wahidi 2017; Wang 2018; Yoshida 2007). However, a comparison between pair‐wise meta‐analysis results from random‐effects versus fixed‐effect models (which gives relatively more weight to larger studies, hence reducing the impact of small studies) found no meaningful differences.
When evaluating different pleurodesis agents, we elected to combine different doses of each agent from the available studies for the purposes of comparison. This was necessary due to variation in the doses between studies, which would have made the network more sparse and unconnected. This is a limitation of our review, since differential treatment effects according to doses could have been missed. This is one possible explanation for the high levels of heterogeneity observed in our meta‐analyses, which we were unable to investigate further due to the complexity of the data. One included study was designed to compare different doses of silver nitrate and this revealed no difference in terms of pleurodesis efficacy or adverse effects (Terra 2015).
Many of the included studies did not assess patient quality of life, symptom control, acceptability of the intervention to the patient, duration of inpatient stay and costs. Of those that did, we were limited by the diversity of outcome measurement systems used and inconsistent reporting of data and it was therefore not possible to perform an NMA for these outcomes. Although pair‐wise and NMA of the risk of having procedure‐related pain was possible using data from studies that reported the presence or absence of pain, we were unable to incorporate data from studies which used a scoring system to grade severity of pain (continuous outcome data), due to the range of different scales used. Although such outcomes were secondary objectives of our review, they are important factors when selecting a management strategy and hence the paucity of data on these important patient‐reported outcome measures limits the applicability of the evidence from this review to everyday clinical practice.
It is also important to consider the global availability of some of these agents when considering the clinical applicability of our findings. Agents such as tetracycline and C parvum are not widely available, precluding their routine use. Other sclerosants included in this review are unlicensed for use as a pleurodesis agent.
Our data regarding the adverse effects of these treatments are limited. As we have selected only RCTs for inclusion in this review, there is the potential that rare but important adverse effects were missed using our methodology. There are reports of adverse effects of pleurodesis agents resulting from absorption of the agent into the systemic circulation. For example, systemic absorption of mixed particle size talc is thought to be linked to rare but occasionally life‐threatening acute respiratory distress syndrome, a risk that is minimised by the use of graded (large‐particle) talc (Maskell 2004), now standard practice in Europe and increasingly available worldwide. Mepacrine gained popularity in Scandinavia as a pleurodesis agent, although rare psychotic episodes and seizures, thought to be related to systemic absorption if administered at high doses, limited its use (Bjorkman 1989).
We only managed to synthesise the data on the main adverse effects and so we cannot reliably infer the full adverse effect profiles of these treatments from this review. An appreciation of the adverse effect profile of these interventions is vital when weighing up the risks and benefits of the procedures, particularly as many of the patients in this population have a limited life‐expectancy and hence minimising discomfort during their remaining time is imperative.
The definition of pleurodesis efficacy varied between studies, with many relying on radiology alone, which is increasingly considered inadequate without considering symptom recurrence. Achieving a pleurodesis may not represent the best strategy for all. Patients may have a personal preference regarding the best treatment strategy for themselves. Therefore, factors such as breathlessness control and risk of repeat invasive pleural intervention are also important to discuss when selecting the best treatment strategy. Many patients would rather avoid hospital admission and elect for an outpatient pathway, which may make the use of an IPC more appealing than a chemical pleurodesis.
Quality of the evidence
The overall certainty of the evidence ranged from moderate to very low (summary of findings Table for the main comparison; summary of findings Table 2; summary of findings Table 3; summary of findings Table 4; summary of findings Table 5; summary of findings Table 6).
The risk of bias in several included studies is substantial and we downgraded evidence for study limitations in the pleurodesis failure rate network, patient‐reported breathlessness control meta‐analysis, mortality NMA and meta‐analysis of risk of requiring a repeat invasive pleural intervention. The vast majority of studies were unblinded, which in part reflects the nature of the interventions but also the symptom‐based nature of the endpoints measured, precluding blinding of the outcome reporting as well. Documentation of the methods used for sequence generation and allocation concealment were frequently omitted and it was often not possible to obtain this information retrospectively. However, in a sensitivity analysis including only studies at low risk of bias (defined as a maximum of one high‐risk domain in the risk of bias assessment), the relative rankings of interventions were similar. The heterogeneity estimate (Tau) was substantially reduced in this sensitivity analysis (from 0.70 to 0.37), indicating that bias may have been a contributor to the high level of heterogeneity in the primary analysis.
Given the inevitable death of patients in this palliative population, true ITT analysis was often not performed, resulting in the potential for attrition bias. These missing data were handled differently by the various included studies. Some studies included participants on the basis of their 'last observation carried forward' (i.e. their last outcome prior to death) and others excluded these participants from the analysis completely. No studies used other imputation methods to account for these missing data.
We downgraded evidence for indirectness due to variation in definitions of pleurodesis failure, inconsistencies in the doses of sclerosant used and the different approaches towards inclusion or exclusion of participants with trapped lung. There was also variation in how participant attrition was handled and the time point at which pleurodesis failure was assessed. We did state how this would be handled a priori, using hierarchies of preferences; however, these factors may have impacted on the results of the final NMA.
Additionally, we downgraded evidence due to imprecision; many ranks and effect estimates had wide Cr‐Is. This was particularly evident in the NMAs of risk of procedure‐related fever and pain, and risk of mortality, where all relative effect estimates had wide Cr‐Is. We had very high concerns of imprecision in the bleomycin to talc slurry comparison in the risk of repeat pleural intervention meta‐analysis and evidence was downgraded by two levels.
We downgraded evidence by one level for inconsistency for the IPC without daily drainage to talc slurry comparison for pleurodesis failure rate (I2 = 61%) and for the talc poudrage to talc slurry comparison within the pain (I2 = 69%) and mortality (I2 = 40%) outcomes.
There was a substantial degree of both statistical and clinical heterogeneity in each network of comparisons. Aside from the analyses restricted to studies at lower risk of bias and trials excluding trapped lung (which did appear to reduce the degree of heterogeneity) the other sensitivity analyses, selected on the basis of factors hypothesised to be clinical effect modifiers, did not appear to explain the high level of heterogeneity. This signifies the complexity of this condition and the treatments, which results in substantial clinical heterogeneity. Possible explanations include different effects of varying tumour subtypes, early lung entrapment which is not clinically detectable, varying drug doses and subtle technique‐related procedural factors, such as adequacy of pleural fluid drainage prior to instillation of the sclerosant.
Potential biases in the review process
This review is based on the available published evidence and not on individual patient data, which would give a more accurate estimation of treatment effect and a clearer understanding of the heterogeneity (Deeks 2011). However, as we have included studies published as long ago as 1977, individual patient information was therefore not available and patient‐level meta‐analysis would not be possible without excluding the majority of the available evidence.
In order to allow inclusion of as many eligible studies as possible, we combined data obtained using different definitions of pleurodesis failure and timings in the same analysis. We predefined the methodology for this in the protocol using hierarchies of preferences. We performed sensitivity analyses to ensure the results were robust.
A potential source of bias in our primary outcome measure, pleurodesis failure, is the inevitable participant attrition due to mortality reported in many studies. If there had been real differences in mortality (and therefore dropout) across the interventions, this could bias the estimates of relative pleurodesis failure rates. However, analysis of the data on mortality and median survival times showed only a possible association between tetracycline and increased mortality rates and no differences in the vast majority of comparisons.
It should also be noted that the initial screening of titles and abstracts up to 2016 was performed by just one review author. From 2016 to 2020, this was done by two review authors.
Agreements and disagreements with other studies or reviews
Several other systematic reviews have been published in this area (Iyer 2019; Mummadi 2015; Shaw 2004; Sivakumar 2019; Tan 2006; Xia 2014). All have presented only direct comparisons, rather than also incorporating indirect comparisons of alternative agents using NMA methods. We consider that NMA is much more informative, as the diversity of the control groups used when comparing one agent with 'all others' means that important relative treatment effects may be either over‐ or underestimated.
We used robust inclusion and exclusion criteria to identify eligible studies, which resulted in some studies included in other systematic reviews in this field being excluded from this one. These studies have been recorded in the Excluded studies section of this review, with justifications given for their exclusion. The main reasons were failure to use a truly random process to assign treatment groups and the inclusion of ascites or pericardial fluid accumulation, which could not be differentiated in the results section.
Previously published meta‐analyses have suggested that talc is the most effective agent (associated with the fewest pleurodesis failures) and is best delivered thoracoscopically, however, Mummadi 2015 found both talc poudrage and talc slurry offered similar rates of pleurodesis efficacy, in keeping with our results.
In a systematic review of quality of life following intervention for MPE, Sivakumar 2019 also acknowledged limitations due to heterogeneity in study design and varied measurement tools. While thoracoscopic talc poudrage, talc slurry and IPCs improved short‐term health‐related quality of life, no consensus was formed on the overall best treatment approach, with particular respect to long‐term outcomes.
Our review has demonstrated that IPCs are associated with reduced rates of invasive ipsilateral re‐intervention and reduced procedure‐related length of hospital stay, mirrored by Iyer 2019.

Study flow diagram.

Risk of bias graph: review authors' judgements about each risk of bias item presented as percentages across all included studies.

Risk of bias summary: review authors' judgements about each risk of bias item for each included study.

Network plot of the pleurodesis efficacy network. The nodes are weighted according to the number of participants randomised to the intervention. The edges (line thicknesses) are weighted according to the number of studies included in each comparison.
IFN: interferon; IPC: indwelling pleural catheter without daily drainage; thioTEPA: triethylenephosphoramide; TMP: thoracoscopic mechanical pleurodesis.

Estimated (95% credible interval (Cr‐I)) ranks for each of the pleurodesis methods from the main network. IFN: interferon; IPC: indwelling pleural catheter without daily drainage; thioTEPA: triethylenephosphoramide; TMP: thoracoscopic mechanical pleurodesis.

Inconsistency plot for the main network. Treatment codes: 01: adriamycin; 02:autologous blood; 03:bleomycin; 04:C parvum; 05:doxycycline; 06:interferon; 07:indwelling pleural catheter (IPC) –daily drainage; 08:IPC –not daily drainage; 09:iodine; 10:mepacrine; 11:mistletoe (viscum); 12:mitoxantrone; 13:mustine; 14:placebo; 15:silver nitrate; 16:thoracoscopic mechanical pleurodesis (TMP); 17:talc poudrage; 18:talc slurry; 19:talc via IPC; 20:tetracycline; 21:triethylenethiophosphoramide. Abbreviations: ROR:ratio of odds ratios; 95% CI:95% confidence interval. Heterogeneity variance was set at 0.4929 (reflecting the estimation of Tau from the network).

Residual deviance contribution plot for the main network meta‐analysis. * indicates 0 events.

Estimated rank (95% credible interval (Cr‐I)) for causing fever (a low rank suggests increased risk of fever).

Residual deviance contribution plot for the fever network meta‐analysis. * indicates 0 events.

Residual deviance contribution plot for the pain network meta‐analysis. * indicates 0 events.

Comparison 1 Bleomycin, Outcome 1 Pleurodesis failure rate.

Comparison 1 Bleomycin, Outcome 2 Fever.

Comparison 1 Bleomycin, Outcome 3 Pain.

Comparison 1 Bleomycin, Outcome 4 Mortality.

Comparison 1 Bleomycin, Outcome 5 Repeat pleural intervention.

Comparison 2 Talc slurry, Outcome 1 Pleurodesis failure rate.

Comparison 2 Talc slurry, Outcome 2 Fever.

Comparison 2 Talc slurry, Outcome 3 Pain.

Comparison 2 Talc slurry, Outcome 4 Breathlessness.

Comparison 2 Talc slurry, Outcome 5 Mortality.

Comparison 2 Talc slurry, Outcome 6 Repeat pleural intervention.

Comparison 3 Talc poudrage, Outcome 1 Pleurodesis failure rate.

Comparison 3 Talc poudrage, Outcome 2 Fever.

Comparison 3 Talc poudrage, Outcome 3 Pain.

Comparison 3 Talc poudrage, Outcome 4 Breathlessness.

Comparison 3 Talc poudrage, Outcome 5 Mortality.

Comparison 3 Talc poudrage, Outcome 6 Repeat pleural intervention.

Comparison 4 Tetracycline, Outcome 1 Pleurodesis failure rate.

Comparison 4 Tetracycline, Outcome 2 Fever.

Comparison 4 Tetracycline, Outcome 3 Pain.

Comparison 4 Tetracycline, Outcome 4 Mortality.

Comparison 5 C parvum, Outcome 1 Pleurodesis failure rate.

Comparison 5 C parvum, Outcome 2 Fever.

Comparison 5 C parvum, Outcome 3 Pain.

Comparison 5 C parvum, Outcome 4 Mortality.

Comparison 6 Indwelling pleural catheter (IPC) – not daily drainage, Outcome 1 Pleurodesis failure rate.

Comparison 6 Indwelling pleural catheter (IPC) – not daily drainage, Outcome 2 Fever.

Comparison 6 Indwelling pleural catheter (IPC) – not daily drainage, Outcome 3 Pain.

Comparison 6 Indwelling pleural catheter (IPC) – not daily drainage, Outcome 4 Breathlessness.

Comparison 6 Indwelling pleural catheter (IPC) – not daily drainage, Outcome 5 Mortality.

Comparison 6 Indwelling pleural catheter (IPC) – not daily drainage, Outcome 6 Repeat pleural procedure.

Comparison 7 Iodine, Outcome 1 Pleurodesis failure rate.

Comparison 7 Iodine, Outcome 2 Fever.

Comparison 7 Iodine, Outcome 3 Pain.

Comparison 7 Iodine, Outcome 4 Mortality.

Comparison 8 Doxycycline, Outcome 1 Pleurodesis failure rate.

Comparison 8 Doxycycline, Outcome 2 Fever.

Comparison 8 Doxycycline, Outcome 3 Pain.

Comparison 8 Doxycycline, Outcome 4 Mortality.

Comparison 9 Duration of drainage after pleurodesis administration, Outcome 1 Pleurodesis failure rate.

Comparison 9 Duration of drainage after pleurodesis administration, Outcome 2 Mortality.

Comparison 10 OK‐432, Outcome 1 Pleurodesis failure rate.

Comparison 10 OK‐432, Outcome 2 Fever.

Comparison 10 OK‐432, Outcome 3 Pain.

Comparison 10 OK‐432, Outcome 4 Mortality.

Comparison 11 Mepacrine, Outcome 1 Pleurodesis failure rate.

Comparison 11 Mepacrine, Outcome 2 Fever.

Comparison 11 Mepacrine, Outcome 3 Pain.

Comparison 11 Mepacrine, Outcome 4 Mortality.

Comparison 12 Interferon (IFN), Outcome 1 Pleurodesis failure rate.

Comparison 12 Interferon (IFN), Outcome 2 Fever.

Comparison 12 Interferon (IFN), Outcome 3 Pain.

Comparison 12 Interferon (IFN), Outcome 4 Mortality.

Comparison 13 Triethylenethiophosphoramide, Outcome 1 Pleurodesis failure rate.

Comparison 13 Triethylenethiophosphoramide, Outcome 2 Fever.

Comparison 13 Triethylenethiophosphoramide, Outcome 3 Pain.
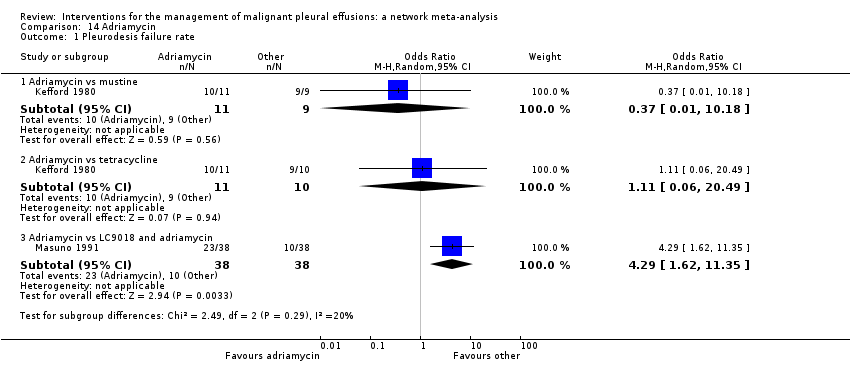
Comparison 14 Adriamycin, Outcome 1 Pleurodesis failure rate.

Comparison 14 Adriamycin, Outcome 2 Fever.

Comparison 14 Adriamycin, Outcome 3 Pain.

Comparison 15 Placebo, Outcome 1 Pleurodesis failure rate.

Comparison 15 Placebo, Outcome 2 Fever.

Comparison 15 Placebo, Outcome 3 Pain.

Comparison 15 Placebo, Outcome 4 Mortality.

Comparison 16 Mustine, Outcome 1 Pleurodesis failure rate.

Comparison 16 Mustine, Outcome 2 Fever.

Comparison 16 Mustine, Outcome 3 Pain.
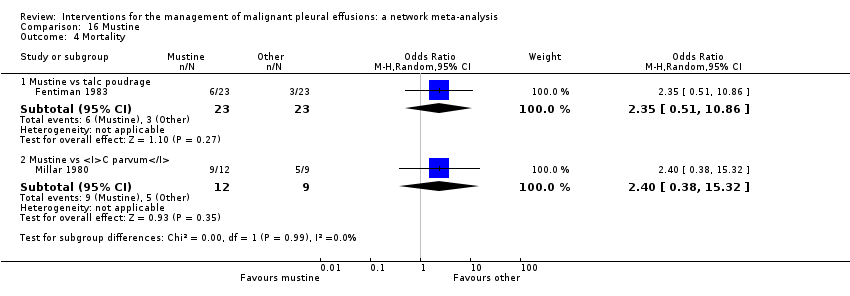
Comparison 16 Mustine, Outcome 4 Mortality.

Comparison 17 Mitoxantrone, Outcome 1 Pleurodesis failure rate.

Comparison 17 Mitoxantrone, Outcome 2 Pain.

Comparison 17 Mitoxantrone, Outcome 3 Fever.

Comparison 17 Mitoxantrone, Outcome 4 Mortality.

Comparison 18 Drain size, Outcome 1 Pleurodesis failure rate.

Comparison 18 Drain size, Outcome 2 Pain.

Comparison 18 Drain size, Outcome 3 Mortality.

Comparison 19 Thoracoscopic mechanical pleurodesis (TMP), Outcome 1 Pleurodesis failure rate.

Comparison 19 Thoracoscopic mechanical pleurodesis (TMP), Outcome 2 Mortality.

Comparison 20 Other, Outcome 1 Pleurodesis failure rate.

Comparison 20 Other, Outcome 2 Fever.

Comparison 20 Other, Outcome 3 Pain.

Comparison 20 Other, Outcome 4 Mortality.

Comparison 21 Silver nitrate, Outcome 1 Pleurodesis failure rate.

Comparison 21 Silver nitrate, Outcome 2 Fever.

Comparison 21 Silver nitrate, Outcome 3 Pain.

Comparison 21 Silver nitrate, Outcome 4 Mortality.

Comparison 22 Cisplatin, Outcome 1 Pleurodesis failure rate.

Comparison 22 Cisplatin, Outcome 2 Fever.

Comparison 22 Cisplatin, Outcome 3 Pain.

Comparison 22 Cisplatin, Outcome 4 Mortality.

Comparison 23 Duration of drainage prior to administration of sclerosant, Outcome 1 Pleurodesis failure rate.

Comparison 24 Dose of silver nitrate, Outcome 1 Pleurodesis failure rate.

Comparison 24 Dose of silver nitrate, Outcome 2 Fever.

Comparison 24 Dose of silver nitrate, Outcome 3 Pain.

Comparison 24 Dose of silver nitrate, Outcome 4 Mortality.
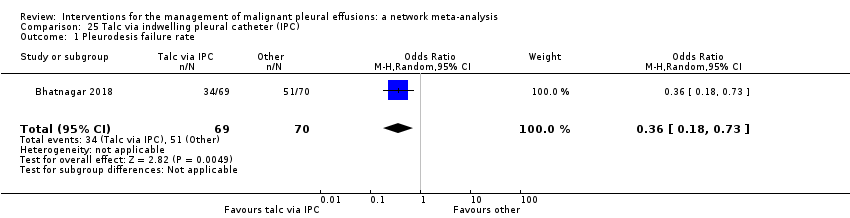
Comparison 25 Talc via indwelling pleural catheter (IPC), Outcome 1 Pleurodesis failure rate.

Comparison 25 Talc via indwelling pleural catheter (IPC), Outcome 2 Pain.

Comparison 25 Talc via indwelling pleural catheter (IPC), Outcome 3 Mortality.

Comparison 26 Autologous blood, Outcome 1 Pleurodesis failure rate.

Comparison 26 Autologous blood, Outcome 2 Fever.

Comparison 26 Autologous blood, Outcome 3 Pain.

Comparison 26 Autologous blood, Outcome 4 Mortality.
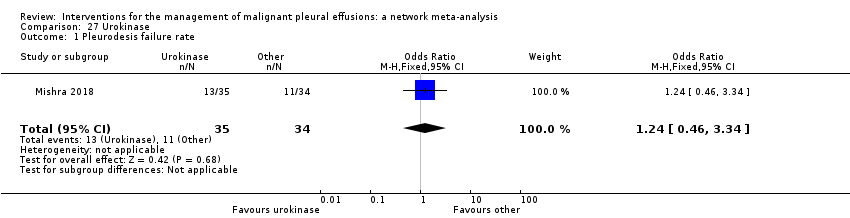
Comparison 27 Urokinase, Outcome 1 Pleurodesis failure rate.

Comparison 27 Urokinase, Outcome 2 Mortality.

Comparison 28 Streptokinase, Outcome 1 Pleurodesis failure rate.

Comparison 28 Streptokinase, Outcome 2 Pain.

Comparison 29 Endostatin, Outcome 1 Pleurodesis failure rate.

Comparison 29 Endostatin, Outcome 2 Mortality.

Comparison 30 Dose of iodine, Outcome 1 Pleurodesis failure rate.

Comparison 31 Indwelling pleural catheter (IPC) – daily drainage, Outcome 1 Pleurodesis failure rate.

Comparison 31 Indwelling pleural catheter (IPC) – daily drainage, Outcome 2 Pain.

Comparison 31 Indwelling pleural catheter (IPC) – daily drainage, Outcome 3 Mortality.

Comparison 32 Mistletoe (viscum), Outcome 1 Pleurodesis failure rate.
| Patient or population: adults with malignant pleural effusion Interventions: talc poudrage, bleomycin, IPC – not daily drainage, doxycycline, placebo Comparator (reference): talc slurry Outcome: pleurodesis failure rate Setting: inpatient and outpatients Data: based on network meta‐analysis of eligible studies | |||||||
| Total studies: 55* Total participants: 3758 No. interventions in network: 21 | Relative effect** Odds ratio (95% Cr‐I) Network estimate | Relative effect^^ Odds ratio (95% Cr‐I) Network estimate from studies at low risk of bias | Anticipated absolute effect (95% Cr‐I)*** | Certainty of evidence | Interpretation of findings | ||
| With talc slurry^ | With intervention | Difference | |||||
| Talc slurry (19 RCTs, 907 participants) Follow‐up: up to 12 months | Reference comparator | Reference comparator | 18 failures per 100 participants (11 to 24) | Not estimable | Not estimable | Moderatea | Reference comparator |
| Talc poudrage (9 RCTs, 530 participants) Follow‐up: up to 24 months | 0.50 (0.21 to 1.02) | 0.78 (0.16 to 2.08) | 18 failures per 100 participants (11 to 24) | 10 failures per 100 participants (4 to 19) | –8 (–15 to 0) i.e. 8 fewer failures per 100 participants | Moderateb | Probably comparable |
| Bleomycin (21 RCTs, 528 participants) Follow‐up: up to 24 months | 2.24 (1.10 to 4.68) | 3.93 (1.10 to 16.94) | 18 failures per 100 participants (11 to 24) | 32 failures per 100 participants (17 to 52) | 15 (2 to 32) i.e. 15 more failures per 100 participants | Lowa,b | May be inferior |
| IPC –not daily drainage (6 RCTs, 405 participants) Follow‐up: up to 12 months | 7.60 (2.96 to 20.47) | 8.60 (2.26 to 30.15) | 18 failures per 100 participants (11 to 24) | 62 failures per 100 participants (36 to 82) | 44 (20 to 63) i.e. 44 more failures per 100 participants | Moderatec | Probably inferior |
| Doxycycline (5 RCTs, 117 participants) Follow‐up: up to 12 months | 2.51 (0.81 to 8.40) | 1.89 (0.32 to 8.84) | 18 failures per 100 participants (11 to 24) | 35 failures per 100 participants (13 to 65) | 17 (–3 to 46) i.e. 17 more failures per 100 participants | Lowa,d | May be inferior |
| Placebo (4 RCTs, 159 participants) Follow‐up: up to 3 months | 15.90 (3.76 to 79.90) | 17.46 (3.33 to 97.26) | 18 failures per 100 participants (11 to 24) | 77 failures per 100 participants | 59 (26 to 77) i.e. 59 more failures per 100 participants | Moderated | Probably inferior |
| Network meta‐analysis summary of findings definitions: *Information is reported from studies included in the network meta‐analysis for pleurodesis failure. **Network meta‐analysis estimates are reported as ORs. ***Calculated using data from primary outcome network of pleurodesis failure. Anticipated absolute effect: compares two risks by calculating the difference between the risk of the intervention group with the risk of the control group. 'Absolute effect' and 'difference' estimates are posterior medians from a Bayesian statistical analysis. These may not sum exactly, due to skew in the posterior distributions. ^Reference comparator absolute event rate estimates are based on a random‐effects meta‐analysis of arm‐level data from all trials including a talc slurry arm and reporting the relevant outcome. Cr‐Is around 'differences' allow for sampling uncertainty in this baseline parameter, as well as uncertainty in the OR. ^^Network estimate from sensitivity analysis of studies at low risk of bias. These data are included within the summary of findings to reflect the ORs and Cr‐Is from the network estimates in which we have the greatest level of certainty in the evidence. Cr‐I: credible interval; IPC: indwelling pleural catheter; OR: odds ratio; RCT: randomised controlled trial. | |||||||
| GRADE Working Group grades of evidence (or certainty in the evidence): High certainty: we are very confident that the true effect lies close to that of the estimate effect. Moderate certainty: we are moderately confident in the effect estimate: the true effect is likely to be close to the estimate of the effect but there is a possibility that it is substantially different. Low certainty: our confidence in the effect estimate in limited: the true effect may be substantially different from the estimate of the effect. Very low certainty: we have little confidence in the effect estimate: the true effect is likely to be substantially different from the estimate of effect. | |||||||
| aDowngraded one level: evidence of indirectness. Of the studies evaluating talc slurry, 13/19 excluded trapped lung and 12/19 used a clinical definition of pleurodesis success. Of the studies in the network evaluating bleomycin, 9/21 excluded trapped lung and 12/21 used a clinical definition of pleurodesis success and variability in the dose of bleomycin noted. | |||||||
| Patient or population: adults with malignant pleural effusion Interventions: talc poudrage, bleomycin, IPC – not daily drainage, doxycycline, placebo Comparator (reference): talc slurry Outcome: fever Setting: inpatient and outpatients Data: based on network meta‐analysis of eligible studies | ||||||
| Total studies: 30 * Total participants: 2004 No. interventions in network: 14 | Relative effect** OR (95% Cr‐I) Network estimate | Anticipated absolute effect (95% Cr‐I)*** | Certainty of evidence | Interpretation of findings | ||
| With talc slurry^ | With intervention | Difference | ||||
| Talc slurry (9 RCTs; 823 participants) | Reference comparator | 21 cases in every 100 participants (11 to 33) | Not estimable | Not estimable | Lowa,b | Reference comparator |
| Talc poudrage (4 RCTs; 553 participants) | 0.89 (0.11 to 6.67) | 21 cases in every 100 participants (11 to 33) | 19 cases in every 100 participants (3 to 67) | 2 (–21 to 43) i.e. 2 fewer cases per 100 participants | Lowa,b | May be comparable |
| Bleomycin (14 RCTs; 774 participants) | 2.33 (0.45 to 12.50) | 21 cases in every 100 participants (11 to 33) | 39 cases in every 100 participants (10 to 79) | 17 (–10 to 55) i.e. 17 more cases per 100 participants | Lowa,b | May be comparable |
| IPC – not daily drainage (1 RCT; 101 participants) | 0.41 (0.00 to 50.00) | 21 cases in every 100 participants (11 to 33) | 10 cases in every 100 participants (0 to 93) | –10 (–28 to 70) i.e. 10 fewer cases per 100 participants | Lowa,b | May be comparable |
| Doxycycline (4 RCTs; 308 participants) | 0.85 (0.05 to 14.29) | 21 cases in every 100 participants (11 to 33) | 19 cases in every 100 participants (1 to 80) | –2 (–23 to 56) i.e. 2 fewer cases per 100 participants | Lowa,b | May be comparable |
| Placebo (2 RCTs; 118 participants) | 0.09 (0.00 to 5.00) | 21 cases in every 100 participants (11 to 33) | 2 cases in every 100 participants (0 to 59) | –17 (–30 to 36) i.e. 17 fewer cases per 100 participants | Lowa,b | May be comparable |
| Network meta‐analysis summary of findings definitions: *Information is reported from studies included in the network meta‐analysis for fever. **Network meta‐analysis estimates are reported as odds ratios. ***Anticipated absolute effect: compares two risks by calculating the difference between the risk of the intervention group with the risk of the control. group. 'Absolute effect' and 'difference' estimates are posterior medians from a Bayesian statistical analysis. These may not sum exactly, due to skew in the posterior distributions. ^Reference comparator absolute event rate estimates are based on a random‐effects meta‐analysis of arm‐level data from all trials including a talc slurry arm and reporting the relevant outcome. Cr‐Is around 'differences' allow for sampling uncertainty in this baseline parameter, as well as uncertainty in the OR. Cr‐I: credible interval; IPC: indwelling pleural catheter; OR: odds ratio; RCT: randomised controlled trial. | ||||||
| GRADE Working Group grades of evidence (or certainty in the evidence): High certainty: we are very confident that the true effect lies close to that of the estimate effect. Moderate certainty: we are moderately confident in the effect estimate: the true effect is likely to be close to the estimate of the effect but there is a possibility that it is substantially different. Low certainty: our confidence in the effect estimate in limited: the true effect may be substantially different from the estimate of the effect. Very low certainty: we have little confidence in the effect estimate: the true effect is likely to be substantially different from the estimate of effect. | ||||||
| aDowngraded one level for imprecision due to wide credible intervals of all network estimates. | ||||||
| Patient or population: adults with malignant pleural effusion Interventions: talc poudrage, bleomycin IPC – not daily drainage, doxycycline, placebo Comparator (reference): talc slurry Outcome: procedure‐related pain Setting: inpatient and outpatient Data: based on network meta‐analysis of eligible studies | ||||||
| Total studies: 31* Total participants: 2753 No. interventions in network: 14 | Relative effect** Odds ratio (95% Cr‐I) Network estimate | Anticipated absolute effect (95% Cr‐I)*** | Certainty of evidence | Interpretation of findings | ||
| With talc slurry^ | With intervention | Difference | ||||
| Talc slurry (9 RCTs, 1320 participants) | Reference comparator | 8 out of every 100 participants experiencing pain (1 to 35) | Not estimable | Not estimable | Lowa,b | Reference comparator |
| Talc poudrage (4 RCTs, 886 participants) | 1.26 (0.45 to 6.04) | 8 out of every 100 participants experiencing pain (1 to 35) | 10 out of every 100 participants experiencing pain (1 to 55) | 2 additional participants experiencing pain per 100 participants (–6 to 30) | Very lowa,b,c | May be comparable but evidence uncertain |
| Bleomycin (13 RCTs, 724 participants) | 2.85 (0.78 to 11.53) | 8 out of every 100 participants experiencing pain (1 to 35) | 19 out of every 100 participants experiencing pain (1 to 71) | 10 additional participants experiencing pain per 100 participants (–1 to 46) | Lowa,b | May be comparable |
| IPC – not daily drainage (6 RCTs, 738 participants) | 1.30 (0.29 to 5.87) | 8 out of every 100 participants experiencing pain (1 to 35) | 10 out of every 100 participants experiencing pain (1 to 55) | 1 additional participant experiencing pain per 100 participants (–9 to 30) | Lowa,b | May be comparable |
| Doxycycline (4 RCTs, 308 participants) | 3.35 (0.64 to 19.72) | 8 out of every 100 participants experiencing pain (1 to 35) | 22 out of every 100 participants experiencing pain (1 to 79) | 13 additional participants experiencing pain per 100 participants (–3 to 56) | Lowa,b | May be comparable |
| Placebo | 3 studies reported data for procedure‐related pain in participants receiving placebo but could not be included in the network as no events occurred in each study arm, causing computational problems. 1 study compared placebo with talc slurry and reported 0/17 participants receiving placebo and 0/14 receiving talc slurry required analgesia post procedure (Sorensen 1984). | — | — | |||
| Network meta‐analysis summary of findings definitions: *Information is reported from studies included in the network meta‐analysis for pain. **Network meta‐analysis estimates are reported as odds ratios. Cr‐I: credible interval. ***Anticipated absolute effect: compares two risks by calculating the difference between the risk of the intervention group with the risk of the control group. 'Absolute effect' and 'difference' estimates are posterior medians from a Bayesian statistical analysis. These may not sum exactly, due to skew in the posterior distributions. ^Reference comparator absolute event rate estimates are based on a random‐effects meta‐analysis of arm‐level data from all trials including a talc slurry arm and reporting the relevant outcome. Cr‐Is around 'differences' allow for sampling uncertainty in this baseline parameter, as well as uncertainty in the OR. Cr‐I: credible interval; IPC: indwelling pleural catheter; OR: odds ratio; RCT: randomised controlled trial. | ||||||
| GRADE Working Group grades of evidence (or certainty in the evidence): High certainty: we are very confident that the true effect lies close to that of the estimate effect. Moderate certainty: we are moderately confident in the effect estimate: the true effect is likely to be close to the estimate of the effect but there is a possibility that it is substantially different. Low certainty: our confidence in the effect estimate in limited: the true effect may be substantially different from the estimate of the effect. Very low certainty: we have little confidence in the effect estimate: the true effect is likely to be substantially different from the estimate of effect. | ||||||
| aDowngraded one level for imprecision due to wide credible intervals of network estimates. | ||||||
| Patient or population: adults with malignant pleural effusion Interventions: talc poudrage, bleomycin, IPC – not daily drainage, doxycycline, placebo Comparator (reference): talc slurry Outcome: postintervention patient‐reported control of breathlessness? Setting: inpatient and outpatient Data: based on direct meta‐analysis of 100‐mm VAS breathless score | |||||
| Intervention Total studies: 4* Total participants: 379 | Relative effect mean difference** (95% CI)*** | Anticipated absolute effect**** Change from baseline VAS score in mm (mean (95% CI)) | Certainty of evidence | Interpretation of findings | |
| With talc slurry | With intervention | ||||
| Talc slurry (2 RCTs, 248 participants) | Reference comparator | –26.29 (–35.26 to –17.34) | Not estimable | Moderatea | Reference comparator |
| Talc poudrage (1 RCT, 184 participants) 90‐day VAS score | 4.00 (–6.26 to 14.26) | –26.29 (–35.26 to –17.34) | –22.29 (–39.93 to –8.70) | Moderatea | Probably comparable |
| Bleomycin (1 RCT, 35 participants) | 1 study assessed breathlessness by functional class score (numerical scale 1–4, where 1 = none and 4 = breathless at rest) and found no difference between talc slurry and bleomycin (Zimmer 1997). | Very lowc,d,e | Uncertain | ||
| IPC –not daily drainage (2 RCTs, 160 participants) VAS scores at 42 days and 180 days | –6.12 (–16.32 to 4.08) | –26.29 (–35.26 to –17.34) | –32.41 (–45.98 to –18.86) | Lowa,b | May be comparable |
| Doxycycline | There was no direct evidence comparing talc slurry and doxycycline | — | — | ||
| Placebo | There were no data reported on breathlessness improvement in people receiving placebo | — | — | ||
| Direct meta‐analysis summary of findings definitions: *Information is included from direct meta‐analysis of studies using a 100‐mm VAS breathlessness scale. **The minimum clinically important difference for dyspnoea in malignant pleural effusion using the VAS breathlessness scale was 19 mm (95% CI 14 to 24) (Mishra 2015). ***Direct meta‐analysis results are reported as standardised mean difference. ****Anticipated absolute effect: compares two risks by calculating the difference between the risk of the intervention group with the risk of the control group. 'Absolute effect' and 'difference' estimates are posterior medians from a Bayesian statistical analysis. These may not sum exactly, due to skew in the posterior distributions. ^Reference comparator absolute event rate estimates are based on a random‐effects meta‐analysis of arm‐level data from all trials including a talc slurry arm and reporting the relevant outcome. CI: confidence interval; IPC: indwelling pleural catheter; OR: odds ratio; RCT: randomised controlled trial; VAS: visual analogue scale. | |||||
| GRADE Working Group grades of evidence (or certainty in the evidence): High certainty: we are very confident that the true effect lies close to that of the estimate effect. Moderate certainty: we are moderately confident in the effect estimate: the true effect is likely to be close to the estimate of the effect but there is a possibility that it is substantially different. Low certainty: our confidence in the effect estimate in limited: the true effect may be substantially different from the estimate of the effect. Very low certainty: we have little confidence in the effect estimate: the true effect is likely to be substantially different from the estimate of effect. | |||||
| aDowngraded one level for study limitations: lack of blinding of participants and clinicians (due to nature of trial interventions) leading to increased risk of bias in VAS score reporting. | |||||
| Patient or population: adults with malignant pleural effusion Interventions: talc poudrage, bleomycin IPC – not daily drainage, doxycycline, placebo Comparator (reference): talc slurry Outcome: mortality Setting: inpatient and outpatient Data: based on network meta‐analysis of eligible studies | ||||||
| Total studies: 31* Total participants: 2816 No. interventions in network: 15 | Relative effect** Odds ratio (95% Cr‐I) Network estimate | Anticipated absolute effect (95% Cr‐I)*** | Certainty of evidence | Interpretation of findings | ||
| With talc slurry^ | With intervention | Difference | ||||
| Talc slurry (13 RCTs, 1574 participants) Follow‐up: up to 12 months | Reference comparator | 31 deaths out of every 100 participants (14 to 55) | Not estimable | Not estimable | Lowa,b | Reference comparator |
| Talc poudrage (7 RCTs, 878 participants) Follow‐up: up to 10 months | 0.87 (0.53 to 1.43) | 31 deaths out of every 100 participants (14 to 55) | 28 deaths out of every 100 participants (11 to 55) | –3 (–12 to 8) i.e. 3 fewer deaths per 100 participants | Very lowa,b,c | May be comparable but evidence uncertain |
| Bleomycin (9 RCTs, 664 participants) Follow‐up: up to 9 months | 1.03 (0.45 to 2.41) | 31 deaths out of every 100 participants (14 to 55) | 32 deaths out of every 100 participants (11 to 63) | 1 (–15 to 21) i.e. 1 additional death per 100 participants | Lowa,b | May be comparable |
| IPC – not daily drainage 6 RCTs, 587 participants Follow‐up: up to 12 months | 0.80 (0.47 to 1.40) | 31 deaths out of every 100 participants (14 to 55) | 26 deaths out of every 100 participants (10 to 53) | –4 (–14 to 7) i.e. 4 fewer deaths per 100 participants | Lowa,b | May be comparable |
| Doxycycline (1 RCT, 80 participants) Follow‐up 30 days | 0.70 (0.16 to 3.00) | 31 deaths out of every 100 participants (14 to 55) | 24 deaths out of every 100 participants (5 to 64) | –6 (–28 to 25) i.e. 6 fewer deaths per 100 participants | Very lowa,b,d | May be comparable but evidence uncertain |
| Placebo | No studies reported mortality data for participants receiving placebo | — | — | |||
| Network meta‐analysis summary of findings definitions: *Information is reported from studies included in the network meta‐analysis for mortality. **Network meta‐analysis estimates are reported as ORs. ***Anticipated absolute effect: compares two risks by calculating the difference between the risk of the intervention group with the risk of the control group. 'Absolute effect' and 'difference' estimates are posterior medians from a Bayesian statistical analysis. These may not sum exactly, due to skew in the posterior distributions. ^Reference comparator absolute event rate estimates are based on a random‐effects meta‐analysis of arm‐level data from all trials including a talc slurry arm and reporting the relevant outcome. Cr‐Is around 'differences' allow for sampling uncertainty in this baseline parameter, as well as uncertainty in the OR Cr‐I: credible interval; IPC: indwelling pleural catheter; OR: odds ratio; RCT: randomised controlled trial. | ||||||
| GRADE Working Group grades of evidence (or certainty in the evidence): High certainty: we are very confident that the true effect lies close to that of the estimate effect. Moderate certainty: we are moderately confident in the effect estimate: the true effect is likely to be close to the estimate of the effect but there is a possibility that it is substantially different. Low certainty: our confidence in the effect estimate in limited: the true effect may be substantially different from the estimate of the effect. Very low certainty: we have little confidence in the effect estimate: the true effect is likely to be substantially different from the estimate of effect. | ||||||
| aDowngraded one level for imprecision due to wide credible intervals of all network estimates. In the talc poudrage to talc slurry comparison 3/7 RCTs included only people with breast cancer. | ||||||
| Patient or population: adults with malignant pleural effusion Interventions: talc poudrage, bleomycin, IPC – not daily drainage, doxycycline, placebo Comparator (reference): talc slurry Outcome: patient acceptability (need for repeat invasive pleural intervention) Setting: inpatient and outpatient Data: based on available direct evidence* | ||||||
| Intervention Total studies: 9 Total participants: 883 | Relative effect** Odds ratio (95% CI) | Anticipated absolute effect (95% CI)*** | Certainty of evidence | Interpretation of findings | ||
| With talc slurry^ | With intervention | Difference | ||||
| Talc slurry (8 RCTs, 850 participants) Follow‐up: 12 months | Reference comparator | 20 out of every 100 participants requiring repeat invasive interventions (16 to 24) | Not estimable | Not estimable | Moderatea,b | Reference comparator |
| Talc poudrage (2 RCTs, 380 participants) Follow‐up: 6 months | 0.96 (0.59 to 1.56) | 20 out of every 100 participants requiring repeat invasive interventions (16 to 24) | 19 out of every 100 participants (11 to 30) | –1 out of every 100 participants (–7 to +8) i.e. 1 less per 100 participants | Moderateb,c | Probably comparable |
| Bleomycin (1 RCT, 33 participants) Follow‐up to 8 months | 4.33 (0.16 to 114.58) | 20 out of every 100 participants requiring repeat invasive interventions (16 to 24) | 52 out of every 100 participants (4 to 97) | +32 out of every 100 participants (–16 to 77) i.e. 32 more repeat procedures required per 100 participants | Very lowd,e | May be inferior but the evidence is uncertain |
| IPC –not daily drainage (3 RCTs, 343 participants) Follow‐up: 12 months | 0.25 (0.13 to 0.48) | 20 out of every 100 participants requiring repeat invasive interventions (16 to 24) | 6 out of every 100 participants (3 to 11) | –14 out of every 100 participants (–19 to –8) i.e. 14 less per 100 participants | Moderatea,b | Probably superior |
| Doxycycline | There were no direct data comparing doxycycline and talc slurry. | — | — | |||
| Placebo | There were no direct data comparing placebo and talc slurry. | — | — | |||
| Direct meta‐analysis summary of findings definitions: *Based on direct meta‐analysis. **Estimates are reported as ORs. ***Anticipated absolute effect: compares two risks by calculating the difference between the risk of the intervention group with the risk of the control group. 'Absolute effect' and 'difference' estimates are posterior medians from a Bayesian statistical analysis. These may not sum exactly, due to skew in the posterior distributions. ^Reference comparator absolute event rate estimates are based on a random‐effects meta‐analysis of arm‐level data from all trials including a talc slurry arm and reporting the relevant outcome. CI: confidence interval; IPC: indwelling pleural catheter; OR: odds ratio; RCT: randomised controlled trial. | ||||||
| GRADE Working Group grades of evidence (or certainty in the evidence): High certainty: we are very confident that the true effect lies close to that of the estimate effect. Moderate certainty: we are moderately confident in the effect estimate: the true effect is likely to be close to the estimate of the effect but there is a possibility that it is substantially different. Low certainty: our confidence in the effect estimate in limited: the true effect may be substantially different from the estimate of the effect. Very low certainty: we have little confidence in the effect estimate: the true effect is likely to be substantially different from the estimate of effect. | ||||||
| aDowngraded one level: evidence of indirectness: people with trapped lung excluded by Thomas 2017, but not Boshuizen 2017 or Davies 2012. | ||||||
| Adriamycin | Autologous blood | Bleomycin | C parvum | Doxycycline | IFN | IPC – daily drainage | IPC – not daily drainage | Iodine | Mepacrine | Mitoxantrone | Mustine | Placebo | Silver nitrate | TMP | Talc poudrage | Talc slurry | Talc via IPC | Tetracycline | |
| Autologous blood | NA | NA | NA | NA | NA | NA | NA | NA | NA | NA | NA | NA | NA | NA | NA | NA | / | NA | / |
| Bleomycin | NA | NA | NA | / | / | / | NA | NA | / | / | / | NA | NA | NA | NA | / | / | NA | / |
| C parvum | NA | NA | 0.55 (0.01 to 57.48); n = 2; Tau2 = 10.59; I2 = 94% | NA | / | NA | NA | NA | NA | NA | NA | / | NA | NA | NA | NA | NA | NA | / |
| Doxycycline | NA | NA | 0.67 (0.24 to 1.86); n = 2; Tau2 = 0; I2 = 0% | 1.91 (0.43 to 8.48); n = 1 | NA | NA | NA | / | NA | NA | NA | NA | NA | NA | NA | / | NA | NA | NA |
| IFN | NA | NA | 3.25 (1.54 to 6.89); n = 1 | NA | NA | NA | NA | NA | NA | NA | NA | NA | NA | NA | NA | NA | NA | NA | NA |
| IPC – daily drainage | NA | NA | NA | NA | NA | NA | NA | / | NA | NA | NA | NA | NA | NA | NA | NA | / | NA | NA |
| IPC – not daily drainage | NA | NA | NA | NA | 4.28 (1.59 to 11.54); n = 1 | NA | 3.23 (1.79 to 5.85); n = 2; Tau2 = 0; I2 = 0% | NA | NA | NA | NA | NA | NA | NA | NA | NA | / | / | NA |
| Iodine | NA | NA | 0.65 (0.22 to 1.96); n = 2; Tau2 = 0.16; I2 = 25% | NA | NA | NA | NA | NA | NA | NA | NA | NA | NA | NA | NA | / | / | NA | NA |
| Mepacrine | NA | NA | 0.16 (0.03 to 0.89); n = 1 | NA | NA | NA | NA | NA | NA | NA | / | NA | / | NA | NA | NA | / | NA | / |
| Mistletoe (viscum) | NA | NA | 0.19 (0.02 to 1.62); n = 1 | NA | NA | NA | NA | NA | NA | NA | NA | NA | NA | NA | NA | NA | NA | NA | NA |
| Mitoxantrone | NA | NA | 3.18 (1.17 to 8.65); n = 1 | NA | NA | NA | NA | NA | NA | 7.61 (0.35to 163.82); n = 1 | NA | NA | / | NA | NA | NA | NA | NA | NA |
| Mustine | 2.71 (0.1 to 74.98); n = 1 | NA | NA | 10.80 (1.64 to 70.93); n = 1 | NA | NA | NA | NA | NA | NA | NA | NA | NA | NA | NA | / | NA | NA | / |
| Placebo | NA | NA | NA | NA | NA | NA | NA | NA | NA | 14.4 (1.37 to 150.81); n = 1 | 1.33 (0.56 to 3.17); n = 1 | NA | NA | NA | NA | NA | / | NA | / |
| Silver nitrate | NA | NA | NA | NA | NA | NA | NA | NA | NA | NA | NA | NA | NA | NA | NA | NA | / | NA | / |
| TMP | NA | NA | NA | NA | NA | NA | NA | NA | NA | NA | NA | NA | NA | NA | NA | NA | / | NA | NA |
| Talc poudrage | NA | NA | 0.1 (0.02 to 0.48); n = 2; Tau2 = 0; I2 = 0 | NA | 0.02 (0.00 to 0.47); n = 1 | NA | NA | NA | 0.57 (0.08 to 3.80); n = 1 | NA | NA | 0.13 (0.02 to 0.71); n = 1 | NA | NA | NA | NA | / | NA | / |
| Talc slurry | NA | 0.69 (0.24 to 1.95); n = 1 | 0.82 (0.37 to 1.82); n = 5; Tau2 = 0.1; I2 = 12% | NA | NA | NA | 0.30 (0.08 to 1.14); n = 1 | 0.18 (0.07 to 0.45); n = 2; Tau2 = 0.26; I2 = 61% | 0.85 (0.24 to 3.08); n = 2; Tau2 = 0; I2 = 0% | 0.48 (0.14 to 1.60); n = 1 | NA | NA | 0.07 (0.00 to 1.51); n = 1 | 5.82 (0.21 to 158.82); n = 1 | 2.28 (0.83 to 6.23); n = 2; Tau2 = 0; I2 = 0% | 1.24 (0.92 to 1.65); n = 4; Tau = 0; I22 = 0% | NA | NA | / |
| Talc via IPC | NA | NA | NA | NA | NA | NA | NA | 0.36 (0.18 to 0.73); n = 1 | NA | NA | NA | NA | NA | NA | NA | NA | NA | NA | NA |
| Tetracycline | 0.90 (0.05 to 16.59); n = 1 | 0.71 (0.14 to 3.60); n = 1 | 2.00 (1.07 to 3.75); n = 5; Tau2 = 0; I2 = 0% | 3.18 (0.52 to 19.64); n = 1 | NA | NA | NA | NA | NA | 1.60 (0.12 to 20.99); n = 1 | NA | 0.37 (0.10 to 1.35); n = 2; Tau2 = 0; I2 = 0% | 0.30 (0.05 to 1.94); n = 1 | 0.60 (0.15 to 2.47); n = 1 | NA | 12.10 (1.32 to 111.30); n = 1 | 0.78 (0.19 to 3.13); n = 1 | NA | NA |
| Triethylenethiophosphoramide | NA | NA | NA | NA | NA | NA | NA | NA | NA | 4.95 (1.02 to 24.10); n = 1 | NA | NA | 0.34 (0.03 to 3.69); n = 1 | NA | NA | NA | NA | NA | NA |
| * Indicates that the comparison included a three‐arm study. Results that are significant at the conventional level of P ≤ 0.05 are in bold. / indicates the odds ratio is already expressed elsewhere in the table comparing the interventions the other way around. | |||||||||||||||||||
| IFN: interferon; IPC: indwelling pleural catheter; n: number of studies included in the pair‐wise comparison; NA: no direct pair‐wise comparison available; TMP: thoracoscopic mechanical pleurodesis. | |||||||||||||||||||
| Adriamycin | Autologous blood | Bleomycin | C parvum | Doxycycline | IFN | IPC – daily drainage | IPC – not daily drainage | Iodine | Mepacrine | Mistletoe (viscum) | Mitoxantrone | Mustine | Placebo | Silver nitrate | TMP | Talc poudrage | Talc slurry | Talc via IPC | Tetracycline | |
| Autologous blood | 1.16 (0.02 to 101.8) | NA | / | / | / | / | / | / | / | / | / | / | / | / | / | / | / | / | / | / |
| Bleomycin | 1.17 (0.02 to 83.72) | 1.02 (0.22 to 4.72) | NA | / | / | / | / | / | / | / | / | / | / | / | / | / | / | / | / | / |
| C parvum | 0.65 (0.01 to 49.54) | 0.56 (0.09 to 3.38) | 0.56 (0.18 to 1.60) | NA | / | / | / | / | / | / | / | / | / | / | / | / | / | / | / | / |
| Doxycycline | 1.32 (0.02 to 107.3) | 1.14 (0.19 to 7.07) | 1.12 (0.37 to 3.51) | 2.02 (0.53 to 8.43) | NA | / | / | / | / | / | / | / | / | / | / | / | / | / | / | / |
| IFN | 3.93 (0.05 to 379) | 3.39 (0.35 to 33.19) | 3.34 (0.63 to 18.08) | 6 (0.85 to 45.87) | 2.98 (0.39 to 22.38) | NA | / | / | / | / | / | / | / | / | / | / | / | / | / | / |
| IPC – daily drainage | 1.25 (0.02 to 111.4) | 1.10 (0.16 to 7.49) | 1.08 (0.26 to 4.46) | 1.94 (0.36 to 11.11) | 0.96 (0.20 to 4.53) | 0.32 (0.04 to 2.90) | NA | / | / | / | / | / | / | / | / | / | / | / | / | / |
| IPC – not daily drainage | 3.93 (0.06 to 325.5) | 3.43 (0.60 to 19.68) | 3.39 (1.10 to 10.68) | 6.09 (1.44 to 27.74) | 3.02 (0.85 to 10.54) | 1.01 (0.13 to 7.78) | 3.14 (1.07 to 9.35) | NA | / | / | / | / | / | / | / | / | / | / | / | / |
| Iodine | 0.63 (0.01 to 49.04) | 0.55 (0.09 to 3.16) | 0.54 (0.18 to 1.54) | 0.98 (0.22 to 4.29) | 0.48 (0.11 to 2.05) | 0.16 (0.02 to 1.15) | 0.50 (0.09 to 2.53) | 0.16 (0.04 to 0.65) | NA | / | / | / | / | / | / | / | / | / | / | / |
| Mepacrine | 0.48 (0.01 to 38.24) | 0.41 (0.06 to 2.59) | 0.41 (0.11 to 1.37) | 0.73 (0.14 to 3.64) | 0.36 (0.07 to 1.74) | 0.12 (0.01 to 0.94) | 0.38 (0.06 to 2.13) | 0.12 (0.02 to 0.55) | 0.75 (0.15 to 3.54) | NA | / | / | / | / | / | / | / | / | / | / |
| Mistletoe (viscum) | 0.18 (0.001 to 26.42) | 0.15 (0.006 to 3.25) | 0.15 (0.008 to 2.15) | 0.27 (0.01 to 4.85) | 0.14 (0.006 to 2.39) | 0.05 (0.002 to 1.03) | 0.14 (0.005 to 2.82) | 0.05 (0.002 to 0.8) | 0.28 (0.01 to 4.96) | 0.38 (0.02 to 7.19) | NA | / | / | / | / | / | / | / | / | / |
| Mitoxantrone | 5.62 (0.08 to 485.4) | 4.77 (0.65 to 38.43) | 4.7 (1.21 to 20.78) | 8.5 (1.58 to 53.76) | 4.22 (0.73 to 25.95) | 1.4 (0.17 to 13.52) | 4.38 (0.64 to 32.63) | 1.39 (0.25 to 8.62) | 8.71 (1.62 to 54.36) | 11.54 (2.37 to 70.61) | 31.44 (1.59 to 841.9) | NA | / | / | / | / | / | / | / | / |
| Mustine | 3.41 (0.06 to 246.5) | 2.96 (0.40 to 21.37) | 2.92 (0.70 to 12.46) | 5.26 (1.14 to 25.88) | 2.6 (0.46 to 14.5) | 0.88 (0.09 to 7.84) | 2.72 (0.39 to 18.45) | 0.86 (0.15 to 4.86) | 5.41 (0.98 to 30.75) | 7.2 (1.2 to 46.5) | 19.36 (0.93 to 502.7) | 0.62 (0.08 to 4.26) | NA | / | / | / | / | / | / | / |
| Placebo | 8.53 (0.13 to 713.2) | 7.21 (0.99 to 57.97) | 7.09 (1.74 to 33.09) | 12.82 (2.33 to 82.88) | 6.33 (1.09 to 40.23) | 2.12 (0.24 to 21) | 6.58 (0.98 to 49.75) | 2.09 (0.38 to 13.13) | 13.15 (2.39 to 83.82) | 17.44 (3.70 to 101.1) | 47.4 (2.32 to 1298) | 1.51 (0.37 to 6.14) | 2.43 (0.35 to 18.64) | NA | / | / | / | / | / | / |
| Silver nitrate | 1.28 (0.02 to 123.1) | 1.10 (0.09 to 11.67) | 1.08 (0.13 to 8.03) | 1.96 (0.20 to 17.79) | 0.96 (0.09 to 9.07) | 0.33 (0.02 to 4.24) | 1.0 (0.08 to 10.47) | 0.32 (0.03 to 2.9) | 1.999 (0.2 to 18.56) | 2.67 (0.26 to 26.41) | 7.21 (0.24 to 243.8) | 0.23 (0.02 to 2.44) | 0.37 (0.03 to 3.75) | 0.15 (0.01 to 1.59) | NA | / | / | / | / | / |
| TMP | 0.22 (0.003 to 21.16) | 0.19 (0.02 to 1.61) | 0.19 (0.03 to 1.04) | 0.34 (0.05 to 2.47) | 0.17 (0.02 to 1.15) | 0.06 (0.005 to 0.61) | 0.17 (0.02 to 1.26) | 0.06 (0.008 to 0.34) | 0.35 (0.05 to 2.34) | 0.46 (0.06 to 3.52) | 1.23 (0.05 to 36.67) | 0.04 (0.004 to 0.33) | 0.06 (0.007 to 0.55) | 0.03 (0.003 to 0.22) | 0.17 (0.01 to 2.46) | NA | / | / | / | / |
| Talc poudrage | 0.26 (0.004 to 18.64) | 0.23 (0.04 to 1.05) | 0.22 (0.08 to 0.50) | 0.4 (0.10 to 1.41) | 0.2 (0.05 to 0.64) | 0.07 (0.009 to 0.40) | 0.21 (0.04 to 0.82) | 0.07 (0.02 to 0.20) | 0.41 (0.12 to 1.29) | 0.55 (0.13 to 2.18) | 1.45 (0.09 to 30.25) | 0.05 (0.008 to 0.21) | 0.08 (0.02 to 0.31) | 0.03 (0.01 to 0.14) | 0.2 (0.03 to 1.7) | 1.19 (0.19 to 6.77) | NA | / | / | / |
| Talc slurry | 0.52 (0.01 to 38.37) | 0.45 (0.10 to 1.93) | 0.45 (0.21 to 0.91) | 0.8 (0.24 to 2.76) | 0.4 (0.12 to 1.24) | 0.13 (0.02 to 0.81) | 0.41 (0.12 to 1.43) | 0.13 (0.05 to 0.34) | 0.82 (0.28 to 2.47) | 1.1 (0.32 to 4.02) | 2.93 (0.19 to 60) | 0.10 (0.02 to 0.41) | 0.15 (0.03 to 0.66) | 0.06 (0.01 to 0.27) | 0.41 (0.05 to 3.43) | 2.38 (0.5 to 11.99) | 2.00 (0.98 to 4.79) | NA | / | / |
| Talc via IPC | 1.41 (0.02 to 153.1) | 1.22 (0.11 to 13.48) | 1.2 (0.16 to 9.03) | 2.17 (0.25 to 20.7) | 1.08 (0.13 to 8.46) | 0.36 (0.03 to 4.94) | 1.12 (0.16 to 8.14) | 0.36 (0.07 to 1.85) | 2.22 (0.26 to 20.4) | 2.96 (0.32 to 30.36) | 7.996 (0.29 to 276.8) | 0.26 (0.02 to 2.74) | 0.41 (0.04 to 4.61) | 0.17 (0.01 to 1.81) | 1.1 (0.07 to 20.18) | 6.47 (0.56 to 79.51) | 5.39 (0.77 to 46.87) | 2.7 (0.41 to 18.65) | NA | / |
| Tetracycline | 1.52 (0.03 to 100.3) | 1.32 (0.28 to 5.82) | 1.3 (0.60 to 2.73) | 2.34 (0.72 to 7.62) | 1.16 (0.31 to 4.01) | 0.39 (0.06 to 2.36) | 1.20 (0.26 to 5.33) | 0.38 (0.1 to 1.31) | 2.4 (0.7 to 8.26) | 3.19 (0.86 to 12.47) | 8.54 (0.54 to 176.8) | 0.28 (0.06 to 1.18) | 0.45 (0.11 to 1.73) | 0.18 (0.04 to 0.76) | 1.2 (0.18 to 8.71) | 6.95 (1.15 to 43.49) | 5.85 (2.28 to 16.87) | 2.91 (1.2 to 7.01) | 1.08 (0.13 to 8.3) | NA |
| Triethylenethiophosphoramide | 2.63 (0.03 to 310.8) | 2.23 (0.15 to 34.02) | 2.21 (0.22 to 23.08) | 3.98 (0.32 to 52.04) | 1.96 (0.15 to 25.22) | 0.66 (0.04 to 11.71) | 2.05 (0.15 to 28.96) | 0.65 (0.05 to 8.08) | 4.08 (0.34 to 52.3) | 5.41 (0.69 to 47.85) | 14.73 (0.42 to 634.9) | 0.47 (0.04 to 5.52) | 0.75 (0.05 to 11.16) | 0.31 (0.03 to 3.16) | 2.04 (0.1 to 45.98) | 11.87 (0.71 to 208.7) | 9.95 (0.95 to 121.2) | 4.95 (0.49 to 52.69) | 1.83 (0.09 to 36.76) | 1.7 (0.16 to 18.73) |
| Results that are significant at the conventional level of P < 0.05 are in bold. / indicates the odds ratio is already expressed elsewhere in the table comparing the interventions the other way around. | ||||||||||||||||||||
| IFN: interferon; IPC: indwelling pleural catheter; NA: not applicable; TMP: thoracoscopic mechanical pleurodesis. | ||||||||||||||||||||
| Study | Reason study excluded from network | Intrapleural agent or intervention 1 | Pleurodesis failure rate for agent 1 | Intrapleural agent or intervention 2 | Pleurodesis failure rate for agent 2 | OR (95% CI) of agent 1 compared with agent 2*** |
| Lung cancer‐specific therapy | Cisplatin and bevacizumab | 6/36 | Cisplatin | 17/34 | 0.20 (0.07 to 0.60) | |
| No pleurodesis failures in the combined group | Tetracycline** | 3/19 | Combined tetracycline and bleomycin | 0/19 | 8.27 (0.40 to 172.05) | |
| Bleomycin** | 2/19 | Combined tetracycline and bleomycin | 0/19 | 5.57 (0.25 to 124.19) | ||
| Lung cancer‐specific therapy | OK‐432 | 8/17 | Cisplatin | 11/17 | 0.48 (0.12 to 1.92) | |
| OK‐432 | 8/17 | OK‐432 and cisplatin | 1/15 | 12.44 (1.32 to 117.03) | ||
| Cisplatin | 11/17 | OK‐432 and cisplatin | 1/15 | 25.67 (2.68 to 245.84) | ||
| Lung cancer‐specific therapy | High‐dose OK‐432 | 5/19 | Low‐dose OK‐432 | 3/19 | 1.90 (0.38 to 9.44) | |
| Lung cancer‐specific therapy | OK‐432 | 3/26 | Mitomycin C | 9/27 | 0.26 (0.06 to 1.11) | |
| Two talc slurry preparations | Mixed‐particle talc | 3/14 | Graded talc (particles > 20 µm) | 2/14 | 1.64 (0.23 to 11.70) | |
| Lung cancer‐specific therapy | LC9018 and adriamycin | 10/38 | Adriamycin | 23/38 | 0.23 (0.09 to 0.62) | |
| Comparison of different doses of iodine | 1% iodine | 1/30 | 2% iodine | 1/30 | 1.00 (0.06 to 16.76) | |
| MPM specific surgical technique | Talc pleurodesis (slurry or poudrage) | 25/62 | VATS pleurectomy | 24/60 | 0.88 (0.43 to 1.82) | |
| Comparison of different doses of silver nitrate | 90 mg silver nitrate | 0/20 | 150 mg silver nitrate | 0/20 | Not estimable | |
| 90 mg silver nitrate | 0/20 | 180 mg silver nitrate | 2/20 | 0.18 (0.01 to 4.01) | ||
| 150 mg silver nitrate | 0/20 | 180 mg silver nitrate | 2/20 | 0.19 (0.01 to 4.01) | ||
| Lung cancer‐specific therapy | Cisplatin + 45 mg endostatin | 14/66 | Cisplatin | 24/62 | 0.43 (0.2 to 0.93) | |
| Lung cancer‐specific therapy | OK‐432 | 8/33 | Bleomycin | 11/35 | 0.70 (0.24 to 2.03) | |
| OK‐432 | 8/33 | Cisplatin and etoposide | 10/34 | 0.77 (0.26 to 2.27) | ||
| Bleomycin | 11/35 | Cisplatin and etoposide | 10/34 | 1.10 (0.39 to 3.07) | ||
| Lung cancer specific therapy | rAd‐p53 and cisplatin | 3/17 | Cisplatin | 9/18 | 0.21 (0.05 to 1.01) | |
| *Three‐arm study. **The results for the pair‐wise comparison between tetracycline and bleomycin are included in the network meta‐analysis. ***Results that are significant at the conventional level of P ≤ 0.05 are in bold. | ||||||
| CI: confidence interval; IPC: indwelling pleural catheter; MPM: malignant pleural mesothelioma; OR: odds ratio; VATS: video‐assisted thoracoscopic surgery. | ||||||
| Type of method to optimise pleurodesis | Study | Intervention 1 | Pleurodesis failure rate for intervention 1 | Intervention 2 | Pleurodesis failure rate for intervention 2 | OR (95% CI) of intervention 1 compared with intervention 2* |
| Mode of administration | Tetracycline pleurodesis at the end of thoracoscopy | 2/15 | Tetracycline pleurodesis through an intercostal cannula | 5/14 | 0.28 (0.04 to 1.76) | |
| Chest tube size | Small‐bore chest drain | 2/9 | Large‐bore chest drain | 3/9 | 0.57 (0.07 to 4.64) | |
| Small‐bore chest drain | 15/50 | Large‐bore chest drain | 12/50 | 1.36 (0.56 to 3.30) | ||
| Type of analgesic agent | NSAID | 33/144 | Opiate | 30/150 | 1.19 (0.68 to 2.08) | |
| Patient rotation | Rotation after instillation of talc | 2/10 | No rotation after instillation of talc | 1/10 | 2.25 (0.17 to 29.77) | |
| Duration of drainage after administration of the sclerosant | Drain removed 24 hours after pleurodesis | 2/16 | Drain removed 72 hours after pleurodesis | 4/19 | 0.54 (0.08 to 3.40) | |
| Drain removal the day after pleurodesis | 2/9 | Drain removal when < 150 mL/day output | 3/15 | 1.14 (0.15 to 8.59) | ||
| Fractionated dose oxytetracycline (4 divided doses at 6‐hourly intervals) | 0/12 | Single bedside instillation of oxytetracycline | 2/8 | 0.10 (0.00 to 2.50) | ||
| Duration of drainage prior to administration of the sclerosant | Early instillation of talc slurry after drain insertion | 5/40 | Instillation of talc slurry when daily drainage from chest tube < 300 mL/day | 6/39 | 0.79 (0.22 to 2.82) | |
| Intrapleural fibrinolytics | Intrapleural streptokinase | 5/19 | No intrapleural streptokinase | 7/16 | 0.46 (0.11 to 1.90) | |
| Intrapleural streptokinase | 2/18 | 50 mL saline placebo | 5/11 | 0.15 (0.02 to 0.99) | ||
| Intrapleural urokinase | 13/35 | Placebo | 11/34 | 1.24 (0.46 to 3.34) | ||
| *Results that are significant at the conventional level of P ≤ 0.05 are in bold. **Studies with more than 2 comparison arms. | ||||||
| CI: confidence interval; NSAID: non‐steroidal anti‐inflammatory drug; OR: odds ratio. | ||||||
| Autologous blood | Bleomycin | C parvum | Doxycycline | IPC – not daily drainage | Iodine | Mepacrine | Mitoxantrone | Placebo | Silver nitrate | Talc poudrage | Talc slurry | Tetracycline | |
| Bleomycin | 11.53 (0.70 to 205.20) | NA | / | / | / | / | / | / | / | / | / | / | / |
| C parvum | 67.29 (2.44 to 2021) | 5.82 (0.82 to 41.96) | NA | / | / | / | / | / | / | / | / | / | / |
| Doxycycline | 4.21 (0.11 to 157) | 0.37 (0.03 to 3.49) | 0.063 (0.005 to 0.73) | NA | / | / | / | / | / | / | / | / | / |
| IPC – not daily drainage | 2.01 (0.01 to 401.30) | 0.17 (0.002 to 15.18) | 0.03 (0.00 to 2.93) | 0.48 (0.01 to 23.3) | NA | / | / | / | / | / | / | / | / |
| Iodine | 3.67 (0.14 to 101.60) | 0.32 (0.03 to 3.09) | 0.05 (0.003 to 1.05) | 0.87 (0.03 to 22.91) | 1.82 (0.01 to 281.7) | NA | / | / | / | / | / | / | / |
| Mepacrine | 53.76 (1.45 to 2277) | 4.65 (0.38 to 62.22) | 0.80 (0.04 to 19.28) | 12.72 (0.45 to 422.1) | 26.79 (0.16 to 4813) | 14.68 (0.52 to 452.2) | NA | / | / | / | / | / | / |
| Mitoxantrone | 3.90 (0.05 to 251.30) | 0.34 (0.01 to 7.14) | 0.06 (0.001 to 2.12) | 0.92 (0.02 to 43.82) | 1.91 (0.01 to 434.1) | 1.06 (0.02 to 47.81) | 0.07 (0.002 to 2.53) | NA | / | / | / | / | / |
| Placebo | 0.46 (0.003 to 46.52) | 0.04 (0.00 to 1.55) | 0.01 (0.00 to 0.42) | 0.12 (0.001 to 8.56) | 0.23 (0.001 to 73.08) | 0.13 (0.001 to 9.2) | 0.01 (0.00 to 0.34) | 0.12 (0.01 to 2.35) | NA | / | / | / | / |
| Silver nitrate | 0.28 (0.006 to 11.75) | 0.02 (0.001 to 0.47) | 0.00 (0.00 to 0.13) | 0.07 (0.002 to 2.85) | 0.14 (0.001 to 28.98) | 0.08 (0.002 to 2.27) | 0.01 (0.00 to 0.22) | 0.07 (0.00 to 5.58) | 0.62 (0.01 to 93.78) | NA | / | / | / |
| Talc poudrage | 4.41 (0.16 to 120.20) | 0.38 (0.04 to 3.72) | 0.07 (0.003 to 1.25) | 1.04 (0.04 to 27.59) | 2.18 (0.01 to 330.6) | 1.19 (0.10 to 14.14) | 0.08 (0.003 to 2.28) | 1.13 (0.02 to 58.56) | 9.57 (0.13 to 1083) | 15.42 (0.52 to 519.40) | NA | / | / |
| Talc slurry | 4.93 (0.34 to 74.37) | 0.43 (0.08 to 2.22) | 0.07 (0.01 to 0.88) | 1.17 (0.07 to 20.57) | 2.45 (0.02 to 289) | 1.35 (0.17 to 10.59) | 0.09 (0.005 to 1.69) | 1.26 (0.04 to 47.32) | 10.65 (0.20 to 931) | 17.33 (1.07 to 336.40) | 1.12 (0.15 to 9.12) | NA | / |
| Tetracycline | 4.37 (0.29 to 69.73) | 0.38 (0.09 to 1.62) | 0.07 (0.01 to 0.60) | 1.04 (0.08 to 15.55) | 2.16 (0.02 to 234.9) | 1.19 (0.10 to 15.28) | 0.08 (0.01 to 1.08) | 1.12 (0.04 to 37.43) | 9.45 (0.20 to 734.3) | 15.26 (0.88 to 331.70) | 0.1 (0.08 to 13.05) | 0.89 (0.13 to 5.81) | NA |
| Triethylenethiophosphoramide | 2.88 (0.02 to 523.50) | 0.25 (0.003 to 20.37) | 0.04 (0.00 to 5.12) | 0.69 (0.01 to 102.5) | 1.42 (0.003 to 786.5) | 0.78 (0.006 to 110.5) | 0.05 (0.001 to 2.24) | 0.72 (0.01 to 118.3) | 5.84 (0.07 to 1361) | 10.11 (0.06 to 2164) | 0.65 (0.005 to 94.31) | 0.58 (0.01 to 61.79) | 0.66 (0.01 to 58.19) |
| Results that are significant at the conventional level of P ≤ 0.05 are in bold. / indicates the odds ratio is already expressed elsewhere in the table comparing the interventions the other way round. | |||||||||||||
| CI: confidence interval; IPC: indwelling pleural catheter; NA: not applicable. | |||||||||||||
| Outcome or subgroup title | No. of studies | No. of participants | Statistical method | Effect size |
| 1 Pleurodesis failure rate Show forest plot | 22 | Odds Ratio (M‐H, Random, 95% CI) | Subtotals only | |
| 1.1 Bleomycin vs iodine | 2 | 99 | Odds Ratio (M‐H, Random, 95% CI) | 1.54 [0.51, 4.64] |
| 1.2 Bleomycin vs talc slurry | 5 | 199 | Odds Ratio (M‐H, Random, 95% CI) | 1.22 [0.55, 2.70] |
| 1.3 Bleomycin vs tetracycline | 5 | 220 | Odds Ratio (M‐H, Random, 95% CI) | 0.50 [0.27, 0.93] |
| 1.4 Bleomycin vs talc poudrage | 2 | 57 | Odds Ratio (M‐H, Random, 95% CI) | 9.70 [2.10, 44.78] |
| 1.5 Bleomycin vs C parvum | 2 | 78 | Odds Ratio (M‐H, Random, 95% CI) | 1.81 [0.02, 189.25] |
| 1.6 Bleomycin vs doxycycline | 2 | 122 | Odds Ratio (M‐H, Random, 95% CI) | 1.50 [0.54, 4.20] |
| 1.7 Bleomycin vs interferon (IFN) | 1 | 160 | Odds Ratio (M‐H, Random, 95% CI) | 0.31 [0.15, 0.65] |
| 1.8 Bleomycin vs mitoxantrone | 1 | 85 | Odds Ratio (M‐H, Random, 95% CI) | 0.31 [0.12, 0.86] |
| 1.9 Bleomycin vs mepacrine | 1 | 36 | Odds Ratio (M‐H, Random, 95% CI) | 6.40 [1.12, 36.44] |
| 1.10 Bleomycin vs combined tetracycline and bleomycin | 1 | 38 | Odds Ratio (M‐H, Random, 95% CI) | 5.57 [0.25, 124.19] |
| 1.11 Bleomycin vs cisplatin and etoposide | 1 | 69 | Odds Ratio (M‐H, Random, 95% CI) | 1.1 [0.39, 3.07] |
| 1.12 Bleomycin vs OK‐432 | 1 | 68 | Odds Ratio (M‐H, Random, 95% CI) | 1.43 [0.49, 4.17] |
| 1.13 Bleomycin vs viscum | 1 | 17 | Odds Ratio (M‐H, Random, 95% CI) | 5.33 [0.62, 45.99] |
| 2 Fever Show forest plot | 17 | Odds Ratio (M‐H, Random, 95% CI) | Subtotals only | |
| 2.1 Bleomycin vs talc slurry | 3 | 99 | Odds Ratio (M‐H, Random, 95% CI) | 0.90 [0.31, 2.56] |
| 2.2 Bleomycin vs talc poudrage | 1 | 32 | Odds Ratio (M‐H, Random, 95% CI) | 0.87 [0.11, 7.05] |
| 2.3 Bleomycin vs tetracycline | 5 | 250 | Odds Ratio (M‐H, Random, 95% CI) | 2.05 [0.67, 6.34] |
| 2.4 Tetracycline vs C parvum | 2 | 80 | Odds Ratio (M‐H, Random, 95% CI) | 0.43 [0.17, 1.12] |
| 2.5 Bleomycin vs IFN | 1 | 160 | Odds Ratio (M‐H, Random, 95% CI) | 151.35 [9.08, 2522.62] |
| 2.6 Bleomycin vs mitoxantrone | 1 | 96 | Odds Ratio (M‐H, Random, 95% CI) | 1.11 [0.37, 3.36] |
| 2.7 Bleomycin vs mepacrine | 1 | 40 | Odds Ratio (M‐H, Random, 95% CI) | 0.52 [0.14, 1.92] |
| 2.8 Bleomycin vs doxycycline | 2 | 148 | Odds Ratio (M‐H, Random, 95% CI) | 2.69 [0.08, 89.51] |
| 2.9 Bleomycin vs combined tetracycline and bleomycin | 1 | 40 | Odds Ratio (M‐H, Random, 95% CI) | 0.47 [0.04, 5.69] |
| 2.10 Bleomycin vs OK432 | 1 | 67 | Odds Ratio (M‐H, Random, 95% CI) | 0.7 [0.23, 2.13] |
| 2.11 Bleomycin vs cisplatin and etoposide | 1 | 69 | Odds Ratio (M‐H, Random, 95% CI) | 2.22 [0.82, 6.01] |
| 2.12 Bleomycin vs iodine | 1 | 60 | Odds Ratio (M‐H, Random, 95% CI) | 1.0 [0.13, 7.60] |
| 3 Pain Show forest plot | 15 | Odds Ratio (M‐H, Random, 95% CI) | Subtotals only | |
| 3.1 Bleomycin vs talc slurry | 2 | 73 | Odds Ratio (M‐H, Random, 95% CI) | 1.66 [0.41, 6.80] |
| 3.2 Bleomycin vs tetracycline | 4 | 220 | Odds Ratio (M‐H, Random, 95% CI) | 0.61 [0.29, 1.27] |
| 3.3 Bleomycin vs talc poudrage | 1 | 32 | Odds Ratio (M‐H, Random, 95% CI) | 0.28 [0.01, 7.31] |
| 3.4 Bleomycin vs C parvum | 2 | 71 | Odds Ratio (M‐H, Random, 95% CI) | 0.70 [0.27, 1.85] |
| 3.5 Bleomycin vs IFN | 1 | 160 | Odds Ratio (M‐H, Random, 95% CI) | 32.34 [1.89, 552.23] |
| 3.6 Bleomycin vs mitoxantrone | 1 | 96 | Odds Ratio (M‐H, Random, 95% CI) | 0.48 [0.15, 1.56] |
| 3.7 Bleomycin vs mepacrine | 1 | 40 | Odds Ratio (M‐H, Random, 95% CI) | 0.46 [0.11, 1.94] |
| 3.8 Bleomycin vs doxycycline | 2 | 148 | Odds Ratio (M‐H, Random, 95% CI) | 0.84 [0.26, 2.70] |
| 3.9 Bleomycin vs OK‐432 | 1 | 67 | Odds Ratio (M‐H, Random, 95% CI) | 0.40 [0.14, 1.12] |
| 3.10 Bleomycin vs cisplatin and etoposide | 1 | 69 | Odds Ratio (M‐H, Random, 95% CI) | 0.83 [0.32, 2.16] |
| 3.11 Bleomycin vs iodine | 1 | 60 | Odds Ratio (M‐H, Random, 95% CI) | 1.0 [0.13, 7.60] |
| 4 Mortality Show forest plot | 11 | Odds Ratio (M‐H, Random, 95% CI) | Subtotals only | |
| 4.1 Bleomycin vs combined tetracycline and bleomycin | 1 | 40 | Odds Ratio (M‐H, Random, 95% CI) | 1.0 [0.06, 17.18] |
| 4.2 Bleomycin vs talc slurry | 2 | 116 | Odds Ratio (M‐H, Random, 95% CI) | 0.89 [0.29, 2.75] |
| 4.3 Bleomycin vs tetracycline | 2 | 125 | Odds Ratio (M‐H, Random, 95% CI) | 0.63 [0.27, 1.44] |
| 4.4 Bleomycin vs talc poudrage | 1 | 32 | Odds Ratio (M‐H, Random, 95% CI) | 0.82 [0.20, 3.43] |
| 4.5 Bleomycin vs C parvum | 1 | 55 | Odds Ratio (M‐H, Random, 95% CI) | 0.60 [0.19, 1.94] |
| 4.6 Bleomycin vs IFN | 1 | 160 | Odds Ratio (M‐H, Random, 95% CI) | 0.46 [0.25, 0.87] |
| 4.7 Bleomycin vs mitoxantrone | 1 | 96 | Odds Ratio (M‐H, Random, 95% CI) | 2.15 [0.95, 4.86] |
| 4.8 Bleomycin vs OK‐432 | 1 | 68 | Odds Ratio (M‐H, Random, 95% CI) | 2.66 [0.98, 7.23] |
| 4.9 Bleomycin vs doxycycline | 2 | 122 | Odds Ratio (M‐H, Random, 95% CI) | 1.44 [0.53, 3.90] |
| 4.10 Bleomycin vs cisplatin and etoposide | 1 | 69 | Odds Ratio (M‐H, Random, 95% CI) | 2.22 [0.82, 6.01] |
| 5 Repeat pleural intervention Show forest plot | 1 | 33 | Odds Ratio (M‐H, Fixed, 95% CI) | 4.33 [0.16, 114.58] |
| 5.1 Bleomycin vs talc slurry | 1 | 33 | Odds Ratio (M‐H, Fixed, 95% CI) | 4.33 [0.16, 114.58] |
| Outcome or subgroup title | No. of studies | No. of participants | Statistical method | Effect size |
| 1 Pleurodesis failure rate Show forest plot | 20 | Odds Ratio (M‐H, Random, 95% CI) | Subtotals only | |
| 1.1 Talc slurry vs talc poudrage | 4 | 919 | Odds Ratio (M‐H, Random, 95% CI) | 1.24 [0.92, 1.65] |
| 1.2 Talc slurry vs bleomycin | 5 | 199 | Odds Ratio (M‐H, Random, 95% CI) | 0.82 [0.37, 1.82] |
| 1.3 Talc slurry vs indwelling pleural catheter (IPC) – not daily drainage | 2 | 249 | Odds Ratio (M‐H, Random, 95% CI) | 0.18 [0.07, 0.45] |
| 1.4 Talc slurry vs mepacrine | 1 | 89 | Odds Ratio (M‐H, Random, 95% CI) | 0.48 [0.14, 1.60] |
| 1.5 Talc slurry vs placebo | 1 | 21 | Odds Ratio (M‐H, Random, 95% CI) | 0.07 [0.00, 1.51] |
| 1.6 Talc slurry vs iodine | 2 | 75 | Odds Ratio (M‐H, Random, 95% CI) | 0.85 [0.24, 3.08] |
| 1.7 Talc slurry vs tetracycline | 1 | 32 | Odds Ratio (M‐H, Random, 95% CI) | 1.29 [0.32, 5.17] |
| 1.8 Talc slurry vs silver nitrate | 1 | 25 | Odds Ratio (M‐H, Random, 95% CI) | 5.82 [0.21, 158.82] |
| 1.9 Talc slurry vs thoracoscopic mechanical pleurodesis (TMP) | 2 | 123 | Odds Ratio (M‐H, Random, 95% CI) | 2.28 [0.83, 6.23] |
| 1.10 Talc slurry vs autologous blood | 1 | 110 | Odds Ratio (M‐H, Random, 95% CI) | 0.69 [0.24, 1.95] |
| 1.11 Talc slurry vs IPC – daily drainage | 1 | 55 | Odds Ratio (M‐H, Random, 95% CI) | 0.30 [0.08, 1.14] |
| 2 Fever Show forest plot | 9 | Odds Ratio (M‐H, Random, 95% CI) | Subtotals only | |
| 2.1 Talc slurry vs talc poudrage | 2 | 479 | Odds Ratio (M‐H, Random, 95% CI) | 1.65 [0.42, 6.48] |
| 2.2 Talc slurry vs bleomycin | 3 | 98 | Odds Ratio (M‐H, Random, 95% CI) | 0.95 [0.36, 2.51] |
| 2.3 Talc slurry vs tetracycline | 1 | 34 | Odds Ratio (M‐H, Random, 95% CI) | 1.09 [0.28, 4.32] |
| 2.4 Talc slurry vs iodine | 2 | 75 | Odds Ratio (M‐H, Random, 95% CI) | 1.07 [0.32, 3.59] |
| 2.5 Talc slurry vs silver nitrate | 1 | 60 | Odds Ratio (M‐H, Random, 95% CI) | 0.7 [0.15, 3.24] |
| 2.6 Talc slurry vs autologous blood | 1 | 110 | Odds Ratio (M‐H, Random, 95% CI) | 3.92 [1.31, 11.72] |
| 3 Pain Show forest plot | 12 | Odds Ratio (M‐H, Random, 95% CI) | Subtotals only | |
| 3.1 Talc slurry vs bleomycin | 3 | 99 | Odds Ratio (M‐H, Random, 95% CI) | 0.60 [0.15, 2.46] |
| 3.2 Talc slurry vs talc poudrage | 2 | 812 | Odds Ratio (M‐H, Random, 95% CI) | 1.27 [0.41, 3.96] |
| 3.3 Talc slurry vs tetracycline | 1 | 34 | Odds Ratio (M‐H, Random, 95% CI) | 0.30 [0.07, 1.36] |
| 3.4 Talc slurry vs iodine | 2 | 75 | Odds Ratio (M‐H, Random, 95% CI) | 2.0 [0.55, 7.30] |
| 3.5 Talc slurry vs IPC – not daily drainage | 2 | 232 | Odds Ratio (M‐H, Random, 95% CI) | 0.62 [0.19, 1.95] |
| 3.6 Talc slurry vs placebo | 1 | 31 | Odds Ratio (M‐H, Random, 95% CI) | 0.0 [0.0, 0.0] |
| 3.7 Talc slurry vs autologous blood | 1 | 110 | Odds Ratio (M‐H, Random, 95% CI) | 3.57 [1.19, 10.74] |
| 3.8 Talc slurry vs IPC – daily drainage | 1 | 57 | Odds Ratio (M‐H, Random, 95% CI) | 0.31 [0.01, 7.95] |
| 4 Breathlessness Show forest plot | 3 | 344 | Mean Difference (IV, Fixed, 95% CI) | 1.09 [‐6.14, 8.32] |
| 4.1 Talc slurry vs IPC (not daily drainage) | 2 | 160 | Mean Difference (IV, Fixed, 95% CI) | 6.12 [‐4.08, 16.32] |
| 4.2 Talc slurry vs talc poudrage | 1 | 184 | Mean Difference (IV, Fixed, 95% CI) | ‐4.0 [‐14.26, 6.26] |
| 5 Mortality Show forest plot | 14 | Odds Ratio (M‐H, Random, 95% CI) | Subtotals only | |
| 5.1 Talc slurry vs talc poudrage | 3 | 725 | Odds Ratio (M‐H, Random, 95% CI) | 1.10 [0.69, 1.75] |
| 5.2 Talc slurry vs bleomycin | 2 | 116 | Odds Ratio (M‐H, Random, 95% CI) | 1.12 [0.36, 3.46] |
| 5.3 Talc slurry vs iodine | 2 | 75 | Odds Ratio (M‐H, Random, 95% CI) | 2.71 [0.10, 70.65] |
| 5.4 Talc slurry vs IPC – not daily drainage | 3 | 344 | Odds Ratio (M‐H, Random, 95% CI) | 1.43 [0.91, 2.23] |
| 5.5 Talc slurry vs mepacrine | 1 | 89 | Odds Ratio (M‐H, Random, 95% CI) | 1.88 [0.70, 5.02] |
| 5.6 Talc slurry vs TMP | 1 | 87 | Odds Ratio (M‐H, Random, 95% CI) | 10.64 [0.55, 203.85] |
| 5.7 Talc slurry vs autologous blood | 1 | 117 | Odds Ratio (M‐H, Random, 95% CI) | 1.38 [0.30, 6.47] |
| 5.8 Talc slurry vs IPC – daily drainage | 1 | 57 | Odds Ratio (M‐H, Random, 95% CI) | 0.59 [0.19, 1.79] |
| 6 Repeat pleural intervention Show forest plot | 6 | 756 | Odds Ratio (M‐H, Random, 95% CI) | 1.95 [0.90, 4.20] |
| 6.1 Talc slurry vs IPC – not daily drainage | 3 | 343 | Odds Ratio (M‐H, Random, 95% CI) | 3.91 [1.98, 7.72] |
| 6.2 Talc slurry vs talc poudrage | 2 | 380 | Odds Ratio (M‐H, Random, 95% CI) | 1.05 [0.64, 1.71] |
| 6.3 Talc slurry vs bleomycin | 1 | 33 | Odds Ratio (M‐H, Random, 95% CI) | 0.23 [0.01, 6.10] |
| Outcome or subgroup title | No. of studies | No. of participants | Statistical method | Effect size |
| 1 Pleurodesis failure rate Show forest plot | 10 | Odds Ratio (M‐H, Random, 95% CI) | Subtotals only | |
| 1.1 Talc poudrage vs talc slurry | 4 | 919 | Odds Ratio (M‐H, Random, 95% CI) | 0.81 [0.61, 1.08] |
| 1.2 Talc poudrage vs bleomycin | 2 | 57 | Odds Ratio (M‐H, Random, 95% CI) | 0.10 [0.02, 0.48] |
| 1.3 Talc poudrage vs tetracycline | 1 | 33 | Odds Ratio (M‐H, Random, 95% CI) | 0.08 [0.01, 0.76] |
| 1.4 Talc poudrage vs iodine | 1 | 42 | Odds Ratio (M‐H, Random, 95% CI) | 0.57 [0.08, 3.80] |
| 1.5 Talc poudrage vs mustine | 1 | 37 | Odds Ratio (M‐H, Random, 95% CI) | 0.13 [0.02, 0.71] |
| 1.6 Talc poudrage vs doxycycline | 1 | 31 | Odds Ratio (M‐H, Random, 95% CI) | 0.02 [0.00, 0.47] |
| 2 Fever Show forest plot | 4 | Odds Ratio (M‐H, Random, 95% CI) | Subtotals only | |
| 2.1 Talc poudrage vs talc slurry | 2 | 479 | Odds Ratio (M‐H, Random, 95% CI) | 0.60 [0.15, 2.37] |
| 2.2 Talc poudrage vs bleomycin | 1 | 32 | Odds Ratio (M‐H, Random, 95% CI) | 1.15 [0.14, 9.38] |
| 2.3 Talc poudrage vs iodine | 1 | 42 | Odds Ratio (M‐H, Random, 95% CI) | 4.22 [0.43, 41.45] |
| 3 Pain Show forest plot | 4 | Odds Ratio (M‐H, Random, 95% CI) | Subtotals only | |
| 3.1 Talc poudrage vs talc slurry | 2 | 812 | Odds Ratio (M‐H, Random, 95% CI) | 0.79 [0.25, 2.45] |
| 3.2 Talc poudrage vs bleomycin | 1 | 32 | Odds Ratio (M‐H, Random, 95% CI) | 3.62 [0.14, 95.78] |
| 3.3 Talc poudrage vs iodine | 1 | 42 | Odds Ratio (M‐H, Random, 95% CI) | 9.97 [0.50, 198.04] |
| 4 Breathlessness Show forest plot | 1 | 184 | Mean Difference (IV, Random, 95% CI) | 4.0 [‐6.26, 14.26] |
| 4.1 Talc poudrage vs talc slurry | 1 | 184 | Mean Difference (IV, Random, 95% CI) | 4.0 [‐6.26, 14.26] |
| 5 Mortality Show forest plot | 7 | Odds Ratio (M‐H, Random, 95% CI) | Subtotals only | |
| 5.1 Talc poudrage vs talc slurry | 3 | 725 | Odds Ratio (M‐H, Random, 95% CI) | 0.91 [0.57, 1.46] |
| 5.2 Talc poudrage vs bleomycin | 1 | 32 | Odds Ratio (M‐H, Random, 95% CI) | 1.22 [0.29, 5.13] |
| 5.3 Talc poudrage vs tetracycline | 1 | 41 | Odds Ratio (M‐H, Random, 95% CI) | 5.25 [0.91, 30.22] |
| 5.4 Talc poudrage vs iodine | 1 | 42 | Odds Ratio (M‐H, Random, 95% CI) | 2.64 [0.58, 12.09] |
| 5.5 Talc poudrage vs mustine | 1 | 46 | Odds Ratio (M‐H, Random, 95% CI) | 0.43 [0.09, 1.96] |
| 6 Repeat pleural intervention Show forest plot | 2 | 380 | Odds Ratio (M‐H, Fixed, 95% CI) | 0.96 [0.59, 1.56] |
| 6.1 Talc poudrage vs talc slurry | 2 | 380 | Odds Ratio (M‐H, Fixed, 95% CI) | 0.96 [0.59, 1.56] |
| Outcome or subgroup title | No. of studies | No. of participants | Statistical method | Effect size |
| 1 Pleurodesis failure rate Show forest plot | 14 | Odds Ratio (M‐H, Random, 95% CI) | Subtotals only | |
| 1.1 Tetracycline vs C parvum | 1 | 32 | Odds Ratio (M‐H, Random, 95% CI) | 3.18 [0.52, 19.64] |
| 1.2 Tetracycline vs talc slurry | 1 | 32 | Odds Ratio (M‐H, Random, 95% CI) | 0.78 [0.19, 3.13] |
| 1.3 Tetracycline vs adriamycin | 1 | 21 | Odds Ratio (M‐H, Random, 95% CI) | 0.9 [0.05, 16.59] |
| 1.4 Tetracyclines vs placebo | 1 | 20 | Odds Ratio (M‐H, Random, 95% CI) | 0.3 [0.05, 1.94] |
| 1.5 Tetracycline vs talc poudrage | 1 | 33 | Odds Ratio (M‐H, Random, 95% CI) | 12.1 [1.32, 111.30] |
| 1.6 Tetracycline vs mustine | 2 | 59 | Odds Ratio (M‐H, Random, 95% CI) | 0.37 [0.10, 1.35] |
| 1.7 Tetracycline vs combined tetracycline and bleomycin | 1 | 38 | Odds Ratio (M‐H, Random, 95% CI) | 8.27 [0.40, 172.05] |
| 1.8 Tetracycline vs bleomycin | 5 | 220 | Odds Ratio (M‐H, Random, 95% CI) | 2.00 [1.07, 3.75] |
| 1.9 Tetracycline vs mepacrine | 1 | 21 | Odds Ratio (M‐H, Random, 95% CI) | 1.6 [0.12, 20.99] |
| 1.10 Tetracycline vs autologous blood | 1 | 48 | Odds Ratio (M‐H, Random, 95% CI) | 0.71 [0.14, 3.60] |
| 1.11 Tetracycline vs silver nitrate | 1 | 50 | Odds Ratio (M‐H, Random, 95% CI) | 0.60 [0.15, 2.47] |
| 1.12 Tetracycline poudrage vs tetracycline slurry | 1 | 29 | Odds Ratio (M‐H, Random, 95% CI) | 0.28 [0.04, 1.76] |
| 2 Fever Show forest plot | 11 | Odds Ratio (M‐H, Random, 95% CI) | Subtotals only | |
| 2.1 Tetracycline vs talc slurry | 1 | 34 | Odds Ratio (M‐H, Random, 95% CI) | 0.92 [0.23, 3.63] |
| 2.2 Tetracycline vs bleomycin | 5 | 250 | Odds Ratio (M‐H, Random, 95% CI) | 0.49 [0.16, 1.50] |
| 2.3 Tetracycline vs C parvum | 1 | 36 | Odds Ratio (M‐H, Random, 95% CI) | 0.00 [0.00, 0.06] |
| 2.4 Tetracycline vs mepacrine | 1 | 22 | Odds Ratio (M‐H, Random, 95% CI) | 0.13 [0.02, 0.89] |
| 2.5 Tetracycline vs combination tetracycline and bleomycin | 1 | 40 | Odds Ratio (M‐H, Random, 95% CI) | 0.47 [0.04, 5.69] |
| 2.6 Tetracycline vs placebo | 1 | 22 | Odds Ratio (M‐H, Random, 95% CI) | 0.0 [0.0, 0.0] |
| 2.7 Tetracycline vs mustine | 1 | 40 | Odds Ratio (M‐H, Random, 95% CI) | 0.0 [0.0, 0.0] |
| 2.8 Tetracycline vs autologous blood | 1 | 48 | Odds Ratio (M‐H, Random, 95% CI) | 4.53 [0.83, 24.65] |
| 2.9 Tetracycline vs silver nitrate | 1 | 50 | Odds Ratio (M‐H, Random, 95% CI) | 327.86 [16.05, 6697.61] |
| 3 Pain Show forest plot | 10 | Odds Ratio (M‐H, Random, 95% CI) | Subtotals only | |
| 3.1 Tetracycline vs talc slurry | 1 | 34 | Odds Ratio (M‐H, Random, 95% CI) | 3.28 [0.73, 14.68] |
| 3.2 Tetracycline vs bleomycin | 4 | 220 | Odds Ratio (M‐H, Random, 95% CI) | 1.65 [0.79, 3.43] |
| 3.3 Tetracycline vs C parvum | 1 | 41 | Odds Ratio (M‐H, Random, 95% CI) | 0.41 [0.12, 1.45] |
| 3.4 Tetracycline vs mustine | 1 | 40 | Odds Ratio (M‐H, Random, 95% CI) | 33.87 [1.80, 636.88] |
| 3.5 Tetracycline vs mepacrine | 1 | 22 | Odds Ratio (M‐H, Random, 95% CI) | 0.18 [0.03, 1.23] |
| 3.6 Tetracycline vs placebo | 1 | 22 | Odds Ratio (M‐H, Random, 95% CI) | 0.0 [0.0, 0.0] |
| 3.7 Tetracycline vs autologous blood | 1 | 48 | Odds Ratio (M‐H, Random, 95% CI) | 69.00 [7.61, 625.86] |
| 3.8 Tetracycline vs silver nitrate | 1 | 50 | Odds Ratio (M‐H, Random, 95% CI) | 55.08 [3.02, 1003.70] |
| 4 Mortality Show forest plot | 6 | 300 | Odds Ratio (M‐H, Random, 95% CI) | 0.99 [0.30, 3.26] |
| 4.1 Tetracycline vs talc poudrage | 1 | 41 | Odds Ratio (M‐H, Random, 95% CI) | 0.19 [0.03, 1.10] |
| 4.2 Tetracycline vs bleomycin | 2 | 125 | Odds Ratio (M‐H, Random, 95% CI) | 1.60 [0.69, 3.69] |
| 4.3 Tetracycline vs C parvum | 1 | 36 | Odds Ratio (M‐H, Random, 95% CI) | 3.00 [0.28, 31.99] |
| 4.4 Tetracycline vs silver nitrate | 1 | 50 | Odds Ratio (M‐H, Random, 95% CI) | 0.0 [0.0, 0.0] |
| 4.5 Tetracycline vs autologous blood | 1 | 48 | Odds Ratio (M‐H, Random, 95% CI) | 0.0 [0.0, 0.0] |
| Outcome or subgroup title | No. of studies | No. of participants | Statistical method | Effect size |
| 1 Pleurodesis failure rate Show forest plot | 5 | Odds Ratio (M‐H, Random, 95% CI) | Subtotals only | |
| 1.1 C parvum vs bleomycin | 2 | 78 | Odds Ratio (M‐H, Random, 95% CI) | 0.55 [0.01, 57.48] |
| 1.2 C parvum vs tetracycline | 1 | 32 | Odds Ratio (M‐H, Random, 95% CI) | 0.31 [0.05, 1.94] |
| 1.3 C parvum vs doxycycline | 1 | 35 | Odds Ratio (M‐H, Random, 95% CI) | 0.52 [0.12, 2.33] |
| 1.4 C parvum vs mustine | 1 | 18 | Odds Ratio (M‐H, Random, 95% CI) | 0.33 [0.04, 2.52] |
| 2 Fever Show forest plot | 5 | Odds Ratio (M‐H, Random, 95% CI) | Subtotals only | |
| 2.1 C parvum vs bleomycin | 2 | 80 | Odds Ratio (M‐H, Random, 95% CI) | 2.30 [0.90, 5.92] |
| 2.2 C parvum vs tetracycline | 1 | 36 | Odds Ratio (M‐H, Random, 95% CI) | 288.00 [16.62, 4991.05] |
| 2.3 C parvum vs mustine | 1 | 21 | Odds Ratio (M‐H, Random, 95% CI) | 4.41 [0.16, 121.68] |
| 2.4 C parvum vs doxycycline | 1 | 41 | Odds Ratio (M‐H, Random, 95% CI) | 7.37 [1.84, 29.55] |
| 3 Pain Show forest plot | 4 | 153 | Odds Ratio (M‐H, Random, 95% CI) | 2.51 [1.10, 5.75] |
| 3.1 C parvum vs bleomycin | 2 | 71 | Odds Ratio (M‐H, Random, 95% CI) | 1.42 [0.54, 3.75] |
| 3.2 C parvum vs tetracycline | 1 | 41 | Odds Ratio (M‐H, Random, 95% CI) | 2.44 [0.69, 8.66] |
| 3.3 C parvum vs doxycycline | 1 | 41 | Odds Ratio (M‐H, Random, 95% CI) | 7.37 [1.84, 29.55] |
| 4 Mortality Show forest plot | 3 | Odds Ratio (M‐H, Random, 95% CI) | Subtotals only | |
| 4.1 C parvum vs bleomycin | 1 | 55 | Odds Ratio (M‐H, Random, 95% CI) | 1.66 [0.51, 5.38] |
| 4.2 C parvum vs tetracycline | 1 | 36 | Odds Ratio (M‐H, Random, 95% CI) | 0.33 [0.03, 3.55] |
| 4.3 C parvum vs mustine | 1 | 21 | Odds Ratio (M‐H, Random, 95% CI) | 0.42 [0.07, 2.66] |
| Outcome or subgroup title | No. of studies | No. of participants | Statistical method | Effect size |
| 1 Pleurodesis failure rate Show forest plot | 6 | Odds Ratio (M‐H, Random, 95% CI) | Subtotals only | |
| 1.1 IPC – not daily drainage vs talc slurry | 2 | 249 | Odds Ratio (M‐H, Random, 95% CI) | 5.46 [2.20, 13.55] |
| 1.2 IPC – not daily drainage vs talc via IPC | 1 | 139 | Odds Ratio (M‐H, Random, 95% CI) | 2.76 [1.36, 5.60] |
| 1.3 IPC – not daily drainage vs IPC – daily drainage | 2 | 236 | Odds Ratio (M‐H, Random, 95% CI) | 3.23 [1.79, 5.85] |
| 1.4 IPC – not daily drainage vs doxycycline | 1 | 119 | Odds Ratio (M‐H, Random, 95% CI) | 4.28 [1.59, 11.54] |
| 2 Fever Show forest plot | 1 | 119 | Odds Ratio (M‐H, Fixed, 95% CI) | 0.44 [0.07, 2.80] |
| 3 Pain Show forest plot | 6 | Odds Ratio (M‐H, Random, 95% CI) | Subtotals only | |
| 3.1 IPC – not daily drainage vs talc slurry | 2 | 232 | Odds Ratio (M‐H, Random, 95% CI) | 1.63 [0.51, 5.15] |
| 3.2 IPC – not daily drainage vs talc via IPC | 1 | 154 | Odds Ratio (M‐H, Random, 95% CI) | 1.41 [0.47, 4.28] |
| 3.3 IPC – not daily drainage vs IPC – daily drainage | 2 | 236 | Odds Ratio (M‐H, Random, 95% CI) | 1.36 [0.78, 2.37] |
| 3.4 IPC – not daily drainage vs doxycycline | 1 | 119 | Odds Ratio (M‐H, Random, 95% CI) | 0.06 [0.00, 1.24] |
| 4 Breathlessness Show forest plot | 2 | 160 | Mean Difference (IV, Fixed, 95% CI) | ‐6.12 [‐16.32, 4.08] |
| 4.1 IPC – not daily drainage vs talc slurry | 2 | 160 | Mean Difference (IV, Fixed, 95% CI) | ‐6.12 [‐16.32, 4.08] |
| 5 Mortality Show forest plot | 6 | 734 | Odds Ratio (M‐H, Random, 95% CI) | 0.99 [0.66, 1.49] |
| 5.1 IPC – not daily drainage vs talc slurry | 3 | 344 | Odds Ratio (M‐H, Random, 95% CI) | 0.70 [0.45, 1.09] |
| 5.2 IPC – not daily drainage vs talc via IPC | 1 | 154 | Odds Ratio (M‐H, Random, 95% CI) | 2.29 [0.87, 6.04] |
| 5.3 IPC – not daily drainage vs IPC – daily drainage | 2 | 236 | Odds Ratio (M‐H, Random, 95% CI) | 1.29 [0.72, 2.32] |
| 6 Repeat pleural procedure Show forest plot | 3 | 343 | Odds Ratio (M‐H, Fixed, 95% CI) | 0.25 [0.13, 0.48] |
| Outcome or subgroup title | No. of studies | No. of participants | Statistical method | Effect size |
| 1 Pleurodesis failure rate Show forest plot | 5 | Odds Ratio (M‐H, Random, 95% CI) | Subtotals only | |
| 1.1 Iodine vs talc poudrage | 1 | 42 | Odds Ratio (M‐H, Random, 95% CI) | 1.76 [0.26, 11.83] |
| 1.2 Iodine vs talc slurry | 2 | 75 | Odds Ratio (M‐H, Random, 95% CI) | 1.17 [0.32, 4.25] |
| 1.3 Iodine vs bleomycin | 2 | 99 | Odds Ratio (M‐H, Random, 95% CI) | 0.65 [0.22, 1.96] |
| 2 Fever Show forest plot | 4 | Odds Ratio (M‐H, Random, 95% CI) | Subtotals only | |
| 2.1 Iodine vs talc slurry | 2 | 75 | Odds Ratio (M‐H, Random, 95% CI) | 0.93 [0.28, 3.13] |
| 2.2 Iodine vs talc poudrage | 1 | 42 | Odds Ratio (M‐H, Random, 95% CI) | 0.24 [0.02, 2.33] |
| 2.3 Iodine vs bleomycin | 1 | 60 | Odds Ratio (M‐H, Random, 95% CI) | 1.0 [0.13, 7.60] |
| 3 Pain Show forest plot | 4 | Odds Ratio (M‐H, Random, 95% CI) | Subtotals only | |
| 3.1 Iodine vs talc slurry | 2 | 75 | Odds Ratio (M‐H, Random, 95% CI) | 0.5 [0.14, 1.83] |
| 3.2 Iodine vs talc poudrage | 1 | 42 | Odds Ratio (M‐H, Random, 95% CI) | 0.10 [0.01, 1.99] |
| 3.3 Iodine vs bleomycin | 1 | 60 | Odds Ratio (M‐H, Random, 95% CI) | 1.0 [0.13, 7.60] |
| 4 Mortality Show forest plot | 2 | Odds Ratio (M‐H, Random, 95% CI) | Subtotals only | |
| 4.1 Iodine vs talc poudrage | 1 | 42 | Odds Ratio (M‐H, Random, 95% CI) | 0.38 [0.08, 1.73] |
| 4.2 Iodine vs talc slurry | 1 | 39 | Odds Ratio (M‐H, Random, 95% CI) | 0.37 [0.01, 9.64] |
| Outcome or subgroup title | No. of studies | No. of participants | Statistical method | Effect size |
| 1 Pleurodesis failure rate Show forest plot | 5 | Odds Ratio (M‐H, Random, 95% CI) | Subtotals only | |
| 1.1 Doxycycline vs talc poudrage | 1 | 31 | Odds Ratio (M‐H, Random, 95% CI) | 42.69 [2.13, 856.61] |
| 1.2 Doxycycline vs bleomycin | 2 | 122 | Odds Ratio (M‐H, Random, 95% CI) | 0.67 [0.24, 1.86] |
| 1.3 Doxycycline vs C parvum | 1 | 35 | Odds Ratio (M‐H, Random, 95% CI) | 1.91 [0.43, 8.48] |
| 1.4 Doxycycline vs IPC – not daily drainage | 1 | 119 | Odds Ratio (M‐H, Random, 95% CI) | 0.23 [0.09, 0.63] |
| 2 Fever Show forest plot | 4 | 308 | Odds Ratio (M‐H, Random, 95% CI) | 0.48 [0.09, 2.59] |
| 2.1 Doxycycline vs bleomycin | 2 | 148 | Odds Ratio (M‐H, Random, 95% CI) | 0.37 [0.01, 12.35] |
| 2.2 Doxycycline vs C parvum | 1 | 41 | Odds Ratio (M‐H, Random, 95% CI) | 0.14 [0.03, 0.54] |
| 2.3 Doxycycline vs IPC – not daily drainage | 1 | 119 | Odds Ratio (M‐H, Random, 95% CI) | 2.26 [0.36, 14.23] |
| 3 Pain Show forest plot | 4 | Odds Ratio (M‐H, Random, 95% CI) | Subtotals only | |
| 3.1 Doxycycline vs bleomycin | 2 | 148 | Odds Ratio (M‐H, Random, 95% CI) | 1.19 [0.37, 3.80] |
| 3.2 Doxycycline vs C parvum | 1 | 41 | Odds Ratio (M‐H, Random, 95% CI) | 0.10 [0.01, 0.96] |
| 3.3 Doxycycline vs IPC – not daily drainage | 1 | 119 | Odds Ratio (M‐H, Random, 95% CI) | 17.26 [0.80, 370.79] |
| 4 Mortality Show forest plot | 1 | Odds Ratio (M‐H, Random, 95% CI) | Subtotals only | |
| 4.1 Doxycycline vs bleomycin | 1 | 80 | Odds Ratio (M‐H, Random, 95% CI) | 0.69 [0.26, 1.87] |
| Outcome or subgroup title | No. of studies | No. of participants | Statistical method | Effect size |
| 1 Pleurodesis failure rate Show forest plot | 3 | Odds Ratio (M‐H, Fixed, 95% CI) | Subtotals only | |
| 2 Mortality Show forest plot | 3 | Odds Ratio (M‐H, Random, 95% CI) | Subtotals only | |
| Outcome or subgroup title | No. of studies | No. of participants | Statistical method | Effect size |
| 1 Pleurodesis failure rate Show forest plot | 4 | Odds Ratio (M‐H, Random, 95% CI) | Subtotals only | |
| 1.1 OK‐432 and mitomycin C | 1 | 53 | Odds Ratio (M‐H, Random, 95% CI) | 0.26 [0.06, 1.11] |
| 1.2 OK‐432 vs cisplatin and etoposide | 1 | 67 | Odds Ratio (M‐H, Random, 95% CI) | 0.77 [0.26, 2.27] |
| 1.3 OK‐432 and cisplatin | 1 | 34 | Odds Ratio (M‐H, Random, 95% CI) | 0.48 [0.12, 1.92] |
| 1.4 High dose vs low dose | 1 | 38 | Odds Ratio (M‐H, Random, 95% CI) | 1.90 [0.38, 9.44] |
| 1.5 OK‐432 vs bleomycin | 1 | 68 | Odds Ratio (M‐H, Random, 95% CI) | 0.70 [0.24, 2.03] |
| 1.6 OK‐432 vs OK‐432 and cisplatin | 1 | 32 | Odds Ratio (M‐H, Random, 95% CI) | 12.44 [1.32, 117.03] |
| 2 Fever Show forest plot | 3 | Odds Ratio (M‐H, Random, 95% CI) | Subtotals only | |
| 2.1 OK‐432 vs cisplatin | 1 | 34 | Odds Ratio (M‐H, Random, 95% CI) | 256.00 [14.70, 4457.27] |
| 2.2 OK‐432 vs OK‐432 and cisplatin | 1 | 32 | Odds Ratio (M‐H, Random, 95% CI) | 14.00 [1.46, 134.25] |
| 2.3 OK‐432 vs mitomycin C | 1 | 53 | Odds Ratio (M‐H, Random, 95% CI) | 26.67 [5.91, 120.42] |
| 2.4 OK‐432 vs bleomycin | 1 | 67 | Odds Ratio (M‐H, Random, 95% CI) | 1.43 [0.47, 4.35] |
| 2.5 OK‐432 vs cisplatin and etoposide | 1 | 66 | Odds Ratio (M‐H, Random, 95% CI) | 3.17 [1.08, 9.30] |
| 3 Pain Show forest plot | 3 | Odds Ratio (M‐H, Random, 95% CI) | Subtotals only | |
| 3.1 OK‐432 vs cisplatin | 1 | 34 | Odds Ratio (M‐H, Random, 95% CI) | 6.67 [1.15, 38.60] |
| 3.2 OK‐432 vs OK‐432 and cisplatin | 1 | 32 | Odds Ratio (M‐H, Random, 95% CI) | 1.33 [0.33, 5.43] |
| 3.3 OK‐432 vs mitomycin C | 1 | 53 | Odds Ratio (M‐H, Random, 95% CI) | 1.04 [0.14, 8.00] |
| 3.4 OK‐432 vs bleomycin | 1 | 67 | Odds Ratio (M‐H, Random, 95% CI) | 2.53 [0.89, 7.15] |
| 3.5 OK‐432 vs cisplatin and etoposide | 1 | 66 | Odds Ratio (M‐H, Random, 95% CI) | 2.1 [0.73, 6.01] |
| 4 Mortality Show forest plot | 2 | Odds Ratio (M‐H, Random, 95% CI) | Subtotals only | |
| 4.1 OK‐432 vs cisplatin | 1 | 34 | Odds Ratio (M‐H, Random, 95% CI) | 1.31 [0.31, 5.53] |
| 4.2 OK‐432 vs combined OK‐432 and cisplatin | 1 | 32 | Odds Ratio (M‐H, Random, 95% CI) | 2.18 [0.44, 10.91] |
| 4.3 OK‐432 vs bleomycin | 1 | 68 | Odds Ratio (M‐H, Random, 95% CI) | 0.38 [0.14, 1.03] |
| 4.4 OK‐432 vs cisplatin and etoposide | 1 | 67 | Odds Ratio (M‐H, Random, 95% CI) | 0.84 [0.32, 2.18] |
| Outcome or subgroup title | No. of studies | No. of participants | Statistical method | Effect size |
| 1 Pleurodesis failure rate Show forest plot | 5 | Odds Ratio (M‐H, Random, 95% CI) | Subtotals only | |
| 1.1 Mepacrine vs talc slurry | 1 | 89 | Odds Ratio (M‐H, Random, 95% CI) | 2.08 [0.62, 6.96] |
| 1.2 Mepacrine vs bleomycin | 1 | 36 | Odds Ratio (M‐H, Random, 95% CI) | 0.16 [0.03, 0.89] |
| 1.3 Mepacrine vs tetracycline | 1 | 21 | Odds Ratio (M‐H, Random, 95% CI) | 0.63 [0.05, 8.20] |
| 1.4 Mepacrine vs placebo | 1 | 23 | Odds Ratio (M‐H, Random, 95% CI) | 0.07 [0.01, 0.73] |
| 1.5 Mepacrine vs mitoxantrone | 1 | 26 | Odds Ratio (M‐H, Random, 95% CI) | 7.61 [0.35, 163.82] |
| 1.6 Mepacrine vs triethylene... | 1 | 29 | Odds Ratio (M‐H, Random, 95% CI) | 0.20 [0.04, 0.98] |
| 2 Fever Show forest plot | 3 | Odds Ratio (M‐H, Random, 95% CI) | Subtotals only | |
| 2.1 Mepacrine vs bleomycin | 1 | 40 | Odds Ratio (M‐H, Random, 95% CI) | 1.91 [0.52, 7.01] |
| 2.2 Mepacrine vs tetracycline | 1 | 22 | Odds Ratio (M‐H, Random, 95% CI) | 8.00 [1.13, 56.79] |
| 2.3 Mepacrine vs placebo | 1 | 23 | Odds Ratio (M‐H, Random, 95% CI) | 62.43 [2.85, 1365.52] |
| 2.4 Mepacrine vs triethylene... | 1 | 29 | Odds Ratio (M‐H, Random, 95% CI) | 23.83 [3.35, 169.39] |
| 3 Pain Show forest plot | 3 | 114 | Odds Ratio (M‐H, Random, 95% CI) | 4.56 [1.66, 12.52] |
| 3.1 Mepacrine vs bleomycin | 1 | 40 | Odds Ratio (M‐H, Random, 95% CI) | 2.15 [0.52, 9.00] |
| 3.2 Mepacrine vs tetracycline | 1 | 22 | Odds Ratio (M‐H, Random, 95% CI) | 5.6 [0.81, 38.51] |
| 3.3 Mepacrine vs placebo | 1 | 23 | Odds Ratio (M‐H, Random, 95% CI) | 14.53 [0.71, 298.21] |
| 3.4 Mepacrine vs triethylenethiophosphoramide | 1 | 29 | Odds Ratio (M‐H, Random, 95% CI) | 23.71 [1.19, 474.06] |
| 4 Mortality Show forest plot | 2 | Odds Ratio (M‐H, Random, 95% CI) | Subtotals only | |
| 4.1 Mepacrine vs talc slurry | 1 | 89 | Odds Ratio (M‐H, Random, 95% CI) | 0.53 [0.20, 1.43] |
| 4.2 Mepacrine vs mitoxantrone | 1 | 28 | Odds Ratio (M‐H, Random, 95% CI) | 1.64 [0.23, 11.70] |
| Outcome or subgroup title | No. of studies | No. of participants | Statistical method | Effect size |
| 1 Pleurodesis failure rate Show forest plot | 1 | Odds Ratio (M‐H, Random, 95% CI) | Subtotals only | |
| 1.1 IFN vs bleomycin | 1 | 160 | Odds Ratio (M‐H, Random, 95% CI) | 3.25 [1.54, 6.89] |
| 2 Fever Show forest plot | 1 | 160 | Odds Ratio (M‐H, Random, 95% CI) | 0.01 [0.00, 0.11] |
| 3 Pain Show forest plot | 1 | 160 | Odds Ratio (M‐H, Random, 95% CI) | 0.03 [0.00, 0.53] |
| 3.1 IFN vs bleomycin | 1 | 160 | Odds Ratio (M‐H, Random, 95% CI) | 0.03 [0.00, 0.53] |
| 4 Mortality Show forest plot | 1 | Odds Ratio (M‐H, Random, 95% CI) | Subtotals only | |
| 4.1 IFN vs bleomycin | 1 | 160 | Odds Ratio (M‐H, Random, 95% CI) | 2.16 [1.15, 4.07] |
| Outcome or subgroup title | No. of studies | No. of participants | Statistical method | Effect size |
| 1 Pleurodesis failure rate Show forest plot | 1 | Odds Ratio (M‐H, Random, 95% CI) | Subtotals only | |
| 1.1 Triethylene... vs placebo | 1 | 24 | Odds Ratio (M‐H, Random, 95% CI) | 0.34 [0.03, 3.69] |
| 1.2 Triethylene... vs mepacrine | 1 | 29 | Odds Ratio (M‐H, Random, 95% CI) | 4.95 [1.02, 24.10] |
| 2 Fever Show forest plot | 1 | 53 | Odds Ratio (M‐H, Random, 95% CI) | 0.32 [0.00, 26.74] |
| 2.1 Triethylene... vs placebo | 1 | 24 | Odds Ratio (M‐H, Random, 95% CI) | 3.52 [0.15, 81.92] |
| 2.2 Triethylene... vs mepacrine | 1 | 29 | Odds Ratio (M‐H, Random, 95% CI) | 0.04 [0.01, 0.30] |
| 3 Pain Show forest plot | 1 | 53 | Odds Ratio (M‐H, Random, 95% CI) | 1.39 [0.10, 20.15] |
| 3.1 Triethylene... vs mepacrine | 1 | 29 | Odds Ratio (M‐H, Random, 95% CI) | 0.48 [0.10, 2.30] |
| 3.2 Triethylene... vs placebo | 1 | 24 | Odds Ratio (M‐H, Random, 95% CI) | 7.43 [0.35, 156.28] |
| Outcome or subgroup title | No. of studies | No. of participants | Statistical method | Effect size |
| 1 Pleurodesis failure rate Show forest plot | 2 | Odds Ratio (M‐H, Random, 95% CI) | Subtotals only | |
| 1.1 Adriamycin vs mustine | 1 | 20 | Odds Ratio (M‐H, Random, 95% CI) | 0.37 [0.01, 10.18] |
| 1.2 Adriamycin vs tetracycline | 1 | 21 | Odds Ratio (M‐H, Random, 95% CI) | 1.11 [0.06, 20.49] |
| 1.3 Adriamycin vs LC9018 and adriamycin | 1 | 76 | Odds Ratio (M‐H, Random, 95% CI) | 4.29 [1.62, 11.35] |
| 2 Fever Show forest plot | 1 | Odds Ratio (M‐H, Random, 95% CI) | Subtotals only | |
| 3 Pain Show forest plot | 1 | Odds Ratio (M‐H, Random, 95% CI) | Subtotals only | |
| Outcome or subgroup title | No. of studies | No. of participants | Statistical method | Effect size |
| 1 Pleurodesis failure rate Show forest plot | 6 | Odds Ratio (M‐H, Random, 95% CI) | Subtotals only | |
| 1.1 Placebo vs mepacrine | 1 | 23 | Odds Ratio (M‐H, Random, 95% CI) | 14.40 [1.37, 150.81] |
| 1.2 Placebo vs mitoxantrone | 1 | 95 | Odds Ratio (M‐H, Random, 95% CI) | 1.33 [0.56, 3.17] |
| 1.3 Placebo vs triethylene... | 1 | 24 | Odds Ratio (M‐H, Random, 95% CI) | 2.91 [0.27, 31.21] |
| 1.4 Placebo vs talc slurry | 1 | 21 | Odds Ratio (M‐H, Random, 95% CI) | 13.93 [0.66, 293.99] |
| 1.5 Placebo vs tetracycline | 1 | 20 | Odds Ratio (M‐H, Random, 95% CI) | 3.33 [0.51, 21.58] |
| 1.6 Placebo vs urokinase | 1 | 69 | Odds Ratio (M‐H, Random, 95% CI) | 0.81 [0.30, 2.19] |
| 1.7 Placebo vs streptokinase | 1 | 40 | Odds Ratio (M‐H, Random, 95% CI) | 3.00 [0.51, 17.74] |
| 2 Fever Show forest plot | 2 | Odds Ratio (M‐H, Random, 95% CI) | Subtotals only | |
| 2.1 Placebo vs mepacrine | 1 | 95 | Odds Ratio (M‐H, Random, 95% CI) | 0.31 [0.12, 0.79] |
| 2.2 Placebo vs mitoxantrone | 1 | 23 | Odds Ratio (M‐H, Random, 95% CI) | 0.02 [0.00, 0.35] |
| 2.3 Placebo vs triethylene... | 1 | 24 | Odds Ratio (M‐H, Random, 95% CI) | 0.28 [0.01, 6.62] |
| 3 Pain Show forest plot | 3 | 100 | Odds Ratio (M‐H, Random, 95% CI) | 0.10 [0.01, 0.82] |
| 3.1 Placebo vs talc slurry | 1 | 31 | Odds Ratio (M‐H, Random, 95% CI) | 0.0 [0.0, 0.0] |
| 3.2 Placebo vs tetracycline | 1 | 22 | Odds Ratio (M‐H, Random, 95% CI) | 0.0 [0.0, 0.0] |
| 3.3 Placebo vs mepacrine | 1 | 23 | Odds Ratio (M‐H, Random, 95% CI) | 0.07 [0.00, 1.41] |
| 3.4 Placebo vs triethylene... | 1 | 24 | Odds Ratio (M‐H, Random, 95% CI) | 0.13 [0.01, 2.83] |
| 4 Mortality Show forest plot | 1 | 71 | Odds Ratio (M‐H, Fixed, 95% CI) | 12.40 [0.66, 233.22] |
| Outcome or subgroup title | No. of studies | No. of participants | Statistical method | Effect size |
| 1 Pleurodesis failure rate Show forest plot | 4 | Odds Ratio (M‐H, Random, 95% CI) | Subtotals only | |
| 1.1 Mustine vs tetracycline | 2 | 59 | Odds Ratio (M‐H, Random, 95% CI) | 2.72 [0.74, 9.98] |
| 1.2 Mustine vs talc poudrage | 1 | 37 | Odds Ratio (M‐H, Random, 95% CI) | 8.00 [1.40, 45.76] |
| 1.3 Mustine vs C parvum | 1 | 31 | Odds Ratio (M‐H, Random, 95% CI) | 10.8 [1.64, 70.93] |
| 1.4 Mustine vs adriamycin | 1 | 20 | Odds Ratio (M‐H, Random, 95% CI) | 2.71 [0.10, 74.98] |
| 2 Fever Show forest plot | 2 | Odds Ratio (M‐H, Random, 95% CI) | Subtotals only | |
| 2.1 Mustine vs tetracycline | 1 | 40 | Odds Ratio (M‐H, Random, 95% CI) | 0.0 [0.0, 0.0] |
| 2.2 Mustine vs C parvum | 1 | 21 | Odds Ratio (M‐H, Random, 95% CI) | 0.23 [0.01, 6.25] |
| 3 Pain Show forest plot | 1 | Odds Ratio (M‐H, Random, 95% CI) | Subtotals only | |
| 4 Mortality Show forest plot | 2 | Odds Ratio (M‐H, Random, 95% CI) | Subtotals only | |
| 4.1 Mustine vs talc poudrage | 1 | 46 | Odds Ratio (M‐H, Random, 95% CI) | 2.35 [0.51, 10.86] |
| 4.2 Mustine vs C parvum | 1 | 21 | Odds Ratio (M‐H, Random, 95% CI) | 2.4 [0.38, 15.32] |
| Outcome or subgroup title | No. of studies | No. of participants | Statistical method | Effect size |
| 1 Pleurodesis failure rate Show forest plot | 3 | Odds Ratio (M‐H, Random, 95% CI) | Subtotals only | |
| 1.1 Mitoxantrone vs placebo | 1 | 95 | Odds Ratio (M‐H, Random, 95% CI) | 0.75 [0.32, 1.79] |
| 1.2 Mitoxantrone vs mepacrine | 1 | 26 | Odds Ratio (M‐H, Random, 95% CI) | 7.61 [0.35, 163.82] |
| 1.3 Mitoxantrone vs bleomycin | 1 | 85 | Odds Ratio (M‐H, Random, 95% CI) | 3.18 [1.17, 8.65] |
| 2 Pain Show forest plot | 1 | 96 | Odds Ratio (M‐H, Random, 95% CI) | 2.08 [0.64, 6.76] |
| 3 Fever Show forest plot | 2 | Odds Ratio (M‐H, Random, 95% CI) | Subtotals only | |
| 3.1 Mitoxantrone vs bleomycin | 1 | 96 | Odds Ratio (M‐H, Random, 95% CI) | 0.90 [0.30, 2.71] |
| 3.2 Mitoxantrone vs placebo | 1 | 95 | Odds Ratio (M‐H, Random, 95% CI) | 3.28 [1.26, 8.49] |
| 4 Mortality Show forest plot | 2 | Odds Ratio (M‐H, Random, 95% CI) | Subtotals only | |
| 4.1 Mitoxantrone vs bleomycin | 1 | 96 | Odds Ratio (M‐H, Random, 95% CI) | 0.47 [0.21, 1.05] |
| 4.2 Mitoxantrone vs mepacrine | 1 | 28 | Odds Ratio (M‐H, Random, 95% CI) | 0.61 [0.09, 4.37] |
| Outcome or subgroup title | No. of studies | No. of participants | Statistical method | Effect size |
| 1 Pleurodesis failure rate Show forest plot | 2 | 118 | Odds Ratio (M‐H, Random, 95% CI) | 1.19 [0.53, 2.69] |
| 2 Pain Show forest plot | 1 | Odds Ratio (M‐H, Random, 95% CI) | Subtotals only | |
| 3 Mortality Show forest plot | 2 | Odds Ratio (M‐H, Random, 95% CI) | Subtotals only | |
| Outcome or subgroup title | No. of studies | No. of participants | Statistical method | Effect size |
| 1 Pleurodesis failure rate Show forest plot | 2 | 123 | Odds Ratio (M‐H, Random, 95% CI) | 0.44 [0.16, 1.20] |
| 2 Mortality Show forest plot | 1 | Odds Ratio (M‐H, Random, 95% CI) | Subtotals only | |
| Outcome or subgroup title | No. of studies | No. of participants | Statistical method | Effect size |
| 1 Pleurodesis failure rate Show forest plot | 4 | 464 | Odds Ratio (M‐H, Random, 95% CI) | 1.16 [0.76, 1.78] |
| 1.1 Rotation vs no rotation | 1 | 20 | Odds Ratio (M‐H, Random, 95% CI) | 2.25 [0.17, 29.77] |
| 1.2 Mixed particle talc vs graded talc | 1 | 28 | Odds Ratio (M‐H, Random, 95% CI) | 1.64 [0.23, 11.70] |
| 1.3 Talc pleurodesis vs video‐assisted thoracoscopic surgery (VATS) parietal pleurectomy | 1 | 122 | Odds Ratio (M‐H, Random, 95% CI) | 1.01 [0.49, 2.09] |
| 1.4 Non‐steroidal anti‐inflammatory drugs (NSAIDs) vs opiates for analgesia | 1 | 294 | Odds Ratio (M‐H, Random, 95% CI) | 1.19 [0.68, 2.08] |
| 2 Fever Show forest plot | 1 | Odds Ratio (M‐H, Random, 95% CI) | Subtotals only | |
| 2.1 Mixed particle talc vs graded talc | 1 | 46 | Odds Ratio (M‐H, Random, 95% CI) | 15.92 [1.81, 140.16] |
| 3 Pain Show forest plot | 2 | Odds Ratio (M‐H, Random, 95% CI) | Subtotals only | |
| 3.1 Streptokinase vs control | 1 | 47 | Odds Ratio (M‐H, Random, 95% CI) | 3.00 [0.12, 77.47] |
| 3.2 NSAID vs opiate (in requiring rescue analgesia) | 1 | 320 | Odds Ratio (M‐H, Random, 95% CI) | 1.73 [1.08, 2.78] |
| 4 Mortality Show forest plot | 3 | Odds Ratio (M‐H, Random, 95% CI) | Subtotals only | |
| 4.1 Mixed particle talc vs graded talc | 1 | 43 | Odds Ratio (M‐H, Random, 95% CI) | 0.88 [0.25, 3.07] |
| 4.2 Talc pleurodesis vs VATS partial pleurectomy | 1 | 175 | Odds Ratio (M‐H, Random, 95% CI) | 0.92 [0.45, 1.90] |
| 4.3 NSAIDs vs opiates for analgesia | 1 | 320 | Odds Ratio (M‐H, Random, 95% CI) | 1.36 [0.87, 2.12] |
| Outcome or subgroup title | No. of studies | No. of participants | Statistical method | Effect size |
| 1 Pleurodesis failure rate Show forest plot | 2 | Odds Ratio (M‐H, Random, 95% CI) | Subtotals only | |
| 1.1 Silver nitrate vs talc slurry | 1 | 25 | Odds Ratio (M‐H, Random, 95% CI) | 0.17 [0.01, 4.68] |
| 1.2 Silver nitrate vs tetracycline | 1 | 50 | Odds Ratio (M‐H, Random, 95% CI) | 1.66 [0.41, 6.78] |
| 2 Fever Show forest plot | 2 | Odds Ratio (M‐H, Random, 95% CI) | Subtotals only | |
| 2.1 Silver nitrate vs talc slurry | 1 | 60 | Odds Ratio (M‐H, Random, 95% CI) | 1.43 [0.31, 6.61] |
| 2.2 Silver nitrate vs tetracycline | 1 | 50 | Odds Ratio (M‐H, Random, 95% CI) | 0.00 [0.00, 0.06] |
| 3 Pain Show forest plot | 1 | 50 | Odds Ratio (M‐H, Fixed, 95% CI) | 0.02 [0.00, 0.33] |
| 3.1 Silver nitrate vs tetracycline | 1 | 50 | Odds Ratio (M‐H, Fixed, 95% CI) | 0.02 [0.00, 0.33] |
| 4 Mortality Show forest plot | 1 | 50 | Odds Ratio (M‐H, Fixed, 95% CI) | 0.0 [0.0, 0.0] |
| Outcome or subgroup title | No. of studies | No. of participants | Statistical method | Effect size |
| 1 Pleurodesis failure rate Show forest plot | 4 | Odds Ratio (M‐H, Random, 95% CI) | Subtotals only | |
| 1.1 Cisplatin vs cisplatin and bevacizumab | 1 | 70 | Odds Ratio (M‐H, Random, 95% CI) | 5.00 [1.66, 15.09] |
| 1.2 Cisplatin vs OK‐432 | 1 | 34 | Odds Ratio (M‐H, Random, 95% CI) | 2.06 [0.52, 8.17] |
| 1.3 Cisplatin vs OK‐432 and cisplatin | 1 | 32 | Odds Ratio (M‐H, Random, 95% CI) | 25.67 [2.68, 245.84] |
| 1.4 Cisplatin vs rAd‐p53 and cisplatin | 1 | 35 | Odds Ratio (M‐H, Random, 95% CI) | 4.67 [0.99, 22.03] |
| 1.5 Cisplatin vs cisplatin and endostatin | 1 | 128 | Odds Ratio (M‐H, Random, 95% CI) | 2.35 [1.07, 5.12] |
| 2 Fever Show forest plot | 2 | Odds Ratio (M‐H, Random, 95% CI) | Subtotals only | |
| 2.1 Cisplatin vs OK‐432 | 1 | 34 | Odds Ratio (M‐H, Random, 95% CI) | 0.00 [0.00, 0.07] |
| 2.2 Cisplatin vs OK‐432 and cisplatin | 1 | 32 | Odds Ratio (M‐H, Random, 95% CI) | 0.05 [0.01, 0.52] |
| 2.3 Cisplatin vs rAd‐p53 and cisplatin | 1 | 35 | Odds Ratio (M‐H, Random, 95% CI) | 0.09 [0.02, 0.51] |
| 3 Pain Show forest plot | 1 | Odds Ratio (M‐H, Random, 95% CI) | Subtotals only | |
| 3.1 Cisplatin vs OK‐432 | 1 | 34 | Odds Ratio (M‐H, Random, 95% CI) | 0.15 [0.03, 0.87] |
| 3.2 Cisplatin vs OK‐432 and cisplatin | 1 | 32 | Odds Ratio (M‐H, Random, 95% CI) | 0.2 [0.03, 1.21] |
| 4 Mortality Show forest plot | 3 | Odds Ratio (M‐H, Random, 95% CI) | Subtotals only | |
| 4.1 Cisplatin vs OK‐432 | 1 | 34 | Odds Ratio (M‐H, Random, 95% CI) | 0.76 [0.18, 3.23] |
| 4.2 Cisplatin vs combination OK‐432 and cisplatin | 1 | 32 | Odds Ratio (M‐H, Random, 95% CI) | 1.67 [0.32, 8.59] |
| 4.3 Cisplatin vs combination rAd‐p53 and cisplatin | 1 | 35 | Odds Ratio (M‐H, Random, 95% CI) | 0.0 [0.0, 0.0] |
| 4.4 Cisplatin vs combination cisplatin and endostatin | 1 | 128 | Odds Ratio (M‐H, Random, 95% CI) | 1.29 [0.57, 2.93] |
| Outcome or subgroup title | No. of studies | No. of participants | Statistical method | Effect size |
| 1 Pleurodesis failure rate Show forest plot | 1 | 79 | Odds Ratio (M‐H, Random, 95% CI) | 0.79 [0.22, 2.82] |
| Outcome or subgroup title | No. of studies | No. of participants | Statistical method | Effect size |
| 1 Pleurodesis failure rate Show forest plot | 1 | Odds Ratio (M‐H, Random, 95% CI) | Subtotals only | |
| 1.1 Silver nitrate 90 mg vs 150 mg | 1 | 40 | Odds Ratio (M‐H, Random, 95% CI) | 0.0 [0.0, 0.0] |
| 1.2 Silver nitrate 90 mg vs 180 mg | 1 | 40 | Odds Ratio (M‐H, Random, 95% CI) | 0.18 [0.01, 4.01] |
| 1.3 Silver nitrate 150 mg vs 180 mg | 1 | 40 | Odds Ratio (M‐H, Random, 95% CI) | 0.18 [0.01, 4.01] |
| 2 Fever Show forest plot | 1 | Odds Ratio (M‐H, Random, 95% CI) | Subtotals only | |
| 2.1 Silver nitrate 90 mg vs 150 mg | 1 | 40 | Odds Ratio (M‐H, Random, 95% CI) | 0.63 [0.09, 4.24] |
| 2.2 Silver nitrate 90 mg vs 180 mg | 1 | 40 | Odds Ratio (M‐H, Random, 95% CI) | 1.0 [0.13, 7.89] |
| 2.3 Silver nitrate 150 mg vs 180 mg | 1 | 40 | Odds Ratio (M‐H, Random, 95% CI) | 1.59 [0.24, 10.70] |
| 3 Pain Show forest plot | 1 | Odds Ratio (M‐H, Random, 95% CI) | Subtotals only | |
| 3.1 Silver nitrate 90 mg vs 150 mg | 1 | 40 | Odds Ratio (M‐H, Random, 95% CI) | 1.0 [0.13, 7.89] |
| 3.2 Silver nitrate 90 mg vs 180 mg | 1 | 40 | Odds Ratio (M‐H, Random, 95% CI) | 1.0 [0.13, 7.89] |
| 3.3 Silver nitrate 150 mg vs 180 mg | 1 | 40 | Odds Ratio (M‐H, Random, 95% CI) | 1.0 [0.13, 7.89] |
| 4 Mortality Show forest plot | 1 | Odds Ratio (M‐H, Random, 95% CI) | Subtotals only | |
| 4.1 Silver nitrate 90 mg vs 150 mg | 1 | 39 | Odds Ratio (M‐H, Random, 95% CI) | 3.18 [0.30, 33.58] |
| 4.2 Silver nitrate 90 mg vs 180 mg | 1 | 39 | Odds Ratio (M‐H, Random, 95% CI) | 7.80 [0.38, 161.87] |
| 4.3 Silver nitrate 150 mg vs 180 mg | 1 | 38 | Odds Ratio (M‐H, Random, 95% CI) | 3.16 [0.12, 82.64] |
| Outcome or subgroup title | No. of studies | No. of participants | Statistical method | Effect size |
| 1 Pleurodesis failure rate Show forest plot | 1 | 139 | Odds Ratio (M‐H, Random, 95% CI) | 0.36 [0.18, 0.73] |
| 2 Pain Show forest plot | 1 | 154 | Odds Ratio (M‐H, Fixed, 95% CI) | 0.71 [0.23, 2.15] |
| 3 Mortality Show forest plot | 1 | 154 | Odds Ratio (M‐H, Fixed, 95% CI) | 0.44 [0.17, 1.15] |
| 3.1 Talc via IPC vs IPC – not daily drainage | 1 | 154 | Odds Ratio (M‐H, Fixed, 95% CI) | 0.44 [0.17, 1.15] |
| Outcome or subgroup title | No. of studies | No. of participants | Statistical method | Effect size |
| 1 Pleurodesis failure rate Show forest plot | 2 | 158 | Odds Ratio (M‐H, Random, 95% CI) | 1.44 [0.60, 3.47] |
| 1.1 Autologous blood vs talc slurry | 1 | 110 | Odds Ratio (M‐H, Random, 95% CI) | 1.46 [0.51, 4.16] |
| 1.2 Autologous blood vs tetracycline | 1 | 48 | Odds Ratio (M‐H, Random, 95% CI) | 1.4 [0.28, 7.06] |
| 2 Fever Show forest plot | 2 | 158 | Odds Ratio (M‐H, Fixed, 95% CI) | 0.24 [0.10, 0.61] |
| 2.1 Autologous blood vs talc slurry | 1 | 110 | Odds Ratio (M‐H, Fixed, 95% CI) | 0.25 [0.09, 0.76] |
| 2.2 Autologous blood vs tetracycline | 1 | 48 | Odds Ratio (M‐H, Fixed, 95% CI) | 0.22 [0.04, 1.20] |
| 3 Pain Show forest plot | 2 | 158 | Odds Ratio (M‐H, Fixed, 95% CI) | 0.13 [0.05, 0.32] |
| 3.1 Autologous blood vs talc slurry | 1 | 110 | Odds Ratio (M‐H, Fixed, 95% CI) | 0.28 [0.09, 0.84] |
| 3.2 Autologous blood vs tetracycline | 1 | 48 | Odds Ratio (M‐H, Fixed, 95% CI) | 0.01 [0.00, 0.13] |
| 4 Mortality Show forest plot | 2 | 165 | Odds Ratio (M‐H, Fixed, 95% CI) | 0.72 [0.15, 3.38] |
| 4.1 Autologous blood vs talc slurry | 1 | 117 | Odds Ratio (M‐H, Fixed, 95% CI) | 0.72 [0.15, 3.38] |
| 4.2 Autologous blood vs tetracycline | 1 | 48 | Odds Ratio (M‐H, Fixed, 95% CI) | 0.0 [0.0, 0.0] |
| Outcome or subgroup title | No. of studies | No. of participants | Statistical method | Effect size |
| 1 Pleurodesis failure rate Show forest plot | 1 | 69 | Odds Ratio (M‐H, Fixed, 95% CI) | 1.24 [0.46, 3.34] |
| 2 Mortality Show forest plot | 1 | 71 | Odds Ratio (M‐H, Fixed, 95% CI) | 0.08 [0.00, 1.52] |
| Outcome or subgroup title | No. of studies | No. of participants | Statistical method | Effect size |
| 1 Pleurodesis failure rate Show forest plot | 2 | 64 | Odds Ratio (M‐H, Fixed, 95% CI) | 0.31 [0.10, 0.93] |
| 2 Pain Show forest plot | 1 | 47 | Odds Ratio (M‐H, Fixed, 95% CI) | 1.33 [0.26, 6.74] |
| Outcome or subgroup title | No. of studies | No. of participants | Statistical method | Effect size |
| 1 Pleurodesis failure rate Show forest plot | 1 | 128 | Odds Ratio (M‐H, Fixed, 95% CI) | 0.43 [0.20, 0.93] |
| 2 Mortality Show forest plot | 1 | 128 | Odds Ratio (M‐H, Fixed, 95% CI) | 0.77 [0.34, 1.76] |
| Outcome or subgroup title | No. of studies | No. of participants | Statistical method | Effect size |
| 1 Pleurodesis failure rate Show forest plot | 1 | 60 | Odds Ratio (M‐H, Fixed, 95% CI) | 1.0 [0.06, 16.76] |
| Outcome or subgroup title | No. of studies | No. of participants | Statistical method | Effect size |
| 1 Pleurodesis failure rate Show forest plot | 3 | 291 | Odds Ratio (M‐H, Random, 95% CI) | 0.59 [0.15, 2.35] |
| 1.1 IPC – daily drainage vs talc slurry | 1 | 55 | Odds Ratio (M‐H, Random, 95% CI) | 3.31 [0.88, 12.50] |
| 1.2 IPC – daily drainage vs IPC not daily drainage | 2 | 236 | Odds Ratio (M‐H, Random, 95% CI) | 0.31 [0.17, 0.56] |
| 2 Pain Show forest plot | 3 | 293 | Odds Ratio (M‐H, Fixed, 95% CI) | 0.78 [0.45, 1.34] |
| 2.1 IPC – daily drainage vs talc slurry | 1 | 57 | Odds Ratio (M‐H, Fixed, 95% CI) | 3.22 [0.13, 82.38] |
| 2.2 IPC – daily drainage vs IPC – not daily drainage | 2 | 236 | Odds Ratio (M‐H, Fixed, 95% CI) | 0.74 [0.42, 1.28] |
| 3 Mortality Show forest plot | 3 | 293 | Odds Ratio (M‐H, Fixed, 95% CI) | 0.92 [0.55, 1.53] |
| 3.1 IPC – daily drainage vs talc slurry | 1 | 57 | Odds Ratio (M‐H, Fixed, 95% CI) | 1.70 [0.56, 5.17] |
| 3.2 IPC – daily drainage vs IPC – not daily drainage | 2 | 236 | Odds Ratio (M‐H, Fixed, 95% CI) | 0.77 [0.43, 1.38] |
| Outcome or subgroup title | No. of studies | No. of participants | Statistical method | Effect size |
| 1 Pleurodesis failure rate Show forest plot | 1 | 17 | Odds Ratio (M‐H, Random, 95% CI) | 0.19 [0.02, 1.62] |