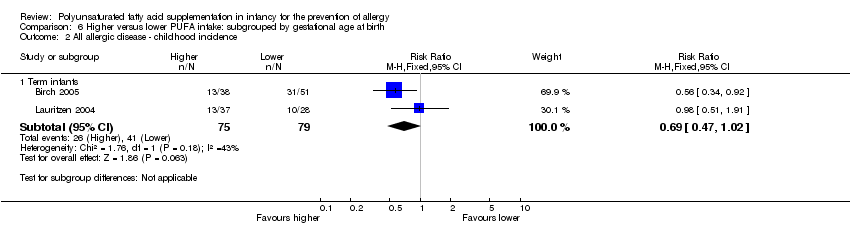
| 1 All allergic disease ‐ infant incidence Show forest plot | 1 | | Risk Ratio (M‐H, Fixed, 95% CI) | Subtotals only |
|
| 1.1 Infant supplementation | 1 | 323 | Risk Ratio (M‐H, Fixed, 95% CI) | 0.96 [0.73, 1.26] |
| 2 All allergic disease ‐ childhood incidence Show forest plot | 2 | | Risk Ratio (M‐H, Fixed, 95% CI) | Subtotals only |
|
| 2.1 Infant supplementation | 1 | 89 | Risk Ratio (M‐H, Fixed, 95% CI) | 0.56 [0.34, 0.92] |
| 2.2 Maternal supplementation | 1 | 65 | Risk Ratio (M‐H, Fixed, 95% CI) | 0.98 [0.51, 1.91] |
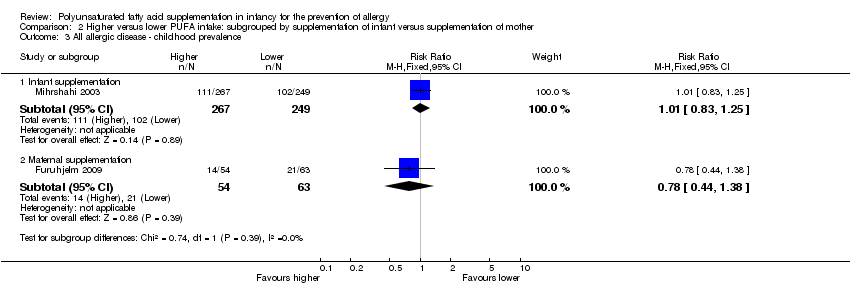
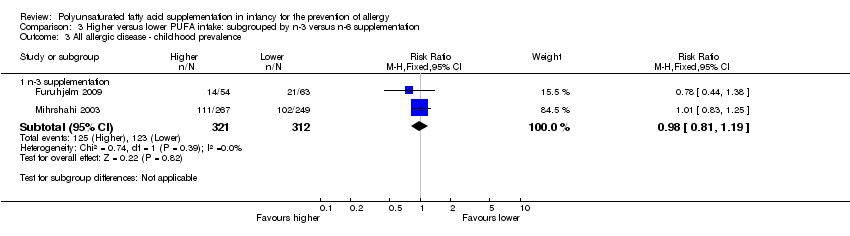
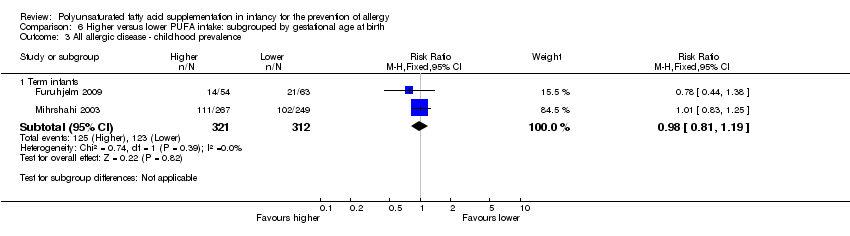
| 3 All allergic disease ‐ childhood prevalence Show forest plot | 2 | | Risk Ratio (M‐H, Fixed, 95% CI) | Subtotals only |
|
| 3.1 Infant supplementation | 1 | 516 | Risk Ratio (M‐H, Fixed, 95% CI) | 1.01 [0.83, 1.25] |
| 3.2 Maternal supplementation | 1 | 117 | Risk Ratio (M‐H, Fixed, 95% CI) | 0.78 [0.44, 1.38] |
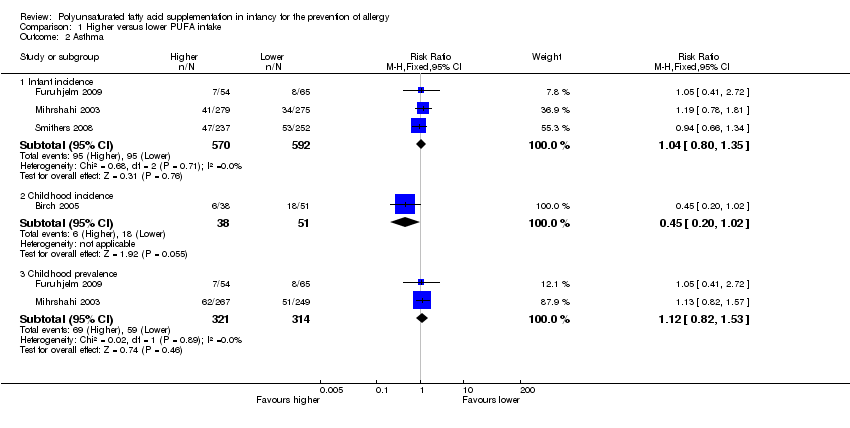
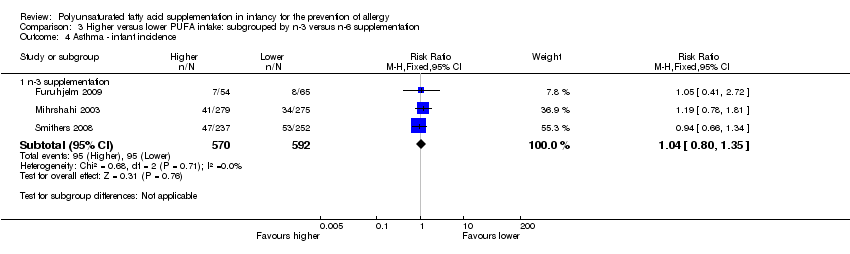
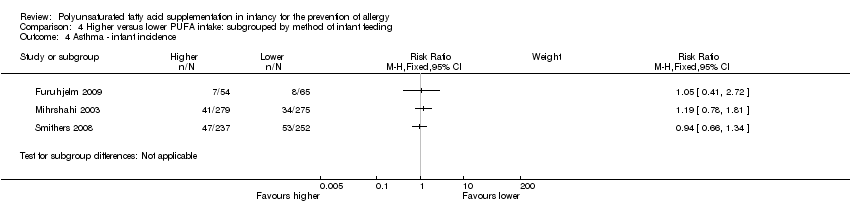
| 4 Asthma ‐ infant incidence Show forest plot | 3 | | Risk Ratio (M‐H, Fixed, 95% CI) | Subtotals only |
|
| 4.1 Infant supplementation | 1 | 554 | Risk Ratio (M‐H, Fixed, 95% CI) | 1.19 [0.78, 1.81] |
| 4.2 Maternal supplementation | 2 | 608 | Risk Ratio (M‐H, Fixed, 95% CI) | 0.96 [0.69, 1.33] |
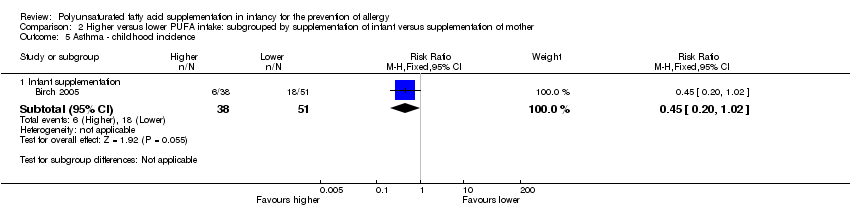
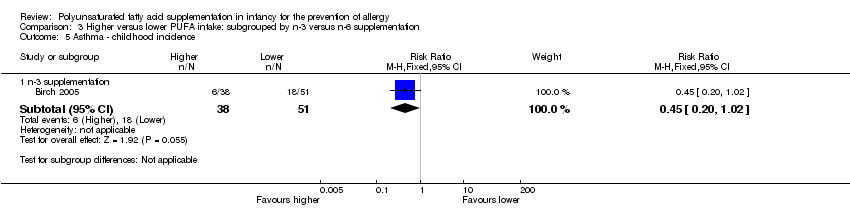
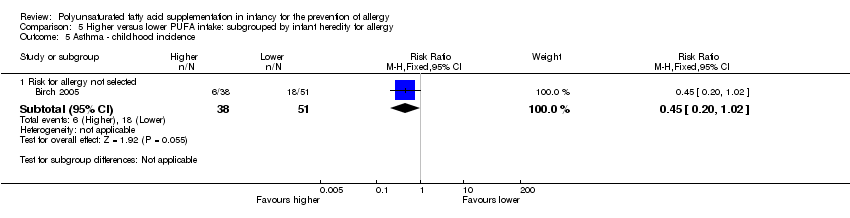
| 5 Asthma ‐ childhood incidence Show forest plot | 1 | | Risk Ratio (M‐H, Fixed, 95% CI) | Subtotals only |
|
| 5.1 Infant supplementation | 1 | 89 | Risk Ratio (M‐H, Fixed, 95% CI) | 0.45 [0.20, 1.02] |
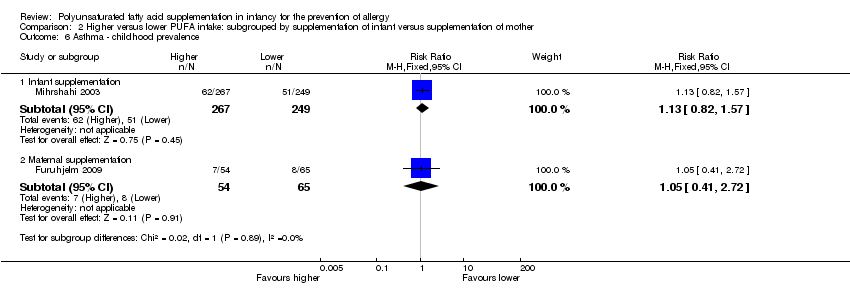
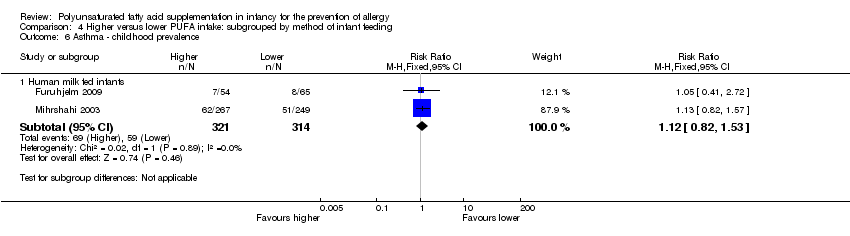
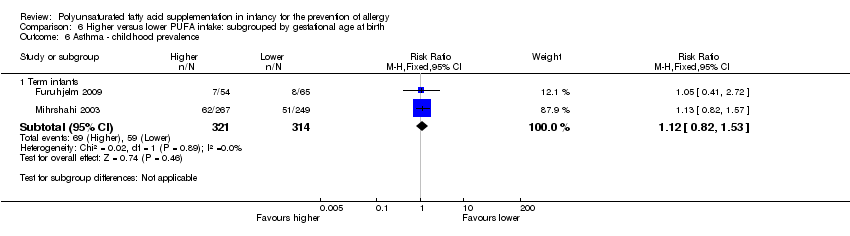
| 6 Asthma ‐ childhood prevalence Show forest plot | 2 | | Risk Ratio (M‐H, Fixed, 95% CI) | Subtotals only |
|
| 6.1 Infant supplementation | 1 | 516 | Risk Ratio (M‐H, Fixed, 95% CI) | 1.13 [0.82, 1.57] |
| 6.2 Maternal supplementation | 1 | 119 | Risk Ratio (M‐H, Fixed, 95% CI) | 1.05 [0.41, 2.72] |
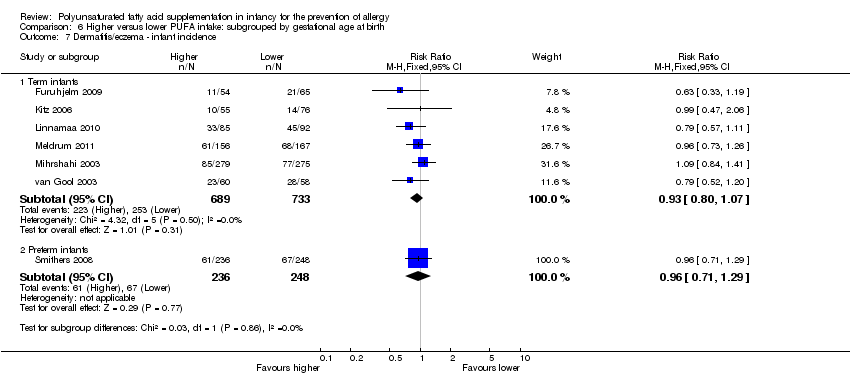
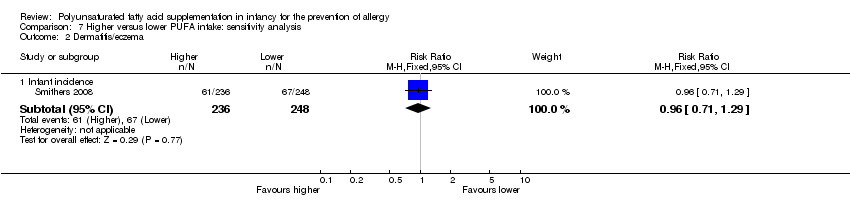
| 7 Dermatitis/eczema ‐ infant incidence Show forest plot | 7 | | Risk Ratio (M‐H, Fixed, 95% CI) | Subtotals only |
|
| 7.1 Infant supplementation | 5 | 1245 | Risk Ratio (M‐H, Fixed, 95% CI) | 0.95 [0.82, 1.11] |
| 7.2 Maternal supplementation | 3 | 661 | Risk Ratio (M‐H, Fixed, 95% CI) | 0.88 [0.68, 1.15] |
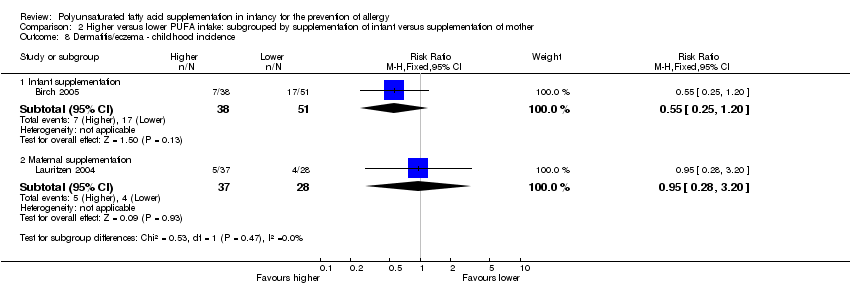
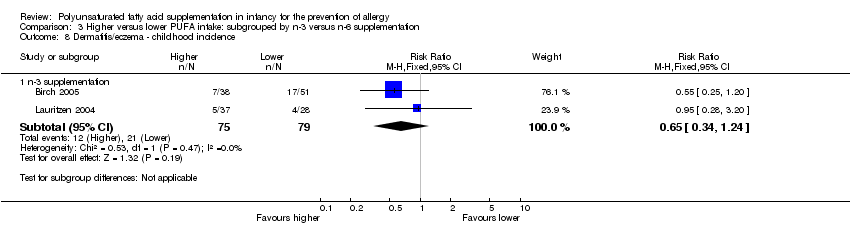
| 8 Dermatitis/eczema ‐ childhood incidence Show forest plot | 2 | | Risk Ratio (M‐H, Fixed, 95% CI) | Subtotals only |
|
| 8.1 Infant supplementation | 1 | 89 | Risk Ratio (M‐H, Fixed, 95% CI) | 0.55 [0.25, 1.20] |
| 8.2 Maternal supplementation | 1 | 65 | Risk Ratio (M‐H, Fixed, 95% CI) | 0.95 [0.28, 3.20] |
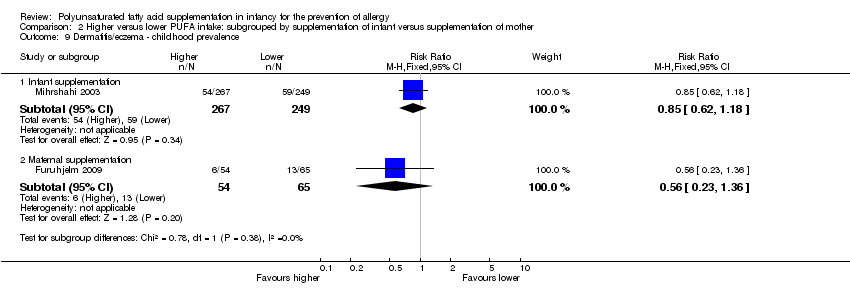
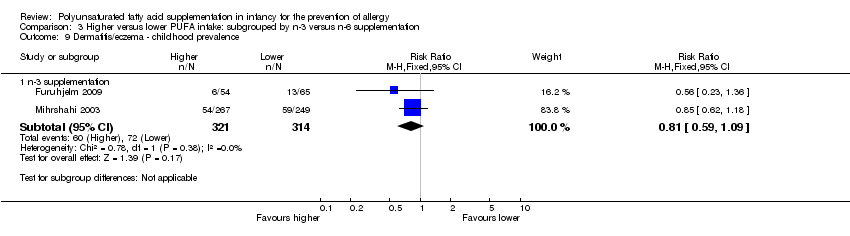
| 9 Dermatitis/eczema ‐ childhood prevalence Show forest plot | 2 | | Risk Ratio (M‐H, Fixed, 95% CI) | Subtotals only |
|
| 9.1 Infant supplementation | 1 | 516 | Risk Ratio (M‐H, Fixed, 95% CI) | 0.85 [0.62, 1.18] |
| 9.2 Maternal supplementation | 1 | 119 | Risk Ratio (M‐H, Fixed, 95% CI) | 0.56 [0.23, 1.36] |
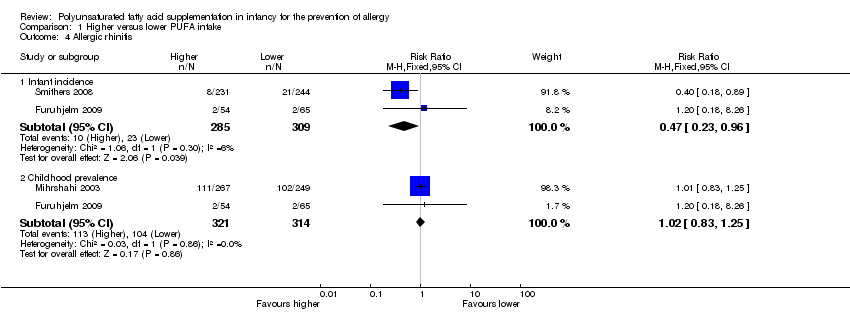
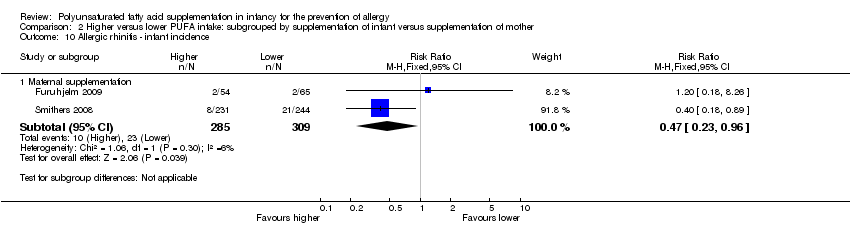
| 10 Allergic rhinitis ‐ infant incidence Show forest plot | 2 | | Risk Ratio (M‐H, Fixed, 95% CI) | Subtotals only |
|
| 10.1 Maternal supplementation | 2 | 594 | Risk Ratio (M‐H, Fixed, 95% CI) | 0.47 [0.23, 0.96] |
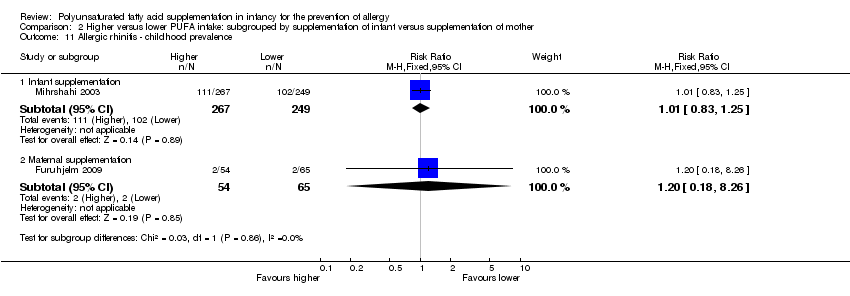
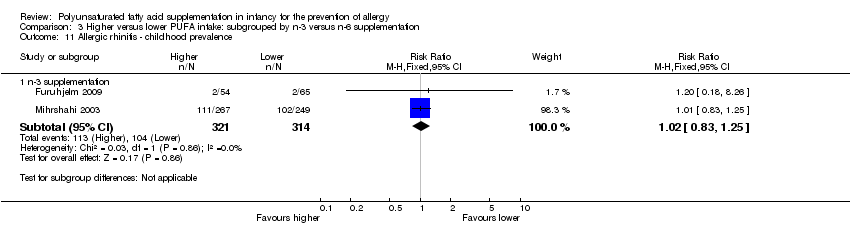
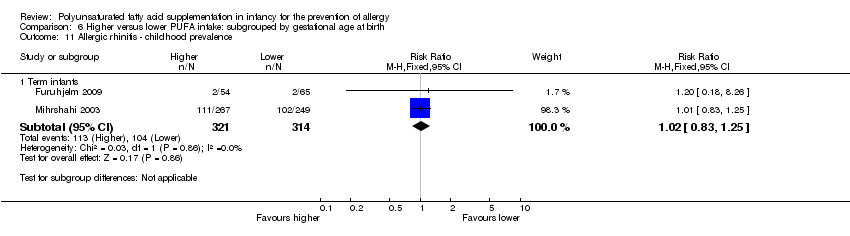
| 11 Allergic rhinitis ‐ childhood prevalence Show forest plot | 2 | | Risk Ratio (M‐H, Fixed, 95% CI) | Subtotals only |
|
| 11.1 Infant supplementation | 1 | 516 | Risk Ratio (M‐H, Fixed, 95% CI) | 1.01 [0.83, 1.25] |
| 11.2 Maternal supplementation | 1 | 119 | Risk Ratio (M‐H, Fixed, 95% CI) | 1.20 [0.18, 8.26] |
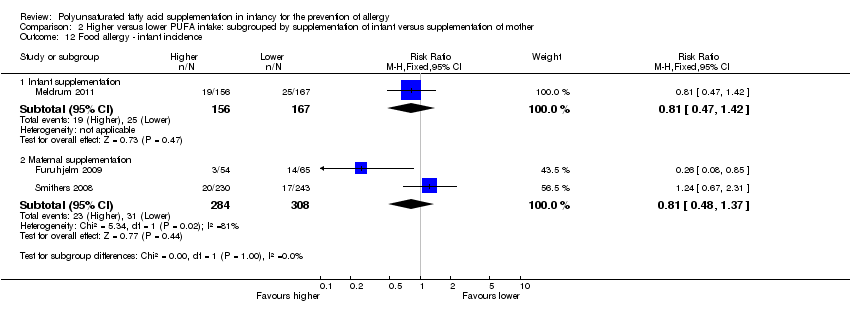
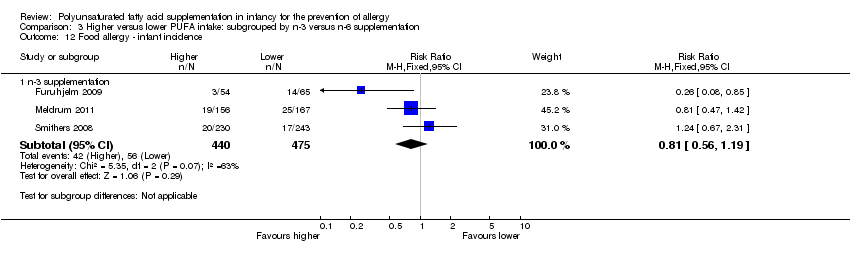
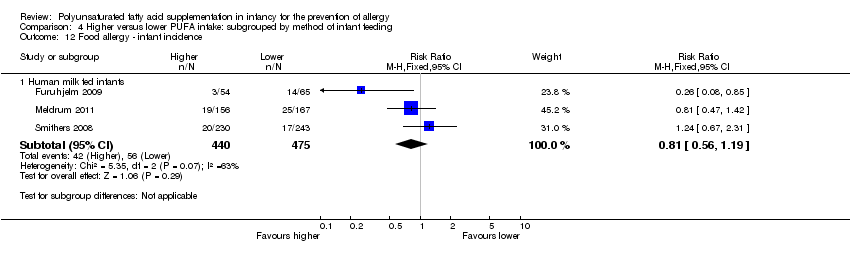
| 12 Food allergy ‐ infant incidence Show forest plot | 3 | | Risk Ratio (M‐H, Fixed, 95% CI) | Subtotals only |
|
| 12.1 Infant supplementation | 1 | 323 | Risk Ratio (M‐H, Fixed, 95% CI) | 0.81 [0.47, 1.42] |
| 12.2 Maternal supplementation | 2 | 592 | Risk Ratio (M‐H, Fixed, 95% CI) | 0.81 [0.48, 1.37] |
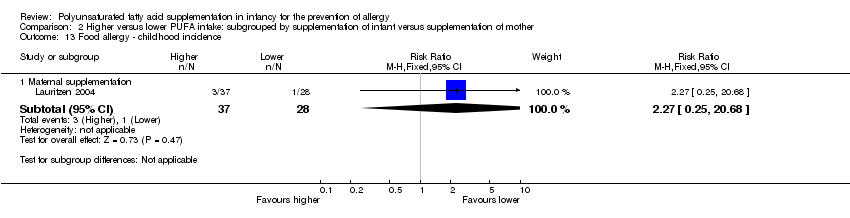
| 13 Food allergy ‐ childhood incidence Show forest plot | 1 | | Risk Ratio (M‐H, Fixed, 95% CI) | Subtotals only |
|
| 13.1 Maternal supplementation | 1 | 65 | Risk Ratio (M‐H, Fixed, 95% CI) | 2.27 [0.25, 20.68] |
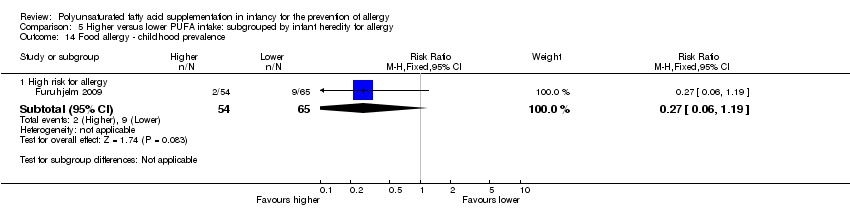
| 14 Food allergy ‐ childhood prevalence Show forest plot | 1 | | Risk Ratio (M‐H, Fixed, 95% CI) | Subtotals only |
|
| 14.1 Maternal supplementation | 1 | 119 | Risk Ratio (M‐H, Fixed, 95% CI) | 0.27 [0.06, 1.19] |