Administración de suplementos de ácidos grasos poliinsaturados a los lactantes para la prevención de la alergia
Referencias
References to studies included in this review
References to studies excluded from this review
References to ongoing studies
Additional references
Characteristics of studies
Characteristics of included studies [ordered by study ID]
| Methods | Multicentre, double‐blind RCT in USA | |
| Participants | 2 cohorts from previously completed RCTs (cohort A and B) Inclusion criteria: infants (not selected for risk of allergy); gestation 37 to 40 weeks; birth weight appropriate for gestational age; singleton birth; exclusively formula fed Exclusion criteria: family history of milk protein allergy or genetic or familial eye disease; maternal vegetarian or vegan dietary patterns; maternal metabolic disease, anaemia or infection; congenital malformation or infection; jaundice, perinatal asphyxia or meconium aspiration; neonatal intensive care unit admission | |
| Interventions | Infants randomised to AA + DHA supplement for first year of life Control (n = 90): Enfamil formula with iron (LA 8.5 g/L, α‐LA 0.9 g/L) (n‐3:n‐6 ratio = 1:9) Intervention: control formula with added AA/DHA formula (n = 89): (LA 8.4 g/L, AA 0.4 g/L, α‐LA 0.9 g/L, DHA 0.2 g/L) (n‐3:n‐6 ratio = 1:8) Control group intermediate‐high PUFA intake, intervention group high PUFA intake Co‐interventions: none reported | |
| Outcomes | Primary outcome (cohort A): visual cortex maturity as assessed by sweep visual evoked potential acuity Primary outcome (cohort B): metabolic parameters including lipoprotein profile, antioxidant status and hydroelectrolytic balance Outcome assessed: incidence of respiratory infections and allergic disease in first 3 years of life (infant allergy incidence) | |
| Notes | Supported by Mead Johnson Nutrition Co‐authors employees of Mead Johnson Nutrition | |
| Risk of bias | ||
| Bias | Authors' judgement | Support for judgement |
| Random sequence generation (selection bias) | Unclear risk | Cohort A: all infants were randomly assigned with the use of a single randomisation schedule at a central location. The randomisation schedule had random length blocks (block length varied from 6 to 12) and was provided in individual sealed envelopes to the study site Cohort B: method not reported |
| Allocation concealment (selection bias) | Low risk | |
| Blinding of participants and personnel (performance bias) | Low risk | Cohort A: each diet masked by colour and number code Cohort B: reported to be "double blind" but details not reported |
| Blinding of outcome assessment (detection bias) | Low risk | |
| Incomplete outcome data (attrition bias) | High risk | 90/179 (50%) no outcome data |
| Selective reporting (reporting bias) | High risk | Allergy not prespecified but reported |
| Other bias | Low risk | Groups well balanced after allocation |
| Methods | Multicentre 2 x 2 factorial RCT in Denmark May to October 2003 | |
| Participants | Singleton term infants supplemented from 9 to 12 months with a birth weight > 2500 g and above the 5th percentile for gestational age, a 5‐minute Apgar score ≥ 7, no major complications at birth or in fetal life, and no chronic diseases, with a daily consumption of cow's milk or infant formula | |
| Interventions | Infants supplemented from 9 to 12 months Intervention (n = 45): fish oil 5 mL/day (high PUFA intake) (LCPUFA 352 g/L n‐3 60% EPA and 40% DHA and cholesterol 3 g/L; mean fish oil consumption 3.3 mL/day n‐3 LCPUFA 924 mg/day) Control (n = 49): no fish oil (intermediate PUFA intake) Infants were also randomly assigned to drink either cow's milk or standard infant formula (no LCPUFA 18:2(n‐6) and 18:3(n‐3) in a ratio of 8:1) | |
| Outcomes | Blood pressure, FA profile, growth up to 12 months Allergy: at the end of the intervention period of 3 months, parents were interviewed about infant diet, growth and allergy diagnoses using questions validated for atopic dermatitis. Only reported allergic tendencies (itchy rash, wheezing or food allergy) as verified by a doctor | |
| Notes | Allergy data only reported at baseline | |
| Risk of bias | ||
| Bias | Authors' judgement | Support for judgement |
| Random sequence generation (selection bias) | Unclear risk | Method not reported. Randomisation done within clusters of 12 by drawing notes from 1 envelope for each intervention |
| Allocation concealment (selection bias) | Low risk | Parents who agreed to the principle of randomisations and whose infants met the inclusion criteria were invited to an individual introduction visit |
| Blinding of participants and personnel (performance bias) | High risk | Unmasked |
| Blinding of outcome assessment (detection bias) | High risk | |
| Incomplete outcome data (attrition bias) | High risk | 11/91 (12%) lost at 12 months |
| Selective reporting (reporting bias) | High risk | Allergy not a stated primary outcome but reported |
| Other bias | High risk | Baseline differences between groups |
| Methods | Multicentre RCT in UK April 1995 and July 1997 | |
| Participants | Preterm neonates birth weight ≤ 2000 g supplemented until 9 months' corrected age (formula fed) | |
| Interventions | Intervention (n = 122): fish oil LCPUFA supplemented formula (EPA 0.1%; γ‐LA 0.9%; AA 0.04%; DHA 0.5%) (intermediate‐high PUFA intake) Control (n = 116): borage oil supplemented formula (no EPA; γ‐LA; AA; DHA) (intermediate PUFA intake) | |
| Outcomes | Growth, development up to 18 months Prevalence of asthma, eczema recorded but not reported | |
| Notes | Did not report allergy | |
| Risk of bias | ||
| Bias | Authors' judgement | Support for judgement |
| Random sequence generation (selection bias) | Low risk | Random permuted block allocation with assignments kept in sealed opaque envelopes and opened at the point of randomisation |
| Allocation concealment (selection bias) | Low risk | |
| Blinding of participants and personnel (performance bias) | Low risk | Trial formulas were identical in appearance and smell. Blinding was maintained until |
| Blinding of outcome assessment (detection bias) | Low risk | |
| Incomplete outcome data (attrition bias) | High risk | 121/238 (51%) lost at 18 months; 131/238 (55%) lost at 10 years |
| Selective reporting (reporting bias) | High risk | Allergy not prespecified, recorded but not reported |
| Other bias | Unclear risk | Some baseline imbalances between groups |
| Methods | Multicentre, double‐blind RCT in Sweden March 2003 to June 2005 | |
| Participants | Pregnant women with at least 1 first‐degree relative with current or previous allergic symptoms (i.e. bronchial asthma, eczema, allergic food reactions, itching and running eyes and nose at exposure to pollen, pets or other known allergens) Exclusion criteria: allergy to soy or fish; treatment with anticoagulants or n‐3 FA supplements | |
| Interventions | Mothers randomised to n‐3 FA supplement from 25th week of gestation until cessation of breastfeeding mean 3 to 4 months Control (n = 75): supplemented with soy bean oil (LA 2.5 g, α‐LA 0.2 g; n‐3:n‐6 ratio = 1:9) Intervention (n = 70): supplemented with DHA 1.1 g + EPA 1.6 g (n‐3:n‐6 ratio: n‐3 only) Control group intermediate‐high PUFA intake, intervention group high PUFA intake | |
| Outcomes | Primary outcome: allergic sensitisation and disease in first 2 years Paediatric allergy research nurses examined children at 3, 6 and 12 months In case of eczema or a food reaction a paediatrician also examined the child Food allergy was defined as: gastrointestinal symptoms, hives, aggravated eczema or wheeze following ingestion of egg or milk in the presence of detectable IgE antibodies or a positive SPT to the particular food. Recovery from symptoms after elimination of the particular food from the diet and reoccurrence after ingestion of the food was required for the diagnosis IgE‐associated eczema: reoccurring and itching eczematous, lichenified or nummular dermatitis according to the criteria modified by Oranje in 1995 (Oranje 1995) in the presence of detectable IgE antibodies or positive SPT towards egg, milk or wheat | |
| Notes | Supported by GlaxoSmithKline, Sweden Note: childhood prevalence reported at 24 months | |
| Risk of bias | ||
| Bias | Authors' judgement | Support for judgement |
| Random sequence generation (selection bias) | Unclear risk | Producer performed block randomisation. Method not reported |
| Allocation concealment (selection bias) | Low risk | Recruited ... then accepted participation in a randomised study |
| Blinding of participants and personnel (performance bias) | Low risk | Mothers and study personnel blinded to group allocation. Capsules could not be distinguished from each other |
| Blinding of outcome assessment (detection bias) | Low risk | |
| Incomplete outcome data (attrition bias) | High risk | 29/145 (20%) no outcome data |
| Selective reporting (reporting bias) | Low risk | Primary outcome: allergic sensitisation and disease during the first year of life |
| Other bias | Low risk | Groups similar at baseline |
| Methods | Single centre RCT in USA before 1992 | |
| Participants | Term neonates fed fat‐modified formulas until 4 months of age (formula fed) | |
| Interventions | Control (n = 15): coconut oil/soybean oil formula (LA 25%, α‐LA 2.5%) (intermediate PUFA intake) Intervention (n = 15): corn oil/soybean oil formula (LA 58.5%, α‐LA 2.0%) (intermediate‐high PUFA intake) | |
| Outcomes | FA profile, growth up to 4 months of age. Parents recorded a diary before each visit including formula acceptance and tolerance | |
| Notes | Did not report allergy | |
| Risk of bias | ||
| Bias | Authors' judgement | Support for judgement |
| Random sequence generation (selection bias) | Unclear risk | Method not reported |
| Allocation concealment (selection bias) | Unclear risk | Details not reported |
| Blinding of participants and personnel (performance bias) | Unclear risk | Method not reported |
| Blinding of outcome assessment (detection bias) | Unclear risk | Method not reported |
| Incomplete outcome data (attrition bias) | Low risk | No loss to follow‐up |
| Selective reporting (reporting bias) | High risk | The parent reported diarrhoea, vomiting, spitting up, prolonged crying (colic), rash, runny nose, wheezing, constipation, appetite changes or other notable conditions |
| Other bias | Unclear risk | Baseline characteristics not reported |
| Methods | Multicentre RCT in USA before 2008 | |
| Participants | Term neonates with birth weight > 2500 g supplemented until 4 months of age (formula fed) Exclusion criteria: history of underlying disease or malformation that could interfere with growth and development; large‐for‐gestational‐age infants whose mothers had diabetes; breastfeeding within 24 hours prior to randomisation; evidence of formula intolerance or poor intake at time of randomisation; weight at randomisation < 98% of birth weight; enlarged liver or spleen; or plans to move outside area | |
| Interventions | Intervention (n = 124): soy formula with DHA 17 mg/100 kcal + AA 34 mg/100 kcal (intermediate PUFA intake) Control (n = 120): soy formula without DHA + AA (intermediate PUFA intake) | |
| Outcomes | FA profile, growth up to 4 months of age. Used SCORAD assessment of atopic dermatitis. Recorded adverse events | |
| Notes | Reported atopic dermatitis severity but not incidence | |
| Risk of bias | ||
| Bias | Authors' judgement | Support for judgement |
| Random sequence generation (selection bias) | Unclear risk | Method not reported |
| Allocation concealment (selection bias) | Unclear risk | Details not reported |
| Blinding of participants and personnel (performance bias) | Unclear risk | Method not reported |
| Blinding of outcome assessment (detection bias) | Unclear risk | Method not reported |
| Incomplete outcome data (attrition bias) | High risk | 62/244 (25%) did not complete study |
| Selective reporting (reporting bias) | High risk | Atopic dermatitis assessed using SCORAD indices prespecified but incidence not reported |
| Other bias | Unclear risk | Some baseline differences |
| Methods | Multicentre, double‐blind RCT in Germany before 2006 | |
| Participants | Inclusion criteria: full term infants; at least 1 first‐degree relative with atopic disease Exclusion criteria: newborns unable to be fed orally; severe concurrent disease | |
| Interventions | Infants randomised to γ‐LA supplement for first 5 months of life Stratification into 3 groups based on maternal decision whether to breastfeed within the first 2 days of life Exclusively breastfed infants (n = 58) Control 1 (n = 37): whey hydrolysate Intervention 1 (n = 21): whey hydrolysate + γ‐LA 0.1 g (n‐3:n‐6 ratio: n‐6 only) (γ‐LA supplement) Both groups intermediate PUFA intake Breast and formula fed infants (n = 53) Control 2 (n = 31): maternal whey or whey formula (γ‐LA <0.1 g) Intervention 2 (n = 22): maternal whey + γ‐LA 0.1 g or whey formula + γ‐LA 0.2 g (n‐3:n‐6 ratio: n‐6 only) (γ‐LA supplement) Both groups intermediate‐high PUFA intake Exclusively formula fed infants (n = 20) Control 3 intervention (n = 8): whey formula (γ‐LA < 0.1 g) Intervention 3 (n = 12): whey formula + γ‐LA 0.2 g (n‐3:n‐6 ratio: n‐6 only) (γ‐LA supplement) Both groups high PUFA intake Co‐interventions: none reported | |
| Outcomes | Primary outcome: atopic dermatitis in first 12 months of life Secondary outcome: serum IgE level at 12 months Study participants seen at 1 week, 4 and 12 months. Skin atopy score of atopic dermatitis (SCORAD) used. Diagnosis of atopic eczema was made by the criteria of Hanifin (Hanifin 1980) Total serum IgE determined at birth, age of 4 and 12 months | |
| Notes | No conflict of interest declared | |
| Risk of bias | ||
| Bias | Authors' judgement | Support for judgement |
| Random sequence generation (selection bias) | Unclear risk | Method not reported |
| Allocation concealment (selection bias) | Unclear risk | Method not reported |
| Blinding of participants and personnel (performance bias) | Unclear risk | Reported to be "double‐blind" but details not reported |
| Blinding of outcome assessment (detection bias) | Unclear risk | Reported to be "double‐blind" but details not reported |
| Incomplete outcome data (attrition bias) | Low risk | 6/137 (4%) not followed due to non‐compliance |
| Selective reporting (reporting bias) | Unclear risk | No primary outcome stated. Eczema reported at 3 time points |
| Other bias | Unclear risk | Baseline characteristics not reported |
| Methods | Multicentre, double‐blind RCT with parallel reference group in Denmark December 1998 to November 1999 | |
| Participants | Maternal inclusion criteria: pregnant women; fish intake below population median (n‐3 LCPUFA < 0.4 g/day); uncomplicated pregnancy; pre‐pregnancy BMI < 30 kg/m2; no metabolic disorders; intention to breastfeed for at least 4 months of age Infant inclusion criteria: healthy; term; singleton; birth weight appropriate for gestational age; Apgar score > 7; able to start supplements within 2 weeks of birth (not selected for risk of allergy) | |
| Interventions | Breastfeeding mothers randomised to supplement for the first 4 months of life Control (n = 60): olive oil (predominantly n‐9) (intermediate PUFA intake) Intervention (n = 62): supplemented with fish oil 4 g/day (n‐3 LCPUFA 1.5 g; n‐3:n‐6 ratio = n‐3 only) (high PUFA intake) Co‐interventions: none reported | |
| Outcomes | Primary outcomes: breast milk FA composition; n‐3 PUFA levels in infant erythrocytes; infant development during the first year of life Secondary outcomes: immune function as assessed by cytokine responses Allergy: parent interviews about allergy diagnoses in the child, signs of allergic tendencies, and family history of allergy using validated questionnaire for atopic dermatitis at 2.5 years. Allergic tendencies (itchy rash, wheezing or food allergy) verified by a doctor | |
| Notes | No conflict of interest declared Allergic tendencies verified by doctor used for review | |
| Risk of bias | ||
| Bias | Authors' judgement | Support for judgement |
| Random sequence generation (selection bias) | Low risk | Random block‐wise allocation to the supplement groups was applied in blocks of 2 in 5 strata according to mean parental education |
| Allocation concealment (selection bias) | Low risk | |
| Blinding of participants and personnel (performance bias) | Low risk | Investigators and families blinded to randomisation throughout the first year of life |
| Blinding of outcome assessment (detection bias) | Low risk | |
| Incomplete outcome data (attrition bias) | High risk | 68/122 (56%) no follow‐up data |
| Selective reporting (reporting bias) | High risk | Allergy not prespecified. Time point for assessment not prespecified |
| Other bias | Low risk | Groups well balanced after allocation |
| Methods | Multicentre, double‐blind RCT in Finland 2004 to 2008 | |
| Participants | Inclusion criteria: pregnant women (not selected for risk of allergy); <16 weeks' gestation; preterm and sick infants excluded after randomisation | |
| Interventions | Mothers randomised to blackcurrant seed oil supplement from 8 to 16 weeks' gestation through exclusive breastfeeding period. Infants supplemented with same oil 1 mL/day after exclusive breastfeeding period until 2 years Control (n = 162): supplemented with placebo = olive oil 3 g/day (LA 9%; no γ‐LA or α‐LA or stearidonic acid; predominantly oleic acid 73%: n‐9). Infants 1 mL/day to 2 years (intermediate PUFA intake) Intervention (n = 151): supplemented with blackcurrant seed oil 3 g/day (LA 48%, γ‐LA 13%, α‐LA 14%, stearidonic acid 3%; oleic acid 14%) (n‐3:n‐6 ratio 1:4). Infants 1 mL/day to 2 years (high PUFA intake) Co‐interventions: none reported | |
| Outcomes | Primary outcome: atopic dermatitis in first 12 months Secondary outcomes: atopic dermatitis in first 2 years; serum IgE level and SPT during first 2 years; FA analysis A specialist in dermatology evaluated the skin of each child at each visit. Atopic dermatitis was defined as a chronic or relapsing itchy dermatitis with a characteristic morphology and distribution. The SCORAD index used to assess dermatitis severity Skin tests were carried out at 3‐, 12‐ and 24‐month visits | |
| Notes | No conflict of interest declared Note: data for eczema calculated from percentages in paper | |
| Risk of bias | ||
| Bias | Authors' judgement | Support for judgement |
| Random sequence generation (selection bias) | Low risk | Assigned by a random number list .... immediately after the mother was enrolled |
| Allocation concealment (selection bias) | Low risk | Randomisation performed by personnel not involved in recruitment or subsequent assessment |
| Blinding of participants and personnel (performance bias) | Low risk | Oils could not be distinguished from each other |
| Blinding of outcome assessment (detection bias) | Low risk | Randomisation performed by personnel not involved in recruitment or subsequent assessment |
| Incomplete outcome data (attrition bias) | High risk | 145/322 (45%) lost to follow‐up |
| Selective reporting (reporting bias) | Low risk | Prespecified atopic dermatitis by the age of 12 months as primary outcome |
| Other bias | Low risk | Groups similar at baseline |
| Methods | Multicentre RCT in UK 1993 to 1995 | |
| Participants | Women giving birth to healthy singletons of appropriate size for gestational age and > 37 weeks' gestation supplemented until 6 months of age (formula fed) | |
| Interventions | Intervention (n = 154): LCPUFA supplemented formula (AA 0.30% and DHA 0.32% obtained from purified egg phospholipid and triglyceride fractions) (intermediate PUFA intake) Control (n = 155): unsupplemented formula (intermediate PUFA intake) | |
| Outcomes | Primary outcome: 'explore efficacy and safety outcomes' Other outcomes: development, growth, safety data until 18 months. History of eczema (coded as none, possibly some, small patches, small areas requiring regular use of steroid cream or widespread eczema with itching and scratching; the latter 3 categories were considered as eczema), wheeze, and asthma recorded. Summary of reports of infection and atopy compared at 9 months | |
| Notes | Nestec Ltd (Switzerland) for collaboration, funding and supply of trial diets Allergy outcomes reported as odds ratios (95% CI) | |
| Risk of bias | ||
| Bias | Authors' judgement | Support for judgement |
| Random sequence generation (selection bias) | Low risk | Random permuted block design stratified by centre and gender concealed by sealed opaque envelopes |
| Allocation concealment (selection bias) | Low risk | |
| Blinding of participants and personnel (performance bias) | Low risk | Mothers and study personnel were unaware of the dietary allocations ‐ differences between the coded formulas were not evident by observation |
| Blinding of outcome assessment (detection bias) | Low risk | |
| Incomplete outcome data (attrition bias) | High risk | 69/309 (22%) lost or excluded at 9 months |
| Selective reporting (reporting bias) | High risk | Multiple allergy endpoints measured |
| Other bias | Unclear risk | Similar at baseline. Substantial withdrawals with differences between groups in numbers lost at 9 months |
| Methods | Single centre RCT in Australia before 2001 | |
| Participants | Healthy 6‐month‐old infants born at term (> 37 weeks' gestation) with birth weights > 2500 g. Supplemented diet of weaning infants between 6 and 12 months of age with 4 eggs per week | |
| Interventions | Breastfed infants Intervention (n = 27): n‐3 eggs x 4 per week (intermediate‐high PUFA intake) Control 1 (n = 27): regular eggs x 4 per week (intermediate PUFA intake) Control 2 (n = 28): no egg supplement (intermediate PUFA intake) Formula fed infants Intervention (n = 26): n‐3 eggs x 4 per week (intermediate‐high PUFA intake) Control 1 (n = 26): regular eggs x 4 per week (intermediate PUFA intake) Control 2 (n = 27): no egg supplement (intermediate PUFA intake) | |
| Outcomes | Primary outcome measures included erythrocyte DHA concentrations, infant iron status and plasma cholesterol concentrations. Secondary outcomes included growth and plasma indexes of atopy (egg yolk and egg white RAST) | |
| Notes | Did not report clinical allergy | |
| Risk of bias | ||
| Bias | Authors' judgement | Support for judgement |
| Random sequence generation (selection bias) | Low risk | Computer generated randomisation schedule. Breastfed and formula fed infants were allocated by using separate schedules |
| Allocation concealment (selection bias) | Low risk | |
| Blinding of participants and personnel (performance bias) | Low risk | Eggs were supplied in plain cartons coded A or B. Note second control group received no eggs |
| Blinding of outcome assessment (detection bias) | Low risk | |
| Incomplete outcome data (attrition bias) | High risk | 23/161 (14%) lost |
| Selective reporting (reporting bias) | Low risk | Allergy not prespecified or reported |
| Other bias | Unclear risk | Some baseline differences |
| Methods | Single centre, double‐blind RCT in Australia June 2005 and October 2008 | |
| Participants | Inclusion criteria: infants; maternal history of doctor diagnosed asthma or allergic rhinitis; maternal SPT positive to at least 1 allergen Exclusion criteria: maternal smoking; autoimmune disease; pre‐existing medical conditions other than asthma; high‐risk pregnancy; seafood allergy; fish eaten > 3 times per week; fish oil supplementation already taken (in excess of 1000 mg/day); pre‐term delivery < 36 week; infant with congenital abnormalities or significant disease not related to intervention | |
| Interventions | Infants (mixed feeding, mostly breastfed) randomised to fish oil supplement for first 6 months of life Control (n = 202): supplemented with olive oil 650 mg (66.6% n‐9 oleic acid) Intervention (n = 218): supplemented with fish oil 650 mg (DHA 0.28 g, EPA 0.11 g) (n‐3:n‐6 ratio n‐3 only) Control group intermediate PUFA intake, intervention group high PUFA intake Co‐interventions: none reported | |
| Outcomes | Primary outcomes: 1. Infant FA status | |
| Notes | No conflict of interest declared. 12‐month assessments reported to date | |
| Risk of bias | ||
| Bias | Authors' judgement | Support for judgement |
| Random sequence generation (selection bias) | Low risk | Randomisation based on computer software (Excel) generation and stratified by block randomisation according to maternal allergy (asthma versus other allergy), parity (first child versus second or more child) and paternal allergy (allergic versus non‐allergic) |
| Allocation concealment (selection bias) | Low risk | |
| Blinding of participants and personnel (performance bias) | Low risk | Placebo capsules used |
| Blinding of outcome assessment (detection bias) | Low risk | Research scientists involved in the assessments will remain blind to the interventions for the duration of the study, until after the completion of the 6‐year clinical visits |
| Incomplete outcome data (attrition bias) | High risk | 97/420 (23%) lost to follow‐up at 12 months |
| Selective reporting (reporting bias) | Low risk | Prespecified allergy outcomes |
| Other bias | Low risk | Groups similar at baseline |
| Methods | Multicentre, parallel‐group RCT in Australia with completion of recruitment January 2000 | |
| Participants | Inclusion criteria: ≥ 1 parent or sibling with symptoms of asthma as assessed by screening questionnaire; reasonable fluency in English; telephone at home; reside within 30 km from centre of recruitment; any method of feeding Exclusion criteria: pet cat at home; families on strict vegetarian diet; multiple births; babies born < 36 weeks' gestation Withdrawal criteria: birth weight < 2.5 kg; babies requiring surgery; babies requiring hospitalisation for > 1 week; babies with significant neonatal disease; babies with congenital malformations | |
| Interventions | Pregnant women randomised at 36 weeks' gestation to dietary FA modification for mother and infant for at least 5 years Control (n = 304): supplemented with Sunola (sunflower) oil 500 mg (n‐3 PUFA < 0.1 g; n‐6 PUFA < 0.1 g) administered to infant when formula introduced, or at 6 months (n‐3:n‐6 ratio = 1:23); family provided with polyunsaturated oils for cooking (intermediate PUFA intake) Intervention (n = 312): supplemented with tuna fish oil 500 mg (n‐3 PUFA 0.2 g, n‐6 PUFA < 0.1 g) administered to infant when formula introduced or at 6 months (n‐3:n‐6 ratio = 6:1); families provided with canola‐based (high n‐3) oils for cooking (high PUFA intake). Co‐interventions: parallel (factorial) randomisation to active house dust mite avoidance | |
| Outcomes | Primary outcomes: asthma symptoms at 18 months; wheeze frequency; physician diagnosed asthma at 18 months; asthma at 3 to 5 years Secondary outcomes: eczema using validated questionnaire; nocturnal cough; allergic symptoms SPT at 18 months | |
| Notes | Contributions of goods and services Allergopharma Joachim Ganzer KG Germany, John Sands Australia, Nu‐Mega Ingredients Pty Ltd. Co‐author consultant arrangements with Merck Sharp & Dohme, Altana Pharma Note: groups with house dust mite avoidance measures were included in the review | |
| Risk of bias | ||
| Bias | Authors' judgement | Support for judgement |
| Random sequence generation (selection bias) | Low risk | Randomised in blocks of 4 sealed in sequentially numbered sealed envelopes |
| Allocation concealment (selection bias) | Low risk | Informed consent 34 to 37 weeks' gestation, randomisation at 36‐week home visit |
| Blinding of participants and personnel (performance bias) | Unclear risk | Placebo supplemented although active supplements had a slight fishy smell |
| Blinding of outcome assessment (detection bias) | Low risk | Research personnel undertaking outcome assessments blinded to group allocation of participants |
| Incomplete outcome data (attrition bias) | High risk | 62/616 (10%) at 18 months; 90/616 (15%) at 3 years; 100/616 (16%) no 5‐year outcome data |
| Selective reporting (reporting bias) | Low risk | The primary aim in children at high risk of allergic disease was the incidence of allergy and asthma at age 5 years |
| Other bias | Low risk | Groups similar at baseline |
| Methods | Single centre RCT in UK before 2000 | |
| Participants | Term neonates supplemented until 12 weeks (formula fed). Participants (n = 140) (numbers per group not specified) | |
| Interventions | Intervention: LCPUFA supplemented formula (AA 0.4% + DHA 0.2%) (intermediate PUFA intake) Control: standard formula (no AA or DHA) (intermediate PUFA intake) | |
| Outcomes | Growth up to 12 months | |
| Notes | Allergic symptoms measured but not reported | |
| Risk of bias | ||
| Bias | Authors' judgement | Support for judgement |
| Random sequence generation (selection bias) | Unclear risk | Following recruitment each participant was block randomised in a double‐blind fashion. Method not reported |
| Allocation concealment (selection bias) | Low risk | |
| Blinding of participants and personnel (performance bias) | Low risk | Coded milk |
| Blinding of outcome assessment (detection bias) | Low risk | |
| Incomplete outcome data (attrition bias) | High risk | 31/140 (22%) withdrawn |
| Selective reporting (reporting bias) | High risk | Measured 'allergic symptoms' but did not report data |
| Other bias | High risk | Differences between groups at baseline |
| Methods | Multicentre RCT in USA October 1996 and January 1998 | |
| Participants | Preterm infants (< 33 weeks' gestation) with birth weight 750 g to 1805 g supplemented until 12 months' corrected age (formula fed) | |
| Interventions | Intervention 1 (n = 283): AA + DHA supplemented formula (fish/fungal oil) (in hospital formula: AA 0.43% + EPA 0.08% + DHA 0.27%; postdischarge preterm formula: AA 0.43% + no EPA + DHA 0.16%) (intermediate‐high PUFA intake) Intervention 2 (n = 283): AA + DHA supplemented formula (egg‐derived triglyceride/fish oil) (in hospital formula: AA 0.41% + no EPA + DHA 0.24%; postdischarge preterm formula: AA 0.41% + no EPA + DHA 0.15%) (intermediate‐high PUFA intake) Control (n = 144): standard formula (no AA or EPA or DHA) (intermediate PUFA intake) | |
| Outcomes | Hospital morbidity, serious adverse events, FA profile, visual acuity, growth, development up to 12 months' corrected age | |
| Notes | Serious adverse events including asthma and wheezing measured but not reported separately | |
| Risk of bias | ||
| Bias | Authors' judgement | Support for judgement |
| Random sequence generation (selection bias) | Low risk | Centrally computer generated randomisation schedule was stratified for site, gender and birth weight stratum (750 to 1250 g and 1251 to 1800 g) using a random permuted blocks algorithm |
| Allocation concealment (selection bias) | Low risk | 'After informed written consent ... infants were randomized to 1 of 3 study formula groups' |
| Blinding of participants and personnel (performance bias) | Unclear risk | Not reported |
| Blinding of outcome assessment (detection bias) | Unclear risk | Not reported |
| Incomplete outcome data (attrition bias) | High risk | 94/470 (20%) did not complete study |
| Selective reporting (reporting bias) | High risk | Serious adverse events including asthma and wheezing measured but not reported separately |
| Other bias | Low risk | Groups similar at baseline |
| Methods | Multicentre, double‐blind RCT in Australia April 2001 and September 2003 | |
| Participants | Inclusion criteria: infants born before 33 weeks' gestation (not selected for risk of allergy); within 5 days of receiving any enteral feeds Exclusion criteria: major congenital or chromosomal abnormalities; multiple birth where not all live‐born infants were eligible; enrolled in other trials of FA supplementation; lactating mothers in whom tuna oil was contraindicated | |
| Interventions | Randomised to intervention within 5 days of birth until infants reached their estimated due date Intervention: DHA‐rich tuna oil supplement (n = 322): mothers randomised to DHA‐rich tuna oil until expected date of delivery 3 g/day (DHA ˜ 1.3 g; n‐3:n‐6 ratio = n‐3 only). If supplementary formula was required, infants were given a high‐DHA preterm formula (DHA 1% + AA 0.6%) (high PUFA intake) Control (n = 335): maternal soy oil 3 g/day (LA ˜ 1.5 g, α‐LA ˜ 0.2 g) (n‐3:n‐6 ratio = 1:8). If supplementary formula was required, infants were given a standard preterm formula (DHA 0.35%, AA 0.6%) (intermediate PUFA intake) Co‐interventions: none reported | |
| Outcomes | Primary outcomes: neurodevelopment at 18 months; intellectual ability at 7 years Secondary outcomes: growth; safety; cognitive function; educational progress; behaviour; quality of life; symptoms of asthma and allergy; anthropometrics; blood pressure Parental recall of subsequent hospitalisations and diagnoses were sought at the ages of term, 4, 12 and 18 months' corrected age Structured parental interviews at 12 and 18 months allowed parents to report medical attention for, or the treatment of, hay fever, eczema, asthma or food allergy | |
| Notes | Co‐authors on scientific advisory boards for Nestle, Fonterra and Nutricia with associated honoraria | |
| Risk of bias | ||
| Bias | Authors' judgement | Support for judgement |
| Random sequence generation (selection bias) | Low risk | Mother‐infant pairs were randomly assigned a unique study number through a computer‐driven telephone randomisation service according to an independently generated randomisation schedule. Stratification was by centre, birth weight and infant sex |
| Allocation concealment (selection bias) | Low risk | |
| Blinding of participants and personnel (performance bias) | Low risk | To facilitate blinding, each treatment group was separately colour‐coded into 2 groups. All capsules were similar in size, shape and colour. If formula was required in the pilot phase, 2 drops of oil from capsules in matching colour‐coded containers were added to each 90 mL jar of formula. For the remainder of the trial, ready‐to‐feed preterm formula to trial specifications and packaged the formula according to the colour codes were manufactured |
| Blinding of outcome assessment (detection bias) | Low risk | Parents, clinicians and all research personnel blinded to participant study group |
| Incomplete outcome data (attrition bias) | Low risk | 54/657 (8%) incomplete outcome data at 18 months |
| Selective reporting (reporting bias) | Low risk | Structured parental interviews at 12 and 18 months allowed parents to report medical attention for, or the treatment of, hay fever, eczema, asthma or food allergy |
| Other bias | Low risk | Groups well balanced after allocation |
| Methods | Multicentre, double‐blind RCT in Netherlands October 1997 and April 2000 | |
| Participants | Formula fed infants (n = 121) with a maternal history of atopic disease: gestational age ≥ 38 weeks, birth weight > 2500 g, an uncomplicated perinatal period and exclusive formula‐feeding from 2 weeks age Maternal inclusion criteria: maternal history of allergic asthma or allergic rhinoconjunctivitis related to aeroallergen exposure or atopic dermatitis or a positive allergen test or improvement of asthma or rhinoconjunctivitis with the use of antihistamine or anti‐asthma drugs Maternal exclusion criteria: diabetes treated with medication or diet, or both; pre‐eclampsia; metabolic disease | |
| Interventions | Infants randomised to supplement for first 6 months of life Control (n = 60): supplemented with sunflower oil 446 mg (LA 0.2 g; n‐3:n‐6 ratio = n‐6 only) Intervention (n = 61): supplemented with borage oil 446 mg (LA 0.2 g; γ‐LA 103 mg/day; n‐3:n‐6 ratio = n‐6 only) Both groups intermediate PUFA intake Co‐interventions: none reported | |
| Outcomes | Primary outcome: atopic dermatitis at 12 months by dermatologist using the criteria of the UK Working Party Secondary outcome: total IgE and specific IgE for common aero‐ and food allergens at age 1 year (UniCAP) Severity of dermatitis scored by dermatologist using SCORAD | |
| Notes | Supported by F Hoffmann‐La Roche (Basel, Switzerland), Friesland Coberco Dairy Foods (Leeuwarden, Netherlands) | |
| Risk of bias | ||
| Bias | Authors' judgement | Support for judgement |
| Random sequence generation (selection bias) | Unclear risk | Block randomisation in blocks of 4. Method not reported |
| Allocation concealment (selection bias) | Low risk | |
| Blinding of participants and personnel (performance bias) | Low risk | Powders packaged in low‐oxygen sachets to blind the investigators and parents to possible differences in smell and appearance |
| Blinding of outcome assessment (detection bias) | Low risk | |
| Incomplete outcome data (attrition bias) | Low risk | 3/121 (2%) lost to follow‐up |
| Selective reporting (reporting bias) | Low risk | Primary outcome atopic dermatitis at 12 months |
| Other bias | Low risk | Groups similar at baseline |
AA: arachidonic acid; BMI: body mass index; CI: confidence interval; DHA: docosahexaenoic acid; EPA: eicosapentaenoic acid; FA: fatty acid; IgE: immunoglobulin E; LA: linoleic acid; LCPUFA: long chain polyunsaturated fatty acid; n: number of participants; PUFA: polyunsaturated fatty acid; RAST: radioallergosorbent test; RCT: randomised controlled trial; SCORAD: SCORing Atopic Dermatitis; SPT: skin prick test.
Characteristics of excluded studies [ordered by study ID]
| Study | Reason for exclusion |
| Excluded as allergy not prespecified or reported Multicentre (n = 6) randomised controlled trial in Italy and Ireland in 1992 Term neonates supplemented from birth until 4 months (formula fed) Intervention (n = 111): LCPUFA supplemented formula (LA 11.5% to 12.8% of fat; α‐LA 0.6% to 0.65%; AA 0.3% to 0.4%; DHA 0.15% to 0.25%) (intermediate PUFA intake) Control (n = 126): standard formula (LA 11.4% of fat; α‐LA 0.7%; AA < 0.1%; DHA 0%) (low PUFA intake) Outcome: neurodevelopment at 4 months; blood pressure in childhood; growth and developmental quotient at 4, 12, 18 and 24 months; 24 months Brunet‐Lézine's scale of development; at age 6 years intelligence quotient, attention control (Day‐Night Test), and speed of processing on the Matching Familiar Figures Test | |
| Excluded as allergy not prespecified or reported Multicentre randomised controlled trial in Italy May 2005 and June 2005 Term neonates supplemented from hospital discharge until 12 months (mixed feeding, mostly breastfed) Intervention (n = 580): DHA 20 mg supplement (intermediate PUFA intake) + vitamin D3 400 IU Control (n = 580): placebo (intermediate PUFA intake) = vitamin D3 400 IU Outcome: achievement of gross motor milestones in first year of life | |
| Excluded as allergy not prespecified or reported Multicentre cluster (16 villages) randomised controlled trial in Bangladesh November 1995 to October 1997 Pregnant women recruited at 5 to 7 months of gestation and treated until 6 months' postpartum (infants mostly breastfed) Intervention (n = 341): soybean oil 20 mL (high PUFA intake) Control (n = 335): no supplement (intermediate PUFA intake) Outcome: plasma vitamin A status at 6 months PUFA intake not reported | |
| Excluded as used co‐interventions that differed between treatment and control groups Single centre randomised controlled trial in Netherlands Participants: 102 preterm infants born at gestational age ≤ 32 weeks or birth weights ≤ 1500 g supplemented until 6 months' corrected age (formula fed) Intervention (n = 52): postdischarge formula with AA 0.5% to 0.6% + DHA 0.4% to 0.5% supplemented formula (intermediate‐high PUFA intake). The postdischarge formula provided the same quantity of energy but a higher level of protein and a lower level of carbohydrates, higher levels of some minerals, vitamins, and LCPUFA Control (n = 50): standard term formula (intermediate PUFA intake) Outcomes: fatty acid profile, growth up to 6 months' corrected age Did not report allergy | |
| Excluded as allergy not prespecified or reported Multicentre randomised controlled trial in Denmark January 2008 to March 2009 Infants supplemented from 9 to 18 months of age (mixed feeding) Intervention (n = 75): fish oil 5 mL daily (EPA + DHA 1.6 g/day) (high PUFA intake; high n‐3) Control (n = 79): sunflower oil 5 mL daily (LA 3.1 g/day) (intermediate‐high PUFA intake; high n‐6) Outcome: growth up to 18 months | |
| Excluded as allergy not prespecified or reported Multicentre randomised controlled trial in USA before 1997 Formula fed term neonates supplemented from before 9 days to until 12 months if formula fed Formula groups (oil blend consisted of high oleic safflower, coconut and soy oils) Intervention 1 (n = 59): AA 0.43% + DHA 0.12% supplemented formula (egg derived phospholipid) (intermediate PUFA intake) Intervention 2 (n = 61): DHA 0.23% supplemented formula (fish oil derived) (intermediate PUFA intake) Control (n = 63): standard formula (intermediate PUFA intake; no DHA or AA) Outcome: visual acuity at 12 months | |
| Excluded as allergy not prespecified or reported Multicentre randomised controlled trial in USA before 2001 Term neonates supplemented until 12 months (formula fed and breastfed groups) Formula fed infants Intervention 1 (n = 80): AA 0.45% + DHA 0.14% supplemented formulas (egg derived) (intermediate‐high PUFA intake) Intervention 2 (n = 82): AA 0.46% + DHA 0.13% supplemented formulas (fish/fungal derived) (intermediate‐high PUFA intake) Control 1 (n = 77): standard formula (intermediate‐high PUFA intake; no AA or DHA) Breastfed infants (supplemented after 3 months) Intervention (n = 83): AA + DHA supplemented formula (egg derived) (intermediate‐high PUFA intake) Control 2 (n = 82): standard formula (intermediate‐high PUFA intake) Outcome: multiple measures of infant development up to 14 months | |
| Excluded as allergy not prespecified or reported Multicentre randomised controlled trial in China 2001 to 2002 Term neonates supplemented until 6 months of age (formula fed) Intervention (n = 69): AA + DHA supplemented formulas (intermediate PUFA intake) (LA 435 mg; α‐LA 62 mg; AA 6.9 mg; and DHA 6.9 mg per 100 mL) Control (n = 52): standard formula (intermediate PUFA intake) (LA 440 mg; α‐LA 44 mg; no AA or DHA per 100 mL) Outcome: growth, development and infections up to 6 months | |
| Excluded as allergy not prespecified or reported Single centre randomised controlled trial in Spain before June 2001 Term neonates (n = 37) supplemented until 2 months (formula fed) Intervention/control (numbers per group not specified): 1 of 4 formulas (standard (low‐intermediate), n‐3 supplemented (intermediate), n‐3 + n‐6 supplemented (intermediate), nucleotide supplemented (intermediate‐high)) Outcome: fatty acid profile, growth up to 2 months Written in Spanish; English abstract | |
| Excluded as allergy not prespecified or reported Multicentre randomised controlled trial in Germany October 2000 to August 2002 Pregnant women supplemented from 21 to 37 weeks' gestation; and then from 2 weeks' to 3 months' postpartum Intervention (n = 48): maternal DHA 200 mg supplement (intermediate PUFA intake) (fish oil derived) Control (n = 48): no maternal DHA supplement (intermediate PUFA intake) Outcome: growth up to 21 months | |
| Excluded as used co‐interventions that differed between treatment and control groups Multicentre randomised controlled trial in USA Participants: 150 preterm infants born at gestational age ≤ 30 + 3/7 weeks or birth weights ≤ 1250 g supplemented for 28 days, until hospital discharge or discontinuation of breast milk (breast milk fed) Intervention (n = 75): concentrated human milk fortifier enriched with LCPUFA (intermediate‐high PUFA intake) Control (n = 75): standard milk fortifier (intermediate PUFA intake) Outcomes: fatty acid profile, growth, adverse events up to 28 days Did not report allergy | |
| Excluded as allergy not prespecified or reported Multicentre randomised controlled trial in France before 1996 Preterm neonates < 34 weeks' gestation supplemented until 37 weeks' corrected gestation (formula fed) Intervention (n = 31): α‐LA 1.95% supplemented formula (intermediate PUFA intake) Control (n = 32): standard formula with α‐LA 0.55% (low‐intermediate PUFA intake) Outcome: fatty acid profile, growth up to 37 weeks' corrected gestation | |
| Excluded as allergy not prespecified or reported Single centre randomised controlled trial in USA before 1992 73 healthy preterm infants born at 27 to 33 weeks' postconception Formula groups fed from 10 days postnatal to 57 weeks' postconception Control: corn oil that provided solely linoleic acid Intervention 1: soy oil that provided LA and α‐LA or Intervention 2: soy/marine oil that was similar to the soy oil formula but also provided DHA 0.46% Outcome: visual evoked potentials at 57 weeks | |
| Excluded as allergy not prespecified or reported Multicentre randomised controlled trial in USA Term neonates supplemented until 17 weeks (formula fed) Intervention 1 (n = 27): AA 0.72% + DHA 0.36% supplemented formula (intermediate PUFA intake) Intervention 2 (n = 26): DHA 0.35% supplemented formula (intermediate PUFA intake) Control (n = 26): standard formula (intermediate PUFA intake; no AA or DHA) Outcome: fatty acid profile, visual acuity, growth up to 12 months | |
| Excluded as allergy not prespecified or reported Multicentre randomised controlled trial in USA before 2001 Term neonates supplemented from 6 weeks to 12 months (formula fed) Intervention (n = 32): AA 0.72% + DHA 0.36% supplemented formula Control (n = 33): standard formula Outcome: visual acuity up to 12 months | |
| Excluded as allergy not prespecified or reported Multicentre randomised controlled trial in USA before 1998 Participants: term neonates supplemented from birth to 12 months (formula fed) Intervention 1 (n = 84): DHA 0.32% + 0.64% AA (34 mg/100 kcal) formula Intervention 2 (n = 85): DHA 0.64% (34 mg/100 kcal) + AA 0.64% (34 mg/100 kcal) formula Intervention 3 (n = 88): DHA 0.96% (51 mg/100 kcal) + AA 0.64% (34 mg/100 kcal) formula Control (n = 86): standard formula with no DHA or AA Outcome: visual acuity up to 12 months | |
| Excluded as allergy not prespecified or reported Single centre randomised controlled trial in Germany before 1996 Very‐low‐birth‐weight infants appropriate for gestational age from 2nd week to discharge When breast milk was not available the infants were randomly assigned to be fed either: Control: standard preterm formula (n = 11), virtually LCPUFA free (LA 11.3%, α‐LA 0.56%) Intervention: LCPUFA supplemented formula (n = 12). (LA 12.75%, α‐LA 0.82%; DHA 0.15%; AA 0.25%) Changed to identical fatty acid term formulas at 34 to 36 weeks' postconceptual age Outcome: fatty acid composition of serum and red blood cell membrane phospholipids | |
| Excluded as intervention < 1 month Single centre randomised controlled trial in Germany Participants: 39 very‐low‐birth‐weight infants appropriate for gestational age over 10‐day feeding period Intervention: LCPUFA‐supplemented formula (n = 11) (DHA: 50.2 ± 4.2 mg/72 hours; AA: 30.2 ± 2.7 mg/72 hours) (intermediate‐high PUFA intake) Control: LCPUFA‐free formula (n = 11) (intermediate PUFA intake) Outcome: DHA and AA absorption Did not report allergy | |
| Excluded as allergy not prespecified or reported Single centre randomised controlled trial in Spain before 1998 Term neonates supplemented until 3 months (formula fed) Intervention (n = 18): AA 0.30% + DHA 0.15% supplemented formula (intermediate PUFA intake) Control (n = 15): standard formula (intermediate PUFA intake) Outcome: fatty acid profile at 3 months | |
| Excluded as allergy not prespecified or reported Single centre randomised controlled trial in France before 1999 Preterm neonates < 34 weeks' gestation supplemented for at least 30 days until 37 weeks' corrected gestation (formula fed) Intervention (n = 14): LCPUFA enriched formula (LA 17.7%, α‐LA 1.2%; DHA 0.6%; EPA 0.1%, AA 0.1%) (intermediate PUFA intake) Control (n = 11): standard formula with no LCPUFA (LA 14.1%, α‐LA 1.3%) (intermediate PUFA intake) Outcome: fatty acid profile, auditory and visual evoked potentials, nerve conduction velocity, growth up to 37 weeks' corrected gestation | |
| Excluded as allergy not prespecified or reported Multicentre randomised controlled trial in Netherlands February 1997 until October 1999 Term neonates supplemented until 2 months (formula fed) Intervention (n = 145): AA 0.45% + DHA 0.3% supplemented formula (intermediate PUFA intake) Control (n = 167): standard formula (intermediate PUFA intake) Outcome: general movements at 3 months | |
| Excluded as allergy not prespecified or reported Single centre randomised controlled trial in USA May 1985 and January 1986 Infants born at < 1500 g (range 600 g to 1440 g) Intervention (n = 30): preterm formula with the fish oil supplement (750 mg/kg/day). (Provided approximately 6 times as much DHA as would have been received by infants fed preterm human milk) Control (n = 31): preterm formula (no DHA) Outcome: red blood cell membrane docosahexaenoic acid | |
| Excluded as allergy not prespecified or reported Single centre randomised controlled trial in USA November 1987 and 1989 Preterm infants (600 to 1270 g birth weight) when tolerated preterm formulas at intakes > 462 to 504 kJ/kg/day for 5 to 7 days Randomised to receive 1 of 3 formulas for 4 weeks Intervention 1 (n = 8): preterm formula contained EPA 0.3% and DHA 0.2% from marine oil Intervention 2 (n = 7): preterm formula contained EPA 0.7% and DHA 0.4% from marine oil Control (n = 6): preterm formula did not contain marine oil and was free of EPA and DHA Outcome: fatty acid profiles up to 12 months' corrected age | |
| Excluded as allergy not prespecified or reported Single centre randomised controlled trial in USA November 1987 and 1989 Infants weighed 748 to 1398 g at birth and were eligible for the study when they were receiving > 462 kJ/kg/day of a preterm formula Randomised (n = 79; group numbers unclear) to receive 1 of 2 formulas to discharge and then term formula with or without marine oil postdischarge until 79 weeks' postconceptual age Control: preterm formula without marine oil during hospital stay; then term formula without marine oil post discharge to 79 weeks' postconceptual age Intervention 2: preterm formula contained EPA 0.3% and DHA 0.2% from marine oil during hospital stay; then term formula with marine oil post discharge to 79 weeks' postconceptual age Outcome: fatty acid profiles up to 12 months' corrected age. Visual acuity as measured by the Teller Acuity Card procedure | |
| Excluded as allergy not prespecified or reported Single centre randomised controlled trial in USA before 1996 Term neonates supplemented until 12 months (formula fed) Intervention (n = 28): AA 0.43% + DHA 0.1% supplemented formula (added egg phospholipid) (intermediate PUFA intake) Control (n = 31): standard formula (intermediate PUFA intake) (no DHA or AA) Outcome: fatty acid profile, visual acuity up to 12 months | |
| Excluded as allergy not prespecified or reported Single centre randomised controlled trial in USA before 1996 Participants (n = 94) (numbers per group not specified): preterm neonates supplemented until 2 months' corrected age (formula fed) Intervention: marine oil supplemented formula (high PUFA intake) Control: standard formula (high PUFA intake) Outcome: fatty acid profile, visual acuity, growth up to 12 months | |
| Excluded as allergy not prespecified or reported Single centre randomised controlled trial in USA September 1992 to March 1997 Participants (n = 120) (numbers per group not specified): preterm neonates supplemented until 4 months' corrected age (formula fed) Intervention: egg phospholipid supplemented formula AA 0.41%; DHA 0.13%; no γ‐LA (intermediate‐high PUFA intake; high n‐3; low n‐6) Control: standard formula (no AA or DHA; γ‐LA 2.24%) (intermediate PUFA intake; no n‐3; high n‐6) Outcome: hospital morbidity, fatty acid profile, growth up to 4 months | |
| Excluded as allergy not prespecified or reported Single centre randomised controlled trial in Italy 1992 to 1995 Preterm infants fed exclusively with study formulas until ≥ 5 weeks old. Report control and treatment 2 groups continued on formulas until 7 months of age Control (n = 19): preterm formula without LCPUFAs added. (No AA or DHA; no n‐3 or n‐6) Intervention 1 (n = 19): preterm formulas supplemented with LCPUFAs derived from egg phospholipids. (AA 0.35%; DHA 0.24%; n‐3 0.55%; n‐3 0.45%) Intervention 2 (n = 19): preterm formula with LCPUFAs from triacylglycerols derived from unicellular organisms. (AA 0.84%; DHA 0.64%; n‐3 0.97%; n‐3 0.64%) Outcome: dietary intakes, fecal excretion and intestinal absorption of LCPUFAs. Fatty acid profile up to 7 months | |
| Excluded as allergy not prespecified or reported Single centre randomised controlled trial in Canada before April 1990 Preterm neonates supplemented from first week of life for four weeks (formula fed) Intervention (n = 12): preterm formula with LCPUFA supplementation (intermediate‐high PUFA intake) Control (n = 10): standard preterm formula (intermediate PUFA intake) Outcome: fatty acid profile after 4 weeks | |
| Excluded as allergy not prespecified or reported Single centre controlled trial in USA before April 1997 Stable preterm infants appropriate weight for gestational age (n = 72) 4 formulas contain the same nutrient composition but provided increasing levels of AA (0%, 0.32%, 0.49% and 1.1%) and DHA (0%, 0.24%, 0.35% and 0.75%) for 6 weeks Outcome: erythrocyte membrane phospholipid content and lipoprotein content up to 6 weeks | |
| Excluded as allergy not prespecified or reported Multicentre randomised controlled trial in Canada Preterm neonates gestational age was ≤ 35 weeks' postmenstrual age and they had received < 10 total days of enteral feedings of > 30 mL/kg/day Preterm neonates supplemented until 6 months (formula fed) Intervention 1 (n = 112): AA + DHA supplemented formulas (intermediate PUFA intake) (DHA 17 mg/100 kcal from algal oil and AA 34 mg/100 kcal from fungal oil; DHA 0.3% and AA 0.6%) Intervention 2 (n = 130): AA + DHA supplemented formulas (high PUFA intake) (DHA 17 mg/100 kcal from tuna fish oil and AA 34 mg/100 kcal from fungal oil; DHA 0.3% and AA 0.6%) Control (n = 119): standard formula (intermediate PUFA intake) Outcome: growth, development up to 18 months | |
| Excluded as allergy not prespecified or reported Single centre randomised controlled trial in Australia before 1992 Healthy term infants whose mothers had decided not to breastfeed were enrolled in the study at birth Infants were randomly allocated to 1 of 3 formulas for a total of 10 weeks Intervention 1 (n = 10): formula with a high ratio of LA to α‐LA 19:1 (LA 14%; α‐LA 0.7%) Intervention 2 (n = 11): formula contained LA:α‐LA ratio 4:1 reduced by increasing α‐LA (LA 13%; α‐LA 3.3%) or Intervention 2 (n = 8): formula contained LA:α‐LA ratio 3:1 reduced by decreasing LA (LA 3.5%; α‐LA 1.1%). Outcome: incorporation of n‐3 and n‐6 C20 and C22 fatty acids into erythrocyte membranes | |
| Excluded as allergy not prespecified or reported Single centre randomised controlled trial in Hungary before 1995 Healthy, full‐term, appropriate‐for‐gestational age infants fed formula were enrolled at 5 days of age supplemented until 4 months (formula fed) Intervention (n = 12): LCPUFA 1.1% supplemented formula (intermediate PUFA intake) (AA 0.5%; α‐LA 0.2%; EPA 0.03%; DHA 0.3%) Control (n = 10): standard formula with low LCPUFA intake 0.1% (no AA or α‐LA or EPA or DHA) Outcome: fatty acid profile up to 4 months | |
| Excluded as allergy not prespecified or reported Single centre randomised controlled trial in Hungary prior to March 1996 Full term infants whose parents decided not to breastfeed, formula fed for 1 month Randomly assigned to: Control (n = 10): conventional cow's milk protein formula based on and vegetable fat (No AA; α‐LA 1.0; No DHA; LCPUFA 0.1%) Intervention (n = 12): same formula supplemented with egg lipids and evening primrose oil (AA 0.4%; α‐LA 0.6; DHA 0.2%; LCPUFA 0.9%) Outcome: lipid profiles to 30 days | |
| Excluded as allergy not prespecified or reported Single centre randomised controlled trial in Hungary December 1994 to May 1997 Preterm neonates supplemented for 28 days (formula fed) Intervention 1 (n = 13): borage oil supplemented formula (intermediate PUFA intake) (0.6% γ‐LA) Intervention 2 (n = 13): borage oil + low fish oil supplemented formula (intermediate PUFA intake) (γ‐LA 0.6%; DHA 0.3%; EPA 0.06%) Intervention 3 (n = 14): borage oil + high fish oil supplemented formula (intermediate‐high PUFA intake) (γ‐LA 0.6%; DHA 0.3%; EPA 0.2%) Control (n = 13): standard formula (intermediate PUFA intake) Outcome: fatty acid profile up to 4 months | |
| Excluded as non‐randomised and used co‐interventions that differed between treatment and control groups Multicentre non‐randomised controlled clinical trial in Norway A multiple life‐style intervention programme was introduced as a primary healthcare intervention involving increased maternal and infant dietary n‐3 PUFA intake, reduced tobacco smoke exposure and reduced indoor dampness in homes. Pregnant women and children up to 2 years of age were recruited to participate in a before‐and‐after study Intervention (n = 2860): increased n‐3 PUFA intake as part of intervention programme (unknown PUFA intake) Control (n = 4780): recruited before initiation of intervention programme (unknown PUFA intake) Outcome: prevalence of parentally reported allergy related diseases at 2 years of age | |
| Excluded as allergy not prespecified or reported Single centre randomised controlled trial in Italy before 1996 Preterm neonates < 33 weeks of gestational age, appropriate weight and with no malformation supplemented until 12 weeks' corrected age (formula fed) Intervention (n = 23): LCPUFA supplemented formula (AA 0.01%; DHA 0.3%; n‐6 4.3%) (intermediate PUFA intake) Control (n = 26): standard formula (no AA or DHA) (low‐intermediate PUFA intake) Outcome: visual evoked potentials, growth up to 12 weeks' corrected age | |
| Excluded as allergy not prespecified or reported Single centre randomised controlled trial in Taiwan before 2005 Preterm neonates 30 to 37 weeks' gestation, > 2000 g, over 32 weeks and on full feeds supplemented for 6 months (formula fed) Intervention (n = 16): AA + DHA supplemented formula (unclear PUFA intake) Control (n = 11): standard formula (unclear PUFA intake) Outcome: visual acuity, growth, development up to 12 months | |
| Excluded as allergy not prespecified or reported Multicentre randomised controlled trial in UK before 2002 Preterm neonates < 1750 g supplemented until hospital discharge (formula fed minimum 3 weeks) Intervention (n = 95): LCPUFA supplemented formula (EPA 0.04%; AA 0.31%; DHA 0.17%; cholesterol 7.73%) (intermediate PUFA intake) Control (n = 100): standard formula (no EPA or AA or DHA or cholesterol) (low PUFA intake) Outcome: hospital morbidity, growth, development up to 18 months | |
| Excluded as intervention < 1 month Single centre randomised controlled trial in Germany Participants: healthy breastfeeding women with healthy single, full‐term newborns. The infants were exclusively breastfed during the duration of the study. At 4 weeks' postpartum, mothers were randomly assigned to receive 2 DHA capsules per day for 14 days Intervention: DHA capsule twice daily (intermediate‐high PUFA intake) Control: placebo oil (intermediate PUFA intake) Outcome: effect on human milk fatty acid composition Did not report allergy | |
| Excluded as allergy not prespecified or reported Single centre randomised controlled trial in Canada before 2000 Stable preterm infants gestational age 27 and 36 weeks appropriate for gestational age and receive 100% of requirements enterally by day 14 Groups received formula from before day 8 to day 42 of postnatal life Control (n = 12): standard preterm formula (no AA or DHA) Intervention (n = 15): same formula supplemented with AA 0.49% and DHA 0.35% Outcome: immune cell types and the antigenic maturity of T cells | |
| Excluded as allergy not prespecified or reported Single centre randomised controlled trial in Canada before 2007 Mothers who had chosen to switch from breastfeeding to formula before 14 days age Randomised to feeding from 14 days to 16 weeks age Control (n = 14): standard term infant formula Intervention (n = 16): same formula supplemented with AA 0.34% and DHA 0.2% Outcome: immune cell phenotypes and the ability of peripheral blood cells to proliferate and produce cytokines in vitro | |
| Excluded as used co‐interventions that differed between treatment and control groups Single centre randomised controlled trial in Serbia Participants: 213 term infants born at 37 to 41 weeks' gestation, appropriate for gestational age given modified infant formula for 4 months (formula fed) Intervention (n = 107): reduced protein formula enriched with α‐lactalbumin and LCPUFA (intermediate‐high PUFA intake) Control (n = 106): standard term formula (intermediate PUFA intake) Outcomes: fatty acid profile, growth, tolerance up to 4 months Did not report allergy | |
| Excluded as allergy not prespecified or reported Multicentre randomised controlled trial in Netherlands before 1994 Preterm neonates < 37 weeks' gestation appropriate for gestational age supplemented until 3 months' corrected age (formula fed) Randomised to formula (preterm to 2000 g then term formula) Intervention (n = 15): dihomo‐γ‐linolenic acid 0.06% + AA 0.61% + DHA 0.30% supplemented formulas (intermediate PUFA intake) Control (n = 16): standard formula (intermediate PUFA intake) (no dihomo‐γ‐linolenic acid or AA or DHA) Outcome: fatty acid profile at 3 months' corrected age | |
| Excluded as allergy not prespecified or reported Single centre randomised controlled trial in UK before 1994 Preterm neonates supplemented until term corrected age (formula fed). Participants (n = 63): numbers per group not specified; includes breast milk fed controls Intervention: AA 0.12% + DHA 0.51% supplemented formula (intermediate PUFA intake) Control: standard formula AA 0.04% + No DHA (low PUFA intake) Outcome: fatty acid profile at term corrected age | |
| Excluded as used co‐interventions that differed between treatment and control groups Single centre randomised controlled trial in Australia Participants: mothers of term infants (> 37 weeks' gestation) who intended to breastfeed for at least 12 weeks Mothers were randomised to receive 1 of 5 doses (0.2, 0.4, 0.9 or 1.3 g DHA/day) of a DHA‐rich algal oil between day 5 and week 12 postpartum. The oil contained 43% DHA, 1% n‐6 PUFA, 38% saturates and 18% monounsaturates Intervention 1 (n = 10): DHA 0.35% of fatty acids in breast milk Intervention 2 (n = 12): DHA 0.46% Intervention 3 (n = 10): DHA 0.86% Intervention 4 (n = 8): DHA 1.13% Control (n = 12): no DHA supplement (DHA 0.21%: intermediate PUFA intake) Outcomes: fatty acid profile, visual evoked potentials, growth, development up to 2 years. Adverse events were assessed at each visit by a nurse Did not report allergy | |
| Excluded as used co‐interventions that differed between treatment and control groups Single centre randomised controlled trial in Australia Participants: 142 term infants > 36 weeks, < 11 days old assigned to 1 of 2 formulas for 4 months (formula fed) Intervention (n = 72): formula with LCPUFA and probiotics supplements (intermediate PUFA intake) Control (n = 70): standard term formula (intermediate PUFA intake) Outcomes: fatty acid profile, growth, tolerance, adverse events up to 4 months Did not report allergy | |
| Excluded as allergy not prespecified or reported Single centre randomised controlled trial in Israel before 2011 60 pregnant women aged 20 to 35 years in their 3rd pregnancy supplemented from 12 weeks' gestation until 4 months postpartum Intervention (n = 30): DHA 400 mg/day from 12 weeks' gestation until 4 months' postpartum (high PUFA intake) Control (n = 30): no DHA supplement (intermediate PUFA intake) Outcome: infant immune cell profile at 4 months | |
| Excluded as allergy not prespecified or reported Single centre randomised controlled trial in USA September 1997 and September 1998 Preterm neonates with birth weight 750 to 1800 g and gestational age < 33 weeks supplemented until 12 months (formula fed) Intervention 1 (n = 20): DHA 0.26% + AA 0.42% from fish/fungal oil supplemented formula to 40 weeks' corrected age; and DHA 0.26% + AA 0.42% from 40 weeks' corrected age Intervention 2 (n = 18): DHA 0.26% + AA 0.42% from egg/fish oil supplemented formula; and DHA 0.26% + AA 0.42% from 40 weeks' corrected age Control (n = 22): standard formula Outcome: growth and body composition up to 12 months' corrected age Note: 20 of 60 infants also enrolled in O'Connor 2001 | |
| Excluded as allergy not prespecified or reported Single centre randomised controlled trial in Germany July 2006 and May 2009 Healthy pregnant women before the 15th week of gestation Women supplemented from 15th week of gestation to 4 months postpartum: Intervention (n = 104): LCPUFA supplement (high PUFA intake) (fish oil supplement as capsules containing n‐3 LCPUFAs 1200 mg (DHA 1020 mg and EPA 180 mg) and 9 mg vitamin E per day) Control (n = 104): no LCPUFA supplement (intermediate PUFA intake) Outcome: infant fat mass up to 12 months | |
| Excluded as allergy not prespecified or reported Single centre randomised controlled trial in Australia before 2001 Healthy women aged ≥ 18 years who delivered full‐term singleton infants and intended to breastfeed for ≥ 12 weeks Randomly allocated from day 3 postpartum until the end of their 12th postpartum week Control (n = 40): 4 x 500 mg placebo oil capsules Intervention 1 (n = 40): DHA 300 mg/day and EPA 70 mg/day (2 x 500 mg tuna oil capsules + 2 x 500 mg placebo oil capsules) Intervention 2 (n = 40): DHA 600 mg/day and EPA 140 mg/day (4 x 500 mg tuna oil capsules) Outcome: maternal immune profile at 5 weeks | |
| Excluded as supplementation period < 1 month Single centre randomised controlled trial in Norway Participants: 22 healthy, lactating women recruited at child healthcare centres 3 ± 8 weeks after they had given birth Supplementation period was 14 days, between 3 and 8 weeks' postpartum Intervention 1: cod liver oil 2.5 mL/day (intermediate‐high PUFA intake) Intervention 2: cod liver oil 5 mL/day (intermediate‐high PUFA intake) Intervention 3: cod liver oil 10 mL/day (intermediate‐high PUFA intake) Control: no supplementation (intermediate PUFA intake) Cod liver oil contained EPA 7.7 g, DHA 10.2 g and total n‐3 fatty acids 22.9 g per 100 mL Outcome: amount of essential fatty acids in mothers' breast milk Did not report allergy | |
| Excluded as allergy not prespecified or reported Multicentre randomised controlled trial in Norway December 1994 and October 1996 Healthy women with single pregnancies aged 19 to 35 years, and nulli‐ or primipara and intending to breastfeed Supplemented from 17 to 19 weeks' gestation until 3 months' postpartum Intervention (n = 301): cod liver oil 10 mL/day (DHA 1183 mg/10 mL, EPA 803 mg/10 mL; n‐3 PUFAs 2494 mg/10 mL) (high PUFA intake) Control (n = 289): corn oil 10 mL/day (LA 4747 mg/10 mL and α‐LA 92 mg/10 mL) (intermediate PUFA intake) Outcome: growth and development up to 12 months | |
| Excluded as allergy not prespecified or reported Multicentre randomised controlled trial in Norway December 2003 and November 2005 Very low birth weight neonates supplemented until discharge (breast milk fed) Intervention (n = 68): LA 18.8% + DHA 6.9% + AA 6.7% + α‐LA 2.3% supplemented feeds (high PUFA intake) Control (n = 73): unsupplemented feeds: LA 27.1% + α‐LA 3.4% + no DHA or AA (intermediate PUFA intake) Outcome: fatty acid profile, growth, development up to 18 months | |
| Excluded as allergy not prespecified or reported Multicentre randomised controlled trial in USA before 2003 Infants supplemented from 4 to 6 months until 12 months of age (breastfed until enrolment) Intervention (n = 33): dihomo‐γ‐linolenic acid 0.05% + AA 0.72% + DHA 0.36% supplemented formula (intermediate‐high PUFA intake) Control (n = 35): standard formula (no dihomo‐γ‐linolenic acid or AA or DHA) (intermediate PUFA intake) Outcome: fatty acid profile, visual evoked potentials, growth up to 12 months | |
| Excluded as allergy not prespecified or reported Multicentre randomised controlled trial in USA Infants supplemented from 6 to 12 months (breastfed until enrolment) Intervention (n = 28): egg yolk enriched baby foods with α‐LA 0.366% + AA 0.078% + DHA 0.115% (n‐6 1.18%; n‐3 0.51%; n‐6:n‐3 PUFA ratio 2.3) (intermediate PUFA intake) Control (n = 27): no supplement α‐LA 0.011% + AA 0.001% + no DHA (n‐6 0.12%; n‐3 0.01%; n‐6:n‐3 PUFA ratio 9.8) (intermediate PUFA intake) Outcome: fatty acid profile, visual evoked potentials, growth up to 12 months | |
| Excluded as allergy not prespecified or reported Multicentre randomised controlled trial in USA before 2005 Term neonates 38 to 42 weeks' gestation with birth weight > 2500 g supplemented until 4 months of age (formula fed) Intervention (n = 39): high LCPUFA formula (LA 17.2% + α‐LA 1.65% + AA 0.64% + DHA 0.32%) (intermediate PUFA intake) Control (n = 27): low LCPUFA formula (LA 19.5% + α‐LA 2.1% + AA 0.4% + DHA 0.15%) (intermediate PUFA intake) Outcome: fatty acid profile, growth up to 4 months | |
| Excluded as allergy not prespecified or reported Single centre randomised controlled trial in Denmark began in October 1993 Uncomplicated pregnancy, term delivery (gestational age 37 to 42 weeks), birth weight 2700 to 4500 g, Apgar > 7 after 5 minutes, and no neonatal diseases; supplemented until 4 months (formula fed). Participants: (n = 39) (numbers per group not specified) Intervention 1 (n = 14): LCPUFA supplemented formula (DHA 0.3% + EPA 0.4% in fish oil) (intermediate PUFA intake) Intervention 2 (n = 12): LCPUFA supplemented formula (DHA 0.3% + EPA 0.4% + γ‐LA 0.5% in borage oil) (intermediate PUFA intake) Control (n = 11): standard formula (no LCPUFA supplement) (intermediate PUFA intake) Outcome: fatty acid profile, visual evoked potentials, growth up to 4 months | |
| Excluded as allergy not prespecified or reported Single centre randomised controlled trial in USA before 1996 Term gestation infants formula fed to 16 weeks of age 3 formulas contained soy and coconut oil and were relatively low in 18:1, but high in 18:2n‐6 and 18:3n‐3 (high 18:2n‐6 formulas) Intervention 1 (n = 16 + losses): high LA 34.2% + DHA 0% Intervention 2 (n = 18 + losses): high LA 32.2% + DHA 0.10% Intervention 3 (n = 17 + losses): high LA 31.9% + DHA 0.22% 3 formulas contained high‐oleic safflower, soy and coconut oil, and were high in 18:1 lower in 18:2n‐6 and 18:3n‐3 (low 18:2n‐6 formulas) Intervention 4 (n = 21 + losses): low LA 20.5% + DHA 0% Intervention 5 (n = 17 + losses): low LA 20.0% + DHA 0.11% Intervention 6 (n = 16 + losses): low LA 20.4% + DHA 0.24% Outcome: plasma and erythrocyte phospholipid fatty acids and growth | |
| Excluded as allergy not prespecified or reported Multicentre randomised controlled trial in USA before 2002 Very low birth weight (846 to 1560 g) infants fed formula until discharge Intervention 1 (n = 66): DHA 0.34% supplemented formula (intermediate‐high PUFA intake) Intervention 2 (n = 66): AA 0.60% + DHA 0.33% supplemented formula (intermediate‐high PUFA intake) Control (n = 62): standard formula (intermediate‐high PUFA intake) Outcome: fatty acid profile, visual acuity, growth up to 4 months | |
| Excluded as allergy not prespecified or reported Multicentre randomised controlled trial in USA before 1996 Healthy term infants whose mothers had elected not to breastfeed supplemented until 4 months (formula fed) Intervention 1 (n = 20): α‐LA 3.24% supplemented formulas (intermediate to intermediate‐high PUFA intake) Intervention 2 (n = 20): α‐LA 1.7% supplemented formulas (intermediate to intermediate‐high PUFA intake) Intervention 3 (n = 20): α‐LA 0.95% supplemented formulas (intermediate to intermediate‐high PUFA intake) Control (n = 20): low α‐LA 0.4% formula (low‐intermediate PUFA intake) Outcome: fatty acid profile, visual evoked potentials, growth up to 4 months, neurodevelopment at 12 months | |
| Excluded as allergy not prespecified or reported Multicentre randomised controlled trial in USA before 2000 Breastfeeding mothers of term neonates supplemented from 2 to 8 weeks' postpartum Intervention 1 (n = 7): algae‐produced triacylglycerol with a high DHA content supplement (intermediate to intermediate‐high PUFA intake) Intervention 2 (n = 7): eggs 2/day with a high DHA content supplement (intermediate to intermediate‐high PUFA intake) Intervention 3 (n = 6): low‐EPA, high‐DHA fish oil supplement (intermediate to intermediate‐high PUFA intake) Control (n = 7): regular eggs 2/day with no DHA supplement (intermediate PUFA intake) Outcome: fatty acid profile at 8 weeks | |
| Excluded as allergy not prespecified or reported Single centre randomised controlled trial in Germany before 2003 Preterm neonates 28 to 32 weeks' gestation supplemented from birth until 6 weeks (formula fed) Intervention (n = 9 + losses): LCPUFA‐enriched formula + vitamin E supplementation (LA 14.8%, AA 0.37%, α‐LA 0.9%, DHA 0.2%) (intermediate PUFA intake) Control (n = 11 + losses): standard formula + vitamin E supplementation (LA 15.5%, AA 0%, α‐LA 0.85%, DHA 0%) (intermediate PUFA intake) Outcome: fatty acid profile, growth and neurodevelopment to 24 months | |
| Excluded as allergy not prespecified or reported Single centre randomised controlled trial in Belgium before 1994 Healthy, term infants with gestational age of 38.5 to 41.5 weeks and a birth weight 2800 to 4000 g supplemented until 3 months (formula fed) Intervention: α‐LA 0.28% + AA 0.25% + DHA 0.18% supplemented formula (intermediate PUFA intake) Control: standard formula (no α‐LA + AA 0.02% + no DHA) (low‐intermediate PUFA intake) Outcome: fatty acid profile, growth up to 3 months | |
| Excluded as supplementation period < 1 month Single centre randomised controlled trial in Germany Participants: premature infants with a birth weight of ≥ 1300 g. Infants fed from day 4 to 21 of life Intervention (n = 8): AA 0.2% and DHA 0.1% (intermediate PUFA intake) Control (n = 10): adapted formula (no AA or DHA) (low PUFA intake) Outcome: composition of plasma lipids Did not report allergy | |
| Excluded as supplementation period < 1 month, allergy not prespecified or reported Single centre randomised controlled trial in Germany Participants: premature infants with a birth weight of ≥ 1300 g. Infants fed from day 4 to 21 of life Intervention (n = 9): α‐LA (n‐6: 0.2%; n‐3 0.8%) + EPA 0.03% + AA 0.5% + DHA 0.3% from egg and evening primrose oil (intermediate PUFA intake) Control (n = 10): adapted formula (AA 0.05%; α‐LA (n‐6: 0%; n‐3: 0.4%); no EPA or DHA) (low PUFA intake) Outcome: composition of plasma lipids Did not report allergy | |
| Excluded as allergy not prespecified or reported Multicentre randomised controlled trial in Germany before 2003 Preterm neonates born < 1800 g supplemented for 4 weeks (formula fed) Intervention (n = 15): LCPUFA supplemented formula with LA 0.5% + α‐LA 0.8% + AA 0.4% + DHA 0.57% (intermediate PUFA intake) Control (n = 15): standard formula AA 0.04% + no DHA (intermediate PUFA intake) Outcome: fatty acid profile, growth up to 4 weeks | |
| Excluded as allergy not prespecified or reported Single centre randomised controlled trial in France before 2000 Term infants appropriate for gestational age and born with a birth weight > 280 g supplemented until 4 months (formula fed) Infants who had a history of maternal cocaine or alcohol abuse, or born to mothers with a history of diabetes, hyperlipidaemia, abnormal dietary patterns (strict vegetarian or vegan diets) were ineligible for participation Intervention (n = 12): LCPUFA supplemented formula (LA 17.62%, AA 0.03%, α‐LA 1.07%, DHA 0.31%, EPA 0.08%) (intermediate PUFA intake) Control (n = 12): standard formula (LA 17.35%, α‐LA 1.59%) (intermediate PUFA intake) Outcome: fatty acid profile, growth up to 4 months | |
| Excluded as allergy not prespecified or reported Single centre randomised controlled trial in France before 2000 Preterm infants appropriate for gestational age 700 to 1500 g supplemented until 4 months' corrected age (formula fed) Exclusion criteria included major neonatal morbidity; postnatal age > 21 days, requirement for supplemental oxygen or treatments (e.g. diuretics and corticosteroids) that could influence growth and development; failure to achieve full enteral feeding of 150 mL/kg/day by a postnatal age of 21 days; and maternal history of cocaine/alcohol abuse, diabetes, hyperlipidaemia or abnormal dietary patterns (strict vegetarian diets) Intervention (n = 11): LCPUFA supplemented formula (LA 17.78%, AA 0.02%, α‐LA 1.1%, DHA 0.37%, EPA 0.05%) (intermediate PUFA intake) Control (n = 12): standard formula (LA 17.95%, α‐LA 1.6%) (intermediate PUFA intake) Outcome: fatty acid profile, growth up to 6 months' corrected age | |
| Excluded as supplementation period < 1 month and PUFA content comparable between treatment and control groups Single centre randomised controlled crossover trial in Brazil Participants: 33 term infants aged 84 to 156 ± 3 days fed 1 of 2 formulas with crossover after 14 days (formula fed) Intervention 1: standard term formula containing palm oils (intermediate PUFA intake) Intervention 2: standard term formula not containing palm oils (intermediate PUFA intake) Outcomes: metabolic parameters, growth, tolerance up to 36 days Did not report allergy | |
| Excluded as supplementation period < 1 month, allergy not prespecified or reported Single centre randomised controlled trial in USA Participants: 17 Infants < 1500 g at birth (range 560 to 1440 g) randomly allocated to formulas for 2 weeks Intervention: similac Special Care with 100 or 250 μL MaxEPA (DHA 0.2% or 0.5%) per 4‐ounce bottle (intermediate PUFA intake) Control: similac Special Care with soybean oil 250 μL (no DHA) (low PUFA intake) Outcome: plasma phospholipid AA and DHA Did not report allergy | |
| Excluded as allergy not prespecified or reported Single centre randomised controlled trial in USA before 2003 Pregnant women who planned to breastfeed their infants exclusively for at least 4 months Breastfeeding women (n = 138) allocated within 1 week of delivery for 4 months Intervention (n = 51 reported): algae‐derived triglyceride capsule 200 mg DHA/day Control (n = 50 reported): placebo capsule Infant outcomes not reported | |
| Excluded as supplementation period < 1 month, allergy not prespecified or reported Single centre randomised controlled trial in Mexico Participants: 27 preterm and term infants with sepsis after a surgical procedure given DHA or placebo for 2 weeks Intervention: DHA supplement 100 mg (intermediate PUFA intake) Control: olive oil 100 mg (intermediate PUFA intake) Outcomes: fatty acid profile, growth, illness severity after 2 weeks Did not report allergy | |
| Excluded as allergy not prespecified or reported Multicentre randomised controlled trial in Germany October 2000 to August 2002 Pregnant women supplemented until 3 months' postpartum (n = 144) (numbers per group not specified) Exclusion criteria for prospective mothers were increased risk of premature delivery or multiple pregnancy, allergy to cow's milk protein, lactose intolerance, diabetes, smoking, consumption of alcohol (> 20 g/week), or participation in another study. Infants were excluded from the study if they were premature at birth (< 37 weeks’ gestation), had any major malformations or were hospitalised for more than 1 week Intervention: DHA supplement 200 mg/day + prebiotic (intermediate PUFA intake) Control: no DHA supplement (intermediate PUFA intake) (2 control groups, prebiotic in 1 group) Outcome: growth up to 21 months | |
| Excluded as allergy not prespecified or reported Single centre randomised controlled trial in Australia before 1995 Women giving birth to healthy infants of 37 to 42 weeks' gestation, supplemented until 30 weeks age (formula fed). Participants (n = 89) (numbers per group not specified, includes breast milk fed controls) Intervention: LCPUFA supplemented formula using fish and evening primrose oil (γ‐LA 0.27% + AA 0.01% + EPA 0.58% + DHA 0.36%) (intermediate‐high PUFA intake) Control: standard formula (γ‐LA 0.05% + no AA or EPA or DHA) (intermediate PUFA intake) Outcome: fatty acid profile, visual evoked potentials, growth up to 30 weeks | |
| Excluded as allergy not prespecified or reported Single centre randomised controlled trial in Australia December 1993 and November 1994 Healthy, white, term infants supplemented until 12 months (formula fed) Intervention 1 (n = 27): DHA 0.35% supplemented formula from tuna oil (intermediate PUFA intake) Intervention 2 (n = 28): AA 0.34% + DHA 0.34% supplemented formula from egg phospholipid (intermediate PUFA intake) Control (n = 28): standard formula (intermediate PUFA intake) Outcome: fatty acid profile, growth up to 2 years | |
| Excluded as allergy not prespecified or reported Single centre randomised controlled trial in Australia November 1994 and June 1995 Healthy, white, term infants supplemented from birth to 34 weeks (formula fed) Intervention: LA:α‐LA 16.6%:3.3% (5:1) (total n‐6 = 16.9%; total n‐3 = 3.3%) Control: LA:α‐LA of 16.9%:1.7% (10:1) (total n‐6 = 17.0%; total n‐3 = 1.7%) Outcome: fatty acid profiles, growth and visual evoked potential acuity | |
| Excluded as allergy not prespecified or reported Single centre randomised controlled trial in Brazil before 2002 Preterm very‐low‐birth‐weight infants on full enteral feeding for 2 days, gestational age 28 to 34 weeks; birth weight 900 to 1500 g supplemented for 30 days (formula fed) Intervention (n = 20): egg lipid extracts 0.9 g/100 kcal = 0.63% and evening primrose oil supplemented formula (α‐LA 0.2% + EPA 0.03% + AA 0.5% + DHA 0.3%; n‐3 0.8%) (intermediate PUFA intake) Control (n = 20): standard formula (AA 0.05%; no α‐LA or EPA or DHA; n‐3 = 0.4%) (intermediate PUFA intake) Outcome: fatty acid profile, growth at 30 days | |
| Excluded as allergy not prespecified or reported Single centre randomised controlled trial in France before 1998 Term neonates supplemented for 6 weeks (formula fed). Participants (n = 98) (numbers per group not specified, includes breast milk fed controls) Intervention 1 (high EPA): fish oil supplemented formulas (no AA; EPA 0.35% + DHA 0.45%) (intermediate PUFA intake) Intervention 2 (low EPA): fish oil supplemented formulas (no AA; EPA 0.10% + DHA 0.45%) (intermediate PUFA intake) Control: standard formula (no AA; EPA 0.10% + DHA 0.45%) (intermediate PUFA intake) Outcome: fatty acid profile at 6 weeks | |
| Excluded as allergy not prespecified or reported Single centre randomised controlled trial in USA before 1995 Full term newborn infants appropriate for gestational age with gestational age 37 to 41 weeks supplemented until 12 months (formula fed) Intervention (n = 22): LCPUFA supplemented formula (PUFA 16.3%) (high PUFA intake) Control (n = 20): high monounsaturated fatty acid formula (PUFA 7.1%) (intermediate PUFA intake) Outcome: fatty acid profile, growth up to 12 months | |
| Excluded as used co‐interventions that differed between treatment and control groups, allergy not prespecified or reported Multicentre randomised controlled trial in Norway Participants: very‐low‐birth‐weight infants within 24 hours after birth Intervention group (n = 24): received significantly higher amounts of energy, protein, lipids, vitamin A, AA and DHA in parenteral and enteral nutrition (intermediate‐high PUFA intake) Control group (n = 26): lower amounts of energy, protein, lipids, vitamin A, AA and DHA in parenteral and enteral nutrition (intermediate PUFA intake) Outcomes: postnatal growth and clinical outcome during neonatal hospitalisation, urinary metabolite profiles Did not report allergy | |
| Excluded as supplementation period < 1 month, allergy not prespecified or reported Single centre randomised controlled trial in UK Participants: 20 preterm infants < 32 weeks, birth weight 1000 to 1500 g randomly allocated to formulas for 6 days (formula fed) Intervention (n = 10): preterm formula with LCPUFA supplement (intermediate‐high PUFA intake) Control (n = 10): preterm formula without LCPUFA supplement (intermediate PUFA intake) Outcome: fatty acid profile, fat excretion at 6 days Did not report allergy | |
| Excluded as supplementation period < 1 month, allergy not prespecified or reported Single centre randomised controlled trial in UK Participants: 20 term infants 37 to 42 weeks, birth weight 2500 to 4500 g randomly allocated to formulas for 6 days (formula fed) Intervention (n = 10): term formula with LCPUFA supplement (intermediate‐high PUFA intake) Control (n = 10): term formula without LCPUFA supplement (intermediate PUFA intake) Outcome: fatty acid profile, fat excretion at 6 days Did not report allergy | |
| Excluded as supplementation period < 1 month, allergy not prespecified or reported Single centre randomised controlled trial in Spain Participants: 31 preterm infants (mean gestation 34 weeks) fed 1 of 3 formulas for 20 days Control (n = 9): preterm formula with no LCPUFA (intermediate PUFA intake) Intervention 2 + 3 (n = 21): preterm formula with LCPUFA (intermediate PUFA intake) Outcome: metabolic parameters, tolerance up to 20 days Did not report allergy | |
| Excluded as allergy not prespecified or reported Multicentre randomised controlled trial in USA before 1992 Full‐term 37 to 42 weeks' gestation with weight, length and head circumference 5th to 95th percentile supplemented until 8 weeks (formula fed) Intervention (n = 11: losses not reported): soy oil based formula (60% soy oil and 40% coconut oil: LA 34.2%; α‐LA 4.8%) (high PUFA intake) Control (n = 14: losses not reported): corn oil based formula (50% corn oil and 50% coconut oil: LA 31.4%; α‐LA 0.8%) (intermediate PUFA intake) Outcome: fatty acid profile, growth, development up to 8 weeks | |
| Excluded as allergy not prespecified or reported Single centre randomised controlled trial in Brazil before 2001 Preterm neonates supplemented for 30 days (formula fed) Intervention (n = 17): LCPUFA supplemented formula (EA 0.18% + AA 0.34% + adrenic acid 0.16% + DHA 0.23%) (intermediate PUFA intake) Control (n = 17): standard formula (no EA or AA or Adrenic acid or DHA) (intermediate PUFA intake) Outcome: fatty acid profile, growth at 30 days. Tolerance recorded | |
| Excluded as supplementation period < 1 month Single centre randomised controlled trial in Hungary Participants: preterm infants (gestational age < 37 weeks), birth weight 1000 to 2000 g, weight appropriate for gestational age, exclusive formula feeding with a minimal daily ingestion of 100 mL/kg Randomised to formula for 7 days Intervention: 40% medium‐chain triglycerides (total n‐6 PUFA 11.98%; n‐3 PUFA 1.13%) (intermediate PUFA intake) Control: minimal medium chain fatty acids (total n‐6 PUFA 13.28%; n‐3 PUFA 1.03%) (intermediate PUFA intake) Outcome: fatty acid metabolism Did not report allergy | |
| Excluded as allergy not prespecified or reported 2 centre randomised controlled trial in USA May 1993 and September 1994 Healthy low‐birth‐weight infants 940 to 2250 g beginning at 7 to 10 days prior to hospital discharge to 59 weeks' postmenstrual age Intervention (n = 46): DHA 0.2% from fish oil (EPA 0.04% + AA 0.1% + DHA 0.2%) Control (n = 44): control formula (no EPA or AA or DHA) Outcome: growth and body composition to 59 weeks' postmenstrual age. Sudden infant death syndrome | |
| Excluded as allergy not prespecified or reported Multicentre randomised controlled trial in Germany before 2012 Preterm neonates birth weight 1000 to 2200 g exclusively (80% of total energy intake) fed formula or human milk supplemented for 28 days Intervention 1 (n = 13): DHA supplemented formula (DHA 0.33%) (intermediate to intermediate‐high PUFA intake; total PUFA = 18.42%; total n‐6 LC‐PUFA = 0.16%; total n‐3 LC‐PUFA = 0.41%). Intervention 2 (n = 15): DHA supplemented formula (DHA 0.52%) (intermediate to intermediate‐high PUFA intake; total PUFA = 19.01%; total n‐6 LC‐PUFA = 0.20%; total n‐3 LC‐PUFA = 0.65%). Control (n = 14): low DHA formula (DHA 0.04%) (intermediate PUFA intake; total PUFA = 18.21%; total n‐6 LC‐PUFA = 0.12%; total n‐3 LC‐PUFA = 0.05%) Outcome: fatty acid profile, growth up to 28 days | |
| Excluded as allergy not prespecified or reported Multicentre randomised controlled trial in Germany September 2005 and July 2006 Healthy term newborn infants (gestational age > 37 weeks, birth weight > 2500 g); German speaking mother; intention to breastfeed Randomly allocated to complementary food (commercial vegetable‐potato‐meat meals in jars) from 4 to 6 months of age until 10 months Intervention (n = 66): rapeseed oil complementary feeds (LA 20%; α‐LA 9%; LA/α‐LA = 2.2) (intermediate PUFA intake) Control (n = 66): corn oil complementary feeds (LA 55%; α‐LA 1%; LA/α‐LA = 55) (intermediate PUFA intake) Outcome: fatty acid profile at 10 months | |
| Excluded as allergy not prespecified or reported Single centre randomised controlled trial in Greece before 2007 Preterm neonates (n = 140) gestational age ≥ 28 weeks, birth weight ≥ 1000 g, no family history of hyper‐ or hypolipidaemias, no congenital malformation and mothers who elected formula feeding supplemented for 1 month Intervention (n = 50 excluding losses): LCPUFA supplemented formula (AA 12.0 mg/100 mL and DHA 7.1 mg/100 mL) (unclear PUFA intake) Control (n = 54 excluding losses): unsupplemented formula (no AA or DHA) (unclear PUFA intake) Outcome: lipid peroxidation in serum after 1 month; adiponectin levels; visfatin levels; neonatal morbidity to discharge | |
| Excluded as allergy not prespecified or reported Single centre randomised controlled trial in Pakistan before 2000 Malnourished infants (8 to 30 months) supplemented for 9 weeks (mixed feeding) Intervention (n = 10): fish oil supplement (AA 10 mg/day; EPA 190 mg/day; DHA 112 mg/day) (intermediate‐high PUFA intake) Control (n = 7): no fish oil supplement (low‐intermediate PUFA intake) Outcome: fatty acid profile, growth after 9 weeks | |
| Excluded as supplementation period < 1 month, allergy not prespecified or reported Single centre randomised controlled trial in Netherlands Participants: 29 mothers who were breastfeeding 3 to 10 months supplemented for 7 days Intervention 1 (n = 10): AA oil 0.8 mL (intermediate PUFA intake) Intervention 2 (n = 9): AA oil 0.8 mL + DHA oil 1.7 mL (intermediate‐high PUFA intake) Control (n = 10): unsupplemented (intermediate PUFA intake) Outcome: breast milk fatty acid composition Did not report allergy | |
| Excluded as infants with cholestasis, allergy not prespecified or reported Single centre randomised controlled trial in Poland Participants: infants with cholestasis (2 to 5 months) supplemented for 1 month (formula fed) Intervention (n = 11): LCPUFA supplemented formula (intermediate PUFA intake) Control (n = 12): standard formula (low‐intermediate PUFA intake) Outcome: fatty acid profile, growth after 1 month Did not report allergy | |
| Excluded as supplementation period < 1 month, allergy not prespecified or reported Single centre randomised controlled trial in Germany Participants: 20 preterm infants < 32 weeks, birth weight < 2000 g randomly allocated to formulas for 3 weeks Intervention (n = 10): preterm formula with LCPUFA supplement (intermediate PUFA intake) Control (n = 10): preterm formula without LCPUFA supplement (intermediate PUFA intake) Outcome: urine prostanoids, growth up to 3 weeks Did not report allergy | |
| Excluded as allergy not prespecified or reported Single centre randomised controlled trial in USA before 1990 Preterm neonates birth weight 1000 to 1500 g; appropriate for gestational age, enteral feedings 70 to 120 kcal/kg and free of major neonatal morbidity by day 10. Supplemented until 36 weeks' corrected gestational age (formula fed) Control (n = 10): formula medium‐chain triglyceride/coconut/corn oil blend (predominant n‐6 PUFA: oleic acid 11.8%; LA 24.2%; α‐LA 0.5%; n‐6 > C18 none; n‐3 > C18 none) (low‐intermediate PUFA intake) Intervention 1 (n = 10): formula medium‐chain triglyceride/coconut/soy blend (high n‐3 PUFA: oleic acid 10.3%; LA 20.8%; α‐LA 2.7; n‐6 > C18 none; n‐3 > C18 none) (intermediate‐high PUFA intake) Intervention 2 (n = 12): formula medium‐chain triglyceride/ coconut/ soy/marine oil blend (high n‐3 PUFA: oleic acid 10.7%; LA 20.4%; α‐LA 1.4; n‐6 > C18 0.1%; n‐3 > C18 1.0%) (intermediate‐high PUFA intake) Outcome: fatty acid profile, visual evoked potentials, growth at 36 weeks' corrected gestational age. Growth, clinical tolerance, coagulation test results, changes in erythrocyte membrane fluidity and plasma concentrations of vitamins A and E from 30 to 57 weeks' postmenstrual age | |
| Excluded as allergy not prespecified or reported Single centre randomised controlled trial in Turkey November 2000 and September 2001 Healthy, full term newborns appropriate size for gestational age who were not going to be breastfed supplemented until 16 weeks (formula fed) Intervention (n = 28): DHA supplemented formula (oleic acid 50.8%; LA 9.7%; α‐LA 1.2% DHA 0.5%) (intermediate PUFA intake) Control (n = 26): unsupplemented formula (oleic acid 44.9%; LA 11.2%; α‐LA 2.2%: no DHA) (intermediate PUFA intake) Outcome: auditory evoked potentials at 16 weeks | |
| Excluded as allergy not prespecified or reported Single centre randomised controlled trial in Belgium before 1986 Healthy full‐term infants fed formula for 30 days Control (n = 10): 80% derived from milk‐fat, 20% from corn oil (C16:1 3.6%; C18:1 32.4%; C18:2 12.8%; C18:3 1.0%; C20:4 0.8%) Intervention (n = 10): vegetable origin (73% palm olein, 20% coconut oil, 7% corn oil) (C16:1 0.2%; C18:1 37.5%; C18:2 15.1%; C18:3 0.3%; C20:4 0.3%) Outcome: plasma lipoprotein composition | |
| Excluded as allergy not prespecified or reported Single centre randomised controlled trial in Belgium before 1992 Healthy term newborn infants supplemented until 30 days (formula fed) Intervention (n = 10): α‐LA supplemented formula (C18:2n‐6 14.8%; C18:3n‐6 0.7%; C20:2n‐6 0.1%; C18:3n‐3 0.6%; cholesterol 4.0%) (low‐intermediate PUFA intake) Control (n = 10): unsupplemented formula (C18:2n‐6 13.4%; C18:3n‐3 0.1%; cholesterol 10.0%) (low‐intermediate PUFA intake) Outcome: fatty acid profile at 30 days | |
| Excluded as allergy not prespecified or reported Multicentre randomised controlled trial in Gambia May 2007 to October 2008 172 rural Gambian infants aged 3 to 9 months (mixed feeding) Intervention (n = 92): fish oil supplement (EPA 300 mg/day + DHA 200 mg/day) (intermediate‐high PUFA intake) Control (n = 91): olive oil supplement (intermediate PUFA intake) Outcome: gut integrity, morbidity, growth, development up to 12 months | |
| Excluded as allergy not prespecified or reported Multicentre randomised controlled trial in Netherlands December 2004 to December 2006 Women supplemented from enrolment 12 to 20th weeks' pregnancy until 12 weeks' postpartum Intervention 1 (n = 63): DHA 220 mg supplement + 1 capsule soy bean oil (intermediate‐high PUFA intake) Intervention 2 (n = 58): AA 220 mg + DHA 220 mg supplement (intermediate‐high PUFA intake) Control (n = 62): placebo 2 capsules soy bean oil (intermediate PUFA intake) Outcome: human milk AA + DHA content; general movements assessment at 12 weeks; neurodevelopment at 18 months; depressive symptoms | |
| Excluded as allergy not prespecified or reported Single centre randomised controlled trial in Netherlands September 1993 and January 1996 Preterm neonates < 34 weeks' gestation, birth weight < 1750 g and normal neurological examination throughout the neonatal period. Supplemented until 6 months' corrected age (formula fed) Intervention (n = 28): AA 0.70% + DHA 0.34% supplemented formula (unclear PUFA intake) Control (n = 27): standard formula (low‐intermediate PUFA intake) Outcome: magnetic resonance imaging, visual acuity and development up to 2 years' corrected age | |
| Excluded as allergy not prespecified or reported Multicentre randomised controlled trial in USA before 1999 Preterm neonates medically stable, < 28 days old, had received enteral feedings for < 24 hours, birth weight 750 to 2000 g and appropriate for gestational age. Supplemented until 8 weeks' corrected age (formula fed) Intervention (n = 77): LCPUFA supplemented formula (AA 0.50% + DHA 0.35%) (unclear PUFA intake) Control (n = 78): standard formula (no AA or DHA) (unclear PUFA intake) Outcome: fatty acid profile, growth up to 8 weeks' corrected age | |
| Excluded as allergy not prespecified or reported Single centre randomised controlled trial in Israel before 1998 Term neonates supplemented for 30 days (formula fed) Intervention (n = 25): PUFA supplemented formula (LA 24.2%, α‐LA 0.25%) (unclear PUFA intake) Control (n = 25): standard formula (unclear PUFA intake) Outcome: growth, development up to 3 months. Reported safety and efficacy Written in Hebrew; English abstract | |
| Excluded as allergy not prespecified or reported Single centre randomised controlled trial in USA before 2013 Preterm neonates with enterostomies supplemented postoperatively until reanastomosis (2 to 10 weeks) (mixed feeding) Intervention (n = 18): fish oil supplement (infants < 1000 g: 0.2 g every 12 hours; infants > 1000 g: 0.25 g every 12 hours; maximum 0.5 g every 6 hours) (DHA dose range 50 to < 315 mg/day) (high PUFA intake) Control (n = 78): no fish oil supplement (intermediate PUFA intake) Outcome: fat absorption, growth until reanastomosis |
AA: arachidonic acid; DHA: docosahexaenoic acid; EPA: eicosapentaenoic acid; IU: international unit; LA: linoleic acid; LCPUFA: long chain polyunsaturated fatty acid; PUFA: polyunsaturated fatty acid.
Characteristics of ongoing studies [ordered by study ID]
| Trial name or title | PUFA Supplementation in Premature Infants |
| Methods | Multicentre, randomised, placebo controlled, double blind trial |
| Participants | Inclusion criteria: premature infant born at gestational age < 34 weeks; birth weight < 1000 g; legally authorised representative is able to provide written informed consent within the first 72 hours of life, prior to the performance of a protocol‐specified evaluations or procedures Exclusion criteria: infants with known metabolic disorder or known congenital gastrointestinal anomaly. Infants who are deemed to be inappropriate for enrolment per attending neonatologist |
| Interventions | 2 doses of PUFA will be compared to placebo ‐ a "high" dose and a "low" dose |
| Outcomes | LCPUFA levels measured at 2 and 8 weeks of life Resolvin, a metabolite of LCPUFA, measured at 2 and 8 weeks of life |
| Starting date | ‐ |
| Contact information | ‐ |
| Notes | ClinicalTrials.gov Identifier: NCT01955044 |
| Trial name or title | Can Omega 3 Fatty Acids Improve Respiratory Outcomes in Preterm Infants? |
| Methods | Randomised controlled trial |
| Participants | Inclusion criteria: born at < 29 weeks' gestational age; within 3 days of commencing enteral feeds; has a legally acceptable representative capable of understanding the informed consent document and providing consent on the infant's behalf Exclusion criteria: infants who have a major congenital or chromosomal abnormality; women providing breast milk who are taking supplements providing DHA > 250 mg/day and do not wish to stop taking supplements; infants participating in another fatty acid study; infants receiving intravenous lipid emulsions containing fish oil given as early lipid parenteral nutrition support |
| Interventions | Intervention: tuna oil emulsion containing DHA 120 mg/mL to provide DHA 60 mg/kg/day (0.17 mL/kg 3 times a day). Intervention given enterally within 72 hours of the first enteral feed and continued until 36 weeks' postmenstrual age or discharge home (whichever occurs first) Control: soy oil emulsion with no additional DHA given at 0.17 mL/kg 3 times a day. Control given enterally within 72 hours of the first enteral feed and continued until 36 weeks' postmenstrual age or discharge home (whichever occurs first) |
| Outcomes | Bronchopulmonary dysplasia at 36 weeks' postmenstrual age; safety and tolerability; length of hospital stay; growth rate; grade of intraventricular haemorrhage; confirmed sepsis; confirmed necrotising enterocolitis; grade of retinopathy of prematurity and death Attention (ability to resist distraction) to 2 years' corrected age |
| Starting date | 2012 |
| Contact information | ‐ |
| Notes | ACTRN12612000503820 |
| Trial name or title | The Influence of a Formula Supplemented with Dairy Lipids and Plant Oils on the Erythrocyte Membrane Omega‐3 Fatty Acid Profile in Healthy Full‐Term Infants |
| Methods | Double‐blind controlled randomised trial |
| Participants | 75 healthy full‐term infants Inclusion criteria: gestational age 37 to 42 weeks, birth weight > 2500 g, healthy newborns from normal pregnancy, aged up to 3 weeks when entering the study Exclusion criteria: newborns whose parents have planned to move within 6 months after birth, newborns with a positive family history of allergy to milk proteins, newborns with known congenital or postnatal diseases which could interfere with the study |
| Interventions | 4 months of formula feeding Control: formula supplemented with a mixture of dairy lipids and plant oils or a formula containing only plant oils Intervention: formula containing plant oils supplemented with arachidonic acid and DHA |
| Outcomes | Erythrocyte membrane omega‐3 fatty acid profile, LCPUFAs and the other fatty acids content, plasma lipid profile and insulin‐growth factor 1 level measured after 4 months Gastrointestinal tolerance, the changes in blood fatty acids content, in growth and body composition Adverse events and serious adverse events |
| Starting date | 2012 |
| Contact information | ‐ |
| Notes | ClinicalTrials.gov Identifier NCT01611649 |
| Trial name or title | The Effects of Polyunsaturated Fatty Acids (PUFA) on Allergic/Atopic Dermatitis |
| Methods | Randomised double blind controlled trial |
| Participants | Inclusion criteria: woman pregnant between 16 and 20 weeks, mother delivers after 36 weeks, mother is willing to breastfeed for 4 months, mother has potential to deliver a child with increased risk of atopic dermatitis, signed informed consent Exclusion criteria: mother is smoking, disease with influence on breastfeeding, complicated pregnancy, allergic to seafood, allergic to soy, allergic to marine fish, mother has > 2 salmon or tuna meals per week, mother is undergoing treatment with anticoagulants |
| Interventions | PUFA supplementation during pregnancy and lactation period |
| Outcomes | Fatty acid composition in human milk and plasma of the mothers and the clinical outcome of atopic dermatitis in infants at increased risk |
| Starting date | April 2015 (postponed) |
| Contact information | ‐ |
| Notes | ClinicalTrials.gov Identifier: NCT01936194 |
| Trial name or title | Effect of Docosahexaenoic Acid (DHA)‐Enriched Human Milk in Premature Newborns (DHARMA) |
| Methods | Randomised double blind controlled trial |
| Participants | Inclusion criteria: childbirth between 34 and 35 weeks' gestational age, breastfeeding, Caucasian, affiliation to social security, obtained consent from mother and parents for the child, mother with balanced diet, no allergy to eggs, single pregnancy Exclusion criteria: allergy to egg, unbalanced diet, diabetes, known digestive disease, contraindication with breastfeeding, smoker (> 5 cigarettes/day), alcoholism (daily consumption of alcohol), multiple pregnancy |
| Interventions | Lactating mothers and their newborn with mothers Supplemented with DHA Glycerophospholipid enriched in docosahexaenoic acid No supplementation |
| Outcomes | PUFA status and infant survey at 6 months |
| Starting date | February 2010 |
| Contact information | ‐ |
| Notes | This study has been terminated (difficulties of recruitment) |
DHA: docosahexaenoic acid; LCPUFA: long chain polyunsaturated fatty acid; PUFA: polyunsaturated fatty acid.
Data and analyses
| Outcome or subgroup title | No. of studies | No. of participants | Statistical method | Effect size |
| 1 All allergic disease Show forest plot | 5 | Risk Ratio (M‐H, Fixed, 95% CI) | Subtotals only | |
| Analysis 1.1 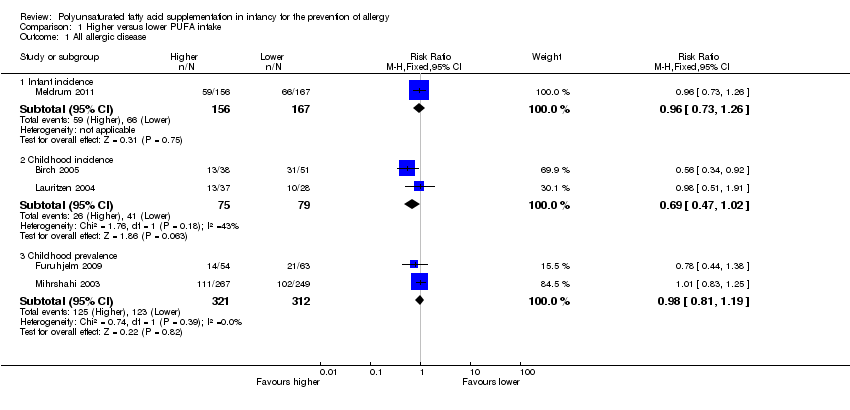 Comparison 1 Higher versus lower PUFA intake, Outcome 1 All allergic disease. | ||||
| 1.1 Infant incidence | 1 | 323 | Risk Ratio (M‐H, Fixed, 95% CI) | 0.96 [0.73, 1.26] |
| 1.2 Childhood incidence | 2 | 154 | Risk Ratio (M‐H, Fixed, 95% CI) | 0.69 [0.47, 1.02] |
| 1.3 Childhood prevalence | 2 | 633 | Risk Ratio (M‐H, Fixed, 95% CI) | 0.98 [0.81, 1.19] |
| 2 Asthma Show forest plot | 4 | Risk Ratio (M‐H, Fixed, 95% CI) | Subtotals only | |
| Analysis 1.2  Comparison 1 Higher versus lower PUFA intake, Outcome 2 Asthma. | ||||
| 2.1 Infant incidence | 3 | 1162 | Risk Ratio (M‐H, Fixed, 95% CI) | 1.04 [0.80, 1.35] |
| 2.2 Childhood incidence | 1 | 89 | Risk Ratio (M‐H, Fixed, 95% CI) | 0.45 [0.20, 1.02] |
| 2.3 Childhood prevalence | 2 | 635 | Risk Ratio (M‐H, Fixed, 95% CI) | 1.12 [0.82, 1.53] |
| 3 Dermatitis/eczema Show forest plot | 9 | Risk Ratio (M‐H, Fixed, 95% CI) | Subtotals only | |
| Analysis 1.3 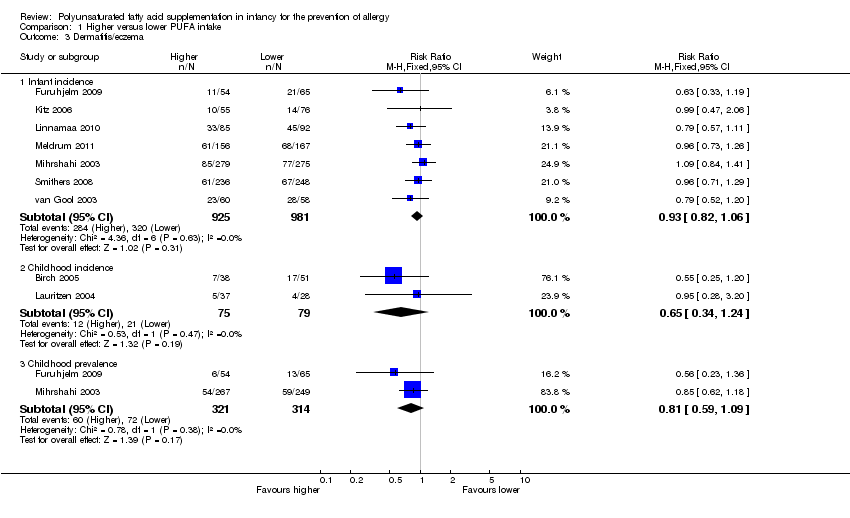 Comparison 1 Higher versus lower PUFA intake, Outcome 3 Dermatitis/eczema. | ||||
| 3.1 Infant incidence | 7 | 1906 | Risk Ratio (M‐H, Fixed, 95% CI) | 0.93 [0.82, 1.06] |
| 3.2 Childhood incidence | 2 | 154 | Risk Ratio (M‐H, Fixed, 95% CI) | 0.65 [0.34, 1.24] |
| 3.3 Childhood prevalence | 2 | 635 | Risk Ratio (M‐H, Fixed, 95% CI) | 0.81 [0.59, 1.09] |
| 4 Allergic rhinitis Show forest plot | 3 | Risk Ratio (M‐H, Fixed, 95% CI) | Subtotals only | |
| Analysis 1.4  Comparison 1 Higher versus lower PUFA intake, Outcome 4 Allergic rhinitis. | ||||
| 4.1 Infant incidence | 2 | 594 | Risk Ratio (M‐H, Fixed, 95% CI) | 0.47 [0.23, 0.96] |
| 4.2 Childhood prevalence | 2 | 635 | Risk Ratio (M‐H, Fixed, 95% CI) | 1.02 [0.83, 1.25] |
| 5 Food allergy Show forest plot | 4 | Risk Ratio (M‐H, Fixed, 95% CI) | Subtotals only | |
| Analysis 1.5  Comparison 1 Higher versus lower PUFA intake, Outcome 5 Food allergy. | ||||
| 5.1 Infant incidence | 3 | 915 | Risk Ratio (M‐H, Fixed, 95% CI) | 0.81 [0.56, 1.19] |
| 5.2 Childhood incidence | 1 | 65 | Risk Ratio (M‐H, Fixed, 95% CI) | 2.27 [0.25, 20.68] |
| 5.3 Childhood prevalence | 1 | 119 | Risk Ratio (M‐H, Fixed, 95% CI) | 0.27 [0.06, 1.19] |
| Outcome or subgroup title | No. of studies | No. of participants | Statistical method | Effect size |
| 1 All allergic disease ‐ infant incidence Show forest plot | 1 | Risk Ratio (M‐H, Fixed, 95% CI) | Subtotals only | |
| Analysis 2.1 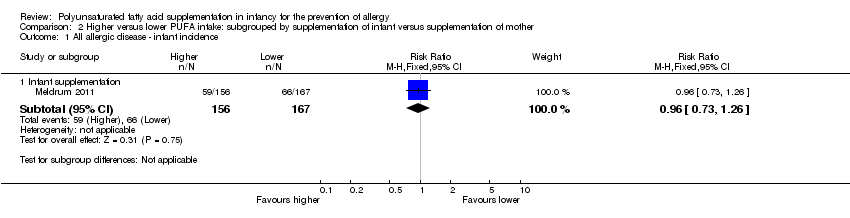 Comparison 2 Higher versus lower PUFA intake: subgrouped by supplementation of infant versus supplementation of mother, Outcome 1 All allergic disease ‐ infant incidence. | ||||
| 1.1 Infant supplementation | 1 | 323 | Risk Ratio (M‐H, Fixed, 95% CI) | 0.96 [0.73, 1.26] |
| 2 All allergic disease ‐ childhood incidence Show forest plot | 2 | Risk Ratio (M‐H, Fixed, 95% CI) | Subtotals only | |
| Analysis 2.2  Comparison 2 Higher versus lower PUFA intake: subgrouped by supplementation of infant versus supplementation of mother, Outcome 2 All allergic disease ‐ childhood incidence. | ||||
| 2.1 Infant supplementation | 1 | 89 | Risk Ratio (M‐H, Fixed, 95% CI) | 0.56 [0.34, 0.92] |
| 2.2 Maternal supplementation | 1 | 65 | Risk Ratio (M‐H, Fixed, 95% CI) | 0.98 [0.51, 1.91] |
| 3 All allergic disease ‐ childhood prevalence Show forest plot | 2 | Risk Ratio (M‐H, Fixed, 95% CI) | Subtotals only | |
| Analysis 2.3  Comparison 2 Higher versus lower PUFA intake: subgrouped by supplementation of infant versus supplementation of mother, Outcome 3 All allergic disease ‐ childhood prevalence. | ||||
| 3.1 Infant supplementation | 1 | 516 | Risk Ratio (M‐H, Fixed, 95% CI) | 1.01 [0.83, 1.25] |
| 3.2 Maternal supplementation | 1 | 117 | Risk Ratio (M‐H, Fixed, 95% CI) | 0.78 [0.44, 1.38] |
| 4 Asthma ‐ infant incidence Show forest plot | 3 | Risk Ratio (M‐H, Fixed, 95% CI) | Subtotals only | |
| Analysis 2.4  Comparison 2 Higher versus lower PUFA intake: subgrouped by supplementation of infant versus supplementation of mother, Outcome 4 Asthma ‐ infant incidence. | ||||
| 4.1 Infant supplementation | 1 | 554 | Risk Ratio (M‐H, Fixed, 95% CI) | 1.19 [0.78, 1.81] |
| 4.2 Maternal supplementation | 2 | 608 | Risk Ratio (M‐H, Fixed, 95% CI) | 0.96 [0.69, 1.33] |
| 5 Asthma ‐ childhood incidence Show forest plot | 1 | Risk Ratio (M‐H, Fixed, 95% CI) | Subtotals only | |
| Analysis 2.5  Comparison 2 Higher versus lower PUFA intake: subgrouped by supplementation of infant versus supplementation of mother, Outcome 5 Asthma ‐ childhood incidence. | ||||
| 5.1 Infant supplementation | 1 | 89 | Risk Ratio (M‐H, Fixed, 95% CI) | 0.45 [0.20, 1.02] |
| 6 Asthma ‐ childhood prevalence Show forest plot | 2 | Risk Ratio (M‐H, Fixed, 95% CI) | Subtotals only | |
| Analysis 2.6  Comparison 2 Higher versus lower PUFA intake: subgrouped by supplementation of infant versus supplementation of mother, Outcome 6 Asthma ‐ childhood prevalence. | ||||
| 6.1 Infant supplementation | 1 | 516 | Risk Ratio (M‐H, Fixed, 95% CI) | 1.13 [0.82, 1.57] |
| 6.2 Maternal supplementation | 1 | 119 | Risk Ratio (M‐H, Fixed, 95% CI) | 1.05 [0.41, 2.72] |
| 7 Dermatitis/eczema ‐ infant incidence Show forest plot | 7 | Risk Ratio (M‐H, Fixed, 95% CI) | Subtotals only | |
| Analysis 2.7  Comparison 2 Higher versus lower PUFA intake: subgrouped by supplementation of infant versus supplementation of mother, Outcome 7 Dermatitis/eczema ‐ infant incidence. | ||||
| 7.1 Infant supplementation | 5 | 1245 | Risk Ratio (M‐H, Fixed, 95% CI) | 0.95 [0.82, 1.11] |
| 7.2 Maternal supplementation | 3 | 661 | Risk Ratio (M‐H, Fixed, 95% CI) | 0.88 [0.68, 1.15] |
| 8 Dermatitis/eczema ‐ childhood incidence Show forest plot | 2 | Risk Ratio (M‐H, Fixed, 95% CI) | Subtotals only | |
| Analysis 2.8  Comparison 2 Higher versus lower PUFA intake: subgrouped by supplementation of infant versus supplementation of mother, Outcome 8 Dermatitis/eczema ‐ childhood incidence. | ||||
| 8.1 Infant supplementation | 1 | 89 | Risk Ratio (M‐H, Fixed, 95% CI) | 0.55 [0.25, 1.20] |
| 8.2 Maternal supplementation | 1 | 65 | Risk Ratio (M‐H, Fixed, 95% CI) | 0.95 [0.28, 3.20] |
| 9 Dermatitis/eczema ‐ childhood prevalence Show forest plot | 2 | Risk Ratio (M‐H, Fixed, 95% CI) | Subtotals only | |
| Analysis 2.9  Comparison 2 Higher versus lower PUFA intake: subgrouped by supplementation of infant versus supplementation of mother, Outcome 9 Dermatitis/eczema ‐ childhood prevalence. | ||||
| 9.1 Infant supplementation | 1 | 516 | Risk Ratio (M‐H, Fixed, 95% CI) | 0.85 [0.62, 1.18] |
| 9.2 Maternal supplementation | 1 | 119 | Risk Ratio (M‐H, Fixed, 95% CI) | 0.56 [0.23, 1.36] |
| 10 Allergic rhinitis ‐ infant incidence Show forest plot | 2 | Risk Ratio (M‐H, Fixed, 95% CI) | Subtotals only | |
| Analysis 2.10  Comparison 2 Higher versus lower PUFA intake: subgrouped by supplementation of infant versus supplementation of mother, Outcome 10 Allergic rhinitis ‐ infant incidence. | ||||
| 10.1 Maternal supplementation | 2 | 594 | Risk Ratio (M‐H, Fixed, 95% CI) | 0.47 [0.23, 0.96] |
| 11 Allergic rhinitis ‐ childhood prevalence Show forest plot | 2 | Risk Ratio (M‐H, Fixed, 95% CI) | Subtotals only | |
| Analysis 2.11  Comparison 2 Higher versus lower PUFA intake: subgrouped by supplementation of infant versus supplementation of mother, Outcome 11 Allergic rhinitis ‐ childhood prevalence. | ||||
| 11.1 Infant supplementation | 1 | 516 | Risk Ratio (M‐H, Fixed, 95% CI) | 1.01 [0.83, 1.25] |
| 11.2 Maternal supplementation | 1 | 119 | Risk Ratio (M‐H, Fixed, 95% CI) | 1.20 [0.18, 8.26] |
| 12 Food allergy ‐ infant incidence Show forest plot | 3 | Risk Ratio (M‐H, Fixed, 95% CI) | Subtotals only | |
| Analysis 2.12  Comparison 2 Higher versus lower PUFA intake: subgrouped by supplementation of infant versus supplementation of mother, Outcome 12 Food allergy ‐ infant incidence. | ||||
| 12.1 Infant supplementation | 1 | 323 | Risk Ratio (M‐H, Fixed, 95% CI) | 0.81 [0.47, 1.42] |
| 12.2 Maternal supplementation | 2 | 592 | Risk Ratio (M‐H, Fixed, 95% CI) | 0.81 [0.48, 1.37] |
| 13 Food allergy ‐ childhood incidence Show forest plot | 1 | Risk Ratio (M‐H, Fixed, 95% CI) | Subtotals only | |
| Analysis 2.13  Comparison 2 Higher versus lower PUFA intake: subgrouped by supplementation of infant versus supplementation of mother, Outcome 13 Food allergy ‐ childhood incidence. | ||||
| 13.1 Maternal supplementation | 1 | 65 | Risk Ratio (M‐H, Fixed, 95% CI) | 2.27 [0.25, 20.68] |
| 14 Food allergy ‐ childhood prevalence Show forest plot | 1 | Risk Ratio (M‐H, Fixed, 95% CI) | Subtotals only | |
| Analysis 2.14  Comparison 2 Higher versus lower PUFA intake: subgrouped by supplementation of infant versus supplementation of mother, Outcome 14 Food allergy ‐ childhood prevalence. | ||||
| 14.1 Maternal supplementation | 1 | 119 | Risk Ratio (M‐H, Fixed, 95% CI) | 0.27 [0.06, 1.19] |
| Outcome or subgroup title | No. of studies | No. of participants | Statistical method | Effect size |
| 1 All allergic disease ‐ infant incidence Show forest plot | 1 | Risk Ratio (M‐H, Fixed, 95% CI) | Subtotals only | |
| Analysis 3.1 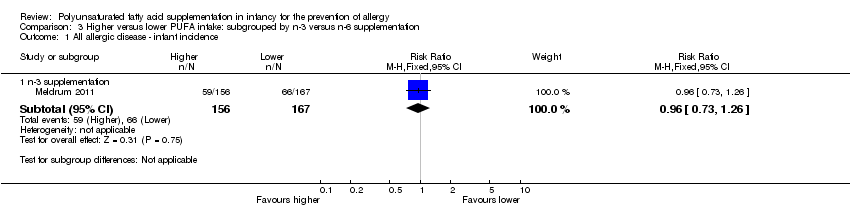 Comparison 3 Higher versus lower PUFA intake: subgrouped by n‐3 versus n‐6 supplementation, Outcome 1 All allergic disease ‐ infant incidence. | ||||
| 1.1 n‐3 supplementation | 1 | 323 | Risk Ratio (M‐H, Fixed, 95% CI) | 0.96 [0.73, 1.26] |
| 2 All allergic disease ‐ childhood incidence Show forest plot | 2 | Risk Ratio (M‐H, Fixed, 95% CI) | Subtotals only | |
| Analysis 3.2  Comparison 3 Higher versus lower PUFA intake: subgrouped by n‐3 versus n‐6 supplementation, Outcome 2 All allergic disease ‐ childhood incidence. | ||||
| 2.1 n‐3 supplementation | 2 | 154 | Risk Ratio (M‐H, Fixed, 95% CI) | 0.69 [0.47, 1.02] |
| 3 All allergic disease ‐ childhood prevalence Show forest plot | 2 | Risk Ratio (M‐H, Fixed, 95% CI) | Subtotals only | |
| Analysis 3.3  Comparison 3 Higher versus lower PUFA intake: subgrouped by n‐3 versus n‐6 supplementation, Outcome 3 All allergic disease ‐ childhood prevalence. | ||||
| 3.1 n‐3 supplementation | 2 | 633 | Risk Ratio (M‐H, Fixed, 95% CI) | 0.98 [0.81, 1.19] |
| 4 Asthma ‐ infant incidence Show forest plot | 3 | Risk Ratio (M‐H, Fixed, 95% CI) | Subtotals only | |
| Analysis 3.4  Comparison 3 Higher versus lower PUFA intake: subgrouped by n‐3 versus n‐6 supplementation, Outcome 4 Asthma ‐ infant incidence. | ||||
| 4.1 n‐3 supplementation | 3 | 1162 | Risk Ratio (M‐H, Fixed, 95% CI) | 1.04 [0.80, 1.35] |
| 5 Asthma ‐ childhood incidence Show forest plot | 1 | Risk Ratio (M‐H, Fixed, 95% CI) | Subtotals only | |
| Analysis 3.5 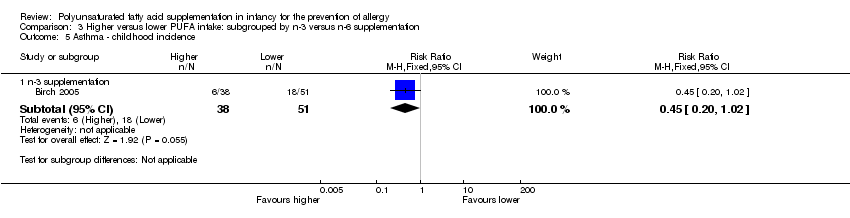 Comparison 3 Higher versus lower PUFA intake: subgrouped by n‐3 versus n‐6 supplementation, Outcome 5 Asthma ‐ childhood incidence. | ||||
| 5.1 n‐3 supplementation | 1 | 89 | Risk Ratio (M‐H, Fixed, 95% CI) | 0.45 [0.20, 1.02] |
| 6 Asthma ‐ childhood prevalence Show forest plot | 2 | Risk Ratio (M‐H, Fixed, 95% CI) | Subtotals only | |
| Analysis 3.6  Comparison 3 Higher versus lower PUFA intake: subgrouped by n‐3 versus n‐6 supplementation, Outcome 6 Asthma ‐ childhood prevalence. | ||||
| 6.1 n‐3 supplementation | 2 | 635 | Risk Ratio (M‐H, Fixed, 95% CI) | 1.12 [0.82, 1.53] |
| 7 Dermatitis/eczema ‐ infant incidence Show forest plot | 7 | Risk Ratio (M‐H, Fixed, 95% CI) | Subtotals only | |
| Analysis 3.7 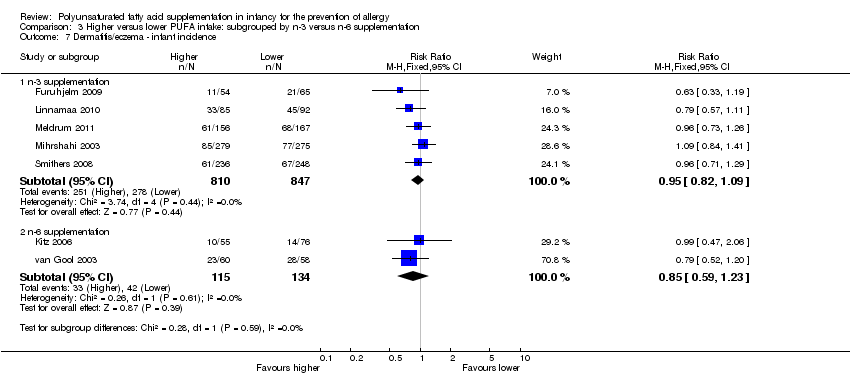 Comparison 3 Higher versus lower PUFA intake: subgrouped by n‐3 versus n‐6 supplementation, Outcome 7 Dermatitis/eczema ‐ infant incidence. | ||||
| 7.1 n‐3 supplementation | 5 | 1657 | Risk Ratio (M‐H, Fixed, 95% CI) | 0.95 [0.82, 1.09] |
| 7.2 n‐6 supplementation | 2 | 249 | Risk Ratio (M‐H, Fixed, 95% CI) | 0.85 [0.59, 1.23] |
| 8 Dermatitis/eczema ‐ childhood incidence Show forest plot | 2 | Risk Ratio (M‐H, Fixed, 95% CI) | Subtotals only | |
| Analysis 3.8  Comparison 3 Higher versus lower PUFA intake: subgrouped by n‐3 versus n‐6 supplementation, Outcome 8 Dermatitis/eczema ‐ childhood incidence. | ||||
| 8.1 n‐3 supplementation | 2 | 154 | Risk Ratio (M‐H, Fixed, 95% CI) | 0.65 [0.34, 1.24] |
| 9 Dermatitis/eczema ‐ childhood prevalence Show forest plot | 2 | Risk Ratio (M‐H, Fixed, 95% CI) | Subtotals only | |
| Analysis 3.9  Comparison 3 Higher versus lower PUFA intake: subgrouped by n‐3 versus n‐6 supplementation, Outcome 9 Dermatitis/eczema ‐ childhood prevalence. | ||||
| 9.1 n‐3 supplementation | 2 | 635 | Risk Ratio (M‐H, Fixed, 95% CI) | 0.81 [0.59, 1.09] |
| 10 Allergic rhinitis ‐ infant incidence Show forest plot | 2 | Risk Ratio (M‐H, Fixed, 95% CI) | Subtotals only | |
| Analysis 3.10 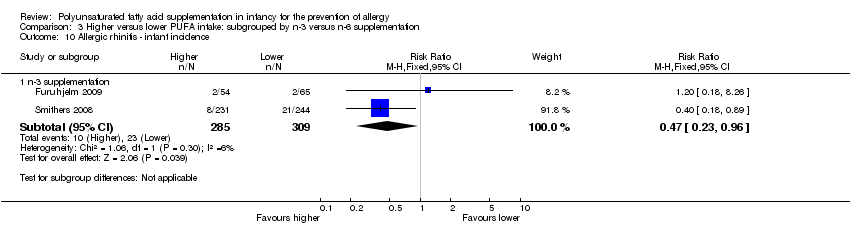 Comparison 3 Higher versus lower PUFA intake: subgrouped by n‐3 versus n‐6 supplementation, Outcome 10 Allergic rhinitis ‐ infant incidence. | ||||
| 10.1 n‐3 supplementation | 2 | 594 | Risk Ratio (M‐H, Fixed, 95% CI) | 0.47 [0.23, 0.96] |
| 11 Allergic rhinitis ‐ childhood prevalence Show forest plot | 2 | Risk Ratio (M‐H, Fixed, 95% CI) | Subtotals only | |
| Analysis 3.11  Comparison 3 Higher versus lower PUFA intake: subgrouped by n‐3 versus n‐6 supplementation, Outcome 11 Allergic rhinitis ‐ childhood prevalence. | ||||
| 11.1 n‐3 supplementation | 2 | 635 | Risk Ratio (M‐H, Fixed, 95% CI) | 1.02 [0.83, 1.25] |
| 12 Food allergy ‐ infant incidence Show forest plot | 3 | Risk Ratio (M‐H, Fixed, 95% CI) | Subtotals only | |
| Analysis 3.12  Comparison 3 Higher versus lower PUFA intake: subgrouped by n‐3 versus n‐6 supplementation, Outcome 12 Food allergy ‐ infant incidence. | ||||
| 12.1 n‐3 supplementation | 3 | 915 | Risk Ratio (M‐H, Fixed, 95% CI) | 0.81 [0.56, 1.19] |
| 13 Food allergy ‐ childhood incidence Show forest plot | 1 | Risk Ratio (M‐H, Fixed, 95% CI) | Subtotals only | |
| Analysis 3.13 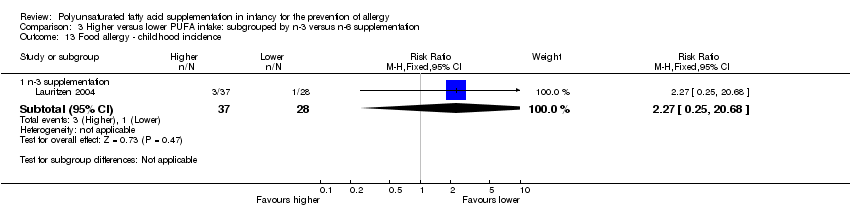 Comparison 3 Higher versus lower PUFA intake: subgrouped by n‐3 versus n‐6 supplementation, Outcome 13 Food allergy ‐ childhood incidence. | ||||
| 13.1 n‐3 supplementation | 1 | 65 | Risk Ratio (M‐H, Fixed, 95% CI) | 2.27 [0.25, 20.68] |
| 14 Food allergy ‐ childhood prevalence Show forest plot | 1 | Risk Ratio (M‐H, Fixed, 95% CI) | Subtotals only | |
| Analysis 3.14  Comparison 3 Higher versus lower PUFA intake: subgrouped by n‐3 versus n‐6 supplementation, Outcome 14 Food allergy ‐ childhood prevalence. | ||||
| 14.1 n‐3 supplementation | 1 | 119 | Risk Ratio (M‐H, Fixed, 95% CI) | 0.27 [0.06, 1.19] |
| Outcome or subgroup title | No. of studies | No. of participants | Statistical method | Effect size |
| 1 All allergic disease ‐ infant incidence Show forest plot | 1 | Risk Ratio (M‐H, Fixed, 95% CI) | Subtotals only | |
| Analysis 4.1  Comparison 4 Higher versus lower PUFA intake: subgrouped by method of infant feeding, Outcome 1 All allergic disease ‐ infant incidence. | ||||
| 1.1 Human milk fed infants | 1 | 323 | Risk Ratio (M‐H, Fixed, 95% CI) | 0.96 [0.73, 1.26] |
| 2 All allergic disease ‐ childhood incidence Show forest plot | 2 | Risk Ratio (M‐H, Fixed, 95% CI) | Subtotals only | |
| Analysis 4.2  Comparison 4 Higher versus lower PUFA intake: subgrouped by method of infant feeding, Outcome 2 All allergic disease ‐ childhood incidence. | ||||
| 2.1 Human milk fed infants | 1 | 65 | Risk Ratio (M‐H, Fixed, 95% CI) | 0.98 [0.51, 1.91] |
| 2.2 Formula fed infants | 1 | 89 | Risk Ratio (M‐H, Fixed, 95% CI) | 0.56 [0.34, 0.92] |
| 3 All allergic disease ‐ childhood prevalence Show forest plot | 2 | Risk Ratio (M‐H, Fixed, 95% CI) | Subtotals only | |
| Analysis 4.3 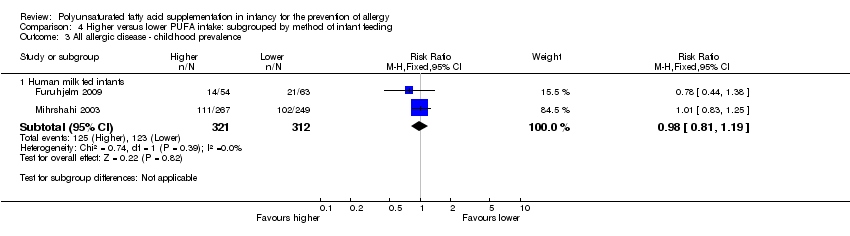 Comparison 4 Higher versus lower PUFA intake: subgrouped by method of infant feeding, Outcome 3 All allergic disease ‐ childhood prevalence. | ||||
| 3.1 Human milk fed infants | 2 | 633 | Risk Ratio (M‐H, Fixed, 95% CI) | 0.98 [0.81, 1.19] |
| 4 Asthma ‐ infant incidence Show forest plot | 3 | Risk Ratio (M‐H, Fixed, 95% CI) | Subtotals only | |
| Analysis 4.4  Comparison 4 Higher versus lower PUFA intake: subgrouped by method of infant feeding, Outcome 4 Asthma ‐ infant incidence. | ||||
| 5 Asthma ‐ childhood incidence Show forest plot | 1 | Risk Ratio (M‐H, Fixed, 95% CI) | Subtotals only | |
| Analysis 4.5  Comparison 4 Higher versus lower PUFA intake: subgrouped by method of infant feeding, Outcome 5 Asthma ‐ childhood incidence. | ||||
| 5.1 Formula fed infants | 1 | 89 | Risk Ratio (M‐H, Fixed, 95% CI) | 0.45 [0.20, 1.02] |
| 6 Asthma ‐ childhood prevalence Show forest plot | 2 | Risk Ratio (M‐H, Fixed, 95% CI) | Subtotals only | |
| Analysis 4.6  Comparison 4 Higher versus lower PUFA intake: subgrouped by method of infant feeding, Outcome 6 Asthma ‐ childhood prevalence. | ||||
| 6.1 Human milk fed infants | 2 | 635 | Risk Ratio (M‐H, Fixed, 95% CI) | 1.12 [0.82, 1.53] |
| 7 Dermatitis/eczema ‐ infant incidence Show forest plot | 7 | Risk Ratio (M‐H, Fixed, 95% CI) | Subtotals only | |
| Analysis 4.7  Comparison 4 Higher versus lower PUFA intake: subgrouped by method of infant feeding, Outcome 7 Dermatitis/eczema ‐ infant incidence. | ||||
| 7.1 Human milk fed infants | 6 | 1715 | Risk Ratio (M‐H, Fixed, 95% CI) | 0.95 [0.82, 1.09] |
| 7.2 Formula fed infants | 2 | 191 | Risk Ratio (M‐H, Fixed, 95% CI) | 0.84 [0.57, 1.23] |
| 8 Dermatitis/eczema ‐ childhood incidence Show forest plot | 2 | Risk Ratio (M‐H, Fixed, 95% CI) | Subtotals only | |
| Analysis 4.8  Comparison 4 Higher versus lower PUFA intake: subgrouped by method of infant feeding, Outcome 8 Dermatitis/eczema ‐ childhood incidence. | ||||
| 8.1 Human milk fed infants | 1 | 65 | Risk Ratio (M‐H, Fixed, 95% CI) | 0.95 [0.28, 3.20] |
| 8.2 Formula fed infants | 1 | 89 | Risk Ratio (M‐H, Fixed, 95% CI) | 0.55 [0.25, 1.20] |
| 9 Dermatitis/eczema ‐ childhood prevalence Show forest plot | 2 | Risk Ratio (M‐H, Fixed, 95% CI) | Subtotals only | |
| Analysis 4.9  Comparison 4 Higher versus lower PUFA intake: subgrouped by method of infant feeding, Outcome 9 Dermatitis/eczema ‐ childhood prevalence. | ||||
| 9.1 Human milk fed infants | 2 | 635 | Risk Ratio (M‐H, Fixed, 95% CI) | 0.81 [0.59, 1.09] |
| 10 Allergic rhinitis ‐ infant incidence Show forest plot | 2 | Risk Ratio (M‐H, Fixed, 95% CI) | Subtotals only | |
| Analysis 4.10  Comparison 4 Higher versus lower PUFA intake: subgrouped by method of infant feeding, Outcome 10 Allergic rhinitis ‐ infant incidence. | ||||
| 10.1 Human milk fed infants | 2 | 594 | Risk Ratio (M‐H, Fixed, 95% CI) | 0.47 [0.23, 0.96] |
| 11 Allergic rhinitis ‐ childhood prevalence Show forest plot | 2 | Risk Ratio (M‐H, Fixed, 95% CI) | Subtotals only | |
| Analysis 4.11 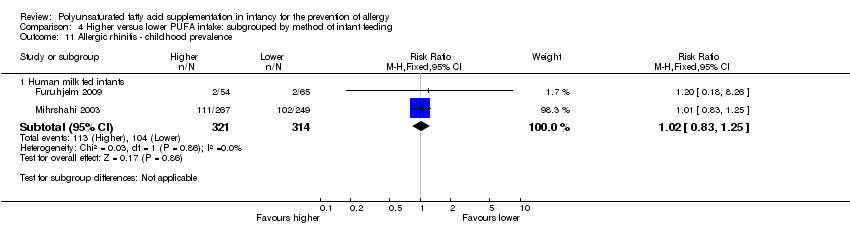 Comparison 4 Higher versus lower PUFA intake: subgrouped by method of infant feeding, Outcome 11 Allergic rhinitis ‐ childhood prevalence. | ||||
| 11.1 Human milk fed infants | 2 | 635 | Risk Ratio (M‐H, Fixed, 95% CI) | 1.02 [0.83, 1.25] |
| 12 Food allergy ‐ infant incidence Show forest plot | 3 | Risk Ratio (M‐H, Fixed, 95% CI) | Subtotals only | |
| Analysis 4.12  Comparison 4 Higher versus lower PUFA intake: subgrouped by method of infant feeding, Outcome 12 Food allergy ‐ infant incidence. | ||||
| 12.1 Human milk fed infants | 3 | 915 | Risk Ratio (M‐H, Fixed, 95% CI) | 0.81 [0.56, 1.19] |
| 13 Food allergy ‐ childhood incidence Show forest plot | 1 | Risk Ratio (M‐H, Fixed, 95% CI) | Subtotals only | |
| Analysis 4.13 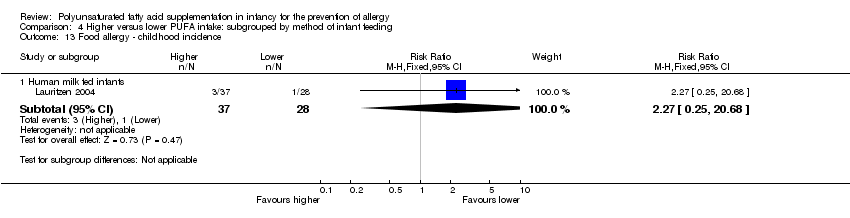 Comparison 4 Higher versus lower PUFA intake: subgrouped by method of infant feeding, Outcome 13 Food allergy ‐ childhood incidence. | ||||
| 13.1 Human milk fed infants | 1 | 65 | Risk Ratio (M‐H, Fixed, 95% CI) | 2.27 [0.25, 20.68] |
| 14 Food allergy ‐ childhood prevalence Show forest plot | 1 | Risk Ratio (M‐H, Fixed, 95% CI) | Subtotals only | |
| Analysis 4.14  Comparison 4 Higher versus lower PUFA intake: subgrouped by method of infant feeding, Outcome 14 Food allergy ‐ childhood prevalence. | ||||
| 14.1 Human milk fed infants | 1 | 119 | Risk Ratio (M‐H, Fixed, 95% CI) | 0.27 [0.06, 1.19] |
| Outcome or subgroup title | No. of studies | No. of participants | Statistical method | Effect size |
| 1 All allergic disease ‐ infant incidence Show forest plot | 1 | Risk Ratio (M‐H, Fixed, 95% CI) | Subtotals only | |
| Analysis 5.1  Comparison 5 Higher versus lower PUFA intake: subgrouped by infant heredity for allergy, Outcome 1 All allergic disease ‐ infant incidence. | ||||
| 1.1 High risk for allergy | 1 | 323 | Risk Ratio (M‐H, Fixed, 95% CI) | 0.96 [0.73, 1.26] |
| 2 All allergic disease ‐ childhood incidence Show forest plot | 2 | Risk Ratio (M‐H, Fixed, 95% CI) | Subtotals only | |
| Analysis 5.2  Comparison 5 Higher versus lower PUFA intake: subgrouped by infant heredity for allergy, Outcome 2 All allergic disease ‐ childhood incidence. | ||||
| 2.1 Risk for allergy not selected | 2 | 154 | Risk Ratio (M‐H, Fixed, 95% CI) | 0.69 [0.47, 1.02] |
| 3 All allergic disease ‐ childhood prevalence Show forest plot | 2 | Risk Ratio (M‐H, Fixed, 95% CI) | Subtotals only | |
| Analysis 5.3  Comparison 5 Higher versus lower PUFA intake: subgrouped by infant heredity for allergy, Outcome 3 All allergic disease ‐ childhood prevalence. | ||||
| 3.1 High risk for allergy | 2 | 633 | Risk Ratio (M‐H, Fixed, 95% CI) | 0.98 [0.81, 1.19] |
| 4 Asthma ‐ infant incidence Show forest plot | 3 | Risk Ratio (M‐H, Fixed, 95% CI) | Subtotals only | |
| Analysis 5.4  Comparison 5 Higher versus lower PUFA intake: subgrouped by infant heredity for allergy, Outcome 4 Asthma ‐ infant incidence. | ||||
| 4.1 High risk for allergy | 2 | 673 | Risk Ratio (M‐H, Fixed, 95% CI) | 1.16 [0.79, 1.71] |
| 4.2 Risk for allergy not selected | 1 | 489 | Risk Ratio (M‐H, Fixed, 95% CI) | 0.94 [0.66, 1.34] |
| 5 Asthma ‐ childhood incidence Show forest plot | 1 | Risk Ratio (M‐H, Fixed, 95% CI) | Subtotals only | |
| Analysis 5.5 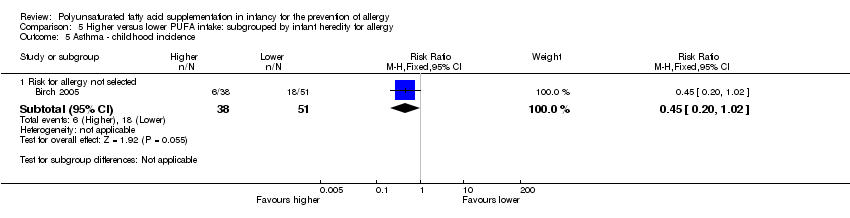 Comparison 5 Higher versus lower PUFA intake: subgrouped by infant heredity for allergy, Outcome 5 Asthma ‐ childhood incidence. | ||||
| 5.1 Risk for allergy not selected | 1 | 89 | Risk Ratio (M‐H, Fixed, 95% CI) | 0.45 [0.20, 1.02] |
| 6 Asthma ‐ childhood prevalence Show forest plot | 2 | Risk Ratio (M‐H, Fixed, 95% CI) | Subtotals only | |
| Analysis 5.6  Comparison 5 Higher versus lower PUFA intake: subgrouped by infant heredity for allergy, Outcome 6 Asthma ‐ childhood prevalence. | ||||
| 6.1 High risk for allergy | 2 | 635 | Risk Ratio (M‐H, Fixed, 95% CI) | 1.12 [0.82, 1.53] |
| 7 Dermatitis/eczema ‐ infant incidence Show forest plot | 7 | Risk Ratio (M‐H, Fixed, 95% CI) | Subtotals only | |
| Analysis 5.7 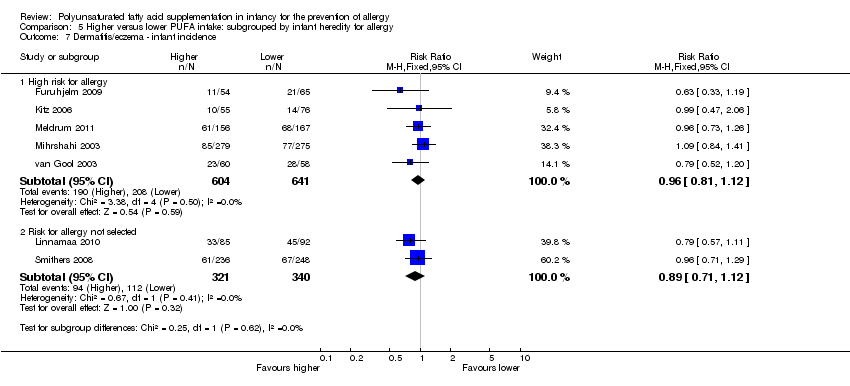 Comparison 5 Higher versus lower PUFA intake: subgrouped by infant heredity for allergy, Outcome 7 Dermatitis/eczema ‐ infant incidence. | ||||
| 7.1 High risk for allergy | 5 | 1245 | Risk Ratio (M‐H, Fixed, 95% CI) | 0.96 [0.81, 1.12] |
| 7.2 Risk for allergy not selected | 2 | 661 | Risk Ratio (M‐H, Fixed, 95% CI) | 0.89 [0.71, 1.12] |
| 8 Dermatitis/eczema ‐ childhood incidence Show forest plot | 2 | Risk Ratio (M‐H, Fixed, 95% CI) | Subtotals only | |
| Analysis 5.8  Comparison 5 Higher versus lower PUFA intake: subgrouped by infant heredity for allergy, Outcome 8 Dermatitis/eczema ‐ childhood incidence. | ||||
| 8.1 Risk for allergy not selected | 2 | 154 | Risk Ratio (M‐H, Fixed, 95% CI) | 0.65 [0.34, 1.24] |
| 9 Dermatitis/eczema ‐ childhood prevalence Show forest plot | 2 | Risk Ratio (M‐H, Fixed, 95% CI) | Subtotals only | |
| Analysis 5.9  Comparison 5 Higher versus lower PUFA intake: subgrouped by infant heredity for allergy, Outcome 9 Dermatitis/eczema ‐ childhood prevalence. | ||||
| 9.1 High risk for allergy | 2 | 635 | Risk Ratio (M‐H, Fixed, 95% CI) | 0.81 [0.59, 1.09] |
| 10 Allergic rhinitis ‐ infant incidence Show forest plot | 2 | Risk Ratio (M‐H, Fixed, 95% CI) | Subtotals only | |
| Analysis 5.10 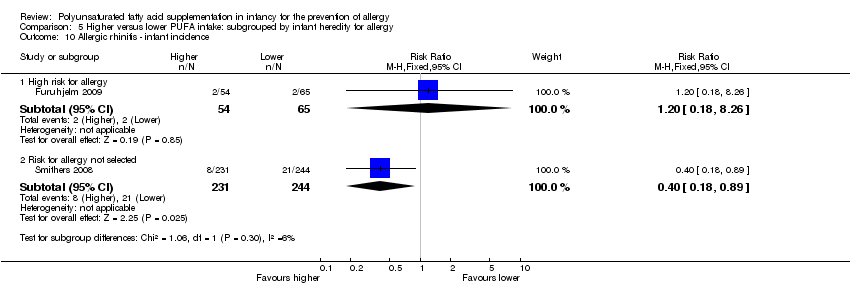 Comparison 5 Higher versus lower PUFA intake: subgrouped by infant heredity for allergy, Outcome 10 Allergic rhinitis ‐ infant incidence. | ||||
| 10.1 High risk for allergy | 1 | 119 | Risk Ratio (M‐H, Fixed, 95% CI) | 1.20 [0.18, 8.26] |
| 10.2 Risk for allergy not selected | 1 | 475 | Risk Ratio (M‐H, Fixed, 95% CI) | 0.40 [0.18, 0.89] |
| 11 Allergic rhinitis ‐ childhood prevalence Show forest plot | 2 | Risk Ratio (M‐H, Fixed, 95% CI) | Subtotals only | |
| Analysis 5.11  Comparison 5 Higher versus lower PUFA intake: subgrouped by infant heredity for allergy, Outcome 11 Allergic rhinitis ‐ childhood prevalence. | ||||
| 11.1 High risk for allergy | 2 | 635 | Risk Ratio (M‐H, Fixed, 95% CI) | 1.02 [0.83, 1.25] |
| 12 Food allergy ‐ infant incidence Show forest plot | 3 | Risk Ratio (M‐H, Fixed, 95% CI) | Subtotals only | |
| Analysis 5.12 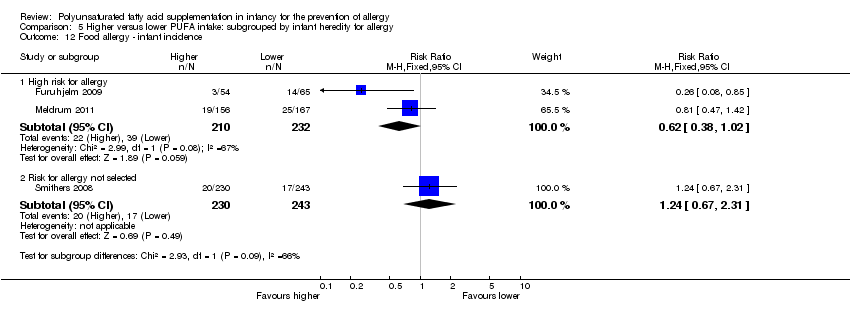 Comparison 5 Higher versus lower PUFA intake: subgrouped by infant heredity for allergy, Outcome 12 Food allergy ‐ infant incidence. | ||||
| 12.1 High risk for allergy | 2 | 442 | Risk Ratio (M‐H, Fixed, 95% CI) | 0.62 [0.38, 1.02] |
| 12.2 Risk for allergy not selected | 1 | 473 | Risk Ratio (M‐H, Fixed, 95% CI) | 1.24 [0.67, 2.31] |
| 13 Food allergy ‐ childhood incidence Show forest plot | 1 | Risk Ratio (M‐H, Fixed, 95% CI) | Subtotals only | |
| Analysis 5.13  Comparison 5 Higher versus lower PUFA intake: subgrouped by infant heredity for allergy, Outcome 13 Food allergy ‐ childhood incidence. | ||||
| 13.1 Risk for allergy not selected | 1 | 65 | Risk Ratio (M‐H, Fixed, 95% CI) | 2.27 [0.25, 20.68] |
| 14 Food allergy ‐ childhood prevalence Show forest plot | 1 | Risk Ratio (M‐H, Fixed, 95% CI) | Subtotals only | |
| Analysis 5.14  Comparison 5 Higher versus lower PUFA intake: subgrouped by infant heredity for allergy, Outcome 14 Food allergy ‐ childhood prevalence. | ||||
| 14.1 High risk for allergy | 1 | 119 | Risk Ratio (M‐H, Fixed, 95% CI) | 0.27 [0.06, 1.19] |
| Outcome or subgroup title | No. of studies | No. of participants | Statistical method | Effect size |
| 1 All allergic disease ‐ infant incidence Show forest plot | 1 | Risk Ratio (M‐H, Fixed, 95% CI) | Subtotals only | |
| Analysis 6.1 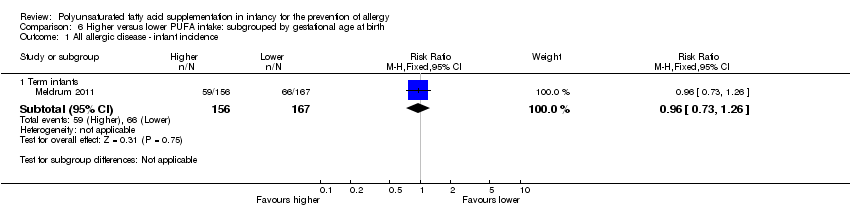 Comparison 6 Higher versus lower PUFA intake: subgrouped by gestational age at birth, Outcome 1 All allergic disease ‐ infant incidence. | ||||
| 1.1 Term infants | 1 | 323 | Risk Ratio (M‐H, Fixed, 95% CI) | 0.96 [0.73, 1.26] |
| 2 All allergic disease ‐ childhood incidence Show forest plot | 2 | Risk Ratio (M‐H, Fixed, 95% CI) | Subtotals only | |
| Analysis 6.2  Comparison 6 Higher versus lower PUFA intake: subgrouped by gestational age at birth, Outcome 2 All allergic disease ‐ childhood incidence. | ||||
| 2.1 Term infants | 2 | 154 | Risk Ratio (M‐H, Fixed, 95% CI) | 0.69 [0.47, 1.02] |
| 3 All allergic disease ‐ childhood prevalence Show forest plot | 2 | Risk Ratio (M‐H, Fixed, 95% CI) | Subtotals only | |
| Analysis 6.3  Comparison 6 Higher versus lower PUFA intake: subgrouped by gestational age at birth, Outcome 3 All allergic disease ‐ childhood prevalence. | ||||
| 3.1 Term infants | 2 | 633 | Risk Ratio (M‐H, Fixed, 95% CI) | 0.98 [0.81, 1.19] |
| 4 Asthma ‐ infant incidence Show forest plot | 3 | Risk Ratio (M‐H, Fixed, 95% CI) | Subtotals only | |
| Analysis 6.4 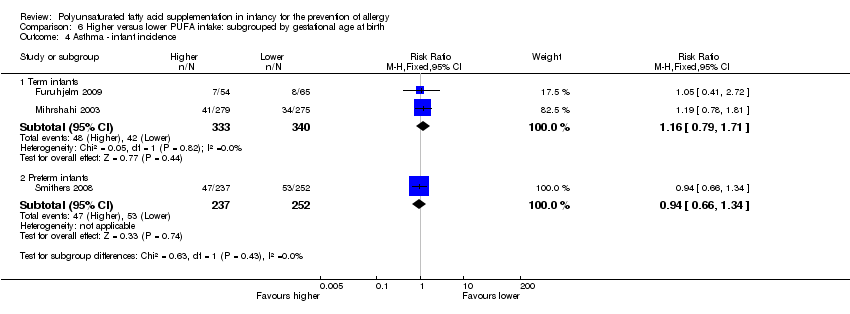 Comparison 6 Higher versus lower PUFA intake: subgrouped by gestational age at birth, Outcome 4 Asthma ‐ infant incidence. | ||||
| 4.1 Term infants | 2 | 673 | Risk Ratio (M‐H, Fixed, 95% CI) | 1.16 [0.79, 1.71] |
| 4.2 Preterm infants | 1 | 489 | Risk Ratio (M‐H, Fixed, 95% CI) | 0.94 [0.66, 1.34] |
| 5 Asthma ‐ childhood incidence Show forest plot | 1 | Risk Ratio (M‐H, Fixed, 95% CI) | Subtotals only | |
| Analysis 6.5  Comparison 6 Higher versus lower PUFA intake: subgrouped by gestational age at birth, Outcome 5 Asthma ‐ childhood incidence. | ||||
| 5.1 Term infants | 1 | 89 | Risk Ratio (M‐H, Fixed, 95% CI) | 0.45 [0.20, 1.02] |
| 6 Asthma ‐ childhood prevalence Show forest plot | 2 | Risk Ratio (M‐H, Fixed, 95% CI) | Subtotals only | |
| Analysis 6.6 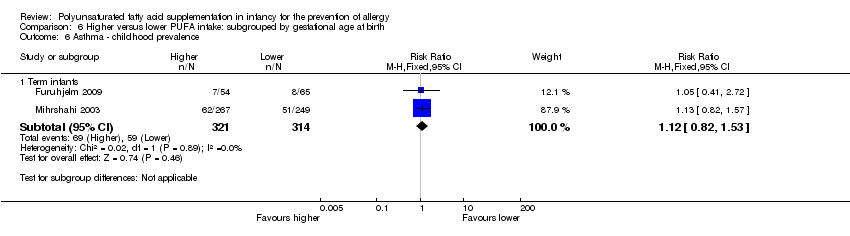 Comparison 6 Higher versus lower PUFA intake: subgrouped by gestational age at birth, Outcome 6 Asthma ‐ childhood prevalence. | ||||
| 6.1 Term infants | 2 | 635 | Risk Ratio (M‐H, Fixed, 95% CI) | 1.12 [0.82, 1.53] |
| 7 Dermatitis/eczema ‐ infant incidence Show forest plot | 7 | Risk Ratio (M‐H, Fixed, 95% CI) | Subtotals only | |
| Analysis 6.7  Comparison 6 Higher versus lower PUFA intake: subgrouped by gestational age at birth, Outcome 7 Dermatitis/eczema ‐ infant incidence. | ||||
| 7.1 Term infants | 6 | 1422 | Risk Ratio (M‐H, Fixed, 95% CI) | 0.93 [0.80, 1.07] |
| 7.2 Preterm infants | 1 | 484 | Risk Ratio (M‐H, Fixed, 95% CI) | 0.96 [0.71, 1.29] |
| 8 Dermatitis/eczema ‐ childhood incidence Show forest plot | 2 | Risk Ratio (M‐H, Fixed, 95% CI) | Subtotals only | |
| Analysis 6.8  Comparison 6 Higher versus lower PUFA intake: subgrouped by gestational age at birth, Outcome 8 Dermatitis/eczema ‐ childhood incidence. | ||||
| 8.1 Term infants | 2 | 154 | Risk Ratio (M‐H, Fixed, 95% CI) | 0.65 [0.34, 1.24] |
| 9 Dermatitis/eczema ‐ childhood prevalence Show forest plot | 2 | Risk Ratio (M‐H, Fixed, 95% CI) | Subtotals only | |
| Analysis 6.9  Comparison 6 Higher versus lower PUFA intake: subgrouped by gestational age at birth, Outcome 9 Dermatitis/eczema ‐ childhood prevalence. | ||||
| 9.1 Term infants | 2 | 635 | Risk Ratio (M‐H, Fixed, 95% CI) | 0.81 [0.59, 1.09] |
| 10 Allergic rhinitis ‐ infant incidence Show forest plot | 2 | Risk Ratio (M‐H, Fixed, 95% CI) | Subtotals only | |
| Analysis 6.10  Comparison 6 Higher versus lower PUFA intake: subgrouped by gestational age at birth, Outcome 10 Allergic rhinitis ‐ infant incidence. | ||||
| 10.1 Term infants | 1 | 119 | Risk Ratio (M‐H, Fixed, 95% CI) | 1.20 [0.18, 8.26] |
| 10.2 Preterm infants | 1 | 475 | Risk Ratio (M‐H, Fixed, 95% CI) | 0.40 [0.18, 0.89] |
| 11 Allergic rhinitis ‐ childhood prevalence Show forest plot | 2 | Risk Ratio (M‐H, Fixed, 95% CI) | Subtotals only | |
| Analysis 6.11 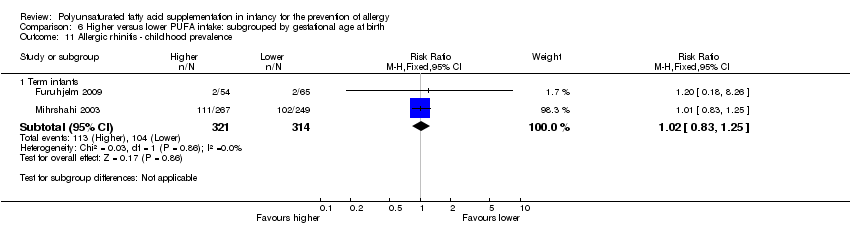 Comparison 6 Higher versus lower PUFA intake: subgrouped by gestational age at birth, Outcome 11 Allergic rhinitis ‐ childhood prevalence. | ||||
| 11.1 Term infants | 2 | 635 | Risk Ratio (M‐H, Fixed, 95% CI) | 1.02 [0.83, 1.25] |
| 12 Food allergy ‐ infant incidence Show forest plot | 3 | Risk Ratio (M‐H, Fixed, 95% CI) | Subtotals only | |
| Analysis 6.12  Comparison 6 Higher versus lower PUFA intake: subgrouped by gestational age at birth, Outcome 12 Food allergy ‐ infant incidence. | ||||
| 12.1 Term infants | 2 | 442 | Risk Ratio (M‐H, Fixed, 95% CI) | 0.62 [0.38, 1.02] |
| 12.2 Preterm infants | 1 | 473 | Risk Ratio (M‐H, Fixed, 95% CI) | 1.24 [0.67, 2.31] |
| 13 Food allergy ‐ childhood incidence Show forest plot | 1 | Risk Ratio (M‐H, Fixed, 95% CI) | Subtotals only | |
| Analysis 6.13  Comparison 6 Higher versus lower PUFA intake: subgrouped by gestational age at birth, Outcome 13 Food allergy ‐ childhood incidence. | ||||
| 13.1 Term infants | 1 | 65 | Risk Ratio (M‐H, Fixed, 95% CI) | 2.27 [0.25, 20.68] |
| 14 Food allergy ‐ childhood prevalence Show forest plot | 1 | Risk Ratio (M‐H, Fixed, 95% CI) | Subtotals only | |
| Analysis 6.14  Comparison 6 Higher versus lower PUFA intake: subgrouped by gestational age at birth, Outcome 14 Food allergy ‐ childhood prevalence. | ||||
| 14.1 Term infants | 1 | 119 | Risk Ratio (M‐H, Fixed, 95% CI) | 0.27 [0.06, 1.19] |
| Outcome or subgroup title | No. of studies | No. of participants | Statistical method | Effect size |
| 1 Asthma Show forest plot | 1 | Risk Ratio (M‐H, Fixed, 95% CI) | Subtotals only | |
| Analysis 7.1 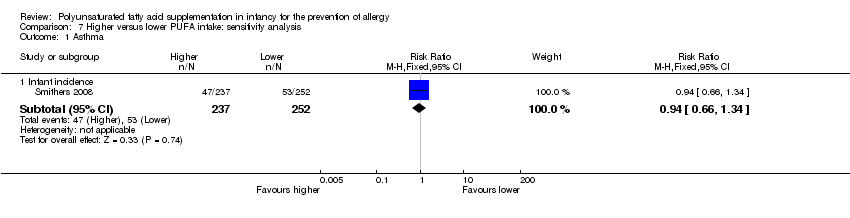 Comparison 7 Higher versus lower PUFA intake: sensitivity analysis, Outcome 1 Asthma. | ||||
| 1.1 Infant incidence | 1 | 489 | Risk Ratio (M‐H, Fixed, 95% CI) | 0.94 [0.66, 1.34] |
| 2 Dermatitis/eczema Show forest plot | 1 | Risk Ratio (M‐H, Fixed, 95% CI) | Subtotals only | |
| Analysis 7.2  Comparison 7 Higher versus lower PUFA intake: sensitivity analysis, Outcome 2 Dermatitis/eczema. | ||||
| 2.1 Infant incidence | 1 | 484 | Risk Ratio (M‐H, Fixed, 95% CI) | 0.96 [0.71, 1.29] |
| 3 Allergic rhinitis Show forest plot | 1 | Risk Ratio (M‐H, Fixed, 95% CI) | Subtotals only | |
| Analysis 7.3 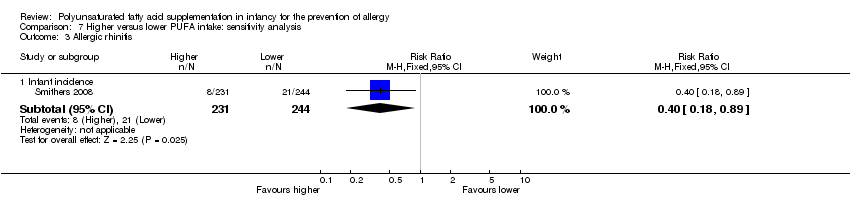 Comparison 7 Higher versus lower PUFA intake: sensitivity analysis, Outcome 3 Allergic rhinitis. | ||||
| 3.1 Infant incidence | 1 | 475 | Risk Ratio (M‐H, Fixed, 95% CI) | 0.40 [0.18, 0.89] |
| 4 Food allergy Show forest plot | 1 | Risk Ratio (M‐H, Fixed, 95% CI) | Subtotals only | |
| Analysis 7.4  Comparison 7 Higher versus lower PUFA intake: sensitivity analysis, Outcome 4 Food allergy. | ||||
| 4.1 Infant incidence | 1 | 473 | Risk Ratio (M‐H, Fixed, 95% CI) | 1.24 [0.67, 2.31] |

Risk of bias summary: review authors' judgements about each risk of bias item for each included study.

Comparison 1 Higher versus lower PUFA intake, Outcome 1 All allergic disease.
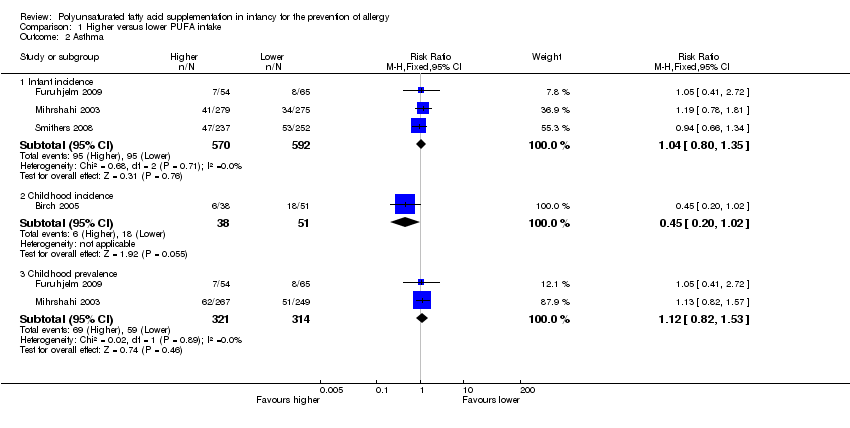
Comparison 1 Higher versus lower PUFA intake, Outcome 2 Asthma.

Comparison 1 Higher versus lower PUFA intake, Outcome 3 Dermatitis/eczema.
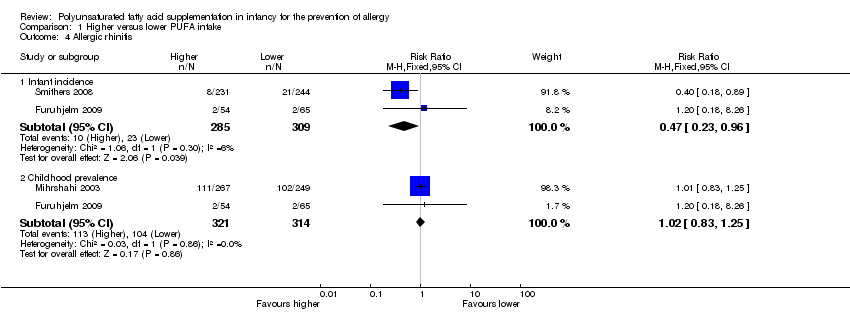
Comparison 1 Higher versus lower PUFA intake, Outcome 4 Allergic rhinitis.

Comparison 1 Higher versus lower PUFA intake, Outcome 5 Food allergy.

Comparison 2 Higher versus lower PUFA intake: subgrouped by supplementation of infant versus supplementation of mother, Outcome 1 All allergic disease ‐ infant incidence.

Comparison 2 Higher versus lower PUFA intake: subgrouped by supplementation of infant versus supplementation of mother, Outcome 2 All allergic disease ‐ childhood incidence.
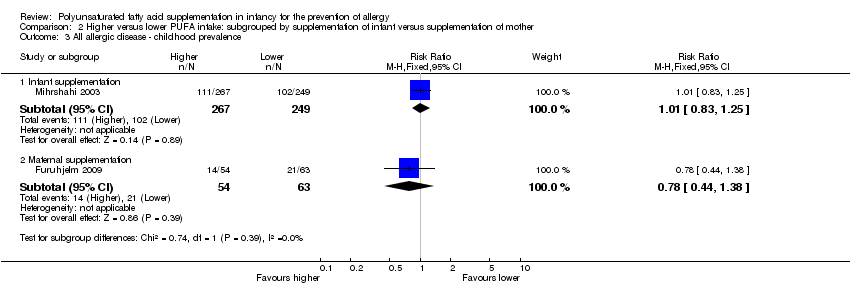
Comparison 2 Higher versus lower PUFA intake: subgrouped by supplementation of infant versus supplementation of mother, Outcome 3 All allergic disease ‐ childhood prevalence.

Comparison 2 Higher versus lower PUFA intake: subgrouped by supplementation of infant versus supplementation of mother, Outcome 4 Asthma ‐ infant incidence.
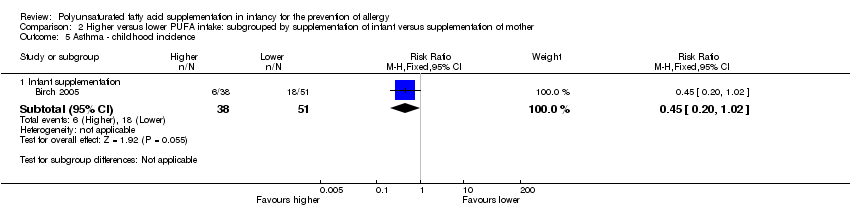
Comparison 2 Higher versus lower PUFA intake: subgrouped by supplementation of infant versus supplementation of mother, Outcome 5 Asthma ‐ childhood incidence.
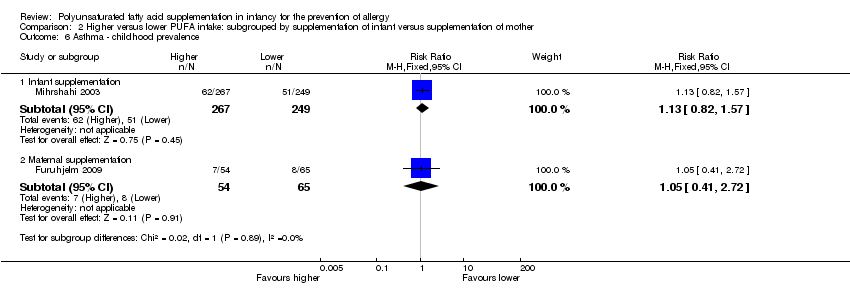
Comparison 2 Higher versus lower PUFA intake: subgrouped by supplementation of infant versus supplementation of mother, Outcome 6 Asthma ‐ childhood prevalence.

Comparison 2 Higher versus lower PUFA intake: subgrouped by supplementation of infant versus supplementation of mother, Outcome 7 Dermatitis/eczema ‐ infant incidence.
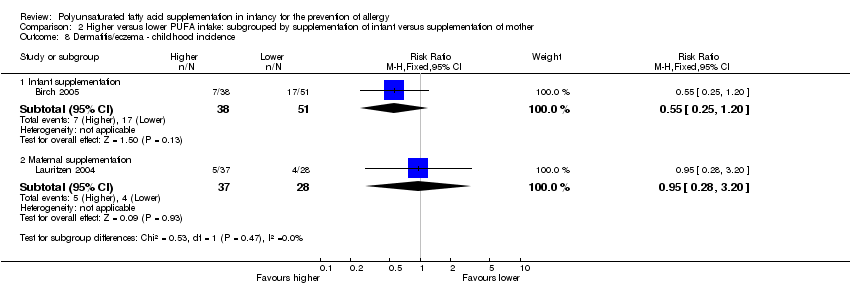
Comparison 2 Higher versus lower PUFA intake: subgrouped by supplementation of infant versus supplementation of mother, Outcome 8 Dermatitis/eczema ‐ childhood incidence.
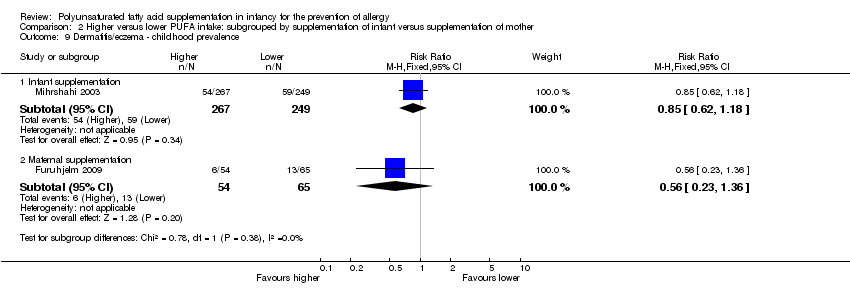
Comparison 2 Higher versus lower PUFA intake: subgrouped by supplementation of infant versus supplementation of mother, Outcome 9 Dermatitis/eczema ‐ childhood prevalence.
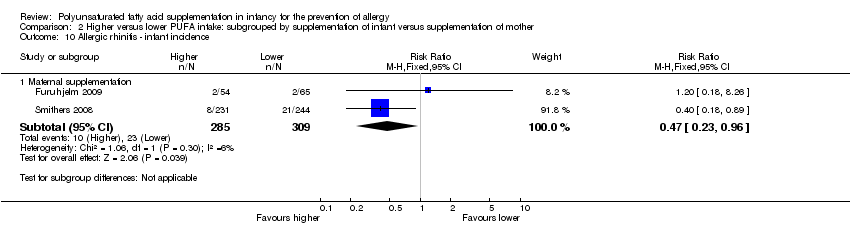
Comparison 2 Higher versus lower PUFA intake: subgrouped by supplementation of infant versus supplementation of mother, Outcome 10 Allergic rhinitis ‐ infant incidence.
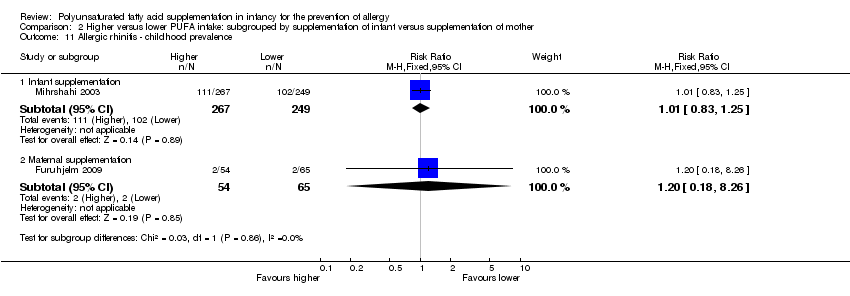
Comparison 2 Higher versus lower PUFA intake: subgrouped by supplementation of infant versus supplementation of mother, Outcome 11 Allergic rhinitis ‐ childhood prevalence.
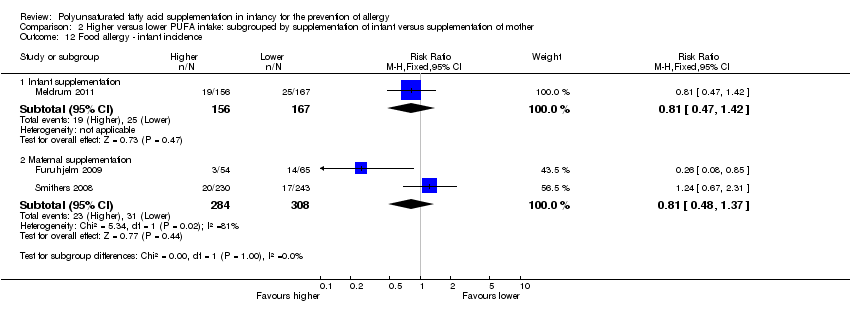
Comparison 2 Higher versus lower PUFA intake: subgrouped by supplementation of infant versus supplementation of mother, Outcome 12 Food allergy ‐ infant incidence.
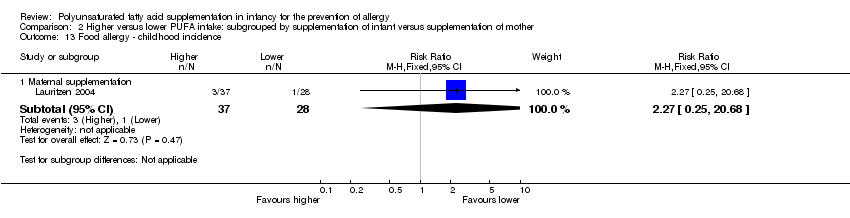
Comparison 2 Higher versus lower PUFA intake: subgrouped by supplementation of infant versus supplementation of mother, Outcome 13 Food allergy ‐ childhood incidence.

Comparison 2 Higher versus lower PUFA intake: subgrouped by supplementation of infant versus supplementation of mother, Outcome 14 Food allergy ‐ childhood prevalence.

Comparison 3 Higher versus lower PUFA intake: subgrouped by n‐3 versus n‐6 supplementation, Outcome 1 All allergic disease ‐ infant incidence.

Comparison 3 Higher versus lower PUFA intake: subgrouped by n‐3 versus n‐6 supplementation, Outcome 2 All allergic disease ‐ childhood incidence.
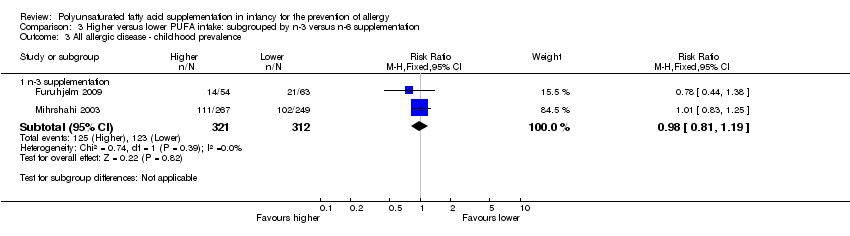
Comparison 3 Higher versus lower PUFA intake: subgrouped by n‐3 versus n‐6 supplementation, Outcome 3 All allergic disease ‐ childhood prevalence.
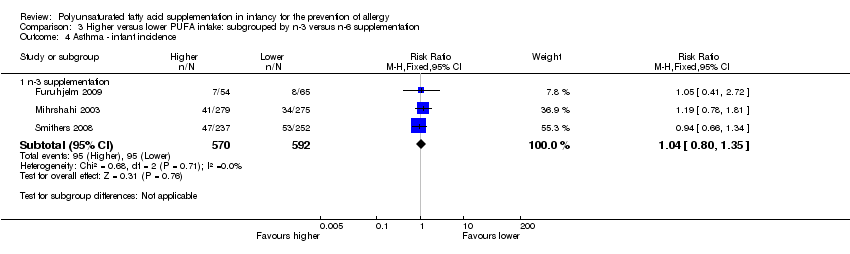
Comparison 3 Higher versus lower PUFA intake: subgrouped by n‐3 versus n‐6 supplementation, Outcome 4 Asthma ‐ infant incidence.

Comparison 3 Higher versus lower PUFA intake: subgrouped by n‐3 versus n‐6 supplementation, Outcome 5 Asthma ‐ childhood incidence.

Comparison 3 Higher versus lower PUFA intake: subgrouped by n‐3 versus n‐6 supplementation, Outcome 6 Asthma ‐ childhood prevalence.

Comparison 3 Higher versus lower PUFA intake: subgrouped by n‐3 versus n‐6 supplementation, Outcome 7 Dermatitis/eczema ‐ infant incidence.
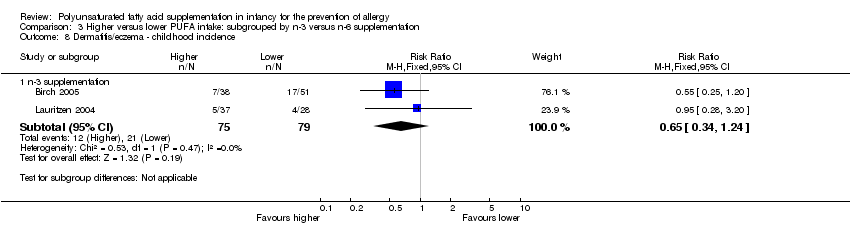
Comparison 3 Higher versus lower PUFA intake: subgrouped by n‐3 versus n‐6 supplementation, Outcome 8 Dermatitis/eczema ‐ childhood incidence.
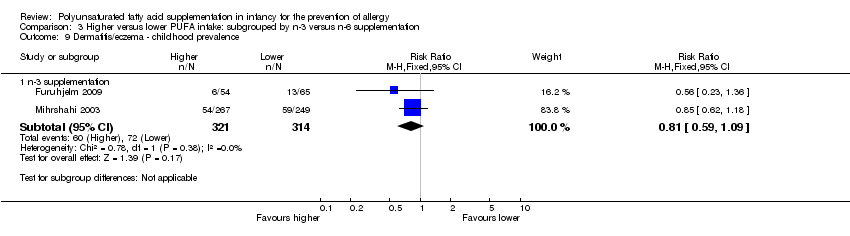
Comparison 3 Higher versus lower PUFA intake: subgrouped by n‐3 versus n‐6 supplementation, Outcome 9 Dermatitis/eczema ‐ childhood prevalence.

Comparison 3 Higher versus lower PUFA intake: subgrouped by n‐3 versus n‐6 supplementation, Outcome 10 Allergic rhinitis ‐ infant incidence.
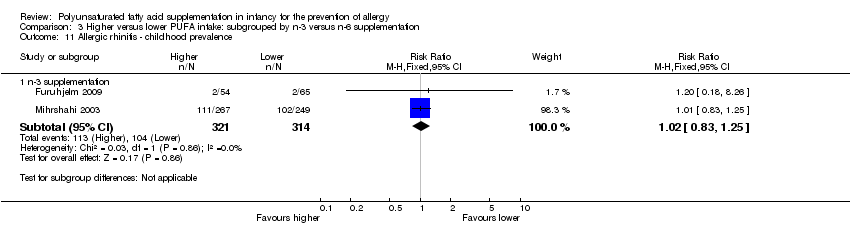
Comparison 3 Higher versus lower PUFA intake: subgrouped by n‐3 versus n‐6 supplementation, Outcome 11 Allergic rhinitis ‐ childhood prevalence.
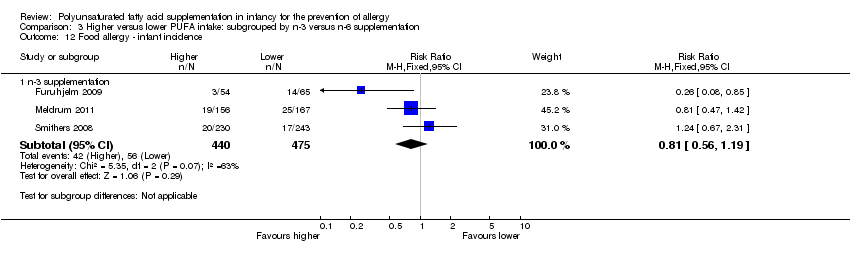
Comparison 3 Higher versus lower PUFA intake: subgrouped by n‐3 versus n‐6 supplementation, Outcome 12 Food allergy ‐ infant incidence.

Comparison 3 Higher versus lower PUFA intake: subgrouped by n‐3 versus n‐6 supplementation, Outcome 13 Food allergy ‐ childhood incidence.

Comparison 3 Higher versus lower PUFA intake: subgrouped by n‐3 versus n‐6 supplementation, Outcome 14 Food allergy ‐ childhood prevalence.

Comparison 4 Higher versus lower PUFA intake: subgrouped by method of infant feeding, Outcome 1 All allergic disease ‐ infant incidence.

Comparison 4 Higher versus lower PUFA intake: subgrouped by method of infant feeding, Outcome 2 All allergic disease ‐ childhood incidence.

Comparison 4 Higher versus lower PUFA intake: subgrouped by method of infant feeding, Outcome 3 All allergic disease ‐ childhood prevalence.
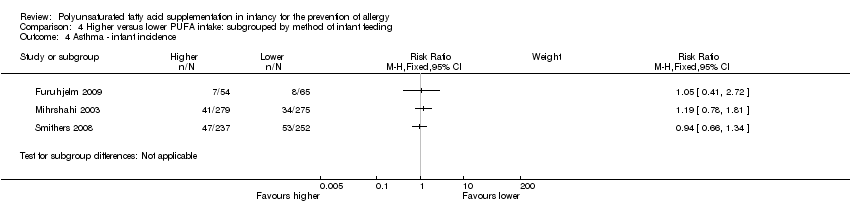
Comparison 4 Higher versus lower PUFA intake: subgrouped by method of infant feeding, Outcome 4 Asthma ‐ infant incidence.

Comparison 4 Higher versus lower PUFA intake: subgrouped by method of infant feeding, Outcome 5 Asthma ‐ childhood incidence.
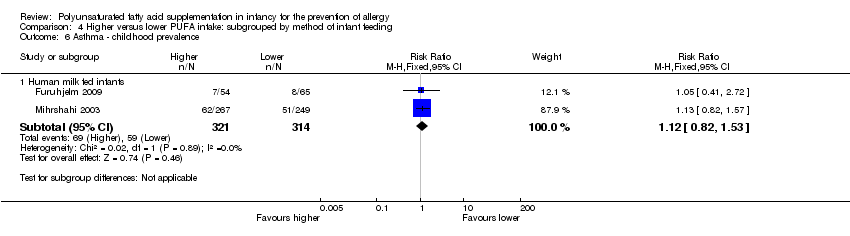
Comparison 4 Higher versus lower PUFA intake: subgrouped by method of infant feeding, Outcome 6 Asthma ‐ childhood prevalence.

Comparison 4 Higher versus lower PUFA intake: subgrouped by method of infant feeding, Outcome 7 Dermatitis/eczema ‐ infant incidence.

Comparison 4 Higher versus lower PUFA intake: subgrouped by method of infant feeding, Outcome 8 Dermatitis/eczema ‐ childhood incidence.

Comparison 4 Higher versus lower PUFA intake: subgrouped by method of infant feeding, Outcome 9 Dermatitis/eczema ‐ childhood prevalence.

Comparison 4 Higher versus lower PUFA intake: subgrouped by method of infant feeding, Outcome 10 Allergic rhinitis ‐ infant incidence.

Comparison 4 Higher versus lower PUFA intake: subgrouped by method of infant feeding, Outcome 11 Allergic rhinitis ‐ childhood prevalence.
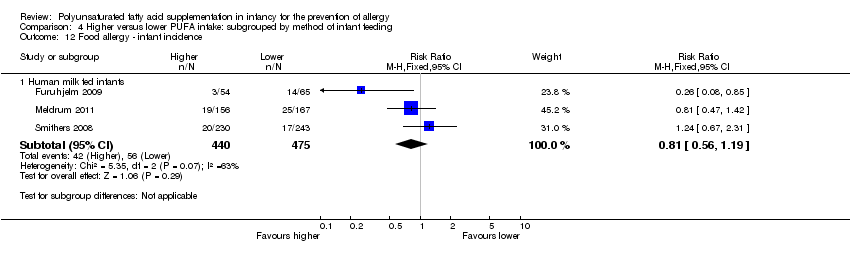
Comparison 4 Higher versus lower PUFA intake: subgrouped by method of infant feeding, Outcome 12 Food allergy ‐ infant incidence.

Comparison 4 Higher versus lower PUFA intake: subgrouped by method of infant feeding, Outcome 13 Food allergy ‐ childhood incidence.

Comparison 4 Higher versus lower PUFA intake: subgrouped by method of infant feeding, Outcome 14 Food allergy ‐ childhood prevalence.

Comparison 5 Higher versus lower PUFA intake: subgrouped by infant heredity for allergy, Outcome 1 All allergic disease ‐ infant incidence.

Comparison 5 Higher versus lower PUFA intake: subgrouped by infant heredity for allergy, Outcome 2 All allergic disease ‐ childhood incidence.

Comparison 5 Higher versus lower PUFA intake: subgrouped by infant heredity for allergy, Outcome 3 All allergic disease ‐ childhood prevalence.

Comparison 5 Higher versus lower PUFA intake: subgrouped by infant heredity for allergy, Outcome 4 Asthma ‐ infant incidence.

Comparison 5 Higher versus lower PUFA intake: subgrouped by infant heredity for allergy, Outcome 5 Asthma ‐ childhood incidence.

Comparison 5 Higher versus lower PUFA intake: subgrouped by infant heredity for allergy, Outcome 6 Asthma ‐ childhood prevalence.

Comparison 5 Higher versus lower PUFA intake: subgrouped by infant heredity for allergy, Outcome 7 Dermatitis/eczema ‐ infant incidence.

Comparison 5 Higher versus lower PUFA intake: subgrouped by infant heredity for allergy, Outcome 8 Dermatitis/eczema ‐ childhood incidence.

Comparison 5 Higher versus lower PUFA intake: subgrouped by infant heredity for allergy, Outcome 9 Dermatitis/eczema ‐ childhood prevalence.

Comparison 5 Higher versus lower PUFA intake: subgrouped by infant heredity for allergy, Outcome 10 Allergic rhinitis ‐ infant incidence.

Comparison 5 Higher versus lower PUFA intake: subgrouped by infant heredity for allergy, Outcome 11 Allergic rhinitis ‐ childhood prevalence.

Comparison 5 Higher versus lower PUFA intake: subgrouped by infant heredity for allergy, Outcome 12 Food allergy ‐ infant incidence.

Comparison 5 Higher versus lower PUFA intake: subgrouped by infant heredity for allergy, Outcome 13 Food allergy ‐ childhood incidence.
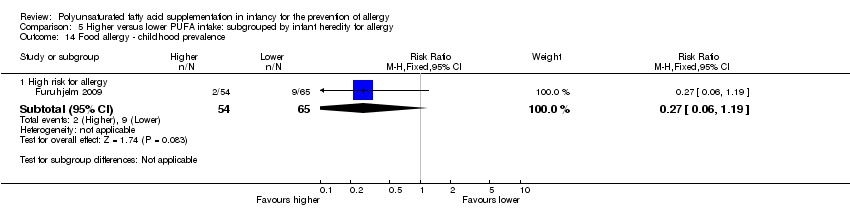
Comparison 5 Higher versus lower PUFA intake: subgrouped by infant heredity for allergy, Outcome 14 Food allergy ‐ childhood prevalence.

Comparison 6 Higher versus lower PUFA intake: subgrouped by gestational age at birth, Outcome 1 All allergic disease ‐ infant incidence.
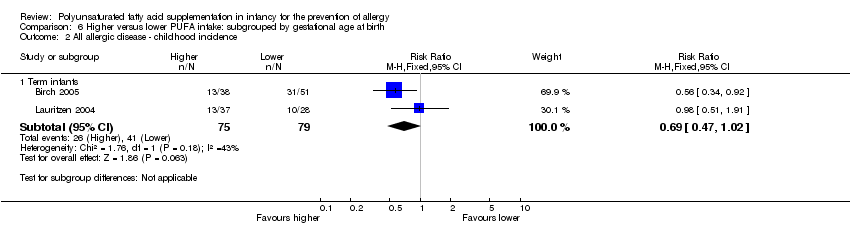
Comparison 6 Higher versus lower PUFA intake: subgrouped by gestational age at birth, Outcome 2 All allergic disease ‐ childhood incidence.

Comparison 6 Higher versus lower PUFA intake: subgrouped by gestational age at birth, Outcome 3 All allergic disease ‐ childhood prevalence.

Comparison 6 Higher versus lower PUFA intake: subgrouped by gestational age at birth, Outcome 4 Asthma ‐ infant incidence.

Comparison 6 Higher versus lower PUFA intake: subgrouped by gestational age at birth, Outcome 5 Asthma ‐ childhood incidence.

Comparison 6 Higher versus lower PUFA intake: subgrouped by gestational age at birth, Outcome 6 Asthma ‐ childhood prevalence.
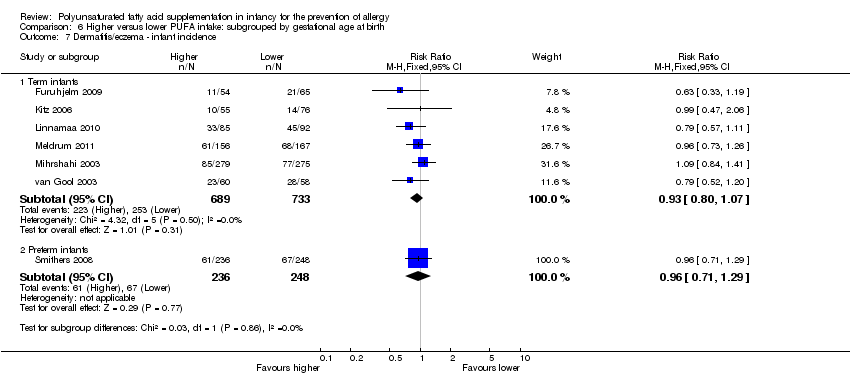
Comparison 6 Higher versus lower PUFA intake: subgrouped by gestational age at birth, Outcome 7 Dermatitis/eczema ‐ infant incidence.

Comparison 6 Higher versus lower PUFA intake: subgrouped by gestational age at birth, Outcome 8 Dermatitis/eczema ‐ childhood incidence.

Comparison 6 Higher versus lower PUFA intake: subgrouped by gestational age at birth, Outcome 9 Dermatitis/eczema ‐ childhood prevalence.

Comparison 6 Higher versus lower PUFA intake: subgrouped by gestational age at birth, Outcome 10 Allergic rhinitis ‐ infant incidence.

Comparison 6 Higher versus lower PUFA intake: subgrouped by gestational age at birth, Outcome 11 Allergic rhinitis ‐ childhood prevalence.

Comparison 6 Higher versus lower PUFA intake: subgrouped by gestational age at birth, Outcome 12 Food allergy ‐ infant incidence.

Comparison 6 Higher versus lower PUFA intake: subgrouped by gestational age at birth, Outcome 13 Food allergy ‐ childhood incidence.

Comparison 6 Higher versus lower PUFA intake: subgrouped by gestational age at birth, Outcome 14 Food allergy ‐ childhood prevalence.

Comparison 7 Higher versus lower PUFA intake: sensitivity analysis, Outcome 1 Asthma.
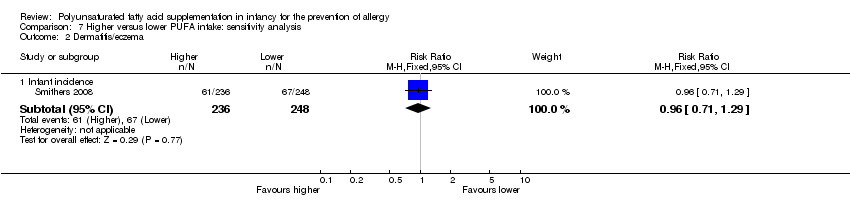
Comparison 7 Higher versus lower PUFA intake: sensitivity analysis, Outcome 2 Dermatitis/eczema.

Comparison 7 Higher versus lower PUFA intake: sensitivity analysis, Outcome 3 Allergic rhinitis.

Comparison 7 Higher versus lower PUFA intake: sensitivity analysis, Outcome 4 Food allergy.
| Higher versus lower PUFA intake for the prevention of allergy ‐ infant incidence | ||||||
| Patient or population: infants | ||||||
| Outcomes | Illustrative comparative risks* (95% CI) | Relative effect | No of participants | Quality of the evidence | Comments | |
| Assumed risk | Corresponding risk | |||||
| Lower PUFA intake | Higher PUFA intake | |||||
| All allergic disease ‐ infant incidence | Study population | RR 0.96 | 323 | ⊕⊝⊝⊝ | ‐ | |
| 395 per 1000 | 379 per 1000 | |||||
| Moderate | ||||||
| 395 per 1000 | 379 per 1000 | |||||
| Asthma ‐ infant incidence | Study population | RR 1.04 | 1162 | ⊕⊕⊝⊝ | ‐ | |
| 160 per 1000 | 167 per 1000 | |||||
| Moderate | ||||||
| 124 per 1000 | 129 per 1000 | |||||
| Dermatitis/eczema ‐ infant incidence | Study population | RR 0.93 | 1906 | ⊕⊝⊝⊝ | ‐ | |
| 326 per 1000 | 303 per 1000 | |||||
| Moderate | ||||||
| 323 per 1000 | 300 per 1000 | |||||
| Allergic rhinitis ‐ infant incidence | Study population | RR 0.47 | 594 | ⊕⊝⊝⊝ | ‐ | |
| 74 per 1000 | 35 per 1000 | |||||
| Moderate | ||||||
| 58 per 1000 | 27 per 1000 | |||||
| Food allergy ‐ infant incidence | Study population | RR 0.81 | 915 | ⊕⊝⊝⊝ | ‐ | |
| 118 per 1000 | 95 per 1000 | |||||
| Moderate | ||||||
| 150 per 1000 | 121 per 1000 | |||||
| *The basis for the assumed risk (e.g. the median control group risk across studies) is provided in footnotes. The corresponding risk (and its 95% confidence interval) is based on the assumed risk in the comparison group and the relative effect of the intervention (and its 95% CI). | ||||||
| GRADE Working Group grades of evidence | ||||||
| 1 Losses to follow‐up | ||||||
| Higher versus lower PUFA intake for the prevention of allergy ‐ childhood incidence | ||||||
| Patient or population: infants | ||||||
| Outcomes | Illustrative comparative risks* (95% CI) | Relative effect | No of participants | Quality of the evidence | Comments | |
| Assumed risk | Corresponding risk | |||||
| Lower PUFA intake | Higher PUFA intake | |||||
| All allergic disease ‐ childhood incidence | Study population | RR 0.69 | 154 | ⊕⊝⊝⊝ | ‐ | |
| 519 per 1000 | 358 per 1000 | |||||
| Moderate | ||||||
| 483 per 1000 | 333 per 1000 | |||||
| Asthma ‐ childhood incidence | Study population | RR 0.45 | 89 | ⊕⊝⊝⊝ | ‐ | |
| 353 per 1000 | 159 per 1000 | |||||
| Moderate | ||||||
| 353 per 1000 | 159 per 1000 | |||||
| Dermatitis/eczema ‐ childhood incidence | Study population | RR 0.65 | 154 | ⊕⊝⊝⊝ | ‐ | |
| 266 per 1000 | 173 per 1000 | |||||
| Moderate | ||||||
| 238 per 1000 | 155 per 1000 | |||||
| Food allergy ‐ childhood incidence | Study population | RR 2.27 | 65 | ⊕⊝⊝⊝ | ‐ | |
| 36 per 1000 | 81 per 1000 | |||||
| Moderate | ||||||
| 36 per 1000 | 82 per 1000 | |||||
| *The basis for the assumed risk (e.g. the median control group risk across studies) is provided in footnotes. The corresponding risk (and its 95% confidence interval) is based on the assumed risk in the comparison group and the relative effect of the intervention (and its 95% CI). | ||||||
| GRADE Working Group grades of evidence | ||||||
| 1 Very high losses to follow‐up. | ||||||
| Higher versus lower PUFA intake for the prevention of allergy ‐ childhood prevalence | ||||||
| Patient or population: infants | ||||||
| Outcomes | Illustrative comparative risks* (95% CI) | Relative effect | No of participants | Quality of the evidence | Comments | |
| Assumed risk | Corresponding risk | |||||
| Lower PUFA intake | Higher PUFA intake | |||||
| All allergic disease ‐ childhood prevalence | Study population | RR 0.98 | 633 | ⊕⊝⊝⊝ | ‐ | |
| 394 per 1000 | 386 per 1000 | |||||
| Moderate | ||||||
| 372 per 1000 | 365 per 1000 | |||||
| Asthma ‐ childhood prevalence | Study population | RR 1.12 | 635 | ⊕⊝⊝⊝ | ‐ | |
| 188 per 1000 | 210 per 1000 | |||||
| Moderate | ||||||
| 164 per 1000 | 184 per 1000 | |||||
| Dermatitis/eczema ‐ childhood prevalence | Study population | RR 0.81 | 635 | ⊕⊝⊝⊝ | ‐ | |
| 229 per 1000 | 186 per 1000 | |||||
| Moderate | ||||||
| 219 per 1000 | 177 per 1000 | |||||
| Allergic rhinitis ‐ childhood prevalence | Study population | RR 1.02 | 635 | ⊕⊝⊝⊝ | ‐ | |
| 331 per 1000 | 338 per 1000 | |||||
| Moderate | ||||||
| 220 per 1000 | 224 per 1000 | |||||
| Food allergy ‐ childhood prevalence | Study population | RR 0.27 | 119 | ⊕⊝⊝⊝ | ‐ | |
| 138 per 1000 | 37 per 1000 | |||||
| Moderate | ||||||
| 139 per 1000 | 38 per 1000 | |||||
| *The basis for the assumed risk (e.g. the median control group risk across studies) is provided in footnotes. The corresponding risk (and its 95% confidence interval) is based on the assumed risk in the comparison group and the relative effect of the intervention (and its 95% CI). | ||||||
| GRADE Working Group grades of evidence | ||||||
| 1 Losses to follow‐up > 10%. | ||||||
| Outcome or subgroup title | No. of studies | No. of participants | Statistical method | Effect size |
| 1 All allergic disease Show forest plot | 5 | Risk Ratio (M‐H, Fixed, 95% CI) | Subtotals only | |
| 1.1 Infant incidence | 1 | 323 | Risk Ratio (M‐H, Fixed, 95% CI) | 0.96 [0.73, 1.26] |
| 1.2 Childhood incidence | 2 | 154 | Risk Ratio (M‐H, Fixed, 95% CI) | 0.69 [0.47, 1.02] |
| 1.3 Childhood prevalence | 2 | 633 | Risk Ratio (M‐H, Fixed, 95% CI) | 0.98 [0.81, 1.19] |
| 2 Asthma Show forest plot | 4 | Risk Ratio (M‐H, Fixed, 95% CI) | Subtotals only | |
| 2.1 Infant incidence | 3 | 1162 | Risk Ratio (M‐H, Fixed, 95% CI) | 1.04 [0.80, 1.35] |
| 2.2 Childhood incidence | 1 | 89 | Risk Ratio (M‐H, Fixed, 95% CI) | 0.45 [0.20, 1.02] |
| 2.3 Childhood prevalence | 2 | 635 | Risk Ratio (M‐H, Fixed, 95% CI) | 1.12 [0.82, 1.53] |
| 3 Dermatitis/eczema Show forest plot | 9 | Risk Ratio (M‐H, Fixed, 95% CI) | Subtotals only | |
| 3.1 Infant incidence | 7 | 1906 | Risk Ratio (M‐H, Fixed, 95% CI) | 0.93 [0.82, 1.06] |
| 3.2 Childhood incidence | 2 | 154 | Risk Ratio (M‐H, Fixed, 95% CI) | 0.65 [0.34, 1.24] |
| 3.3 Childhood prevalence | 2 | 635 | Risk Ratio (M‐H, Fixed, 95% CI) | 0.81 [0.59, 1.09] |
| 4 Allergic rhinitis Show forest plot | 3 | Risk Ratio (M‐H, Fixed, 95% CI) | Subtotals only | |
| 4.1 Infant incidence | 2 | 594 | Risk Ratio (M‐H, Fixed, 95% CI) | 0.47 [0.23, 0.96] |
| 4.2 Childhood prevalence | 2 | 635 | Risk Ratio (M‐H, Fixed, 95% CI) | 1.02 [0.83, 1.25] |
| 5 Food allergy Show forest plot | 4 | Risk Ratio (M‐H, Fixed, 95% CI) | Subtotals only | |
| 5.1 Infant incidence | 3 | 915 | Risk Ratio (M‐H, Fixed, 95% CI) | 0.81 [0.56, 1.19] |
| 5.2 Childhood incidence | 1 | 65 | Risk Ratio (M‐H, Fixed, 95% CI) | 2.27 [0.25, 20.68] |
| 5.3 Childhood prevalence | 1 | 119 | Risk Ratio (M‐H, Fixed, 95% CI) | 0.27 [0.06, 1.19] |
| Outcome or subgroup title | No. of studies | No. of participants | Statistical method | Effect size |
| 1 All allergic disease ‐ infant incidence Show forest plot | 1 | Risk Ratio (M‐H, Fixed, 95% CI) | Subtotals only | |
| 1.1 Infant supplementation | 1 | 323 | Risk Ratio (M‐H, Fixed, 95% CI) | 0.96 [0.73, 1.26] |
| 2 All allergic disease ‐ childhood incidence Show forest plot | 2 | Risk Ratio (M‐H, Fixed, 95% CI) | Subtotals only | |
| 2.1 Infant supplementation | 1 | 89 | Risk Ratio (M‐H, Fixed, 95% CI) | 0.56 [0.34, 0.92] |
| 2.2 Maternal supplementation | 1 | 65 | Risk Ratio (M‐H, Fixed, 95% CI) | 0.98 [0.51, 1.91] |
| 3 All allergic disease ‐ childhood prevalence Show forest plot | 2 | Risk Ratio (M‐H, Fixed, 95% CI) | Subtotals only | |
| 3.1 Infant supplementation | 1 | 516 | Risk Ratio (M‐H, Fixed, 95% CI) | 1.01 [0.83, 1.25] |
| 3.2 Maternal supplementation | 1 | 117 | Risk Ratio (M‐H, Fixed, 95% CI) | 0.78 [0.44, 1.38] |
| 4 Asthma ‐ infant incidence Show forest plot | 3 | Risk Ratio (M‐H, Fixed, 95% CI) | Subtotals only | |
| 4.1 Infant supplementation | 1 | 554 | Risk Ratio (M‐H, Fixed, 95% CI) | 1.19 [0.78, 1.81] |
| 4.2 Maternal supplementation | 2 | 608 | Risk Ratio (M‐H, Fixed, 95% CI) | 0.96 [0.69, 1.33] |
| 5 Asthma ‐ childhood incidence Show forest plot | 1 | Risk Ratio (M‐H, Fixed, 95% CI) | Subtotals only | |
| 5.1 Infant supplementation | 1 | 89 | Risk Ratio (M‐H, Fixed, 95% CI) | 0.45 [0.20, 1.02] |
| 6 Asthma ‐ childhood prevalence Show forest plot | 2 | Risk Ratio (M‐H, Fixed, 95% CI) | Subtotals only | |
| 6.1 Infant supplementation | 1 | 516 | Risk Ratio (M‐H, Fixed, 95% CI) | 1.13 [0.82, 1.57] |
| 6.2 Maternal supplementation | 1 | 119 | Risk Ratio (M‐H, Fixed, 95% CI) | 1.05 [0.41, 2.72] |
| 7 Dermatitis/eczema ‐ infant incidence Show forest plot | 7 | Risk Ratio (M‐H, Fixed, 95% CI) | Subtotals only | |
| 7.1 Infant supplementation | 5 | 1245 | Risk Ratio (M‐H, Fixed, 95% CI) | 0.95 [0.82, 1.11] |
| 7.2 Maternal supplementation | 3 | 661 | Risk Ratio (M‐H, Fixed, 95% CI) | 0.88 [0.68, 1.15] |
| 8 Dermatitis/eczema ‐ childhood incidence Show forest plot | 2 | Risk Ratio (M‐H, Fixed, 95% CI) | Subtotals only | |
| 8.1 Infant supplementation | 1 | 89 | Risk Ratio (M‐H, Fixed, 95% CI) | 0.55 [0.25, 1.20] |
| 8.2 Maternal supplementation | 1 | 65 | Risk Ratio (M‐H, Fixed, 95% CI) | 0.95 [0.28, 3.20] |
| 9 Dermatitis/eczema ‐ childhood prevalence Show forest plot | 2 | Risk Ratio (M‐H, Fixed, 95% CI) | Subtotals only | |
| 9.1 Infant supplementation | 1 | 516 | Risk Ratio (M‐H, Fixed, 95% CI) | 0.85 [0.62, 1.18] |
| 9.2 Maternal supplementation | 1 | 119 | Risk Ratio (M‐H, Fixed, 95% CI) | 0.56 [0.23, 1.36] |
| 10 Allergic rhinitis ‐ infant incidence Show forest plot | 2 | Risk Ratio (M‐H, Fixed, 95% CI) | Subtotals only | |
| 10.1 Maternal supplementation | 2 | 594 | Risk Ratio (M‐H, Fixed, 95% CI) | 0.47 [0.23, 0.96] |
| 11 Allergic rhinitis ‐ childhood prevalence Show forest plot | 2 | Risk Ratio (M‐H, Fixed, 95% CI) | Subtotals only | |
| 11.1 Infant supplementation | 1 | 516 | Risk Ratio (M‐H, Fixed, 95% CI) | 1.01 [0.83, 1.25] |
| 11.2 Maternal supplementation | 1 | 119 | Risk Ratio (M‐H, Fixed, 95% CI) | 1.20 [0.18, 8.26] |
| 12 Food allergy ‐ infant incidence Show forest plot | 3 | Risk Ratio (M‐H, Fixed, 95% CI) | Subtotals only | |
| 12.1 Infant supplementation | 1 | 323 | Risk Ratio (M‐H, Fixed, 95% CI) | 0.81 [0.47, 1.42] |
| 12.2 Maternal supplementation | 2 | 592 | Risk Ratio (M‐H, Fixed, 95% CI) | 0.81 [0.48, 1.37] |
| 13 Food allergy ‐ childhood incidence Show forest plot | 1 | Risk Ratio (M‐H, Fixed, 95% CI) | Subtotals only | |
| 13.1 Maternal supplementation | 1 | 65 | Risk Ratio (M‐H, Fixed, 95% CI) | 2.27 [0.25, 20.68] |
| 14 Food allergy ‐ childhood prevalence Show forest plot | 1 | Risk Ratio (M‐H, Fixed, 95% CI) | Subtotals only | |
| 14.1 Maternal supplementation | 1 | 119 | Risk Ratio (M‐H, Fixed, 95% CI) | 0.27 [0.06, 1.19] |
| Outcome or subgroup title | No. of studies | No. of participants | Statistical method | Effect size |
| 1 All allergic disease ‐ infant incidence Show forest plot | 1 | Risk Ratio (M‐H, Fixed, 95% CI) | Subtotals only | |
| 1.1 n‐3 supplementation | 1 | 323 | Risk Ratio (M‐H, Fixed, 95% CI) | 0.96 [0.73, 1.26] |
| 2 All allergic disease ‐ childhood incidence Show forest plot | 2 | Risk Ratio (M‐H, Fixed, 95% CI) | Subtotals only | |
| 2.1 n‐3 supplementation | 2 | 154 | Risk Ratio (M‐H, Fixed, 95% CI) | 0.69 [0.47, 1.02] |
| 3 All allergic disease ‐ childhood prevalence Show forest plot | 2 | Risk Ratio (M‐H, Fixed, 95% CI) | Subtotals only | |
| 3.1 n‐3 supplementation | 2 | 633 | Risk Ratio (M‐H, Fixed, 95% CI) | 0.98 [0.81, 1.19] |
| 4 Asthma ‐ infant incidence Show forest plot | 3 | Risk Ratio (M‐H, Fixed, 95% CI) | Subtotals only | |
| 4.1 n‐3 supplementation | 3 | 1162 | Risk Ratio (M‐H, Fixed, 95% CI) | 1.04 [0.80, 1.35] |
| 5 Asthma ‐ childhood incidence Show forest plot | 1 | Risk Ratio (M‐H, Fixed, 95% CI) | Subtotals only | |
| 5.1 n‐3 supplementation | 1 | 89 | Risk Ratio (M‐H, Fixed, 95% CI) | 0.45 [0.20, 1.02] |
| 6 Asthma ‐ childhood prevalence Show forest plot | 2 | Risk Ratio (M‐H, Fixed, 95% CI) | Subtotals only | |
| 6.1 n‐3 supplementation | 2 | 635 | Risk Ratio (M‐H, Fixed, 95% CI) | 1.12 [0.82, 1.53] |
| 7 Dermatitis/eczema ‐ infant incidence Show forest plot | 7 | Risk Ratio (M‐H, Fixed, 95% CI) | Subtotals only | |
| 7.1 n‐3 supplementation | 5 | 1657 | Risk Ratio (M‐H, Fixed, 95% CI) | 0.95 [0.82, 1.09] |
| 7.2 n‐6 supplementation | 2 | 249 | Risk Ratio (M‐H, Fixed, 95% CI) | 0.85 [0.59, 1.23] |
| 8 Dermatitis/eczema ‐ childhood incidence Show forest plot | 2 | Risk Ratio (M‐H, Fixed, 95% CI) | Subtotals only | |
| 8.1 n‐3 supplementation | 2 | 154 | Risk Ratio (M‐H, Fixed, 95% CI) | 0.65 [0.34, 1.24] |
| 9 Dermatitis/eczema ‐ childhood prevalence Show forest plot | 2 | Risk Ratio (M‐H, Fixed, 95% CI) | Subtotals only | |
| 9.1 n‐3 supplementation | 2 | 635 | Risk Ratio (M‐H, Fixed, 95% CI) | 0.81 [0.59, 1.09] |
| 10 Allergic rhinitis ‐ infant incidence Show forest plot | 2 | Risk Ratio (M‐H, Fixed, 95% CI) | Subtotals only | |
| 10.1 n‐3 supplementation | 2 | 594 | Risk Ratio (M‐H, Fixed, 95% CI) | 0.47 [0.23, 0.96] |
| 11 Allergic rhinitis ‐ childhood prevalence Show forest plot | 2 | Risk Ratio (M‐H, Fixed, 95% CI) | Subtotals only | |
| 11.1 n‐3 supplementation | 2 | 635 | Risk Ratio (M‐H, Fixed, 95% CI) | 1.02 [0.83, 1.25] |
| 12 Food allergy ‐ infant incidence Show forest plot | 3 | Risk Ratio (M‐H, Fixed, 95% CI) | Subtotals only | |
| 12.1 n‐3 supplementation | 3 | 915 | Risk Ratio (M‐H, Fixed, 95% CI) | 0.81 [0.56, 1.19] |
| 13 Food allergy ‐ childhood incidence Show forest plot | 1 | Risk Ratio (M‐H, Fixed, 95% CI) | Subtotals only | |
| 13.1 n‐3 supplementation | 1 | 65 | Risk Ratio (M‐H, Fixed, 95% CI) | 2.27 [0.25, 20.68] |
| 14 Food allergy ‐ childhood prevalence Show forest plot | 1 | Risk Ratio (M‐H, Fixed, 95% CI) | Subtotals only | |
| 14.1 n‐3 supplementation | 1 | 119 | Risk Ratio (M‐H, Fixed, 95% CI) | 0.27 [0.06, 1.19] |
| Outcome or subgroup title | No. of studies | No. of participants | Statistical method | Effect size |
| 1 All allergic disease ‐ infant incidence Show forest plot | 1 | Risk Ratio (M‐H, Fixed, 95% CI) | Subtotals only | |
| 1.1 Human milk fed infants | 1 | 323 | Risk Ratio (M‐H, Fixed, 95% CI) | 0.96 [0.73, 1.26] |
| 2 All allergic disease ‐ childhood incidence Show forest plot | 2 | Risk Ratio (M‐H, Fixed, 95% CI) | Subtotals only | |
| 2.1 Human milk fed infants | 1 | 65 | Risk Ratio (M‐H, Fixed, 95% CI) | 0.98 [0.51, 1.91] |
| 2.2 Formula fed infants | 1 | 89 | Risk Ratio (M‐H, Fixed, 95% CI) | 0.56 [0.34, 0.92] |
| 3 All allergic disease ‐ childhood prevalence Show forest plot | 2 | Risk Ratio (M‐H, Fixed, 95% CI) | Subtotals only | |
| 3.1 Human milk fed infants | 2 | 633 | Risk Ratio (M‐H, Fixed, 95% CI) | 0.98 [0.81, 1.19] |
| 4 Asthma ‐ infant incidence Show forest plot | 3 | Risk Ratio (M‐H, Fixed, 95% CI) | Subtotals only | |
| 5 Asthma ‐ childhood incidence Show forest plot | 1 | Risk Ratio (M‐H, Fixed, 95% CI) | Subtotals only | |
| 5.1 Formula fed infants | 1 | 89 | Risk Ratio (M‐H, Fixed, 95% CI) | 0.45 [0.20, 1.02] |
| 6 Asthma ‐ childhood prevalence Show forest plot | 2 | Risk Ratio (M‐H, Fixed, 95% CI) | Subtotals only | |
| 6.1 Human milk fed infants | 2 | 635 | Risk Ratio (M‐H, Fixed, 95% CI) | 1.12 [0.82, 1.53] |
| 7 Dermatitis/eczema ‐ infant incidence Show forest plot | 7 | Risk Ratio (M‐H, Fixed, 95% CI) | Subtotals only | |
| 7.1 Human milk fed infants | 6 | 1715 | Risk Ratio (M‐H, Fixed, 95% CI) | 0.95 [0.82, 1.09] |
| 7.2 Formula fed infants | 2 | 191 | Risk Ratio (M‐H, Fixed, 95% CI) | 0.84 [0.57, 1.23] |
| 8 Dermatitis/eczema ‐ childhood incidence Show forest plot | 2 | Risk Ratio (M‐H, Fixed, 95% CI) | Subtotals only | |
| 8.1 Human milk fed infants | 1 | 65 | Risk Ratio (M‐H, Fixed, 95% CI) | 0.95 [0.28, 3.20] |
| 8.2 Formula fed infants | 1 | 89 | Risk Ratio (M‐H, Fixed, 95% CI) | 0.55 [0.25, 1.20] |
| 9 Dermatitis/eczema ‐ childhood prevalence Show forest plot | 2 | Risk Ratio (M‐H, Fixed, 95% CI) | Subtotals only | |
| 9.1 Human milk fed infants | 2 | 635 | Risk Ratio (M‐H, Fixed, 95% CI) | 0.81 [0.59, 1.09] |
| 10 Allergic rhinitis ‐ infant incidence Show forest plot | 2 | Risk Ratio (M‐H, Fixed, 95% CI) | Subtotals only | |
| 10.1 Human milk fed infants | 2 | 594 | Risk Ratio (M‐H, Fixed, 95% CI) | 0.47 [0.23, 0.96] |
| 11 Allergic rhinitis ‐ childhood prevalence Show forest plot | 2 | Risk Ratio (M‐H, Fixed, 95% CI) | Subtotals only | |
| 11.1 Human milk fed infants | 2 | 635 | Risk Ratio (M‐H, Fixed, 95% CI) | 1.02 [0.83, 1.25] |
| 12 Food allergy ‐ infant incidence Show forest plot | 3 | Risk Ratio (M‐H, Fixed, 95% CI) | Subtotals only | |
| 12.1 Human milk fed infants | 3 | 915 | Risk Ratio (M‐H, Fixed, 95% CI) | 0.81 [0.56, 1.19] |
| 13 Food allergy ‐ childhood incidence Show forest plot | 1 | Risk Ratio (M‐H, Fixed, 95% CI) | Subtotals only | |
| 13.1 Human milk fed infants | 1 | 65 | Risk Ratio (M‐H, Fixed, 95% CI) | 2.27 [0.25, 20.68] |
| 14 Food allergy ‐ childhood prevalence Show forest plot | 1 | Risk Ratio (M‐H, Fixed, 95% CI) | Subtotals only | |
| 14.1 Human milk fed infants | 1 | 119 | Risk Ratio (M‐H, Fixed, 95% CI) | 0.27 [0.06, 1.19] |
| Outcome or subgroup title | No. of studies | No. of participants | Statistical method | Effect size |
| 1 All allergic disease ‐ infant incidence Show forest plot | 1 | Risk Ratio (M‐H, Fixed, 95% CI) | Subtotals only | |
| 1.1 High risk for allergy | 1 | 323 | Risk Ratio (M‐H, Fixed, 95% CI) | 0.96 [0.73, 1.26] |
| 2 All allergic disease ‐ childhood incidence Show forest plot | 2 | Risk Ratio (M‐H, Fixed, 95% CI) | Subtotals only | |
| 2.1 Risk for allergy not selected | 2 | 154 | Risk Ratio (M‐H, Fixed, 95% CI) | 0.69 [0.47, 1.02] |
| 3 All allergic disease ‐ childhood prevalence Show forest plot | 2 | Risk Ratio (M‐H, Fixed, 95% CI) | Subtotals only | |
| 3.1 High risk for allergy | 2 | 633 | Risk Ratio (M‐H, Fixed, 95% CI) | 0.98 [0.81, 1.19] |
| 4 Asthma ‐ infant incidence Show forest plot | 3 | Risk Ratio (M‐H, Fixed, 95% CI) | Subtotals only | |
| 4.1 High risk for allergy | 2 | 673 | Risk Ratio (M‐H, Fixed, 95% CI) | 1.16 [0.79, 1.71] |
| 4.2 Risk for allergy not selected | 1 | 489 | Risk Ratio (M‐H, Fixed, 95% CI) | 0.94 [0.66, 1.34] |
| 5 Asthma ‐ childhood incidence Show forest plot | 1 | Risk Ratio (M‐H, Fixed, 95% CI) | Subtotals only | |
| 5.1 Risk for allergy not selected | 1 | 89 | Risk Ratio (M‐H, Fixed, 95% CI) | 0.45 [0.20, 1.02] |
| 6 Asthma ‐ childhood prevalence Show forest plot | 2 | Risk Ratio (M‐H, Fixed, 95% CI) | Subtotals only | |
| 6.1 High risk for allergy | 2 | 635 | Risk Ratio (M‐H, Fixed, 95% CI) | 1.12 [0.82, 1.53] |
| 7 Dermatitis/eczema ‐ infant incidence Show forest plot | 7 | Risk Ratio (M‐H, Fixed, 95% CI) | Subtotals only | |
| 7.1 High risk for allergy | 5 | 1245 | Risk Ratio (M‐H, Fixed, 95% CI) | 0.96 [0.81, 1.12] |
| 7.2 Risk for allergy not selected | 2 | 661 | Risk Ratio (M‐H, Fixed, 95% CI) | 0.89 [0.71, 1.12] |
| 8 Dermatitis/eczema ‐ childhood incidence Show forest plot | 2 | Risk Ratio (M‐H, Fixed, 95% CI) | Subtotals only | |
| 8.1 Risk for allergy not selected | 2 | 154 | Risk Ratio (M‐H, Fixed, 95% CI) | 0.65 [0.34, 1.24] |
| 9 Dermatitis/eczema ‐ childhood prevalence Show forest plot | 2 | Risk Ratio (M‐H, Fixed, 95% CI) | Subtotals only | |
| 9.1 High risk for allergy | 2 | 635 | Risk Ratio (M‐H, Fixed, 95% CI) | 0.81 [0.59, 1.09] |
| 10 Allergic rhinitis ‐ infant incidence Show forest plot | 2 | Risk Ratio (M‐H, Fixed, 95% CI) | Subtotals only | |
| 10.1 High risk for allergy | 1 | 119 | Risk Ratio (M‐H, Fixed, 95% CI) | 1.20 [0.18, 8.26] |
| 10.2 Risk for allergy not selected | 1 | 475 | Risk Ratio (M‐H, Fixed, 95% CI) | 0.40 [0.18, 0.89] |
| 11 Allergic rhinitis ‐ childhood prevalence Show forest plot | 2 | Risk Ratio (M‐H, Fixed, 95% CI) | Subtotals only | |
| 11.1 High risk for allergy | 2 | 635 | Risk Ratio (M‐H, Fixed, 95% CI) | 1.02 [0.83, 1.25] |
| 12 Food allergy ‐ infant incidence Show forest plot | 3 | Risk Ratio (M‐H, Fixed, 95% CI) | Subtotals only | |
| 12.1 High risk for allergy | 2 | 442 | Risk Ratio (M‐H, Fixed, 95% CI) | 0.62 [0.38, 1.02] |
| 12.2 Risk for allergy not selected | 1 | 473 | Risk Ratio (M‐H, Fixed, 95% CI) | 1.24 [0.67, 2.31] |
| 13 Food allergy ‐ childhood incidence Show forest plot | 1 | Risk Ratio (M‐H, Fixed, 95% CI) | Subtotals only | |
| 13.1 Risk for allergy not selected | 1 | 65 | Risk Ratio (M‐H, Fixed, 95% CI) | 2.27 [0.25, 20.68] |
| 14 Food allergy ‐ childhood prevalence Show forest plot | 1 | Risk Ratio (M‐H, Fixed, 95% CI) | Subtotals only | |
| 14.1 High risk for allergy | 1 | 119 | Risk Ratio (M‐H, Fixed, 95% CI) | 0.27 [0.06, 1.19] |
| Outcome or subgroup title | No. of studies | No. of participants | Statistical method | Effect size |
| 1 All allergic disease ‐ infant incidence Show forest plot | 1 | Risk Ratio (M‐H, Fixed, 95% CI) | Subtotals only | |
| 1.1 Term infants | 1 | 323 | Risk Ratio (M‐H, Fixed, 95% CI) | 0.96 [0.73, 1.26] |
| 2 All allergic disease ‐ childhood incidence Show forest plot | 2 | Risk Ratio (M‐H, Fixed, 95% CI) | Subtotals only | |
| 2.1 Term infants | 2 | 154 | Risk Ratio (M‐H, Fixed, 95% CI) | 0.69 [0.47, 1.02] |
| 3 All allergic disease ‐ childhood prevalence Show forest plot | 2 | Risk Ratio (M‐H, Fixed, 95% CI) | Subtotals only | |
| 3.1 Term infants | 2 | 633 | Risk Ratio (M‐H, Fixed, 95% CI) | 0.98 [0.81, 1.19] |
| 4 Asthma ‐ infant incidence Show forest plot | 3 | Risk Ratio (M‐H, Fixed, 95% CI) | Subtotals only | |
| 4.1 Term infants | 2 | 673 | Risk Ratio (M‐H, Fixed, 95% CI) | 1.16 [0.79, 1.71] |
| 4.2 Preterm infants | 1 | 489 | Risk Ratio (M‐H, Fixed, 95% CI) | 0.94 [0.66, 1.34] |
| 5 Asthma ‐ childhood incidence Show forest plot | 1 | Risk Ratio (M‐H, Fixed, 95% CI) | Subtotals only | |
| 5.1 Term infants | 1 | 89 | Risk Ratio (M‐H, Fixed, 95% CI) | 0.45 [0.20, 1.02] |
| 6 Asthma ‐ childhood prevalence Show forest plot | 2 | Risk Ratio (M‐H, Fixed, 95% CI) | Subtotals only | |
| 6.1 Term infants | 2 | 635 | Risk Ratio (M‐H, Fixed, 95% CI) | 1.12 [0.82, 1.53] |
| 7 Dermatitis/eczema ‐ infant incidence Show forest plot | 7 | Risk Ratio (M‐H, Fixed, 95% CI) | Subtotals only | |
| 7.1 Term infants | 6 | 1422 | Risk Ratio (M‐H, Fixed, 95% CI) | 0.93 [0.80, 1.07] |
| 7.2 Preterm infants | 1 | 484 | Risk Ratio (M‐H, Fixed, 95% CI) | 0.96 [0.71, 1.29] |
| 8 Dermatitis/eczema ‐ childhood incidence Show forest plot | 2 | Risk Ratio (M‐H, Fixed, 95% CI) | Subtotals only | |
| 8.1 Term infants | 2 | 154 | Risk Ratio (M‐H, Fixed, 95% CI) | 0.65 [0.34, 1.24] |
| 9 Dermatitis/eczema ‐ childhood prevalence Show forest plot | 2 | Risk Ratio (M‐H, Fixed, 95% CI) | Subtotals only | |
| 9.1 Term infants | 2 | 635 | Risk Ratio (M‐H, Fixed, 95% CI) | 0.81 [0.59, 1.09] |
| 10 Allergic rhinitis ‐ infant incidence Show forest plot | 2 | Risk Ratio (M‐H, Fixed, 95% CI) | Subtotals only | |
| 10.1 Term infants | 1 | 119 | Risk Ratio (M‐H, Fixed, 95% CI) | 1.20 [0.18, 8.26] |
| 10.2 Preterm infants | 1 | 475 | Risk Ratio (M‐H, Fixed, 95% CI) | 0.40 [0.18, 0.89] |
| 11 Allergic rhinitis ‐ childhood prevalence Show forest plot | 2 | Risk Ratio (M‐H, Fixed, 95% CI) | Subtotals only | |
| 11.1 Term infants | 2 | 635 | Risk Ratio (M‐H, Fixed, 95% CI) | 1.02 [0.83, 1.25] |
| 12 Food allergy ‐ infant incidence Show forest plot | 3 | Risk Ratio (M‐H, Fixed, 95% CI) | Subtotals only | |
| 12.1 Term infants | 2 | 442 | Risk Ratio (M‐H, Fixed, 95% CI) | 0.62 [0.38, 1.02] |
| 12.2 Preterm infants | 1 | 473 | Risk Ratio (M‐H, Fixed, 95% CI) | 1.24 [0.67, 2.31] |
| 13 Food allergy ‐ childhood incidence Show forest plot | 1 | Risk Ratio (M‐H, Fixed, 95% CI) | Subtotals only | |
| 13.1 Term infants | 1 | 65 | Risk Ratio (M‐H, Fixed, 95% CI) | 2.27 [0.25, 20.68] |
| 14 Food allergy ‐ childhood prevalence Show forest plot | 1 | Risk Ratio (M‐H, Fixed, 95% CI) | Subtotals only | |
| 14.1 Term infants | 1 | 119 | Risk Ratio (M‐H, Fixed, 95% CI) | 0.27 [0.06, 1.19] |
| Outcome or subgroup title | No. of studies | No. of participants | Statistical method | Effect size |
| 1 Asthma Show forest plot | 1 | Risk Ratio (M‐H, Fixed, 95% CI) | Subtotals only | |
| 1.1 Infant incidence | 1 | 489 | Risk Ratio (M‐H, Fixed, 95% CI) | 0.94 [0.66, 1.34] |
| 2 Dermatitis/eczema Show forest plot | 1 | Risk Ratio (M‐H, Fixed, 95% CI) | Subtotals only | |
| 2.1 Infant incidence | 1 | 484 | Risk Ratio (M‐H, Fixed, 95% CI) | 0.96 [0.71, 1.29] |
| 3 Allergic rhinitis Show forest plot | 1 | Risk Ratio (M‐H, Fixed, 95% CI) | Subtotals only | |
| 3.1 Infant incidence | 1 | 475 | Risk Ratio (M‐H, Fixed, 95% CI) | 0.40 [0.18, 0.89] |
| 4 Food allergy Show forest plot | 1 | Risk Ratio (M‐H, Fixed, 95% CI) | Subtotals only | |
| 4.1 Infant incidence | 1 | 473 | Risk Ratio (M‐H, Fixed, 95% CI) | 1.24 [0.67, 2.31] |