Administración de suplementos de ácidos grasos poliinsaturados a los lactantes para la prevención de la alergia
Información
- DOI:
- https://doi.org/10.1002/14651858.CD010112.pub2Copiar DOI

- Base de datos:
-
- Cochrane Database of Systematic Reviews
- Versión publicada:
-
- 28 octubre 2016see what's new
- Tipo:
-
- Intervention
- Etapa:
-
- Review
- Grupo Editorial Cochrane:
-
Grupo Cochrane de Neonatología
- Copyright:
-
- Copyright © 2016 The Cochrane Collaboration. Published by John Wiley & Sons, Ltd.
Cifras del artículo
Altmetric:
Citado por:
Autores
Contributions of authors
TS, DAO and JKS contributed to the protocol.
TS and DAO performed the literature search, independently assessed studies for eligibility, performed critical appraisal of eligible studies and data extraction, and formed a consensus on the conclusions.
TS wrote the review with DAO.
Sources of support
Internal sources
-
No sources of support supplied
External sources
-
Australian Satellite of the Cochrane Neonatal Review Group, Australia.
NH&MRC grant RIMS project ID: 2013‐01632
-
Eunice Kennedy Shriver National Institute of Child Health and Human Development, National Institutes of Health, Department of Health and Human Services, USA.
Editorial support of the Cochrane Neonatal Review Group has been funded with Federal funds from the Eunice Kennedy Shriver National Institute of Child Health and Human Development National Institutes of Health, Department of Health and Human Services, USA, under Contract No. HHSN275201100016C
Declarations of interest
None known.
Acknowledgements
We would like to thank external referee Janet Berrington.
Version history
| Published | Title | Stage | Authors | Version |
| 2016 Oct 28 | Polyunsaturated fatty acid supplementation in infancy for the prevention of allergy | Review | Tim Schindler, John KH Sinn, David A Osborn | |
| 2012 Sep 12 | Polyunsaturated fatty acid supplementation in infancy for the prevention of allergy and food hypersensitivity | Protocol | Tim Schindler, Lauren Gladman, John KH Sinn, David A Osborn | |
Differences between protocol and review
The protocol listed food hypersensitivity as a secondary outcome. We have omitted this as the review is focused on clinical allergic outcomes. The term 'hypersensitivity' includes clinical reactions that are not related to allergy.
In the review, we excluded studies that included eligible participants and compared eligible interventions but did not prespecify or report allergy. Although it was intended to include these to facilitate the assessment of publication bias, this would have resulted in an excessively cumbersome review. The potential for publication bias has still been addressed.
Risk differences are reported for all outcomes despite not being prespecified in the protocol.
Keywords
MeSH
Medical Subject Headings (MeSH) Keywords
- *Dietary Supplements;
- Asthma [prevention & control];
- Dermatitis [prevention & control];
- Fatty Acids, Unsaturated [*administration & dosage];
- Food Hypersensitivity [prevention & control];
- Hypersensitivity [epidemiology, *prevention & control];
- Prevalence;
- Randomized Controlled Trials as Topic;
- Rhinitis, Allergic [epidemiology, prevention & control];
Medical Subject Headings Check Words
Child; Child, Preschool; Humans; Infant;
PICO

Risk of bias summary: review authors' judgements about each risk of bias item for each included study.

Comparison 1 Higher versus lower PUFA intake, Outcome 1 All allergic disease.
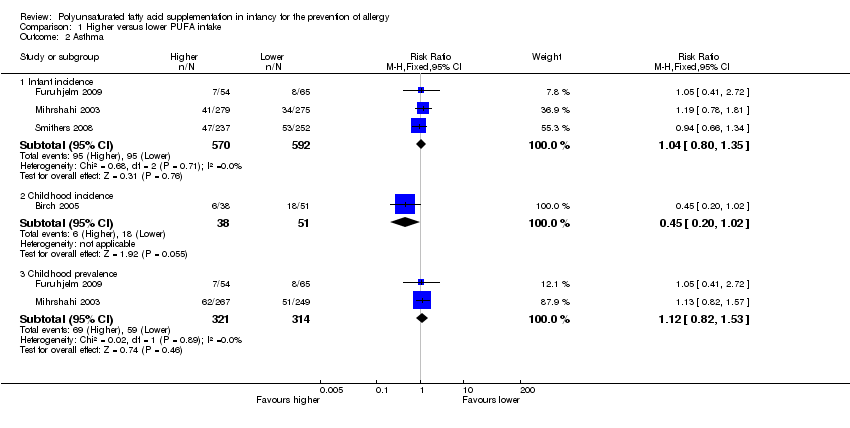
Comparison 1 Higher versus lower PUFA intake, Outcome 2 Asthma.

Comparison 1 Higher versus lower PUFA intake, Outcome 3 Dermatitis/eczema.
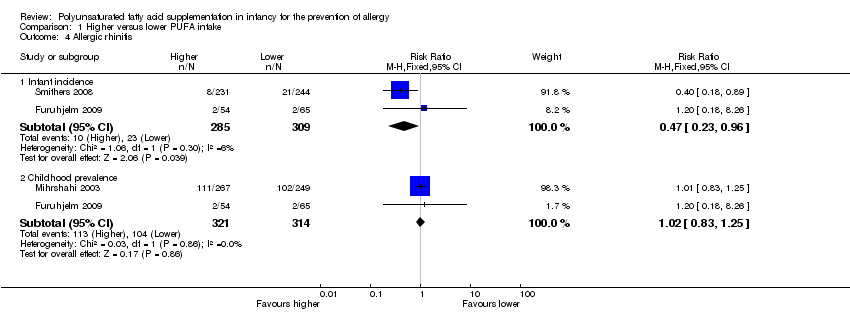
Comparison 1 Higher versus lower PUFA intake, Outcome 4 Allergic rhinitis.

Comparison 1 Higher versus lower PUFA intake, Outcome 5 Food allergy.

Comparison 2 Higher versus lower PUFA intake: subgrouped by supplementation of infant versus supplementation of mother, Outcome 1 All allergic disease ‐ infant incidence.

Comparison 2 Higher versus lower PUFA intake: subgrouped by supplementation of infant versus supplementation of mother, Outcome 2 All allergic disease ‐ childhood incidence.
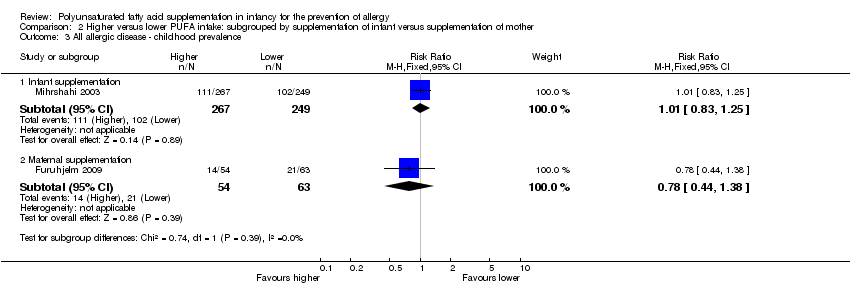
Comparison 2 Higher versus lower PUFA intake: subgrouped by supplementation of infant versus supplementation of mother, Outcome 3 All allergic disease ‐ childhood prevalence.

Comparison 2 Higher versus lower PUFA intake: subgrouped by supplementation of infant versus supplementation of mother, Outcome 4 Asthma ‐ infant incidence.
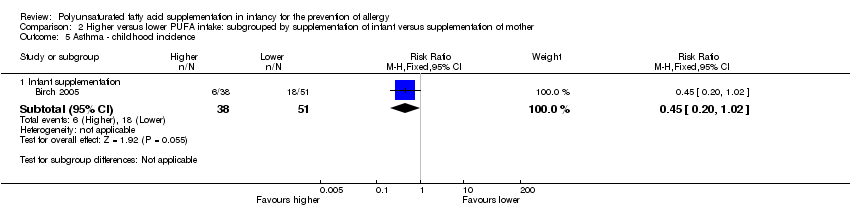
Comparison 2 Higher versus lower PUFA intake: subgrouped by supplementation of infant versus supplementation of mother, Outcome 5 Asthma ‐ childhood incidence.
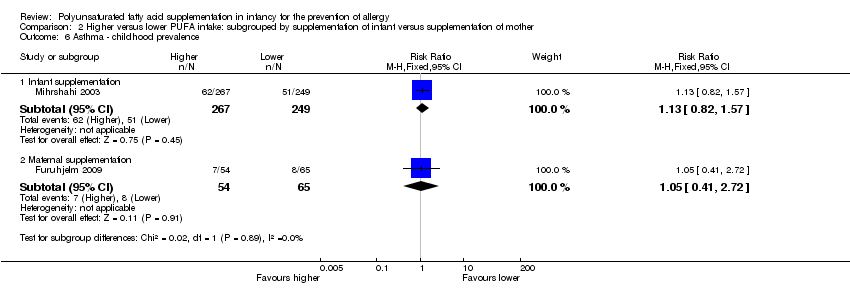
Comparison 2 Higher versus lower PUFA intake: subgrouped by supplementation of infant versus supplementation of mother, Outcome 6 Asthma ‐ childhood prevalence.

Comparison 2 Higher versus lower PUFA intake: subgrouped by supplementation of infant versus supplementation of mother, Outcome 7 Dermatitis/eczema ‐ infant incidence.
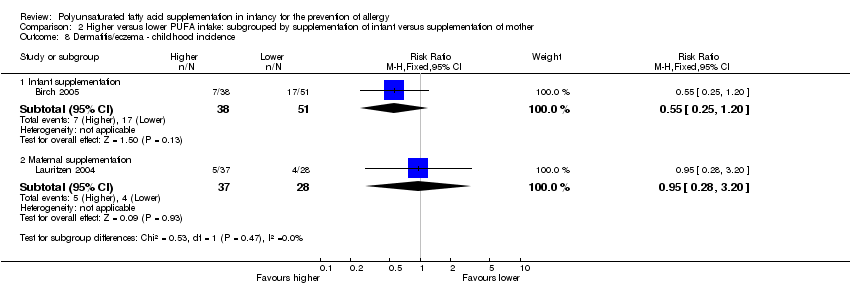
Comparison 2 Higher versus lower PUFA intake: subgrouped by supplementation of infant versus supplementation of mother, Outcome 8 Dermatitis/eczema ‐ childhood incidence.
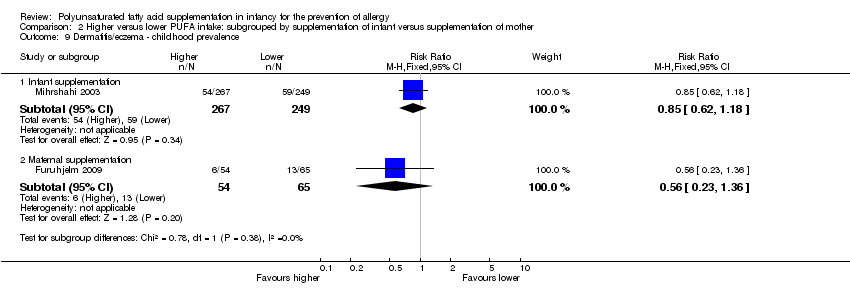
Comparison 2 Higher versus lower PUFA intake: subgrouped by supplementation of infant versus supplementation of mother, Outcome 9 Dermatitis/eczema ‐ childhood prevalence.
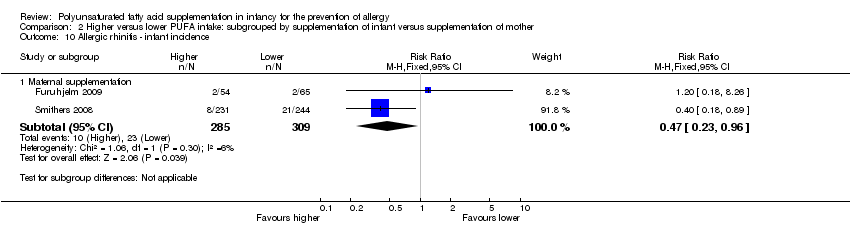
Comparison 2 Higher versus lower PUFA intake: subgrouped by supplementation of infant versus supplementation of mother, Outcome 10 Allergic rhinitis ‐ infant incidence.
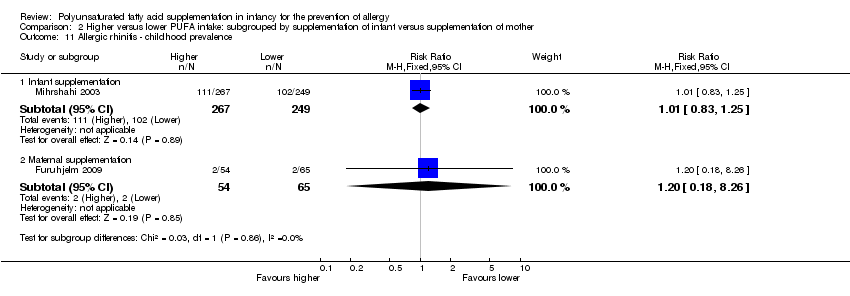
Comparison 2 Higher versus lower PUFA intake: subgrouped by supplementation of infant versus supplementation of mother, Outcome 11 Allergic rhinitis ‐ childhood prevalence.
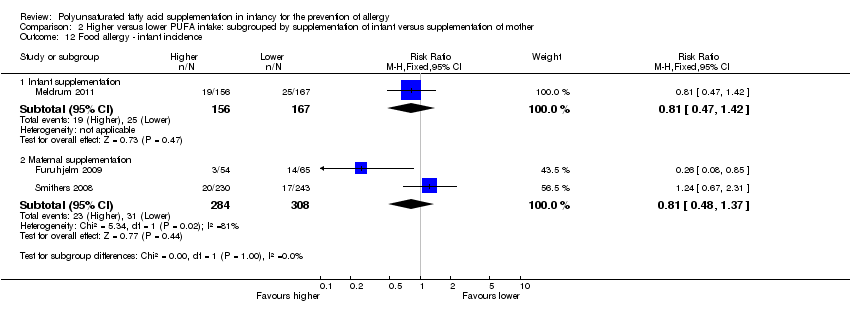
Comparison 2 Higher versus lower PUFA intake: subgrouped by supplementation of infant versus supplementation of mother, Outcome 12 Food allergy ‐ infant incidence.
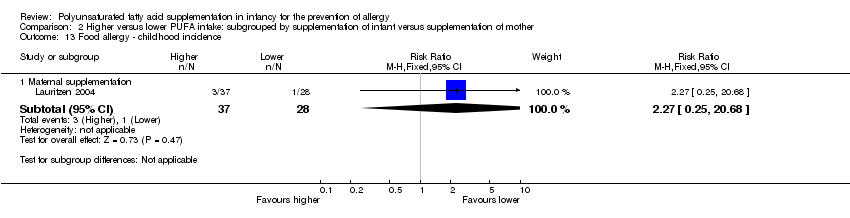
Comparison 2 Higher versus lower PUFA intake: subgrouped by supplementation of infant versus supplementation of mother, Outcome 13 Food allergy ‐ childhood incidence.

Comparison 2 Higher versus lower PUFA intake: subgrouped by supplementation of infant versus supplementation of mother, Outcome 14 Food allergy ‐ childhood prevalence.

Comparison 3 Higher versus lower PUFA intake: subgrouped by n‐3 versus n‐6 supplementation, Outcome 1 All allergic disease ‐ infant incidence.

Comparison 3 Higher versus lower PUFA intake: subgrouped by n‐3 versus n‐6 supplementation, Outcome 2 All allergic disease ‐ childhood incidence.
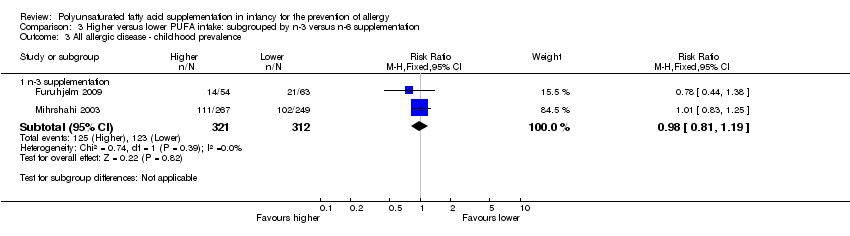
Comparison 3 Higher versus lower PUFA intake: subgrouped by n‐3 versus n‐6 supplementation, Outcome 3 All allergic disease ‐ childhood prevalence.
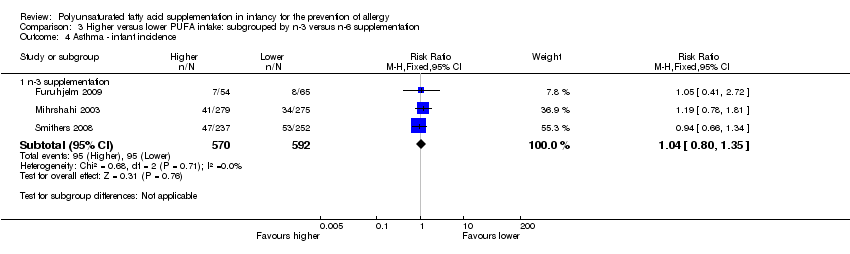
Comparison 3 Higher versus lower PUFA intake: subgrouped by n‐3 versus n‐6 supplementation, Outcome 4 Asthma ‐ infant incidence.
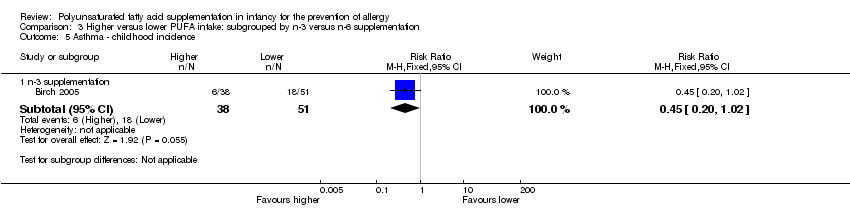
Comparison 3 Higher versus lower PUFA intake: subgrouped by n‐3 versus n‐6 supplementation, Outcome 5 Asthma ‐ childhood incidence.

Comparison 3 Higher versus lower PUFA intake: subgrouped by n‐3 versus n‐6 supplementation, Outcome 6 Asthma ‐ childhood prevalence.

Comparison 3 Higher versus lower PUFA intake: subgrouped by n‐3 versus n‐6 supplementation, Outcome 7 Dermatitis/eczema ‐ infant incidence.
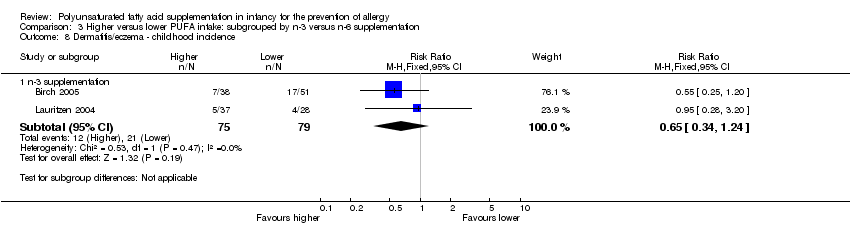
Comparison 3 Higher versus lower PUFA intake: subgrouped by n‐3 versus n‐6 supplementation, Outcome 8 Dermatitis/eczema ‐ childhood incidence.
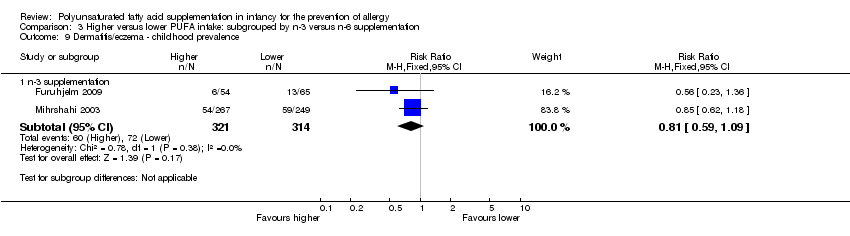
Comparison 3 Higher versus lower PUFA intake: subgrouped by n‐3 versus n‐6 supplementation, Outcome 9 Dermatitis/eczema ‐ childhood prevalence.

Comparison 3 Higher versus lower PUFA intake: subgrouped by n‐3 versus n‐6 supplementation, Outcome 10 Allergic rhinitis ‐ infant incidence.
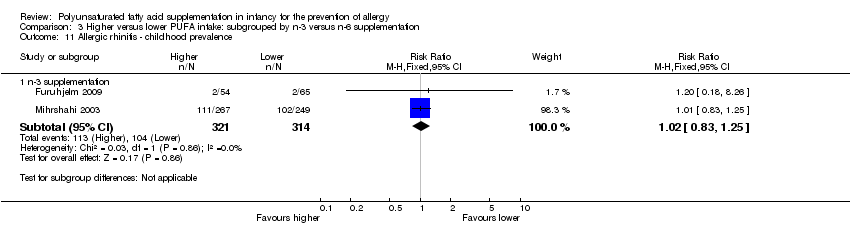
Comparison 3 Higher versus lower PUFA intake: subgrouped by n‐3 versus n‐6 supplementation, Outcome 11 Allergic rhinitis ‐ childhood prevalence.
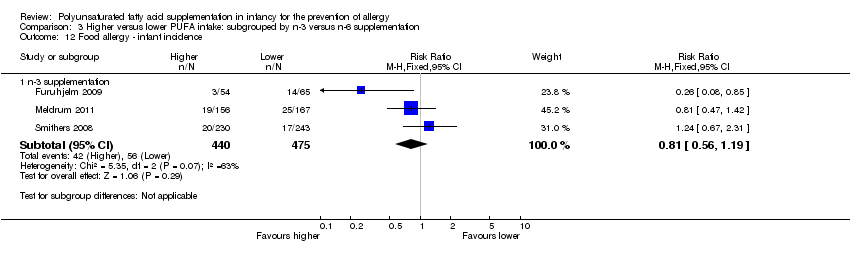
Comparison 3 Higher versus lower PUFA intake: subgrouped by n‐3 versus n‐6 supplementation, Outcome 12 Food allergy ‐ infant incidence.

Comparison 3 Higher versus lower PUFA intake: subgrouped by n‐3 versus n‐6 supplementation, Outcome 13 Food allergy ‐ childhood incidence.

Comparison 3 Higher versus lower PUFA intake: subgrouped by n‐3 versus n‐6 supplementation, Outcome 14 Food allergy ‐ childhood prevalence.

Comparison 4 Higher versus lower PUFA intake: subgrouped by method of infant feeding, Outcome 1 All allergic disease ‐ infant incidence.

Comparison 4 Higher versus lower PUFA intake: subgrouped by method of infant feeding, Outcome 2 All allergic disease ‐ childhood incidence.

Comparison 4 Higher versus lower PUFA intake: subgrouped by method of infant feeding, Outcome 3 All allergic disease ‐ childhood prevalence.
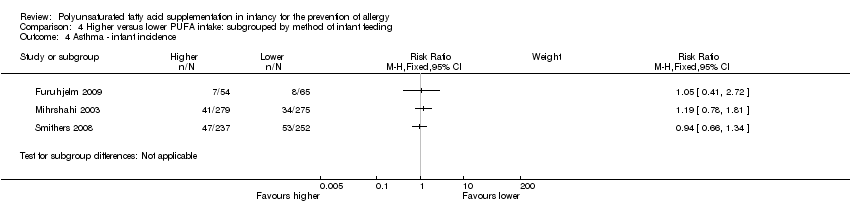
Comparison 4 Higher versus lower PUFA intake: subgrouped by method of infant feeding, Outcome 4 Asthma ‐ infant incidence.

Comparison 4 Higher versus lower PUFA intake: subgrouped by method of infant feeding, Outcome 5 Asthma ‐ childhood incidence.
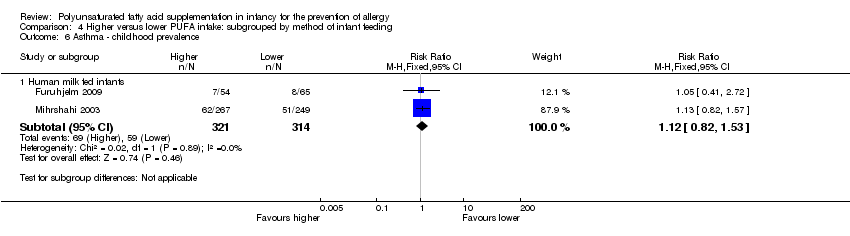
Comparison 4 Higher versus lower PUFA intake: subgrouped by method of infant feeding, Outcome 6 Asthma ‐ childhood prevalence.

Comparison 4 Higher versus lower PUFA intake: subgrouped by method of infant feeding, Outcome 7 Dermatitis/eczema ‐ infant incidence.

Comparison 4 Higher versus lower PUFA intake: subgrouped by method of infant feeding, Outcome 8 Dermatitis/eczema ‐ childhood incidence.

Comparison 4 Higher versus lower PUFA intake: subgrouped by method of infant feeding, Outcome 9 Dermatitis/eczema ‐ childhood prevalence.

Comparison 4 Higher versus lower PUFA intake: subgrouped by method of infant feeding, Outcome 10 Allergic rhinitis ‐ infant incidence.

Comparison 4 Higher versus lower PUFA intake: subgrouped by method of infant feeding, Outcome 11 Allergic rhinitis ‐ childhood prevalence.
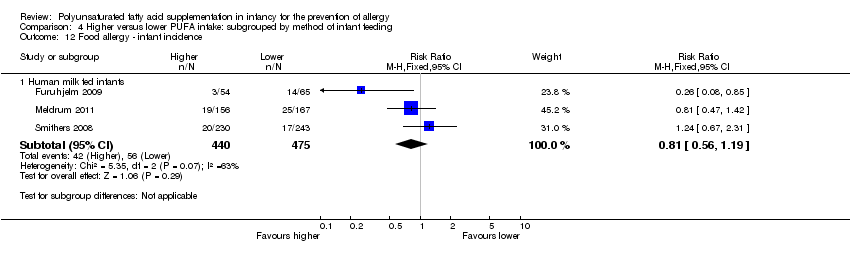
Comparison 4 Higher versus lower PUFA intake: subgrouped by method of infant feeding, Outcome 12 Food allergy ‐ infant incidence.

Comparison 4 Higher versus lower PUFA intake: subgrouped by method of infant feeding, Outcome 13 Food allergy ‐ childhood incidence.

Comparison 4 Higher versus lower PUFA intake: subgrouped by method of infant feeding, Outcome 14 Food allergy ‐ childhood prevalence.

Comparison 5 Higher versus lower PUFA intake: subgrouped by infant heredity for allergy, Outcome 1 All allergic disease ‐ infant incidence.

Comparison 5 Higher versus lower PUFA intake: subgrouped by infant heredity for allergy, Outcome 2 All allergic disease ‐ childhood incidence.

Comparison 5 Higher versus lower PUFA intake: subgrouped by infant heredity for allergy, Outcome 3 All allergic disease ‐ childhood prevalence.

Comparison 5 Higher versus lower PUFA intake: subgrouped by infant heredity for allergy, Outcome 4 Asthma ‐ infant incidence.
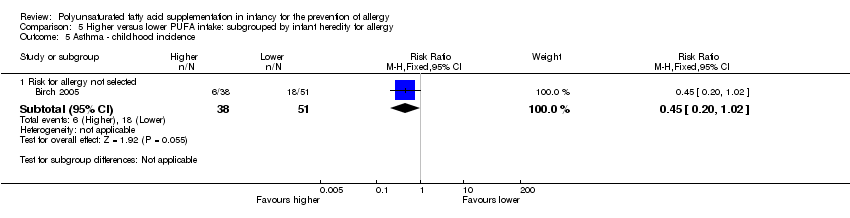
Comparison 5 Higher versus lower PUFA intake: subgrouped by infant heredity for allergy, Outcome 5 Asthma ‐ childhood incidence.

Comparison 5 Higher versus lower PUFA intake: subgrouped by infant heredity for allergy, Outcome 6 Asthma ‐ childhood prevalence.

Comparison 5 Higher versus lower PUFA intake: subgrouped by infant heredity for allergy, Outcome 7 Dermatitis/eczema ‐ infant incidence.

Comparison 5 Higher versus lower PUFA intake: subgrouped by infant heredity for allergy, Outcome 8 Dermatitis/eczema ‐ childhood incidence.

Comparison 5 Higher versus lower PUFA intake: subgrouped by infant heredity for allergy, Outcome 9 Dermatitis/eczema ‐ childhood prevalence.

Comparison 5 Higher versus lower PUFA intake: subgrouped by infant heredity for allergy, Outcome 10 Allergic rhinitis ‐ infant incidence.

Comparison 5 Higher versus lower PUFA intake: subgrouped by infant heredity for allergy, Outcome 11 Allergic rhinitis ‐ childhood prevalence.

Comparison 5 Higher versus lower PUFA intake: subgrouped by infant heredity for allergy, Outcome 12 Food allergy ‐ infant incidence.

Comparison 5 Higher versus lower PUFA intake: subgrouped by infant heredity for allergy, Outcome 13 Food allergy ‐ childhood incidence.
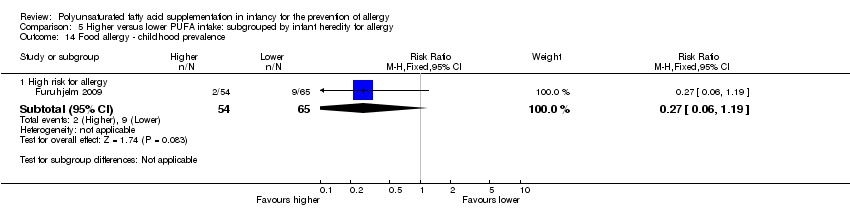
Comparison 5 Higher versus lower PUFA intake: subgrouped by infant heredity for allergy, Outcome 14 Food allergy ‐ childhood prevalence.

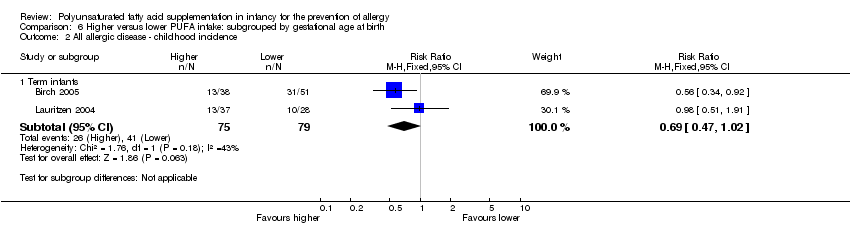
Comparison 6 Higher versus lower PUFA intake: subgrouped by gestational age at birth, Outcome 1 All allergic disease ‐ infant incidence.
Comparison 6 Higher versus lower PUFA intake: subgrouped by gestational age at birth, Outcome 2 All allergic disease ‐ childhood incidence.
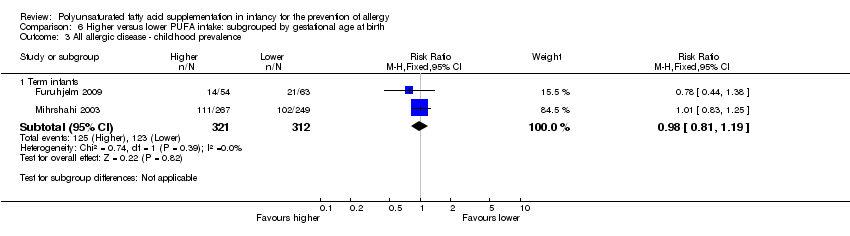
Comparison 6 Higher versus lower PUFA intake: subgrouped by gestational age at birth, Outcome 3 All allergic disease ‐ childhood prevalence.

Comparison 6 Higher versus lower PUFA intake: subgrouped by gestational age at birth, Outcome 4 Asthma ‐ infant incidence.

Comparison 6 Higher versus lower PUFA intake: subgrouped by gestational age at birth, Outcome 5 Asthma ‐ childhood incidence.
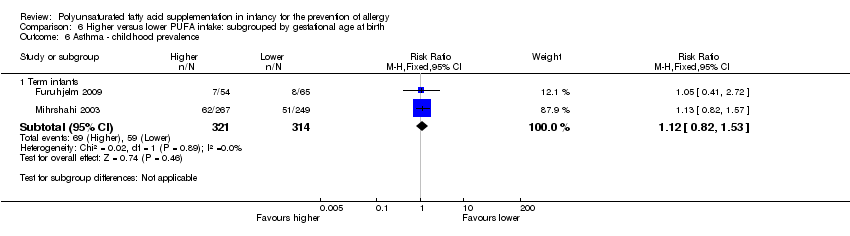
Comparison 6 Higher versus lower PUFA intake: subgrouped by gestational age at birth, Outcome 6 Asthma ‐ childhood prevalence.
Comparison 6 Higher versus lower PUFA intake: subgrouped by gestational age at birth, Outcome 7 Dermatitis/eczema ‐ infant incidence.

Comparison 6 Higher versus lower PUFA intake: subgrouped by gestational age at birth, Outcome 8 Dermatitis/eczema ‐ childhood incidence.

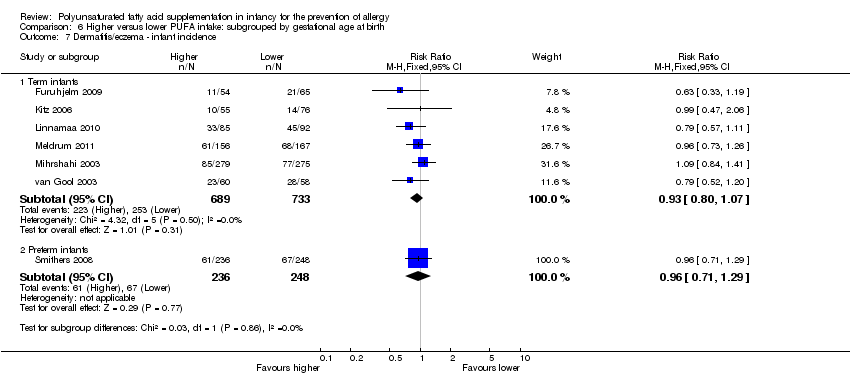
Comparison 6 Higher versus lower PUFA intake: subgrouped by gestational age at birth, Outcome 9 Dermatitis/eczema ‐ childhood prevalence.

Comparison 6 Higher versus lower PUFA intake: subgrouped by gestational age at birth, Outcome 10 Allergic rhinitis ‐ infant incidence.
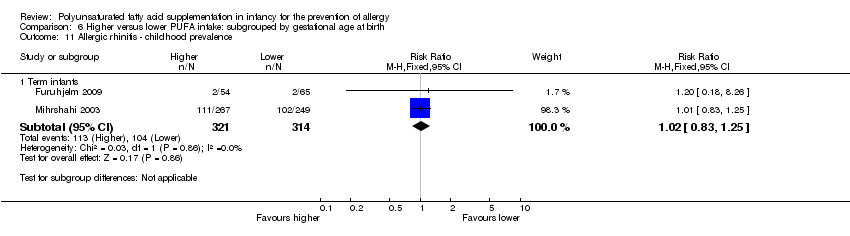
Comparison 6 Higher versus lower PUFA intake: subgrouped by gestational age at birth, Outcome 11 Allergic rhinitis ‐ childhood prevalence.

Comparison 6 Higher versus lower PUFA intake: subgrouped by gestational age at birth, Outcome 12 Food allergy ‐ infant incidence.

Comparison 6 Higher versus lower PUFA intake: subgrouped by gestational age at birth, Outcome 13 Food allergy ‐ childhood incidence.

Comparison 6 Higher versus lower PUFA intake: subgrouped by gestational age at birth, Outcome 14 Food allergy ‐ childhood prevalence.

Comparison 7 Higher versus lower PUFA intake: sensitivity analysis, Outcome 1 Asthma.
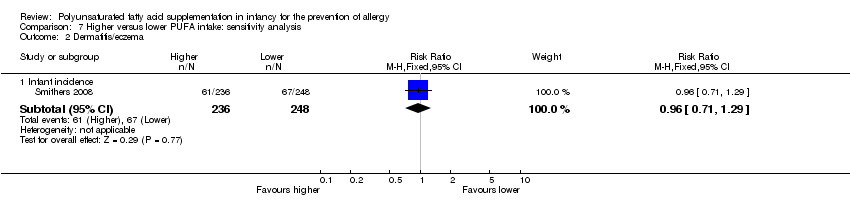
Comparison 7 Higher versus lower PUFA intake: sensitivity analysis, Outcome 2 Dermatitis/eczema.

Comparison 7 Higher versus lower PUFA intake: sensitivity analysis, Outcome 3 Allergic rhinitis.

Comparison 7 Higher versus lower PUFA intake: sensitivity analysis, Outcome 4 Food allergy.
| Higher versus lower PUFA intake for the prevention of allergy ‐ infant incidence | ||||||
| Patient or population: infants | ||||||
| Outcomes | Illustrative comparative risks* (95% CI) | Relative effect | No of participants | Quality of the evidence | Comments | |
| Assumed risk | Corresponding risk | |||||
| Lower PUFA intake | Higher PUFA intake | |||||
| All allergic disease ‐ infant incidence | Study population | RR 0.96 | 323 | ⊕⊝⊝⊝ | ‐ | |
| 395 per 1000 | 379 per 1000 | |||||
| Moderate | ||||||
| 395 per 1000 | 379 per 1000 | |||||
| Asthma ‐ infant incidence | Study population | RR 1.04 | 1162 | ⊕⊕⊝⊝ | ‐ | |
| 160 per 1000 | 167 per 1000 | |||||
| Moderate | ||||||
| 124 per 1000 | 129 per 1000 | |||||
| Dermatitis/eczema ‐ infant incidence | Study population | RR 0.93 | 1906 | ⊕⊝⊝⊝ | ‐ | |
| 326 per 1000 | 303 per 1000 | |||||
| Moderate | ||||||
| 323 per 1000 | 300 per 1000 | |||||
| Allergic rhinitis ‐ infant incidence | Study population | RR 0.47 | 594 | ⊕⊝⊝⊝ | ‐ | |
| 74 per 1000 | 35 per 1000 | |||||
| Moderate | ||||||
| 58 per 1000 | 27 per 1000 | |||||
| Food allergy ‐ infant incidence | Study population | RR 0.81 | 915 | ⊕⊝⊝⊝ | ‐ | |
| 118 per 1000 | 95 per 1000 | |||||
| Moderate | ||||||
| 150 per 1000 | 121 per 1000 | |||||
| *The basis for the assumed risk (e.g. the median control group risk across studies) is provided in footnotes. The corresponding risk (and its 95% confidence interval) is based on the assumed risk in the comparison group and the relative effect of the intervention (and its 95% CI). | ||||||
| GRADE Working Group grades of evidence | ||||||
| 1 Losses to follow‐up | ||||||
| Higher versus lower PUFA intake for the prevention of allergy ‐ childhood incidence | ||||||
| Patient or population: infants | ||||||
| Outcomes | Illustrative comparative risks* (95% CI) | Relative effect | No of participants | Quality of the evidence | Comments | |
| Assumed risk | Corresponding risk | |||||
| Lower PUFA intake | Higher PUFA intake | |||||
| All allergic disease ‐ childhood incidence | Study population | RR 0.69 | 154 | ⊕⊝⊝⊝ | ‐ | |
| 519 per 1000 | 358 per 1000 | |||||
| Moderate | ||||||
| 483 per 1000 | 333 per 1000 | |||||
| Asthma ‐ childhood incidence | Study population | RR 0.45 | 89 | ⊕⊝⊝⊝ | ‐ | |
| 353 per 1000 | 159 per 1000 | |||||
| Moderate | ||||||
| 353 per 1000 | 159 per 1000 | |||||
| Dermatitis/eczema ‐ childhood incidence | Study population | RR 0.65 | 154 | ⊕⊝⊝⊝ | ‐ | |
| 266 per 1000 | 173 per 1000 | |||||
| Moderate | ||||||
| 238 per 1000 | 155 per 1000 | |||||
| Food allergy ‐ childhood incidence | Study population | RR 2.27 | 65 | ⊕⊝⊝⊝ | ‐ | |
| 36 per 1000 | 81 per 1000 | |||||
| Moderate | ||||||
| 36 per 1000 | 82 per 1000 | |||||
| *The basis for the assumed risk (e.g. the median control group risk across studies) is provided in footnotes. The corresponding risk (and its 95% confidence interval) is based on the assumed risk in the comparison group and the relative effect of the intervention (and its 95% CI). | ||||||
| GRADE Working Group grades of evidence | ||||||
| 1 Very high losses to follow‐up. | ||||||
| Higher versus lower PUFA intake for the prevention of allergy ‐ childhood prevalence | ||||||
| Patient or population: infants | ||||||
| Outcomes | Illustrative comparative risks* (95% CI) | Relative effect | No of participants | Quality of the evidence | Comments | |
| Assumed risk | Corresponding risk | |||||
| Lower PUFA intake | Higher PUFA intake | |||||
| All allergic disease ‐ childhood prevalence | Study population | RR 0.98 | 633 | ⊕⊝⊝⊝ | ‐ | |
| 394 per 1000 | 386 per 1000 | |||||
| Moderate | ||||||
| 372 per 1000 | 365 per 1000 | |||||
| Asthma ‐ childhood prevalence | Study population | RR 1.12 | 635 | ⊕⊝⊝⊝ | ‐ | |
| 188 per 1000 | 210 per 1000 | |||||
| Moderate | ||||||
| 164 per 1000 | 184 per 1000 | |||||
| Dermatitis/eczema ‐ childhood prevalence | Study population | RR 0.81 | 635 | ⊕⊝⊝⊝ | ‐ | |
| 229 per 1000 | 186 per 1000 | |||||
| Moderate | ||||||
| 219 per 1000 | 177 per 1000 | |||||
| Allergic rhinitis ‐ childhood prevalence | Study population | RR 1.02 | 635 | ⊕⊝⊝⊝ | ‐ | |
| 331 per 1000 | 338 per 1000 | |||||
| Moderate | ||||||
| 220 per 1000 | 224 per 1000 | |||||
| Food allergy ‐ childhood prevalence | Study population | RR 0.27 | 119 | ⊕⊝⊝⊝ | ‐ | |
| 138 per 1000 | 37 per 1000 | |||||
| Moderate | ||||||
| 139 per 1000 | 38 per 1000 | |||||
| *The basis for the assumed risk (e.g. the median control group risk across studies) is provided in footnotes. The corresponding risk (and its 95% confidence interval) is based on the assumed risk in the comparison group and the relative effect of the intervention (and its 95% CI). | ||||||
| GRADE Working Group grades of evidence | ||||||
| 1 Losses to follow‐up > 10%. | ||||||
| Outcome or subgroup title | No. of studies | No. of participants | Statistical method | Effect size |
| 1 All allergic disease Show forest plot | 5 | Risk Ratio (M‐H, Fixed, 95% CI) | Subtotals only | |
| 1.1 Infant incidence | 1 | 323 | Risk Ratio (M‐H, Fixed, 95% CI) | 0.96 [0.73, 1.26] |
| 1.2 Childhood incidence | 2 | 154 | Risk Ratio (M‐H, Fixed, 95% CI) | 0.69 [0.47, 1.02] |
| 1.3 Childhood prevalence | 2 | 633 | Risk Ratio (M‐H, Fixed, 95% CI) | 0.98 [0.81, 1.19] |
| 2 Asthma Show forest plot | 4 | Risk Ratio (M‐H, Fixed, 95% CI) | Subtotals only | |
| 2.1 Infant incidence | 3 | 1162 | Risk Ratio (M‐H, Fixed, 95% CI) | 1.04 [0.80, 1.35] |
| 2.2 Childhood incidence | 1 | 89 | Risk Ratio (M‐H, Fixed, 95% CI) | 0.45 [0.20, 1.02] |
| 2.3 Childhood prevalence | 2 | 635 | Risk Ratio (M‐H, Fixed, 95% CI) | 1.12 [0.82, 1.53] |
| 3 Dermatitis/eczema Show forest plot | 9 | Risk Ratio (M‐H, Fixed, 95% CI) | Subtotals only | |
| 3.1 Infant incidence | 7 | 1906 | Risk Ratio (M‐H, Fixed, 95% CI) | 0.93 [0.82, 1.06] |
| 3.2 Childhood incidence | 2 | 154 | Risk Ratio (M‐H, Fixed, 95% CI) | 0.65 [0.34, 1.24] |
| 3.3 Childhood prevalence | 2 | 635 | Risk Ratio (M‐H, Fixed, 95% CI) | 0.81 [0.59, 1.09] |
| 4 Allergic rhinitis Show forest plot | 3 | Risk Ratio (M‐H, Fixed, 95% CI) | Subtotals only | |
| 4.1 Infant incidence | 2 | 594 | Risk Ratio (M‐H, Fixed, 95% CI) | 0.47 [0.23, 0.96] |
| 4.2 Childhood prevalence | 2 | 635 | Risk Ratio (M‐H, Fixed, 95% CI) | 1.02 [0.83, 1.25] |
| 5 Food allergy Show forest plot | 4 | Risk Ratio (M‐H, Fixed, 95% CI) | Subtotals only | |
| 5.1 Infant incidence | 3 | 915 | Risk Ratio (M‐H, Fixed, 95% CI) | 0.81 [0.56, 1.19] |
| 5.2 Childhood incidence | 1 | 65 | Risk Ratio (M‐H, Fixed, 95% CI) | 2.27 [0.25, 20.68] |
| 5.3 Childhood prevalence | 1 | 119 | Risk Ratio (M‐H, Fixed, 95% CI) | 0.27 [0.06, 1.19] |
| Outcome or subgroup title | No. of studies | No. of participants | Statistical method | Effect size |
| 1 All allergic disease ‐ infant incidence Show forest plot | 1 | Risk Ratio (M‐H, Fixed, 95% CI) | Subtotals only | |
| 1.1 Infant supplementation | 1 | 323 | Risk Ratio (M‐H, Fixed, 95% CI) | 0.96 [0.73, 1.26] |
| 2 All allergic disease ‐ childhood incidence Show forest plot | 2 | Risk Ratio (M‐H, Fixed, 95% CI) | Subtotals only | |
| 2.1 Infant supplementation | 1 | 89 | Risk Ratio (M‐H, Fixed, 95% CI) | 0.56 [0.34, 0.92] |
| 2.2 Maternal supplementation | 1 | 65 | Risk Ratio (M‐H, Fixed, 95% CI) | 0.98 [0.51, 1.91] |
| 3 All allergic disease ‐ childhood prevalence Show forest plot | 2 | Risk Ratio (M‐H, Fixed, 95% CI) | Subtotals only | |
| 3.1 Infant supplementation | 1 | 516 | Risk Ratio (M‐H, Fixed, 95% CI) | 1.01 [0.83, 1.25] |
| 3.2 Maternal supplementation | 1 | 117 | Risk Ratio (M‐H, Fixed, 95% CI) | 0.78 [0.44, 1.38] |
| 4 Asthma ‐ infant incidence Show forest plot | 3 | Risk Ratio (M‐H, Fixed, 95% CI) | Subtotals only | |
| 4.1 Infant supplementation | 1 | 554 | Risk Ratio (M‐H, Fixed, 95% CI) | 1.19 [0.78, 1.81] |
| 4.2 Maternal supplementation | 2 | 608 | Risk Ratio (M‐H, Fixed, 95% CI) | 0.96 [0.69, 1.33] |
| 5 Asthma ‐ childhood incidence Show forest plot | 1 | Risk Ratio (M‐H, Fixed, 95% CI) | Subtotals only | |
| 5.1 Infant supplementation | 1 | 89 | Risk Ratio (M‐H, Fixed, 95% CI) | 0.45 [0.20, 1.02] |
| 6 Asthma ‐ childhood prevalence Show forest plot | 2 | Risk Ratio (M‐H, Fixed, 95% CI) | Subtotals only | |
| 6.1 Infant supplementation | 1 | 516 | Risk Ratio (M‐H, Fixed, 95% CI) | 1.13 [0.82, 1.57] |
| 6.2 Maternal supplementation | 1 | 119 | Risk Ratio (M‐H, Fixed, 95% CI) | 1.05 [0.41, 2.72] |
| 7 Dermatitis/eczema ‐ infant incidence Show forest plot | 7 | Risk Ratio (M‐H, Fixed, 95% CI) | Subtotals only | |
| 7.1 Infant supplementation | 5 | 1245 | Risk Ratio (M‐H, Fixed, 95% CI) | 0.95 [0.82, 1.11] |
| 7.2 Maternal supplementation | 3 | 661 | Risk Ratio (M‐H, Fixed, 95% CI) | 0.88 [0.68, 1.15] |
| 8 Dermatitis/eczema ‐ childhood incidence Show forest plot | 2 | Risk Ratio (M‐H, Fixed, 95% CI) | Subtotals only | |
| 8.1 Infant supplementation | 1 | 89 | Risk Ratio (M‐H, Fixed, 95% CI) | 0.55 [0.25, 1.20] |
| 8.2 Maternal supplementation | 1 | 65 | Risk Ratio (M‐H, Fixed, 95% CI) | 0.95 [0.28, 3.20] |
| 9 Dermatitis/eczema ‐ childhood prevalence Show forest plot | 2 | Risk Ratio (M‐H, Fixed, 95% CI) | Subtotals only | |
| 9.1 Infant supplementation | 1 | 516 | Risk Ratio (M‐H, Fixed, 95% CI) | 0.85 [0.62, 1.18] |
| 9.2 Maternal supplementation | 1 | 119 | Risk Ratio (M‐H, Fixed, 95% CI) | 0.56 [0.23, 1.36] |
| 10 Allergic rhinitis ‐ infant incidence Show forest plot | 2 | Risk Ratio (M‐H, Fixed, 95% CI) | Subtotals only | |
| 10.1 Maternal supplementation | 2 | 594 | Risk Ratio (M‐H, Fixed, 95% CI) | 0.47 [0.23, 0.96] |
| 11 Allergic rhinitis ‐ childhood prevalence Show forest plot | 2 | Risk Ratio (M‐H, Fixed, 95% CI) | Subtotals only | |
| 11.1 Infant supplementation | 1 | 516 | Risk Ratio (M‐H, Fixed, 95% CI) | 1.01 [0.83, 1.25] |
| 11.2 Maternal supplementation | 1 | 119 | Risk Ratio (M‐H, Fixed, 95% CI) | 1.20 [0.18, 8.26] |
| 12 Food allergy ‐ infant incidence Show forest plot | 3 | Risk Ratio (M‐H, Fixed, 95% CI) | Subtotals only | |
| 12.1 Infant supplementation | 1 | 323 | Risk Ratio (M‐H, Fixed, 95% CI) | 0.81 [0.47, 1.42] |
| 12.2 Maternal supplementation | 2 | 592 | Risk Ratio (M‐H, Fixed, 95% CI) | 0.81 [0.48, 1.37] |
| 13 Food allergy ‐ childhood incidence Show forest plot | 1 | Risk Ratio (M‐H, Fixed, 95% CI) | Subtotals only | |
| 13.1 Maternal supplementation | 1 | 65 | Risk Ratio (M‐H, Fixed, 95% CI) | 2.27 [0.25, 20.68] |
| 14 Food allergy ‐ childhood prevalence Show forest plot | 1 | Risk Ratio (M‐H, Fixed, 95% CI) | Subtotals only | |
| 14.1 Maternal supplementation | 1 | 119 | Risk Ratio (M‐H, Fixed, 95% CI) | 0.27 [0.06, 1.19] |
| Outcome or subgroup title | No. of studies | No. of participants | Statistical method | Effect size |
| 1 All allergic disease ‐ infant incidence Show forest plot | 1 | Risk Ratio (M‐H, Fixed, 95% CI) | Subtotals only | |
| 1.1 n‐3 supplementation | 1 | 323 | Risk Ratio (M‐H, Fixed, 95% CI) | 0.96 [0.73, 1.26] |
| 2 All allergic disease ‐ childhood incidence Show forest plot | 2 | Risk Ratio (M‐H, Fixed, 95% CI) | Subtotals only | |
| 2.1 n‐3 supplementation | 2 | 154 | Risk Ratio (M‐H, Fixed, 95% CI) | 0.69 [0.47, 1.02] |
| 3 All allergic disease ‐ childhood prevalence Show forest plot | 2 | Risk Ratio (M‐H, Fixed, 95% CI) | Subtotals only | |
| 3.1 n‐3 supplementation | 2 | 633 | Risk Ratio (M‐H, Fixed, 95% CI) | 0.98 [0.81, 1.19] |
| 4 Asthma ‐ infant incidence Show forest plot | 3 | Risk Ratio (M‐H, Fixed, 95% CI) | Subtotals only | |
| 4.1 n‐3 supplementation | 3 | 1162 | Risk Ratio (M‐H, Fixed, 95% CI) | 1.04 [0.80, 1.35] |
| 5 Asthma ‐ childhood incidence Show forest plot | 1 | Risk Ratio (M‐H, Fixed, 95% CI) | Subtotals only | |
| 5.1 n‐3 supplementation | 1 | 89 | Risk Ratio (M‐H, Fixed, 95% CI) | 0.45 [0.20, 1.02] |
| 6 Asthma ‐ childhood prevalence Show forest plot | 2 | Risk Ratio (M‐H, Fixed, 95% CI) | Subtotals only | |
| 6.1 n‐3 supplementation | 2 | 635 | Risk Ratio (M‐H, Fixed, 95% CI) | 1.12 [0.82, 1.53] |
| 7 Dermatitis/eczema ‐ infant incidence Show forest plot | 7 | Risk Ratio (M‐H, Fixed, 95% CI) | Subtotals only | |
| 7.1 n‐3 supplementation | 5 | 1657 | Risk Ratio (M‐H, Fixed, 95% CI) | 0.95 [0.82, 1.09] |
| 7.2 n‐6 supplementation | 2 | 249 | Risk Ratio (M‐H, Fixed, 95% CI) | 0.85 [0.59, 1.23] |
| 8 Dermatitis/eczema ‐ childhood incidence Show forest plot | 2 | Risk Ratio (M‐H, Fixed, 95% CI) | Subtotals only | |
| 8.1 n‐3 supplementation | 2 | 154 | Risk Ratio (M‐H, Fixed, 95% CI) | 0.65 [0.34, 1.24] |
| 9 Dermatitis/eczema ‐ childhood prevalence Show forest plot | 2 | Risk Ratio (M‐H, Fixed, 95% CI) | Subtotals only | |
| 9.1 n‐3 supplementation | 2 | 635 | Risk Ratio (M‐H, Fixed, 95% CI) | 0.81 [0.59, 1.09] |
| 10 Allergic rhinitis ‐ infant incidence Show forest plot | 2 | Risk Ratio (M‐H, Fixed, 95% CI) | Subtotals only | |
| 10.1 n‐3 supplementation | 2 | 594 | Risk Ratio (M‐H, Fixed, 95% CI) | 0.47 [0.23, 0.96] |
| 11 Allergic rhinitis ‐ childhood prevalence Show forest plot | 2 | Risk Ratio (M‐H, Fixed, 95% CI) | Subtotals only | |
| 11.1 n‐3 supplementation | 2 | 635 | Risk Ratio (M‐H, Fixed, 95% CI) | 1.02 [0.83, 1.25] |
| 12 Food allergy ‐ infant incidence Show forest plot | 3 | Risk Ratio (M‐H, Fixed, 95% CI) | Subtotals only | |
| 12.1 n‐3 supplementation | 3 | 915 | Risk Ratio (M‐H, Fixed, 95% CI) | 0.81 [0.56, 1.19] |
| 13 Food allergy ‐ childhood incidence Show forest plot | 1 | Risk Ratio (M‐H, Fixed, 95% CI) | Subtotals only | |
| 13.1 n‐3 supplementation | 1 | 65 | Risk Ratio (M‐H, Fixed, 95% CI) | 2.27 [0.25, 20.68] |
| 14 Food allergy ‐ childhood prevalence Show forest plot | 1 | Risk Ratio (M‐H, Fixed, 95% CI) | Subtotals only | |
| 14.1 n‐3 supplementation | 1 | 119 | Risk Ratio (M‐H, Fixed, 95% CI) | 0.27 [0.06, 1.19] |
| Outcome or subgroup title | No. of studies | No. of participants | Statistical method | Effect size |
| 1 All allergic disease ‐ infant incidence Show forest plot | 1 | Risk Ratio (M‐H, Fixed, 95% CI) | Subtotals only | |
| 1.1 Human milk fed infants | 1 | 323 | Risk Ratio (M‐H, Fixed, 95% CI) | 0.96 [0.73, 1.26] |
| 2 All allergic disease ‐ childhood incidence Show forest plot | 2 | Risk Ratio (M‐H, Fixed, 95% CI) | Subtotals only | |
| 2.1 Human milk fed infants | 1 | 65 | Risk Ratio (M‐H, Fixed, 95% CI) | 0.98 [0.51, 1.91] |
| 2.2 Formula fed infants | 1 | 89 | Risk Ratio (M‐H, Fixed, 95% CI) | 0.56 [0.34, 0.92] |
| 3 All allergic disease ‐ childhood prevalence Show forest plot | 2 | Risk Ratio (M‐H, Fixed, 95% CI) | Subtotals only | |
| 3.1 Human milk fed infants | 2 | 633 | Risk Ratio (M‐H, Fixed, 95% CI) | 0.98 [0.81, 1.19] |
| 4 Asthma ‐ infant incidence Show forest plot | 3 | Risk Ratio (M‐H, Fixed, 95% CI) | Subtotals only | |
| 5 Asthma ‐ childhood incidence Show forest plot | 1 | Risk Ratio (M‐H, Fixed, 95% CI) | Subtotals only | |
| 5.1 Formula fed infants | 1 | 89 | Risk Ratio (M‐H, Fixed, 95% CI) | 0.45 [0.20, 1.02] |
| 6 Asthma ‐ childhood prevalence Show forest plot | 2 | Risk Ratio (M‐H, Fixed, 95% CI) | Subtotals only | |
| 6.1 Human milk fed infants | 2 | 635 | Risk Ratio (M‐H, Fixed, 95% CI) | 1.12 [0.82, 1.53] |
| 7 Dermatitis/eczema ‐ infant incidence Show forest plot | 7 | Risk Ratio (M‐H, Fixed, 95% CI) | Subtotals only | |
| 7.1 Human milk fed infants | 6 | 1715 | Risk Ratio (M‐H, Fixed, 95% CI) | 0.95 [0.82, 1.09] |
| 7.2 Formula fed infants | 2 | 191 | Risk Ratio (M‐H, Fixed, 95% CI) | 0.84 [0.57, 1.23] |
| 8 Dermatitis/eczema ‐ childhood incidence Show forest plot | 2 | Risk Ratio (M‐H, Fixed, 95% CI) | Subtotals only | |
| 8.1 Human milk fed infants | 1 | 65 | Risk Ratio (M‐H, Fixed, 95% CI) | 0.95 [0.28, 3.20] |
| 8.2 Formula fed infants | 1 | 89 | Risk Ratio (M‐H, Fixed, 95% CI) | 0.55 [0.25, 1.20] |
| 9 Dermatitis/eczema ‐ childhood prevalence Show forest plot | 2 | Risk Ratio (M‐H, Fixed, 95% CI) | Subtotals only | |
| 9.1 Human milk fed infants | 2 | 635 | Risk Ratio (M‐H, Fixed, 95% CI) | 0.81 [0.59, 1.09] |
| 10 Allergic rhinitis ‐ infant incidence Show forest plot | 2 | Risk Ratio (M‐H, Fixed, 95% CI) | Subtotals only | |
| 10.1 Human milk fed infants | 2 | 594 | Risk Ratio (M‐H, Fixed, 95% CI) | 0.47 [0.23, 0.96] |
| 11 Allergic rhinitis ‐ childhood prevalence Show forest plot | 2 | Risk Ratio (M‐H, Fixed, 95% CI) | Subtotals only | |
| 11.1 Human milk fed infants | 2 | 635 | Risk Ratio (M‐H, Fixed, 95% CI) | 1.02 [0.83, 1.25] |
| 12 Food allergy ‐ infant incidence Show forest plot | 3 | Risk Ratio (M‐H, Fixed, 95% CI) | Subtotals only | |
| 12.1 Human milk fed infants | 3 | 915 | Risk Ratio (M‐H, Fixed, 95% CI) | 0.81 [0.56, 1.19] |
| 13 Food allergy ‐ childhood incidence Show forest plot | 1 | Risk Ratio (M‐H, Fixed, 95% CI) | Subtotals only | |
| 13.1 Human milk fed infants | 1 | 65 | Risk Ratio (M‐H, Fixed, 95% CI) | 2.27 [0.25, 20.68] |
| 14 Food allergy ‐ childhood prevalence Show forest plot | 1 | Risk Ratio (M‐H, Fixed, 95% CI) | Subtotals only | |
| 14.1 Human milk fed infants | 1 | 119 | Risk Ratio (M‐H, Fixed, 95% CI) | 0.27 [0.06, 1.19] |
| Outcome or subgroup title | No. of studies | No. of participants | Statistical method | Effect size |
| 1 All allergic disease ‐ infant incidence Show forest plot | 1 | Risk Ratio (M‐H, Fixed, 95% CI) | Subtotals only | |
| 1.1 High risk for allergy | 1 | 323 | Risk Ratio (M‐H, Fixed, 95% CI) | 0.96 [0.73, 1.26] |
| 2 All allergic disease ‐ childhood incidence Show forest plot | 2 | Risk Ratio (M‐H, Fixed, 95% CI) | Subtotals only | |
| 2.1 Risk for allergy not selected | 2 | 154 | Risk Ratio (M‐H, Fixed, 95% CI) | 0.69 [0.47, 1.02] |
| 3 All allergic disease ‐ childhood prevalence Show forest plot | 2 | Risk Ratio (M‐H, Fixed, 95% CI) | Subtotals only | |
| 3.1 High risk for allergy | 2 | 633 | Risk Ratio (M‐H, Fixed, 95% CI) | 0.98 [0.81, 1.19] |
| 4 Asthma ‐ infant incidence Show forest plot | 3 | Risk Ratio (M‐H, Fixed, 95% CI) | Subtotals only | |
| 4.1 High risk for allergy | 2 | 673 | Risk Ratio (M‐H, Fixed, 95% CI) | 1.16 [0.79, 1.71] |
| 4.2 Risk for allergy not selected | 1 | 489 | Risk Ratio (M‐H, Fixed, 95% CI) | 0.94 [0.66, 1.34] |
| 5 Asthma ‐ childhood incidence Show forest plot | 1 | Risk Ratio (M‐H, Fixed, 95% CI) | Subtotals only | |
| 5.1 Risk for allergy not selected | 1 | 89 | Risk Ratio (M‐H, Fixed, 95% CI) | 0.45 [0.20, 1.02] |
| 6 Asthma ‐ childhood prevalence Show forest plot | 2 | Risk Ratio (M‐H, Fixed, 95% CI) | Subtotals only | |
| 6.1 High risk for allergy | 2 | 635 | Risk Ratio (M‐H, Fixed, 95% CI) | 1.12 [0.82, 1.53] |
| 7 Dermatitis/eczema ‐ infant incidence Show forest plot | 7 | Risk Ratio (M‐H, Fixed, 95% CI) | Subtotals only | |
| 7.1 High risk for allergy | 5 | 1245 | Risk Ratio (M‐H, Fixed, 95% CI) | 0.96 [0.81, 1.12] |
| 7.2 Risk for allergy not selected | 2 | 661 | Risk Ratio (M‐H, Fixed, 95% CI) | 0.89 [0.71, 1.12] |
| 8 Dermatitis/eczema ‐ childhood incidence Show forest plot | 2 | Risk Ratio (M‐H, Fixed, 95% CI) | Subtotals only | |
| 8.1 Risk for allergy not selected | 2 | 154 | Risk Ratio (M‐H, Fixed, 95% CI) | 0.65 [0.34, 1.24] |
| 9 Dermatitis/eczema ‐ childhood prevalence Show forest plot | 2 | Risk Ratio (M‐H, Fixed, 95% CI) | Subtotals only | |
| 9.1 High risk for allergy | 2 | 635 | Risk Ratio (M‐H, Fixed, 95% CI) | 0.81 [0.59, 1.09] |
| 10 Allergic rhinitis ‐ infant incidence Show forest plot | 2 | Risk Ratio (M‐H, Fixed, 95% CI) | Subtotals only | |
| 10.1 High risk for allergy | 1 | 119 | Risk Ratio (M‐H, Fixed, 95% CI) | 1.20 [0.18, 8.26] |
| 10.2 Risk for allergy not selected | 1 | 475 | Risk Ratio (M‐H, Fixed, 95% CI) | 0.40 [0.18, 0.89] |
| 11 Allergic rhinitis ‐ childhood prevalence Show forest plot | 2 | Risk Ratio (M‐H, Fixed, 95% CI) | Subtotals only | |
| 11.1 High risk for allergy | 2 | 635 | Risk Ratio (M‐H, Fixed, 95% CI) | 1.02 [0.83, 1.25] |
| 12 Food allergy ‐ infant incidence Show forest plot | 3 | Risk Ratio (M‐H, Fixed, 95% CI) | Subtotals only | |
| 12.1 High risk for allergy | 2 | 442 | Risk Ratio (M‐H, Fixed, 95% CI) | 0.62 [0.38, 1.02] |
| 12.2 Risk for allergy not selected | 1 | 473 | Risk Ratio (M‐H, Fixed, 95% CI) | 1.24 [0.67, 2.31] |
| 13 Food allergy ‐ childhood incidence Show forest plot | 1 | Risk Ratio (M‐H, Fixed, 95% CI) | Subtotals only | |
| 13.1 Risk for allergy not selected | 1 | 65 | Risk Ratio (M‐H, Fixed, 95% CI) | 2.27 [0.25, 20.68] |
| 14 Food allergy ‐ childhood prevalence Show forest plot | 1 | Risk Ratio (M‐H, Fixed, 95% CI) | Subtotals only | |
| 14.1 High risk for allergy | 1 | 119 | Risk Ratio (M‐H, Fixed, 95% CI) | 0.27 [0.06, 1.19] |
| Outcome or subgroup title | No. of studies | No. of participants | Statistical method | Effect size |
| 1 All allergic disease ‐ infant incidence Show forest plot | 1 | Risk Ratio (M‐H, Fixed, 95% CI) | Subtotals only | |
| 1.1 Term infants | 1 | 323 | Risk Ratio (M‐H, Fixed, 95% CI) | 0.96 [0.73, 1.26] |
| 2 All allergic disease ‐ childhood incidence Show forest plot | 2 | Risk Ratio (M‐H, Fixed, 95% CI) | Subtotals only | |
| 2.1 Term infants | 2 | 154 | Risk Ratio (M‐H, Fixed, 95% CI) | 0.69 [0.47, 1.02] |
| 3 All allergic disease ‐ childhood prevalence Show forest plot | 2 | Risk Ratio (M‐H, Fixed, 95% CI) | Subtotals only | |
| 3.1 Term infants | 2 | 633 | Risk Ratio (M‐H, Fixed, 95% CI) | 0.98 [0.81, 1.19] |
| 4 Asthma ‐ infant incidence Show forest plot | 3 | Risk Ratio (M‐H, Fixed, 95% CI) | Subtotals only | |
| 4.1 Term infants | 2 | 673 | Risk Ratio (M‐H, Fixed, 95% CI) | 1.16 [0.79, 1.71] |
| 4.2 Preterm infants | 1 | 489 | Risk Ratio (M‐H, Fixed, 95% CI) | 0.94 [0.66, 1.34] |
| 5 Asthma ‐ childhood incidence Show forest plot | 1 | Risk Ratio (M‐H, Fixed, 95% CI) | Subtotals only | |
| 5.1 Term infants | 1 | 89 | Risk Ratio (M‐H, Fixed, 95% CI) | 0.45 [0.20, 1.02] |
| 6 Asthma ‐ childhood prevalence Show forest plot | 2 | Risk Ratio (M‐H, Fixed, 95% CI) | Subtotals only | |
| 6.1 Term infants | 2 | 635 | Risk Ratio (M‐H, Fixed, 95% CI) | 1.12 [0.82, 1.53] |
| 7 Dermatitis/eczema ‐ infant incidence Show forest plot | 7 | Risk Ratio (M‐H, Fixed, 95% CI) | Subtotals only | |
| 7.1 Term infants | 6 | 1422 | Risk Ratio (M‐H, Fixed, 95% CI) | 0.93 [0.80, 1.07] |
| 7.2 Preterm infants | 1 | 484 | Risk Ratio (M‐H, Fixed, 95% CI) | 0.96 [0.71, 1.29] |
| 8 Dermatitis/eczema ‐ childhood incidence Show forest plot | 2 | Risk Ratio (M‐H, Fixed, 95% CI) | Subtotals only | |
| 8.1 Term infants | 2 | 154 | Risk Ratio (M‐H, Fixed, 95% CI) | 0.65 [0.34, 1.24] |
| 9 Dermatitis/eczema ‐ childhood prevalence Show forest plot | 2 | Risk Ratio (M‐H, Fixed, 95% CI) | Subtotals only | |
| 9.1 Term infants | 2 | 635 | Risk Ratio (M‐H, Fixed, 95% CI) | 0.81 [0.59, 1.09] |
| 10 Allergic rhinitis ‐ infant incidence Show forest plot | 2 | Risk Ratio (M‐H, Fixed, 95% CI) | Subtotals only | |
| 10.1 Term infants | 1 | 119 | Risk Ratio (M‐H, Fixed, 95% CI) | 1.20 [0.18, 8.26] |
| 10.2 Preterm infants | 1 | 475 | Risk Ratio (M‐H, Fixed, 95% CI) | 0.40 [0.18, 0.89] |
| 11 Allergic rhinitis ‐ childhood prevalence Show forest plot | 2 | Risk Ratio (M‐H, Fixed, 95% CI) | Subtotals only | |
| 11.1 Term infants | 2 | 635 | Risk Ratio (M‐H, Fixed, 95% CI) | 1.02 [0.83, 1.25] |
| 12 Food allergy ‐ infant incidence Show forest plot | 3 | Risk Ratio (M‐H, Fixed, 95% CI) | Subtotals only | |
| 12.1 Term infants | 2 | 442 | Risk Ratio (M‐H, Fixed, 95% CI) | 0.62 [0.38, 1.02] |
| 12.2 Preterm infants | 1 | 473 | Risk Ratio (M‐H, Fixed, 95% CI) | 1.24 [0.67, 2.31] |
| 13 Food allergy ‐ childhood incidence Show forest plot | 1 | Risk Ratio (M‐H, Fixed, 95% CI) | Subtotals only | |
| 13.1 Term infants | 1 | 65 | Risk Ratio (M‐H, Fixed, 95% CI) | 2.27 [0.25, 20.68] |
| 14 Food allergy ‐ childhood prevalence Show forest plot | 1 | Risk Ratio (M‐H, Fixed, 95% CI) | Subtotals only | |
| 14.1 Term infants | 1 | 119 | Risk Ratio (M‐H, Fixed, 95% CI) | 0.27 [0.06, 1.19] |
| Outcome or subgroup title | No. of studies | No. of participants | Statistical method | Effect size |
| 1 Asthma Show forest plot | 1 | Risk Ratio (M‐H, Fixed, 95% CI) | Subtotals only | |
| 1.1 Infant incidence | 1 | 489 | Risk Ratio (M‐H, Fixed, 95% CI) | 0.94 [0.66, 1.34] |
| 2 Dermatitis/eczema Show forest plot | 1 | Risk Ratio (M‐H, Fixed, 95% CI) | Subtotals only | |
| 2.1 Infant incidence | 1 | 484 | Risk Ratio (M‐H, Fixed, 95% CI) | 0.96 [0.71, 1.29] |
| 3 Allergic rhinitis Show forest plot | 1 | Risk Ratio (M‐H, Fixed, 95% CI) | Subtotals only | |
| 3.1 Infant incidence | 1 | 475 | Risk Ratio (M‐H, Fixed, 95% CI) | 0.40 [0.18, 0.89] |
| 4 Food allergy Show forest plot | 1 | Risk Ratio (M‐H, Fixed, 95% CI) | Subtotals only | |
| 4.1 Infant incidence | 1 | 473 | Risk Ratio (M‐H, Fixed, 95% CI) | 1.24 [0.67, 2.31] |