抗氧化剂用于预防与缓解运动后肌肉酸痛
摘要
研究背景
进行剧烈运动、不习惯的运动或做出涉及离心收缩(即肌肉在紧张状态下拉长)的动作之后,通常会出现肌肉酸痛。肌肉酸痛在初次运动后的24至72小时内达到高峰。许多人在运动前后服用抗氧化物补充剂或富含抗氧化物的食物,以期可以预防或缓解运动后的肌肉酸痛。
研究目的
系统综述旨在评价抗氧化物补充剂和富含抗氧化物的食物在预防和缓解运动后迟发性肌肉酸痛的严重程度和持续时间上的效果(获益和伤害)。
检索策略
我们检索了截至2017年2月的Cochrane骨、关节和肌肉创伤组专业注册库(Cochrane Bone, Joint and Muscle Trauma Group Specialised Register)、Cochrane对照试验中心注册库(Cochrane Central Register of Controlled Trials)、MEDLINE、Embase、SPORTDiscus、试验注册库、文章的参考文献列表以及会议记录。
纳入排除标准
我们纳入了随机和半随机对照试验,这些试验研究了所有形式的抗氧化物补充剂(包括特定的抗氧化物补充剂(如片剂、粉剂、浓缩剂)和富含抗氧化物的食物或饮食)在预防或缓解迟发性肌肉酸痛(delayed onset muscle soreness,DOMS)上的效果。对于抗氧化物补充剂与其他补充剂相结合的研究,我们予以排除。
资料收集与分析
两位综述作者独立筛选检索结果,评价偏倚风险,并采用预试验的形式从纳入的试验中提取资料。适当的情况下,我们通常使用随机效应模型合并比较试验的结果。在“研究结果摘要”表中呈现的结局是肌肉酸痛(收集于运动后6小时、24小时、48小时、72小时和96小时)、主观恢复以及不良反应。我们使用GRADE评价证据质量。
主要结果
共纳入了50项随机、安慰剂对照的试验,其中12项采用了交叉设计。共1089名受试者,其中961(88.2%)名为男性,128(11.8%)名为女性。受试者的年龄在16至55岁之间,训练状态从久坐到适度训练不等。这些试验具有异质性,包括为时间(运动前或运动后)、频率、剂量、持续时间和抗氧化物补充剂的类型以及之前运动的类型。所有研究都使用了超过每日推荐量的抗氧化剂。大多数试验(47项)的设计特点是,由于选择性报告和分配方案隐藏表述不清,试验存在高偏倚风险,可能限制其发现的可靠性。
我们只评价了一项比较:抗氧化物补充剂与对照(安慰剂)比较。没有研究比较高剂量与低剂量抗氧化物补充剂,其中低剂量补充剂在所涉及的抗氧化物的正常或推荐水平之内。
肌肉酸痛的合并结果表明,在所有主要的随访中,抗氧化物补充剂对运动后导致的DOMS有效,且差异小:6小时内(标准化平均差(standardised mean difference, SMD)=‐0.30, 95%置信区间(confidence interval, CI) [‐0.56,‐0.04];525名受试者,21项研究;低质量证据);24小时(SMD=‐0.13,95% CI [‐0.27,0.00];936名受试者,41项研究;中等质量证据);48小时(SMD=‐0.24,95% CI [‐0.42,‐0.07];1047名受试者,45项研究;低质量证据);72小时(SMD=‐0.19,95% CI [‐0.38,‐0.00];657名受试者,28项研究;中等质量证据);而在96小时内差异无几(SMD=‐0.05,95% CI [‐0.29,0.19];436名受试者,17项研究;低质量证据)。当我们为了量化组间的实际差异将量表重新调整为0到10厘米时,我们发现5个随访时间的95% CI均远低于1.4厘米的最小重要差异:6小时内(MD=‐0.52,95% CI [‐0.95,‐0.08]);24小时(MD=‐0.17,95% CI [‐0.42,0.07]);48小时(MD=‐0.41,95% CI [‐0.69,‐0.12]);72小时(MD=‐0.29,95% CI [‐0.59,0.02]);96小时(MD=‐0.03,95% CI [‐0.43,0.37])。因此从肌肉酸痛缓解的效果大小表明,补充抗氧化剂后极不可能达到临床实践中的有意义或重要的差异。我们的亚组分析均没有根据导致DOMS运动的类型(机械运动对比全身有氧运动)或根据资金来源来检查效果的差异,且都没有证实亚组差异。排除交叉试验的敏感性分析表明,纳入这些试验对结果无重要影响。
纳入的50项试验中均未测量主观恢复情况(在没有迹象或症状的情况下恢复以前的活动)。
关于服用抗氧化物补充剂的潜在不良反应的证据非常少,因为只有9项试验(216名受试者)报告了这一结局。从报告不良反应的研究中,9项试验中有2项发现了不良反应。在1项试验中,抗氧化剂组的所有6名受试者都出现了腹泻,其中4名还出现了轻微的消化不良;众所周知,这些都是试验中使用特定抗氧化剂出现的副作用。第2项试验中,26名受试者中有1名受试者出现轻微的胃肠道不适。
作者结论
有中等至低质量的证据表明,大剂量的抗氧化物补充剂并不能使肌肉酸痛在运动后6小时内、运动后24、48、72和96小时,出现临床相关的缓解。目前没有关于主观恢复的有效证据,只有有限的证据表明服用抗氧化物补充剂有不良反应。本综述的结果和信息为研究人员和其他利益相关者提供了一个可考虑的机会,即这个领域未来研究的优先事项和基本原则是什么。
PICO
简语概要
抗氧化剂用于预防与缓解运动后肌肉酸痛
系统综述的背景与目的
进行剧烈运动或不习惯的运动后通常会出现肌肉酸痛。肌肉酸痛在初次运动后的24至72小时内达到高峰。许多人在运动前后服用维生素C和/或维生素E等抗氧化物补充剂或富含抗氧化物的食物(如酸樱桃或石榴汁),以期会预防或缓解运动后的肌肉酸痛。
检索结果
我们检索了截至2017年2月的医学数据库,检索了比较抗氧化物补充剂与对照干预(如安慰剂(没有抗氧化剂的假药或饮料)或没有治疗)的研究。我们发现了50项均比较抗氧化物补充剂与安慰剂的研究。研究共报告了1089名受试者的结果。其中有近十分之九的受试者为男性。受试者的年龄在16至55岁之间,他们的训练状态从久坐到适度训练不等。这些研究在抗氧化物补充剂的类型、剂量以及引起肌肉酸痛的运动类型等方面各不相同。所有研究都使用了超过每日推荐量的抗氧化剂。
主要研究结果
有证据表明,高剂量的抗氧化物补充剂可能在随访的6小时内和24、48和72小时略微缓解肌肉酸痛,但在96小时则不会。然而,由于效果太轻,不太可能产生任何影响。所有试验均未报告与主观恢复有关的结局,如在没有迹象或症状的情况下恢复以前的活动。
只有9项研究报告了不良反应,其中有2项研究发现了不良反应。在1项试验中,抗氧化剂组的所有6名受试者都出现了腹泻,其中4人还出现了轻微的消化不良;众所周知,这些都是试验中使用特定抗氧化剂出现的副作用。第2项试验中,26名受试者中有1名受试者出现轻微的胃肠道不适。
证据质量
我们评价肌肉酸痛的证据质量为“中等”或“低”质量。这主要是因为大多数研究都有可能影响其结果的可靠性的方面,在某些情况下是因为研究结果的差异性。这表明研究结果存在一定的不确定性,进一步的研究可能会提供改变我们结论的证据。
作者结论
补充抗氧化剂似乎不能减轻早期或运动后第1、2、3或4天的肌肉酸痛。
Authors' conclusions
Summary of findings
| Antioxidants compared with placebo or no treatment for preventing and reducing muscle soreness after exercise | ||||||
| Patient or population: mainly physically active individuals1 partaking in exercise2 designed to produce delayed onset muscle soreness Settings: controlled laboratory studies and field‐based studies Intervention: antioxidant supplements3. These fell into 3 main categories: whole natural food source (e.g. bilberry juice, cherry, pomegranate juice); antioxidant extract or mixed antioxidants (e.g. black tea extract, curcumin); and vitamin C or E or both combined. Comparison: all were placebo controls | ||||||
| Outcomes | Illustrative comparative risks (95% CI) | Relative effect (95% CI) | No of participants | Quality of the evidence | Comments | |
| Assumed risk | Corresponding risk | |||||
| Control (placebo or no antioxidants) | Antioxidant supplementation | |||||
| Muscle soreness Follow‐up: immediately up to 6 hours post‐exercise | The mean level of muscle soreness in the control group ranged from 1.0 to 8.3 cm (adjusted to a 0 to 10 cm scale) | The mean level of muscle soreness after antioxidant supplementation was 0.30 standard deviations lower | SMD ‐0.30 (‐0.56 to ‐0.04) | 525 | ⊕⊕⊝⊝ | One 'rule of thumb' is that 0.2 represents a small difference, 0.5 a moderate difference and 0.8 a large difference. Based on this 'rule of thumb', this result equates to a small to moderate difference in favour of antioxidant supplementation. However, when we rescaled the data to a 0 to 10 cm scale, the MD was lower by 0.52 cm (0.95 to 0.08 cm lower). These are all under the typical MID for pain (taken here as 1.4 cm). |
| Muscle soreness Follow‐up: 24 hours | The mean level of muscle soreness in the control group ranged from 0.21 to 8.8 cm (adjusted to a 0 to 10 cm scale) | The mean level of muscle soreness after antioxidant supplementation was 0.13 standard deviations lower | SMD ‐0.13 (‐0.27 to ‐0.00) | 936 | ⊕⊕⊕⊝ | Based on the above 'rule of thumb', this result equates to a small difference in favour of antioxidant supplementation. However, when we rescaled the data to a 0 to 10 cm scale, the MD was lower by 0.17 cm (0.42 lower to 0.07 higher). These are all under the typical MID for pain (taken here as 1.4 cm). |
| Muscle soreness Follow‐up: 48 hours | The mean level of muscle soreness in the control group ranged from 0.32 to 9.56 cm (adjusted to a 0 to 10 cm scale) | The mean level of muscle soreness after antioxidant supplementation was 0.24 standard deviations lower | SMD ‐0.24 (‐0.42 to ‐0.07) | 1047 | ⊕⊕⊝⊝ | Based on the above 'rule of thumb', this result equates to a small difference in favour of antioxidant supplementation. However, when we rescaled the data to a 0 to 10 cm scale, the MD was lower by 0.41 cm (0.69 to 0.12 lower). These are all under the typical MID for pain (taken here as 1.4 cm). |
| Muscle soreness Follow‐up: 72 hours | The mean level of muscle soreness in the control group ranged from 0.5 to 8.5 cm (adjusted to a 0 to 10 cm scale) | The mean level of muscle soreness after antioxidant supplementation was 0.19 standard deviations lower | SMD ‐0.19 (‐0.38 to ‐0.00) | 657 | ⊕⊕⊕⊝ | Based on the above 'rule of thumb', this result equates to a small difference in favour of antioxidant supplementation. When we rescaled the data to a 0 to 10 cm scale, the MD was lower by 0.29 cm (0.59 lower to 0.02 higher). These are all under the typical MID for pain (taken here as 1.4 cm). |
| Muscle soreness Follow‐up: 96 hours | The mean level of muscle soreness in the control group ranged from 0.2 to 5.6 cm (adjusted to a 0 to 10 cm scale) | The mean level of muscle soreness after antioxidant supplementation was 0.05 standard deviations lower | SMD ‐0.05 (‐0.29 to 0.19) | 436 | ⊕⊕⊝⊝ | Based on the above 'rule of thumb', this result equates to a small difference in favour of antioxidant supplementation but also includes a small effect in favour of placebo or no antioxidants. However, when we rescaled the data to a 0 to 10 cm scale, the MD was lower by 0.03 cm (0.43 lower to 0.37 higher). These are all under the typical MID for pain (taken here as 1.4 cm). |
| Subjective recovery | See comment | See comment | — | See comment | — | None of the 50 studies included in this review measured subjective recovery (return to previous activities without signs or symptoms). |
| Adverse events | See comment | See comment | — | See comment 9 studies | ⊕⊝⊝⊝ | Adverse effects were considered in only 9 studies and actual events reported in 2 studies. One study reported that all 6 participants in the antioxidant supplementation group10 had diarrhoea (5 mild, 1 severe); 4 participants also reported mild indigestion. One placebo group participant also had mild indigestion. The second study reported mild gastrointestinal distress in 1 of 26 participants taking the antioxidant supplement. |
| CI: confidence interval; RR: risk ratio; MD: mean difference; MID: minimal important difference; SMD: standardised mean difference | ||||||
| GRADE Working Group grades of evidence | ||||||
| 1Although some participants were sedentary, the majority of participants were recreationally active or moderately trained athletes. No data were included from highly trained elite athletes. Most trial participants were male. 2Muscle damage was induced either mechanically (e.g. resistance‐based exercise) or through whole body aerobic exercise (e.g. running, cycling, bench stepping). 3Typically, supplementation was taken before, the day of and after exercise for up to several days. The supplements were all taken orally, either as capsules, powders or drinks. All studies used an antioxidant dosage higher than the recommended daily amount. 4In this analysis, one study tested two antioxidants compared with placebo control. 5We downgraded the quality of evidence one level for serious study limitations (high/unclear risk of bias) and one level for serious inconsistency. 6We downgraded the quality of evidence one level for serious study limitations (high/unclear risk of bias). 7In this analysis, two studies tested two antioxidants compared with placebo control. 8We downgraded the quality of evidence one level for serious study limitations (high/unclear risk of bias) and one level for serious inconsistency. 9We downgraded the quality of evidence three levels for very serious study limitations, in particular reflecting bias relating failure to record or report on adverse events by the majority of trials. 10Notably the antioxidant used was NAC (N‐acetylcysteine), which is a prescription medicine with antioxidant properties. Listed side effects of NAC include nausea, vomiting and diarrhoea or constipation. | ||||||
Background
Description of the condition
Muscle soreness after exercise is commonly referred to as delayed onset muscle soreness (DOMS) (Cheung 2003). DOMS is common in individuals who engage in strenuous and unaccustomed exercise and physical activity. It is classified as a grade 1 muscle strain injury and is characterised by localised tenderness and soreness (Cheung 2003). DOMS typically peaks between 24 to 72 hours after a bout of exercise but eventually disappears after five to seven days (Armstrong 1984; Bieuzen 2013; Bleakley 2012; Byrnes 1986; Cleak 1992; Costello 2015).
DOMS is particularly associated with exercise involving eccentric muscle action, such as in downhill running. An eccentric action is where a muscle generates tension to control the rate it lengthens (Close 2005), and it can cause significant muscle damage. DOMS could be detrimental for athletes who are returning to training from a prolonged period of inactivity. In addition, DOMS could deter individuals from adhering to an exercise programme. For some individuals, DOMS could result from excessive physical activity associated with daily living, particularly if repeated eccentric movements or unaccustomed physical activity are involved.
Several theories have been proposed to explain the mechanisms underlying DOMS. These include lactate accumulation (Asmussen 1953), inflammation (Smith 1991), muscle spasm (De Vries 1966), muscle damage (Hough 1900), connective tissue damage (Weinstock 1997), and increased muscle temperature (Davies 1972). A common feature of several of these proposed mechanisms is an increased production of free radicals (Maughan 1989), and reactive oxygen species. Indeed, it has been shown that reactive oxygen species are produced in nearly every biological process and that they also play a crucial role as signalling molecules for translating the exercise signals to appropriate adaptations (Margaritelis 2016).
Description of the intervention
Taking dietary antioxidants in the form of supplements (e.g. tablets, capsules, powders) or antioxidant‐enriched foods (e.g. food concentrates) in doses much higher than the recommended amounts (up to 10 times the recommended daily amounts) several days before and after exercise has been proposed as a way to prevent or reduce muscle soreness after exercise. Two sources of antioxidants exist: exogenous (i.e. from dietary sources) and endogenous (i.e. produced by the body) (Watson 2010). Exogenous antioxidants include vitamin C, vitamin E, polyphenols, glutathione, carotenoids and coenzyme Q10. These are typically found in plant sources such as dark‐coloured vegetables, citrus fruits, legumes, nuts, grains, seeds and oils. Endogenous antioxidants include plasma proteins, bilirubin, uric acid and the enzymes superoxide dismutase, glutathione peroxidase and catalase (Watson 2010).
How the intervention might work
It has been reported that although physical activity is beneficial to health, any type of exercise causes oxidative stress, partly due to increased oxygen consumption, and could deplete the body's antioxidant defences and increase the rate of free radical production (Powers 2008; Ramel 2004; Witt 1992). Moreover, unaccustomed, eccentric or exhaustive exercise may also induce inflammatory reactions that can contribute to increased reactive oxygen species production and reduced antioxidant defences (Tsai 2001), causing exercise‐induced muscle damage and resulting in DOMS (Cheung 2003). Dietary antioxidants may counteract oxidative stress by reducing the concentration of free radicals and reactive oxygen species associated with exercise (Powers 2008). Reducing DOMS could be beneficial to athletes when returning to training from injury (i.e. after a period of inactivity), and it could help sedentary and older individuals recover from unaccustomed physical activity.
Why it is important to do this review
The ease of taking antioxidant supplements to prevent and reduce muscle soreness after exercise and enhance recovery makes this an attractive option for physically active individuals. Moreover, antioxidant supplements are available to buy from supermarkets and health food stores and some are marketed to enhance recovery. However, our initial look at the evidence based on a small sample of the trials testing antioxidants for reducing DOMS showed that the evidence to support these claims was mixed (Bryer 2006; Howatson 2010; Mastaloudis 2006). There is conflicting evidence, too, on the potential for adverse effects of taking antioxidant supplements including impairment of post‐exercise adaptations both acutely (Gomez‐Cabrera 2008; Ristow 2009) and chronically (Paulsen 2014). All these pointed to the need for a systematic review of all the available trials.
Objectives
To assess the effects (benefits and harms) of antioxidant supplements and antioxidant‐enriched foods for preventing and reducing the severity and duration of delayed onset muscle soreness following exercise.
Methods
Criteria for considering studies for this review
Types of studies
All randomised controlled trials and quasi‐randomised controlled trials (a method of allocating participants to groups that is not truly random; e.g. allocation by date of birth, day of the week, medical record number) investigating the effects of dietary antioxidants on preventing or reducing delayed onset muscle soreness. Only studies that measured muscle soreness and/or muscle tenderness were included in this study.
Types of participants
People of any age and level of physical or sports activity, performing exercise (i.e. eccentric, high‐intensity, unaccustomed exercise) that is likely to induce DOMS. We included studies that used any type of exercise protocol.
Types of interventions
All forms of antioxidant supplementation including specific antioxidant supplements (i.e. tablets, powders, concentrates) and antioxidant‐enriched foods or diets. No restrictions were placed on timing (pre‐exercise or post‐exercise), frequency, dose or duration, or type of antioxidant supplementation. Interventions that used more than one antioxidant (e.g. a combination of vitamins C and E) were also included.
We set out two comparisons.
-
Antioxidant supplementation versus placebo or no supplementation.
-
High‐dose versus low‐dose, where the low‐dose supplementation is within normal or recommended levels for the antioxidant involved.
Types of outcome measures
Trials that did not record muscle soreness (pain) were not included in the review.
Primary outcomes
-
Muscle soreness (pain) ‐ typically measured by a visual analogue scale (i.e. subjective)
-
Subjective recovery (return to previous activities without signs or symptoms)
-
Adverse effects (e.g. intestinal discomfort, diarrhoea)
Secondary outcomes
-
Muscle tenderness ‐ typically measured using a handheld algometer
-
Performance variables (e.g. vertical jump, speed, agility)
-
Muscle force production (objective measures of muscle strength or power)
-
Range of motion
Timing of outcome measurement
Where appropriate, we extracted outcome data for the following time periods: the day of exercise, and daily up to seven days post‐exercise.
Search methods for identification of studies
Electronic searches
We searched the Cochrane Bone, Joint and Muscle Trauma Group Specialised Register (6 February 2017), the Cochrane Central Register of Controlled Trials (CENTRAL) (2017, Issue 2), MEDLINE (including Epub Ahead of Print, In‐Process & Other Non‐Indexed Citations and Ovid MEDLINE Daily) (1946 to 3 February 2017), Embase (1980 to 2017 Week 5) and SPORTDiscus (1949 to 20 April 2017). We also searched ClinicalTrials.gov and the World Health Organization Clinical Trials Registry Platform for ongoing and recently completed studies (to 6 February 2017).
In MEDLINE, we combined a subject‐specific search with the sensitivity‐maximising version of the Cochrane Highly Sensitive Search Strategy for identifying randomised trials (Lefebvre 2011). The search strategies for MEDLINE, CENTRAL, Embase and SPORTDiscus are shown in Appendix 1.
We applied no language restrictions.
Searching other resources
We contacted experts in the field (identified by the lead authors in published studies) to find unpublished trials. We checked the bibliographies of included studies and relevant reviews for further references to relevant trials.
Data collection and analysis
Selection of studies
Two authors (MR and DR) independently screened the titles, abstracts and descriptors of the studies retrieved from the searches. Studies that appeared meet the inclusion criteria were selected and the above two authors independently reviewed the full‐text articles. Any disagreements about study selection were resolved by consultation with the third and fourth author (HS and JC). If required, we contacted study authors for further information; this, however, did not include contacting authors to check whether DOMS had been measured where not stated in the trial reports.
Data extraction and management
Two authors (MR and DR) independently extracted data using a pre‐piloted data extraction form. We resolved any discrepancies that could not be settled by discussion by consultation with the third and fourth authors (HS and JC). Where necessary, we contacted primary authors of selected studies for additional information and data.
Assessment of risk of bias in included studies
Two authors (MR and DR) independently assessed the risk of bias in the included studies using the guidelines and criteria outlined in the Cochrane Handbook for Systematic Reviews of Interventions (Higgins 2011). We assessed the included studies for selection bias (random sequence generation and allocation concealment), performance bias (blinding of participants and personnel), detection bias (blinding of outcome assessment), attrition bias (incomplete outcome data), reporting bias (selective reporting) and any other sources of bias. We resolved any disagreement by discussion and, where necessary, consultation with the third author and forth author (HS and JC).
Measures of treatment effect
We calculated mean differences with 95% confidence intervals for continuous data. We calculated standardised mean differences and 95% confidence intervals when combining results from studies using different ways of measuring a continuous outcome. Where possible, we used follow‐up scores in preference to change scores. Should dichotomous data have been available, we planned to calculate risk ratios with 95% confidence intervals.
Unit of analysis issues
The unit of randomisation in the included trials was the individual participant. Some trials reported the same outcomes at more than one time point (e.g. soreness measured immediately after exercise, one day post‐exercise, two days post‐exercise, three days post‐exercise and so on). As planned, we extracted and presented data for the above listed time points up to seven days post‐exercise. We consulted a statistician to discuss the appropriate use and processing of data from cross‐over trials that were included in the review. For these, we extracted data at each time point and analysed the data as if a parallel design was employed (Deeks 2011). We judged that there was an adequate washout period in each of the trials.
Dealing with missing data
Where there were missing data for an included study, we contacted the primary study author via email. We ignored data missing at random and focused only on the available data. Where appropriate, we conducted intention‐to‐treat analyses in which all randomised participants are analysed in the groups to which they were originally assigned. While planned, there were insufficient data (often missing denominators) to conduct worst‐case and best‐case scenario sensitivity analyses to examine the potential effects of dropouts and exclusions. We contacted authors for missing mean and standard deviations. Where data were not available in the manuscript and the authors did not respond we extracted data from graphs using Graphclick 2010.
Assessment of heterogeneity
We visually evaluated heterogeneity between comparable trials using forest plots, and the Chi² test and I² statistic, with the level of significance for the Chi² test being set at P = 0.1 (Deeks 2011). Thus, we considered a P value for Chi² of < 0.1 to indicate statistically significant heterogeneity between studies. We interpreted values of I² as follows: 0% to 40% might not be important; 30% to 60% may represent moderate heterogeneity; 50% to 90% may represent substantial heterogeneity; and 75% to 100% may represent considerable heterogeneity.
Assessment of reporting biases
In view of the difficulty of detecting and correcting for publication bias and other reporting biases, we aimed to minimise their potential impact by ensuring a comprehensive search for eligible studies and by being alert for duplication of data. Where there were 10 or more studies in an analysis, we planned to use a funnel plot to explore the possibility of small‐study effects (a tendency for estimates of the intervention effect to be more beneficial in smaller studies). (We restricted these to DOMS at 24 and 48 hours given these were the time periods for which the majority of data were available.)
Data synthesis
If considered appropriate, we pooled the results of comparable groups of trials. Initially we used the fixed‐effect model and 95% confidence intervals but then selected the random‐effects model, again with 95% confidence intervals, because of the substantial clinical and statistically significant heterogeneity.
Subgroup analysis and investigation of heterogeneity
As described in Differences between protocol and review, we modified our list of planned subgroup analyses, which involved the removal of one (antioxidant supplement versus antioxidant‐enriched food) and the merging of two subgroups relating to type of exercise (normal sporting activities versus laboratory‐induced DOMS; exercise that requires high oxygen consumption (e.g. running, cycling) versus exercise that requires low oxygen consumption (e.g. eccentric exercise in one arm). We also added in a subgroup analysis relating to source of funding.
Our revised list of planned subgroup analyses is as follows.
-
Treatment intervention
-
-
Timing of administration (pre‐exercise or post‐exercise)
-
-
Type of exercise
-
-
Mechanically induced damage (e.g. resistance exercise) versus whole body aerobic exercise (e.g. running)
-
-
Funding source
-
-
Trials funded by food company or provider of antioxidant supplements versus those not funded by food company or provider of antioxidant supplements
-
To test whether subgroups were statistically significantly different from one another, we used the test for subgroup differences available in the Review Manager 5 software (RevMan 2014).
Sensitivity analysis
Where sufficient data were available, we performed sensitivity analyses to investigate the effects of various aspects of trial and review methodology. We performed limited sensitivity analyses to explore the effects of inclusion of trials at high or unclear risk of selection bias, principally from lack of or unclear allocation concealment, the effects of including cross‐over trials, and from the choice of model for data synthesis (fixed‐effect compared with random‐effects). We did not conduct our other planned sensitivity analyses to explore the effects of inclusion of trials at high risk of selection bias specifically because of lack of allocation concealment, or for which only abstracts were obtained, or the effects of missing data.
'Summary of findings' table
We prepared a 'Summary of findings' table for the main comparison (antioxidant supplementation versus a placebo intervention) (Schünemann 2011). We summarised the quality of evidence by applying the principles of the GRADE framework and following the recommendations and worksheets of the Cochrane Effective Practice and Organisation of Care Group for creating 'Summary of findings' tables (EPOC 2013). We assessed the quality of the evidence according to four levels (high, moderate, low and very low). We selected muscle soreness up to 6 hours after exercise, 24, 48, 72 and 96 hours; subjective recovery and adverse events for presentation in a 'Summary of findings' table.
Results
Description of studies
Results of the search
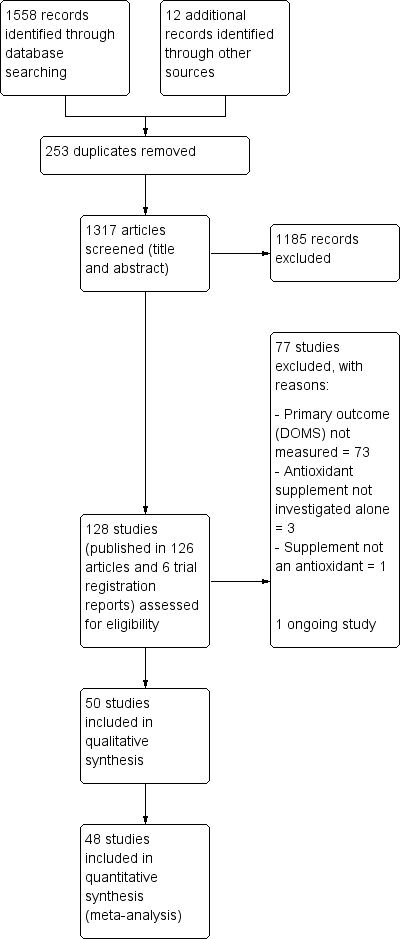
The search was completed in February 2017. We screened a total of 1558 records from the following databases: Cochrane Bone, Joint and Muscle Trauma Group Specialised Register (25 records), CENTRAL (194), MEDLINE (302), Embase (476), SPORTDiscus (117), ClinicalTrials.gov (162) and the WHO International Clinical Trials Registry Platform (282). We also identified 12 potentially eligible studies from ongoing searches and through contacting experts in the field.
The search resulted in the identification of 128 potentially eligible studies, for which we obtained full reports. Upon study selection, we included 50 (seeIncluded studies) and excluded 77 (seeExcluded studies). One study is ongoing (NCT02281981). A flow diagram summarising the study selection process is presented in Figure 1.
Study flow diagram
Included studies
We included 50 studies with a total of 1089 participants of which 48 studies with 1043 participants were included in the quantitative synthesis (meta‐analysis) for muscle soreness. All the studies were reported in English in peer‐reviewed journals, in articles published between 1992 to 2016. Details of the individual studies are provided in Characteristics of included studies.
We contacted the authors of 33 studies to request for raw data for delayed onset muscle soreness (DOMS), maximal voluntary isometric contraction (MVIC), range of motion (ROM) and performance measures. Nineteen authors responded to our request (Bell 2015; Bell 2016; Bloomer 2004; Bloomer 2005; Bloomer 2007; Close 2006; Cobley 2011; Drobnic 2014; He 2015; Howatson 2009; Kaminski 1992; Kerksick 2009; Laupheimer 2014; Nicol 2015; O'Fallon 2012; Tanabe 2015; Thompson 2004; Trombold 2010; Trombold 2011); and 14 did not (Arent 2010; Avery 2003; Beaton 2002a; Bryer 2006; Connolly 2006; Connolly 2006a; Goldfarb 2011; Herrlinger 2015; Krotkiewski 1994; McFarlin 2016; Michailidis 2013; Phillips 2003; Peschek 2014; Su 2008). With the exception of Herrlinger 2015, we successfully extracted data from graphs for the other 13 studies in the second category using GraphClick, Arizona (version 3.0.2, 2010).
The two studies not included in the quantitative analyses for DOMS were Herrlinger 2015 and McCormick 2016. This resulted in the loss of 37 participants for whom DOMS data were missing for Herrlinger 2015 and of nine participants for McCormick 2016. We only included the data for McCormick 2016 in the qualitative analysis because the exercise paradigm was completely different to all the other studies included in this review. The other studies used an exercise paradigm where mechanical or whole body aerobic exercise was used to cause muscle damage and then a range of outcomes such as muscle soreness, muscle function, range of motion and performance were measured at various time points up to several days after exercise. However, participants in McCormick 2016 had a fixed daily training regimen for five continuous days performance, with outcomes being measured at the start and then throughout the trial. Thus the severity of muscle damage caused by the daily training regimen was not controlled.
Design
All 50 studies were randomised controlled trials; no quasi‐randomised controlled trials met the inclusion criteria. Thirty‐eight trials (with a total of 901 participants) employed a parallel design. The other 12 trials (with a total of 188 participants) employed a cross‐over design (Arent 2010; Connolly 2006a; Kaminski 1992; McCormick 2016; McLeay 2012; Michailidis 2013; Nicol 2015; Peschek 2014; Tanabe 2015; Thompson 2001; Trombold 2010; Trombold 2011). The time between intervention arms in the cross‐over trials was five days in Arent 2010; 14 days in Connolly 2006a, Nicol 2015, Thompson 2001, Trombold 2010 and Trombold 2011; 21 days in Kaminski 1992 and Peschek 2014; 28 days in Tanabe 2015; 30 days in McLeay 2012; 35 days in McCormick 2016 and 42 days in Michailidis 2013.
Three studies had three groups: Herrlinger 2015 compared low‐dose phenolic blend (12 participants) versus high‐dose phenolic blend (12 participants) versus placebo (13 participants); Kerksick 2009 compared epigallocatechin gallate supplementation (10 participants) versus N‐acetyl cysteine supplementation (10 participants) versus placebo (10 participants); and Silva 2008 compared N‐acetyl cysteine (nine participants) versus N‐acetyl cysteine plus placebo (eight participants) versus placebo (eight participants).
Sample sizes
The 50 trials included a total of 1089 participants with 901 participants in the parallel‐group trials (range 7 to 54) and 188 participants in the cross‐over trials (range 8 to 24).
Setting
Twenty‐four studies were conducted in the USA (Arent 2010; Avery 2003; Beaton 2002a; Bloomer 2004; Bloomer 2005; Bloomer 2007; Bryer 2006; Connolly 2006; Connolly 2006a; Goldfarb 2011; He 2015; Herrlinger 2015; Hutchinson 2016; Kaminski 1992; Kerksick 2009; Kuehl 2010; McBride 1997; McFarlin 2016; O'Connor 2013; O'Fallon 2012; Peschek 2014; Phillips 2003; Trombold 2010; Trombold 2011); 12 studies were carried out in the UK (Bailey 2011; Bell 2015; Bell 2016; Close 2006; Cobley 2011; Howatson 2009; Laupheimer 2014; Lynn 2015; Thompson 2001; Thompson 2001a; Thompson 2003; Thompson 2004); two studies were conducted in Australia (McCormick 2016; Nicol 2015); two studies in Brazil (Silva 2008; Silva 2010); two studies in China (Nie 2004; Su 2008); two studies in Greece (Michailidis 2013; Theodorou 2011); one study in Iran (Meamarbashi 2011); one study in Ireland (Shafat 2004); one study in Japan (Tanabe 2015); one study in New Zealand (McLeay 2012); one study in Poland (Krotkiewski 1994); and one study in Spain (Drobnic 2014).
Seven trials were designed to produce DOMS under field‐based conditions (Bailey 2011; Cobley 2011; Howatson 2009; Kuehl 2010; Laupheimer 2014; Lynn 2015; McCormick 2016), and the other 43 studies were designed to produce DOMS under laboratory‐based conditions.
Funding source
Details of the funding of individual studies are given in Characteristics of included studies. In all, 21 studies were industry funded either by a food company or a provider of antioxidant supplements (Arent 2010; Bailey 2011; Beaton 2002a; Bell 2015; Bell 2016; Bloomer 2005; Bloomer 2007; Connolly 2006a; Herrlinger 2015; Kerksick 2009; Kuehl 2010; McFarlin 2016; O'Connor 2013; Peschek 2014; Phillips 2003; Tanabe 2015; Thompson 2001; Thompson 2001a; Thompson 2003; Trombold 2010; Trombold 2011). Of the 28 other studies reporting on funding, 15 declared "none" in their report (Avery 2003; Bloomer 2004; Bryer 2006; Close 2006; Cobley 2011; Connolly 2006; Drobnic 2014; Hutchinson 2016; Kaminski 1992; Laupheimer 2014; McBride 1997; Nie 2004; Shafat 2004; Theodorou 2011; Thompson 2004); the other 13 referring to various sources of university and public body research funding sources (Goldfarb 2011; He 2015; Howatson 2009; Krotkiewski 1994; Lynn 2015; McCormick 2016; McLeay 2012; Meamarbashi 2011; Michailidis 2013; Nicol 2015; O'Fallon 2012; Silva 2008; Silva 2010). We were unsuccessful in obtaining information on funding from the only trial that did not report on this (Su 2008).
Participants
Of the 1089 participants, 961 (88.2%) were male and 128 (11.8%) were female. Two studies recruited females only (Bloomer 2004; McLeay 2012). The age range of participants was between 16 (Nie 2004) and 55 years (Laupheimer 2014). The majority of the studies recruited recreationally active or moderately trained participants with the exception of seven studies (Bryer 2006; Kerksick 2009; Meamarbashi 2011; O'Connor 2013; O'Fallon 2012; Phillips 2003; Tanabe 2015), which included a total of 193 sedentary participants. One study had a sample of 16 semi‐professional soccer players (Bell 2016) and one study (Laupheimer 2014) had seven well‐trained distance runners. Only McCormick 2016 had participants (nine in all) who were classed as highly‐trained elite athletes.
Details of exercise
There was a range of different exercise models used to induce muscle damage. Twenty‐eight studies used mechanically induced exercise (i.e. resistance‐based exercise) and 22 studies used whole body aerobic exercise (i.e. running, cycling, bench stepping). The majority of the studies that used mechanically induced exercise employed some form of resistance training protocol using weights or an isokinetic dynamometer to induce delayed onset muscle damage and soreness with large variances on number of repetitions, sets and percentage of load used. One study used a circuit training session where participants rotated round a circuit of cycling and stepping exercises (Krotkiewski 1994). Two studies used a repeated maximal sprint protocol on a cycle ergometer (Arent 2010; Bell 2016), one study used a repeated bench stepping protocol (Meamarbashi 2011), and one study used a repeated squat jump protocol using a weighted jacket (Nie 2004). Sixteen studies used a running model: seven trials used a downhill running protocol on a treadmill (Close 2006; Drobnic 2014; He 2015; Herrlinger 2015Peschek 2014; Su 2008; Thompson 2004); four trials used the 90 minute Loughborough Intermittent Shuttle Running Test (LIST) (Bailey 2011; Thompson 2001; Thompson 2001a; Thompson 2003); one study used the Yo‐Yo IR 1 repeated sprint test (Cobley 2011), and three trials used a competitive running race to induce damage. Howatson 2009 and Laupheimer 2014 used the London marathon, one study used the ultra‐endurance Hood Coast Relay, which is based in the United States (Kuehl 2010), and one study used a half marathon run (Lynn 2015).
The majority of the studies asked the participants to refrain from strenuous exercise, refrain from taking any form of anti‐inflammatory medication or other supplements, and not use any other form of analgesic activity that would reduce or relieve soreness, such as an ice bath or massage, for the duration of the study. Participants were typically excluded if they took any form of supplementation regularly or had any type of chronic inflammatory condition.
Interventions
In all trials, an antioxidant supplement was compared with a placebo. A summary of the antioxidant supplement regimens tested in the individual trials is presented in Table 1.
| Study ID | Antioxidant (type: Ex; Vit; Whole)* | Dose** | Form taken | Regimen | Started: before exercise | Duration |
| Ex: black tea extract; theaflavin | 700 mg/day | Capsule | 4 capsules daily | 9 days | 11 days | |
| Vit: vitamin E | 992 mg (1200 IU)/day | Capsule | Not known (daily) | 21 days | 31 days | |
| Ex: mixed supplement: vitamins C, E, B6, B9, B12 and zinc | 400 mg vitamin C | Capsule | 1 capsule daily | 42 days | 6 weeks | |
| Vit: vitamin E | 1200 IU | Capsule | ? | 30 days | 30 days | |
| Whole: tart cherry | 9.2 mg/mL anthocyanins | Drink | 30 mL twice daily | 3 days | 8 days | |
| Whole: tart cherry | 73.5 mg/L total anthocyanin content | Drink | 30 mL twice daily | 4 days | 7 days | |
| Vit: vitamin C, E and selenium | 268 mg vitamin E 1 g vitamin C 90 µg selenium | Capsule | 3 capsules daily | 14 days | 18 days | |
| Ex: astaxanthin | 4 mg astaxanthin 480 mg lutein | Capsule | 2 capsules daily | 21 days | 25 days | |
| Vit: vitamin C and E | 1000 mg of vitamin C 378 mg vitamin E | Capsule | 2 capsules daily | 14 days | 14 days | |
| Vit: vitamin C | 3 g/day vitamin C | Capsule | 3 capsules daily | 14 days | 18 days | |
| Vit: vitamin C | 1 g/day vitamin C | ? | ? | 0 days (day of exercise) | 14 days | |
| Ex: N‐acetyl‐cysteine | 50 mg/kg/day | Powder dissolved in water | 50 mg/kg/day once daily dissolved in 500 mL water | 1 hour | 6 days | |
| Vit: vitamin C | 1 g/day vitamin C | Capsule | 3 capsules daily | 3 days | 8 days | |
| Whole: cherry | 600 mg phenolic compounds 40 mg anthocyanins | Drink | 2 x 12 oz bottle daily | 4 days | 8 days | |
| Ex: curcumin | 400 mg/day curcumin | Capsule | 2 capsules daily | 2 days | 5 days | |
| Ex: Juice Plus powder | 7.5 mg beta‐carotene 276 mg vitamin C | Capsule | 6 capsules daily | 4 days | 8 days | |
| Vit: vitamin C and vitamin E | 100 mg of vitamin C 268 mg (400 IU) of vitamin E | Capsule | ? | 14 days | 17 days | |
| Ex: black and green tea | High‐dose = 2000 mg per Low‐dose = 1000 mg per day polyphenolic blend | Capsule | 4 capsules daily | 91 days | 91 days | |
| Whole: cherry | 600 mg phenolic compounds expressed as gallic acid equivalents, 32 g of carbohydrate and at least 40 mg of anthocyanins | Drink | 2 x 8 fl oz bottles per day | 5 days | 7 days | |
| Whole: blackcurrant nectar | 193.25 mg/day of malvidin glucosides 175.69 mg/day of cyanidin glucosides | Drink | 16 oz bottle per day | 8 days | 8 days | |
| Vit: vitamin C | 1 g/day vitamin C | Capsule | 3 capsules daily | 3 days | 10 days | |
| Ex: N‐acetyl‐cysteine and epigallocatechin gallate (EGCG) | 1800 mg/day N‐acetyl‐cysteine (NAC) 1800 mg/day epigallocatechin gallate (EGCG) | Drink | ? | 14 days | 14 days | |
| Ex: pollen extract | 30,000 units per gram of Polbax | ? | ? | 28 days | 28 days | |
| Whole: cherry | 600 mg phenolic compounds 40 mg anthocyanins | Drink | 2 x 335 mL bottles daily | 7 days | 15 days | |
| Ex: resveratrol | 600 mg/day of resveratrol | Capsules | 6 capsules daily | 7 days | 9 days | |
| Whole: bilberry juice | Total phenol content per 200 mL serving was 744.14 ± 81.75 mg (n = 3) and 80.04 ± 3.51 mg (n = 3) of total anthocyanins | Drink | 2 x 200 mL daily | 5 days | 8 days | |
| Vit: vitamin E | 992 mg/day of vitamin E (1200 IU) | Capsules | 1 capsule daily | 14 days | 14 days | |
| Whole: cherry | 9.117 mg/mL anthocyanins | Drink | 90 mL daily (2 x 30 mL) | 6 days | 6 days | |
| Ex: curcumin | 400 mg/day curcumin | Capsules | Capsules | 2 days | 6 days | |
| Whole: blueberry smoothie | Per 100 mL: total phenolics 168 mg/gallic acid equ.; anthocyanins 96.6 mg; phenolic acid 26 mg, | Drink | 200 g blueberries, 50 g banana + 200 mL apple juice daily | 0 days (day of exercise) | 4 days | |
| Ex: purslane extract | 1200 mg/day purslane extract | Capsules | 2 capsules daily | 3 days | 5 days | |
| Vit: N‐acetyl‐cysteine | 20 mg/kg/day N‐acetyl‐cysteine | Drink | 3 x 500 mL drink daily | 0 days (day of exercise) | 9 days | |
| Ex: curcumin | 2.5 g/day of curcumin | Capsules | 10 capsules daily (2 x 5 capsules) | 2.5 days | 5 days | |
| Vit: vitamin C | 800 mg/day vitamin C | Capsules | ? | 3 hours | 2 days | |
| Whole: grape juice | 1.75 mg/kg resveratrol 19.7 mg/kg catechin 12.6 mg/kg 31.7 mg/kg peonidin 125 mg/kg cyanidin 145.2 mg/kg 32.6 mg/kg quercetin 5.6 mg/kg kaempferol 6.8 mg/kg isorhamnetin | Drink (dissolved powder) | 1 serving of powder daily mixed with 236 mL of water | 45 days | 50 days | |
| Ex: quercetin | 1000 mg/day quercetin | Bar | 2 bars daily | 7 days | 7 days | |
| Whole: cocoa | 350 mg/day flavanols | Drink | 240 mL daily | 0 days (day of exercise) | 3 days | |
| Ex: mixed antioxidants | 300 mg/day tocopherols 800 mg/day docosahexaenoate 300 mg/day flavonoids of which was 100 mg hesperetin and 200 mg quercetin | Capsules | Vitamin E: 1 capsule; docosahexaenoate: 3 capsules; flavonoids: 3 capsules | 14 days | 14 days | |
| Vit: vitamin C + vitamin E | 500 mg/day vitamin C 992 mg/day (1200 IU/day) vitamin E | Capsules | ? | ? | 37 days | |
| Ex: N‐acetyl‐cysteine | 10 mg/kg/day of body mass N‐acetyl‐cysteine | Capsules | 1 capsule daily | 14 days | 21 days | |
| Vit: vitamin E | 536 mg/day (800 IU/day) vitamin E | Capsules | 1 capsule daily | 14 days | 21 days | |
| Ex: allicin | 80 mg/day allicin | Capsules | Capsules | 14 days | 16 days | |
| Ex: curcumin | 150 mg/day curcumin | Capsules | 6 capsules daily | 0 days (day of exercise; 1 hour before) | 1 day | |
| Vit: vitamin C + vitamin E | 1 g/day vitamin C 268 mg/day (1200 IU/day) vitamin E | Capsules | 1 capsule daily | 28 days | 77 days | |
| Vit: vitamin C | 1 g/day vitamin C | Drink | ? | 0 days (day of exercise; 2 hours before) | 1 day | |
| Vit: vitamin C | 1 g/day of vitamin C on day 1 followed by 400 mg/day divided into 2 doses for 12 days | Drink and capsules | 1 g given in a solution followed by 400 mg/day doses in capsules | 14 days | 14 days | |
| Vit: vitamin C | 200 mg/day vitamin C | Drink | Daily drink | 0 days (day of exercise) | 3 days | |
| Vit: vitamin C | 200 mg/day vitamin C | Drink | Daily drink | 14 days | 14 days | |
| Whole: pomegranate juice | 650 mg/day polyphenols, consisting of 95.5% ellagitannins, 3.5% ellagic acid and 1% anthocyanins | Drink | 960 mL per day (as 2 x 480 mL drinks) | 9 days | 32 days | |
| Whole: pomegranate juice | 3958 mg/L of tannins 768 mg/L anthocyanins 242 mg/L of ellagic derivatives | Drink | 500 mL per day (as 2 x 250 mL drinks) | 15 days | 44 days |
* Types: Extract, mixed or other (e.g. amino‐acid derivative) antioxidants; Vitamin; and Whole natural food source.
** Every study included in this review used a dose higher than the recommended daily amount.
In all, 13 trials used antioxidants from a whole natural food source (Bell 2015; Bell 2016; Connolly 2006a; Howatson 2009; Hutchinson 2016; Kuehl 2010; Lynn 2015; McCormick 2016; McLeay 2012; O'Connor 2013; Peschek 2014; Trombold 2010; Trombold 2011), 19 used an antioxidant extract or mixed antioxidants (Arent 2010; Bailey 2011; Bloomer 2005; Cobley 2011; Drobnic 2014; Goldfarb 2011; Herrlinger 2015; Kerksick 2009; Krotkiewski 1994; Laupheimer 2014; McFarlin 2016; Meamarbashi 2011; Michailidis 2013; Nicol 2015; O'Fallon 2012; Phillips 2003; Silva 2008; Su 2008; Tanabe 2015), and 18 provided either vitamin C or vitamin E or both together (Avery 2003; Beaton 2002a; Bloomer 2004; Bloomer 2007; Bryer 2006; Close 2006; Connolly 2006; He 2015; Kaminski 1992; McBride 1997; Nie 2004; Shafat 2004; Silva 2010; Theodorou 2011; Thompson 2001; Thompson 2001a; Thompson 2003; Thompson 2004). All studies used a placebo either as a powder, capsule or drink; however, three studies did not provide details of what the placebo comprised (Arent 2010; McBride 1997; Nie 2004).
No trials compared high‐dose versus low‐dose antioxidant supplements, where the low‐dose supplementation is within normal or recommended levels for the antioxidant involved.
Antioxidants used
Whole foods tested were:
-
Bilberry juice (n = 19) (Lynn 2015)
-
Blackcurrant nectar (n = 16) (Hutchinson 2016)
-
Blueberry smoothie (n =10) (McLeay 2012)
-
Cherry (n = 127) (Bell 2015, n = 16; Bell 2016, n = 16; Connolly 2006a, n = 16; Howatson 2009, n = 16; Kuehl 2010, n = 54; McCormick 2016, n = 9)
-
Cocoa (n = 8) (Peschek 2014)
-
Mixed grape drink (n = 40) (O'Connor 2013)
-
Pomegranate juice (n = 33) (Trombold 2010, n = 16; Trombold 2011, n = 17)
Antioxidant extract or mixed or other antioxidants tested were:
-
Allicin (n = 16) (Su 2008)
-
Astaxanthin extract (n = 20) (Bloomer 2005)
-
Black tea extract (n = 18) (Arent 2010)
-
Curcumin (n = 79) (Drobnic 2014, n = 20; McFarlin 2016, n = 28; Nicol 2015, n = 17; Tanabe 2015, n = 14)
-
Fruit and vegetable powder (Juice Plus) (N = 44) (Goldfarb 2011)
-
Green and black tea extract (n = 37) (Herrlinger 2015)
-
Mixed antioxidants (vitamin C, E, B6, B9, B12 and zinc) (n = 38) (Bailey 2011)
-
Mixed flavanoid antioxidants (N = 40) (Phillips 2003)
-
N‐acetylcysteine (NAC) with epigallocatechin gallate (EGCG) (n = 30) (Kerksick 2009)
-
N‐acetylcysteine (NAC) (n = 53) (Cobley 2011, n = 14; Michailidis 2013, n = 10; Silva 2008, n = 29)
-
Pollen extract (n = 50) (Krotkiewski 1994)
-
Purslane extract (n = 20) (Meamarbashi 2011)
-
Quercetin (n = 30) (O'Fallon 2012)
-
Resveratrol (n = 7) (Laupheimer 2014)
Vitamin C or E or both combined were:
-
Vitamin C (n = 158) (Bryer 2006, n = 18; Close 2006, n = 20; Connolly 2006, n = 24; Kaminski 1992, n = 25; Nie 2004, n = 16; Thompson 2001, n = 9; Thompson 2001a, n = 16; Thompson 2003, n = 16; Thompson 2004, n = 14)
-
Vitamin C and E co‐ingestion (n = 134) (Beaton 2002a, n = 18; Bloomer 2004, n = 18; Bloomer 2007, n = 36; He 2015, n = 22; Shafat 2004, n = 12; Theodorou 2011, n = 28)
-
Vitamin E (n = 57) (Avery 2003, n =18; McBride 1997, n = 12; Silva 2010, n = 27)
There was a large variation across the studies regarding the duration of supplementation: the shortest period was under one day (Tanabe 2015; Thompson 2001) and the longest period was 91 days (Herrlinger 2015). Although the form of supplement was varied, including capsules, powders and drinks, every study used an antioxidant dosage higher than the recommended daily amount. Every study required the participant to ingest the supplement orally either once daily or up to three times per day.
Supplementation was taken before, the day of and after exercise for up to several days in all the studies except for three studies where supplements were post‐exercise only (Michailidis 2013; Peschek 2014; Thompson 2003).
Outcomes
Primary outcomes
Muscle pain
All 50 trials included muscle soreness as an outcome measure, the recording of which was an inclusion criterion of this review. Details of the measurement of muscle soreness in the individual trials are presented in Table 2.
| Study ID | Outcome measure | Score (higher = worse) | Timing post‐exercise | Data extraction |
| Muscle soreness during a squat | VAS (0 to 10 cm) | 24, 48 hours | Text (SDs from SEs) | |
| Muscle soreness during shoulder abduction, shoulder horizontal adduction and hip flexion (unloaded squat) | VAS (0 to 10 cm) | 24, 48, 72 hours | Text | |
| General soreness at the quadriceps | VAS (1 to 10 cm) | 24, 48 hours | Text | |
| General soreness at the quadriceps | VAS (0 to 10 cm) | 48 hours | Text | |
| Muscle soreness during a squat | VAS (0 to 200 mm) | 24, 48, 72 hours | Raw data provided by the authors | |
| Muscle soreness during a squat | VAS (0 to 200 mm) | 24, 48, 72 hours | Raw data provided by the authors | |
| Active movement of elbow flexion or extension, as well as following light palpitation by the investigators | VAS (0 to 10 cm) | 0, 2, 6, 24, 48, 72, 96 hours | Raw data provided by the authors | |
| Dominant leg during knee extension | VAS (0 to 10 cm) | 0, 10, 24, 48, 72, 96 hours | Raw data provided by the authors Immediate pain data used for the up to 6 hours analysis | |
| Performance of 2 (concentric‐eccentric) repetitions of the barbell bench press exercise using a standard 20 kg barbell | VAS (0 to 10 cm) | 0, 24, 48 hours | Raw data provided by the authors | |
| Delayed onset muscle soreness was assessed in a rested position and in response to palpation on the muscle of the arms | VAS (1 to 10 cm) | 0, 4, 24, 48, 72, 96 hours | Text (SDs from SEs) Immediate pain data used for the up to 6 hours analysis | |
| Delayed onset muscle soreness was measured at the gastrocnemius, anterior tibialis, hamstrings, quadriceps, gluteals (both sides) and lower back muscles | VAS (0 to 10 cm) | 0, 24, 48, 72, 96, 168, 336 hours | Raw data provided by the authors Immediate pain data used for the up to 6 hours analysis | |
| Total muscle soreness after performing a 90 degree squat | VAS (0 to 12 cm) | 0, 24, 48, 50, 72, 96, 98 hours | Raw data provided by the authors Immediate pain data used for the up to 6 hours analysis | |
| General delayed onset muscle soreness assessed at the quadriceps | VAS (0 to 10 cm) | 24, 48, 72, 96 hours | Text | |
| Pain scores were obtained by asking participants to verbally rate their overall discomfort during active elbow flexion and extension | VAS (0 to 10 cm) | 24, 48, 72, 96 hours | Text (SDs from SEs) | |
| Muscle soreness during descending and climbing stairs. The following 8 sites were measured: anterior right thigh, posterior right thigh, anterior right leg, posterior right leg, anterior left thigh, posterior left thigh, anterior left leg, posterior left leg and added together for a total score. | VAS (0 to 4) | 48 hours | Raw data provided by the authors | |
| Delayed onset muscle soreness was measured at the elbow flexor with the arm rested | VAS (1 to 10 cm) | 0, 2, 6, 24, 48, 72 hours | Text (SDs from SEs) Immediate pain data used for the up to 6 hours analysis | |
| Delayed onset muscle soreness of the quadriceps, hamstrings, gluteus, gastrocnemius and tibialis anterior | VAS (0 to 6) | 0, 24, 48, 72 hours | Raw data provided by the authors Immediate pain data used for the up to 6 hours analysis | |
| Soreness was assessed in a variety of muscle groups including the gastrocnemius, hamstrings, quadriceps, gluteus maximus, lower back, abdominals and the whole body | Likert (0 to 7) | 24, 48, 72, 96 hours | The authors of Herrlinger 2015 were contacted on 2 February 2017 and again on 18February 2017 for missing data as these were not available in the manuscript and could not be extracted from graphs. No response was received and this study was therefore included in the qualitative analysis but not the quantitative analysis. | |
| Squat down to 90 degrees (internal joint angle) rise to the start position | VAS (0 to 200 mm) | 0, 24, 48 hours | Text Immediate pain data used for the up to 6 hours analysis | |
| Full range squat with no external weight | VAS (0 to 10 cm) | 24, 48, 72 hours | Text (SDs from SEs) | |
| General delayed onset muscle soreness was monitored by self‐reporting | VAS (1 to 10 cm) | 0, 10, 24, 48, 58, 72, 96 hours | Raw data provided by the authors Immediate pain data used for the up to 6 hours analysis | |
| Delayed onset muscle soreness was assessed at the quadriceps | VAS (0 to 10 cm) | 6, 24, 48 hours | Raw data provided by the authors 6 hours post‐exercise data used for the up to 6 hours analysis | |
| General soreness | VAS (0 to 10 cm) | 24, 48, 72, 96, 120 hours | Text (SDs from SEs) | |
| General soreness in the legs | VAS (0 to 100 mm) | 0 hours | Text Immediate pain data used for the up to 6 hours analysis | |
| General soreness in both legs | VAS (0 to 10 cm) | 24 hours | Raw data provided by the authors | |
| Squat to a 90 angle and returning to a standing position | VAS (0 to 200 mm) | 0, 24, 48 hours | Text Immediate pain data used for the up to 6 hours analysis | |
| General soreness | VAS (0 to 10 cm) | 24, 48 hours | Text (SDs from SEs) | |
| Upper body, upper legs, lower legs and overall body | VAS (0 to 10 cm) | 24, 48, 72, 96, 120, 144 hours | This study was only included in the qualitative analysis because the exercise paradigm was completely different to all the other studies included in this review | |
| Muscle soreness measured using a gauge. Pressure was applied using standard force (20 to 30 N) over the distal, middle and proximal thigh in a seated position with the knee fully extended and relaxed. The 3 ratings for each quadricep were added together. | VAS (0 to 10 cm) | 24, 48, 72, 96 hours | Text (SDs from SEs) | |
| Step up (concentric muscle action) onto a 40 cm box then step down (eccentric muscular contraction) and the soreness was rated | VAS (0 to 10 cm) | 24, 48, 72 hours | Text | |
| Participants were requested to rate the general discomfort in only the quadriceps and calf regions of the right leg | VAS (0 to 6) | 0, 24, 48 hours | Text Immediate pain data used for the up to 6 hours analysis | |
| Palpation of the muscle belly and the distal region of the vastus medialis, vastus lateralis and rectus femoris after a squat | VAS (1 to 10 cm) | 0, 2, 24, 48, 72, 96, 120, 144, 168 hours | Text Immediate pain data used for the up to 6 hours analysis | |
| Pain was rated for single leg squat, walking downstairs, passive strength of the gluteals and single leg vertical jump | VAS (0 to 10 cm) | 0, 24, 48 hours | Raw data provided by the authors Immediate pain data used for the up to 6 hours analysis | |
| Perceived soreness was done during quadriceps extension | VAS (0 to 10 cm) | 0, 24, 48 hours | Text Immediate pain data used for the up to 6 hours analysis | |
| Delayed onset muscle soreness in the arm was rated in response to isometric strength measurement | VAS (0 to 100 mm) | 24, 48 hours | Text | |
| Delayed onset muscle soreness at the elbow flexor | VAS (0 to 100 mm) | 24, 48, 72, 96, 120 hours | Raw data provided by the authors | |
| Delayed onset muscle soreness at the legs | VAS (0 to 10 cm) | 24, 48 hours | Text | |
| Soreness measures were subjectively evaluated through palpitation for oedema at he elbow | VAS (0 to 10 cm) | 72, 168 hours | Text (SDs from SEs) | |
| Delayed onset muscle soreness was evaluated using a questionnaire employing a visual analogue scale for a total of 8 sites (6 sites on the anterior muscle of the upper leg and 2 sites on the posterior muscles of the upper leg). The participants were asked to palpate the relaxed muscle and rate soreness. | VAS (1 to 10 cm) (x 8): 8 to 80 score | 24, 48 hours | Text | |
| Delayed onset muscle soreness at the elbow flexor | VAS (0 to 10 cm) | 48, 96, 168 hours | Text | |
| Muscle soreness of the biceps muscle was assessed | VAS (0 to 10 cm) | 48, 96, 168 hours | Text (SDs from SEs) | |
| At the beginning of the exercise test, participants were instructed to give CR‐10 values | Borg CR (0‐10) | 0, 24, 48 hours | Text (SDs from SEs) Immediate pain data used for the up to 6 hours analysis | |
| Palpitation of the upper arm and passively extending the elbow joint | VAS (0 to 100 mm) | 0, 24. 48, 72, 96 hours | Raw data provided by the authors Immediate pain data used for the up to 6 hours analysis | |
| Squat using body weight | VAS (0 to 10 cm) | 24, 48, 72, 96, 120 hours | Text | |
| Actively contracted the quadriceps | VAS (1 to 10 cm) | 24, 48, 72 hours | Text (SDs from SEs); there are no decimal places; where SE = 0, we have put this as 0.4 (SD = 1.2) | |
| Actively contracted the quadriceps | VAS (0 to 100 mm) | 24, 48, 72 hours | Text (SDs from SEs) | |
| Actively contracted the quadriceps | VAS (1 to 10 cm) | 24, 48, 72 hours | Text (SDs from SEs); there are no decimal places; where SE = 0, we have put this as 0.4 (SD = 1.1313) | |
| Actively contracting the leg extensors against resistance equivalent to 75% of each individual's 1 repetition maximum | VAS (0 to 10 cm) | 24, 48, 72 hours | Raw data provided by the authors | |
| Unloaded elbow flexion of the tested arm | VAS (0 to 10 cm) | 2, 24, 48, 72, 96 hours | Raw data provided by the authors 2 hours post‐exercise data used for the up to 6 hours analysis | |
| Unloaded elbow flexion and knee extension on the tested arm and leg | VAS (0 to 10 cm) | 2, 24, 48, 72, 96 hours | Raw data provided by the authors 2 hours post‐exercise data used for the up to 6 hours analysis |
SD: standard deviation
SE: standard error
VAS: visual analogue scale
Thirty‐three trials measured muscle soreness using a 0 to 10 cm (or 0 to 100 mm) visual analogue scale (VAS). Of the 17 other trials, seven measured soreness using a 1 to 10 cm scale (Bailey 2011; Bryer 2006; Goldfarb 2011; Kaminski 1992; Michailidis 2013;Thompson 2001; Thompson 2003); four trials used the 0 to 20 cm (or 0 to 200 mm) scale (Bell 2015; Bell 2016; Howatson 2009; Lynn 2015); two studies (He 2015; Meamarbashi 2011) used a 0‐ to 6‐point scale, Herrlinger 2015 used a 0 to 7 Likert scale, Drobnic 2014 used a 0‐ to 4‐point scale; Cobley 2011 used a 0 to 12 cm scale and Su 2008 used the Borg CR‐10 scale (Borg 1998). The Borg CR‐10 scale ranges from 0 (no soreness) to 10 (maximal soreness). In the included studies, participants were asked to rate a muscle soreness on the soreness scales by either carrying out a squat using body weight, self palpitation of muscle or based on muscle soreness at rest.
There was considerable variation on the timing of the soreness measurement after the damaging exercise occurred. Whilst all the trials measured soreness at baseline, 18 studies measured muscle soreness immediately after exercise, two studies measured soreness two hours after exercise (Trombold 2010; Trombold 2011), and one study measured soreness six hours after exercise (Kerksick 2009). Due to this variation, we grouped these studies into the 'up to 6 hours post‐exercise' category. In addition to measuring soreness immediately after exercise, a few trials also measured soreness 2, 4, 6 or 10 hours post‐exercise although the earliest follow‐up time point to immediately post‐exercise was used. Forty‐one trials measured muscle soreness at 24 hours, 45 trials at 48 hours, 28 trials at 72 hours and 17 trials at 96 hours post‐exercise. Only six trials measured muscle soreness subsequently: four trials measured soreness at 120 hours post‐exercise (Krotkiewski 1994; Michailidis 2013; O'Fallon 2012; Theodorou 2011), one study at 144 hours (Michailidis 2013), and three studies at 168 hours after exercise (Michailidis 2013; Phillips 2003; Silva 2008).
Subjective recovery
None of the 50 included trials measured the primary outcome of subjective recovery.
Adverse effects
Only nine studies reported information on adverse effects, seven of which reported no adverse effects of antioxidant supplementation (Kerksick 2009; Laupheimer 2014; Lynn 2015; McLeay 2012; Michailidis 2013; O'Connor 2013; Phillips 2003), and two which reported specific adverse effects (Cobley 2011; Kuehl 2010). The remaining 41 studies failed to report adverse effects.
Secondary outcomes
Muscle tenderness
Muscle tenderness (or pressure pain threshold, PPT) was measured in four trials using a handheld algometer where the cylindrical metal probe was placed on the belly of the muscle and the investigator applied pressure gradually to the point where the participant felt discomfort (Close 2006; Connolly 2006; Connolly 2006a; Peschek 2014).
Performance variables
Performance variables were measured in five trials: Arent 2010 used the 30‐second Wingate to measure power output in Watts per kg of body weight (W/kg); Bell 2015 measured cycling efficiency; Bell 2016 used a battery of tests including the 20 m sprint, 505 Agility test and counter‐movement jump; Cobley 2011 used the 20 m sprint and Yo‐Yo test; and O'Connor 2013 examined the effects of antioxidant supplementation on maximal oxygen consumption.
Muscle force
Muscle force production was measured in 30 trials using a dynamometer or an isokinetic dynamometer in the muscle where damage was caused (Bailey 2011; Beaton 2002a; Bell 2015; Bell 2016; Bloomer 2004; Bloomer 2005; Bloomer 2007; Bryer 2006; Close 2006; Cobley 2011; Connolly 2006; Connolly 2006a; Goldfarb 2011; Herrlinger 2015; Howatson 2009; Kerksick 2009; McLeay 2012; Meamarbashi 2011; Michailidis 2013; O'Connor 2013; O'Fallon 2012; Peschek 2014; Shafat 2004; Tanabe 2015; Theodorou 2011; Thompson 2001; Thompson 2001a; Thompson 2003; Trombold 2010; Trombold 2011). The main variable measured in these trials was peak isometric force.
Range of motion
Range of motion was assessed in 13 trials using a goniometer and units were reported in degrees (Bailey 2011; Beaton 2002a; Bloomer 2004; Bryer 2006; Connolly 2006; Goldfarb 2011; Howatson 2009; McLeay 2012; Meamarbashi 2011; O'Connor 2013; O'Fallon 2012; Tanabe 2015; Theodorou 2011). Flexion range was determined either in the elbow or the knee by using universal landmarks to ensure consistency on subsequent measures.
Excluded studies
We excluded 77 studies, 73 because delayed onset muscle soreness was not measured (Characteristics of excluded studies). One study was excluded because the supplement used is not classed as an antioxidant (Kingsley 2006). We excluded one study because the antioxidant supplement was co‐ingested with a fish oil supplement and therefore the effect of antioxidant‐only supplementation was not examined (Lenn 2002). We excluded one study because the antioxidant was combined with a protein supplement (Romano‐Ely 2006), and we excluded one study because antioxidants were combined with ibuprofen, cold water immersion and whey protein at the same time (Al‐Nawaiseh 2016).
Studies awaiting classification
There are no studies awaiting classification.
Ongoing trials
Details of one ongoing trial testing curcumin supplementation are available in the Characteristics of ongoing studies table (NCT02281981).
Risk of bias in included studies
Details of the 'Risk of bias' assessment, including methods of randomisation, for individual trials are provided in Characteristics of included studies and the assessments are summarised in Figure 2 and Figure 3.

'Risk of bias' summary: review authors' judgements about each risk of bias item for each included study.

'Risk of bias' graph: review authors' judgements about each risk of bias item presented as percentages across all included studies
Allocation
Random sequence generation
We judged 30 studies, all of which gave details of random sequence generation, at low risk of bias. We rated 15 studies at unclear risk of bias because they did not specify how the random sequence was generated and attempts obtain clarification from authors were unsuccessful. Clarification received from the authors of Tanabe 2015 did not confirm effective random sequence generation and so we judged this at unclear risk of bias too.
Four studies were at high risk of bias (Howatson 2009; Kerksick 2009; Su 2008; Theodorou 2011). Howatson 2009 matched on sex and predicted finishing time. Participants were matched in clusters according to age and body weight for assignment in Kerksick 2009. Su 2008 randomly assigned participants into an allicin or control group according to sex and sports participation and in Theodorou 2011, participants were allocated based on age, body mass index (BMI) and maximum isometric torque into equal groups then a computer generator was used for the assignment into groups.
Concealment of treatment allocation
We deemed that 20 studies had a low risk of bias because allocation concealment was very likely (Bailey 2011; Bell 2015; Bell 2016; Bloomer 2004; Bloomer 2005; Bloomer 2007; Close 2006; Cobley 2011; He 2015; Herrlinger 2015; Kerksick 2009; Laupheimer 2014; McCormick 2016; Meamarbashi 2011; Nicol 2015; O'Connor 2013; Peschek 2014; Silva 2008; Silva 2010; Theodorou 2011). We rated 23 studies at unclear risk as there were no details specified in the manuscripts and authors did not respond to our request for clarification. The authors of a further six studies responded to our query but their response was unclear thus they were assessed also at unclear risk of bias (Drobnic 2014; Howatson 2009; Lynn 2015; Nie 2004; Shafat 2004; Tanabe 2015). We considered McLeay 2012 at high risk of bias because safeguards to ensure allocation concealment were absent and the treatment for the second stage of this cross‐over trial would have been predictable.
Blinding
Overall, 36 studies were double‐blind or blinding was reported and therefore we assessed them at low risk of performance and detection bias.
We assessed eight studies at high risk of performance bias because of the lack of blinding of personnel (Drobnic 2014; Howatson 2009; Lynn 2015; McLeay 2012; Peschek 2014; Shafat 2004; Silva 2008; Tanabe 2015). We rated five studies at unclear risk of performance bias as there were no details specified in the trial reports and the authors did not respond to our request for clarification (Bryer 2006; Connolly 2006a; Herrlinger 2015; McBride 1997; Su 2008). We assessed only one study at high risk of detection bias, with a clear possibility of a lack of participant blinding (McLeay 2012). Of the nine six studies assessed at unclear risk of detection bias, six provided no details of whether there was blinding (Bryer 2006; Connolly 2006a; Herrlinger 2015; McBride 1997; Su 2008; Tanabe 2015), and there were reasons for some doubts about whether blinding was assured in three others (Drobnic 2014; Lynn 2015; Shafat 2004).
Incomplete outcome data
We judged 38 studies at low risk of attrition bias. We assessed one study at unclear risk of attrition bias since there were no details on participant flow and the authors did not reply to our request for data (Krotkiewski 1994). We rated 11 studies at high risk of attrition bias as dropouts ranged between 12.5% to 50% either overall or in a trial arm (Arent 2010; Bloomer 2007; Connolly 2006a; Hutchinson 2016; Kaminski 1992; Lynn 2015; McFarlin 2016; Michailidis 2013; Phillips 2003; Silva 2008; Silva 2010). In Arent 2010, out of the six participants who dropped out, five withdrew of their own volition due to the inability to tolerate the physical demands of the testing protocol. Six participants did not complete all aspects of the study for personal reasons in Bloomer 2007. Two participants withdrew from another cross‐over study for personal reasons (Connolly 2006a). In Hutchinson 2016, eight participants withdrew due to illness and injury unrelated to the study protocol. In Kaminski 1992, six participants withdrew for a variety of reasons (loss of capsule integrity, failure to properly maintain records, non‐compliance with the experimental protocol), and one was removed for failure to develop DOMS in either stage of the cross‐over trial. In Lynn 2015, data were missing from two participants of the intervention group; however, as this was a cross‐over trial, attrition was balanced across groups. McFarlin 2016 had a 30% attrition/non‐compliance rate, probably with an uneven dropout rate between the two groups. One cross‐over study stated in a published protocol that 20 individuals were enrolled and 12 completed although the manuscript stated that 10 males completed the study (Michailidis 2013). Phillips 2003 excluded five participants due to complications with blood‐drawing procedures; however, it is unclear which group they were from. Four participants withdrew from Silva 2008 and six participants from Silva 2010 for personal reasons not associated with the exercise or the supplementation; it was not specified to which group the loses applied in either study.
Selective reporting
Three studies were registered with ClinicalTrials.gov and as all the outcomes were reported in the published studies we initially judged these at low risk of selective reporting (Kuehl 2010; Michailidis 2013; Theodorou 2011). However, Theodorou 2011 did not record adverse effects and we thus judged it at unclear risk of bias. We also judged all nine studies that reported on adverse effects from antioxidant supplementation, as well as fully reporting outcomes listed in their methods sections, at low risk of selective reporting bias (Cobley 2011; Kerksick 2009; Kuehl 2010; Laupheimer 2014; Lynn 2015; McLeay 2012; Michailidis 2013; O'Connor 2013; Phillips 2003). We rated the remaining 40 studies at high risk of selective reporting. As well as the lack of reporting of adverse effects, this reflected the lack of response from the authors of 16 studies to requests for mean and standard deviation data. Three studies rated at high risk of selective reporting bias because of other deficiencies in reporting were Bell 2015, Bell 2016 and Thompson 2003: the first two studies did not report muscle soreness data immediately post‐exercise and Thompson 2003 did not report data for all the time points.
Other potential sources of bias
We deemed 16 studies at unclear risk of other potential sources of bias such as dietary control or avoiding medication or supplements that could reduce muscle soreness. Of these, we judged seven studies at unclear risk of other bias because no details regarding dietary control or instructing participants to avoid non‐steroidal anti‐inflammatory drugs (NSAIDs) or other supplements were provided in the trial report (Bailey 2011; Bloomer 2005; McBride 1997; Nicol 2015; Shafat 2004; Silva 2008; Silva 2010). The nine other studies controlled the participants' diets but provided no details regarding dietary control or instructing participants to avoid NSAIDs or other supplements and we therefore judged them at unclear risk of bias (Bell 2016; Krotkiewski 1994; McCormick 2016; McLeay 2012; Michailidis 2013; Nie 2004; Theodorou 2011; Thompson 2001; Thompson 2004). We rated 34 studies at low risk of other bias as diet, intake of supplements and medication were controlled.
Effects of interventions
See: Summary of findings for the main comparison Summary of findings: antioxidants versus placebo
Evidence from the 50 trials included in this review applied to only one comparison: antioxidant supplements versus control (placebo).
Antioxidant supplementation versus placebo or no supplementation
All 50 included studies made this comparison. Muscle soreness data were not available for pooling from one trial (Herrlinger 2015), and no data were pooled from McCormick 2016 because of its protracted exercise regimen.
Primary outcomes
Delayed onset muscle soreness (DOMS) (visual analogue scale, various scales or scores; highest values = worst pain)
Forty‐eight studies presented data on muscle soreness at various different time points based on various visual analogue scale (VAS) scores. Results are presented at eight follow‐up times after exercise: up to 6 hours, and at 24, 48, 73, 96, 120, 144 and 168 hours. As there was considerable clinical heterogeneity we used the random‐effects model. Both Kerksick 2009 and Silva 2008 tested two antioxidants: in the analyses, Kerksick 2009 appears twice for the first four follow‐up times and Silva 2008 appears twice at 48, 96 and 168 hours.
Antioxidant supplementation reduced muscle soreness in comparison with placebo intervention when measured up to 6 hours post‐exercise (standardised mean difference (SMD) ‐0.30, 95% confidence interval (CI) ‐0.56 to ‐0.04; participants = 525; studies = 21; I2 = 53%; low‐quality evidence); Analysis 1.1); at 24 hours after exercise (SMD ‐0.13, 95% CI ‐0.27 to 0.00; participants = 936; studies = 41; I2 = 5%; moderate‐quality evidence; Analysis 1.2; Figure 4); at 48 hours after exercise (SMD ‐0.24, 95% CI ‐0.42 to ‐0.07; participants = 1047; studies = 45; I2 = 47%; low‐quality evidence; Analysis 1.3; Figure 5) and at 72 hours after exercise (SMD ‐0.19, 95% CI ‐0.38 to ‐0.00; participants = 657; studies = 28; I2 = 27%; moderate‐quality evidence; Analysis 1.4). (It is notable that the heterogeneity in this analysis is solely related to the inclusion of Michailidis 2013). There was little effect of antioxidants on muscle soreness at 96 hours after exercise (SMD ‐0.05, 95% CI ‐0.29 to 0.19; participants = 436; studies = 17; I2 = 31%; low‐quality evidence; Analysis 1.5). Far fewer trials provided data at five days or subsequently. There was very low‐quality evidence of little effect of antioxidants on muscle soreness at 120 hours (SMD 0.21, 95% CI ‐0.26 to 0.69; participants = 128; studies = 4; I2 = 39%), at 144 hours (SMD ‐0.23, 95% CI ‐1.11 to 0.65; participants = 20; studies = 1) or at 168 hours (SMD ‐0.04, 95% CI ‐0.48 to 0.41; participants = 80; studies = 4; I2 = 0%); Analysis 1.6).
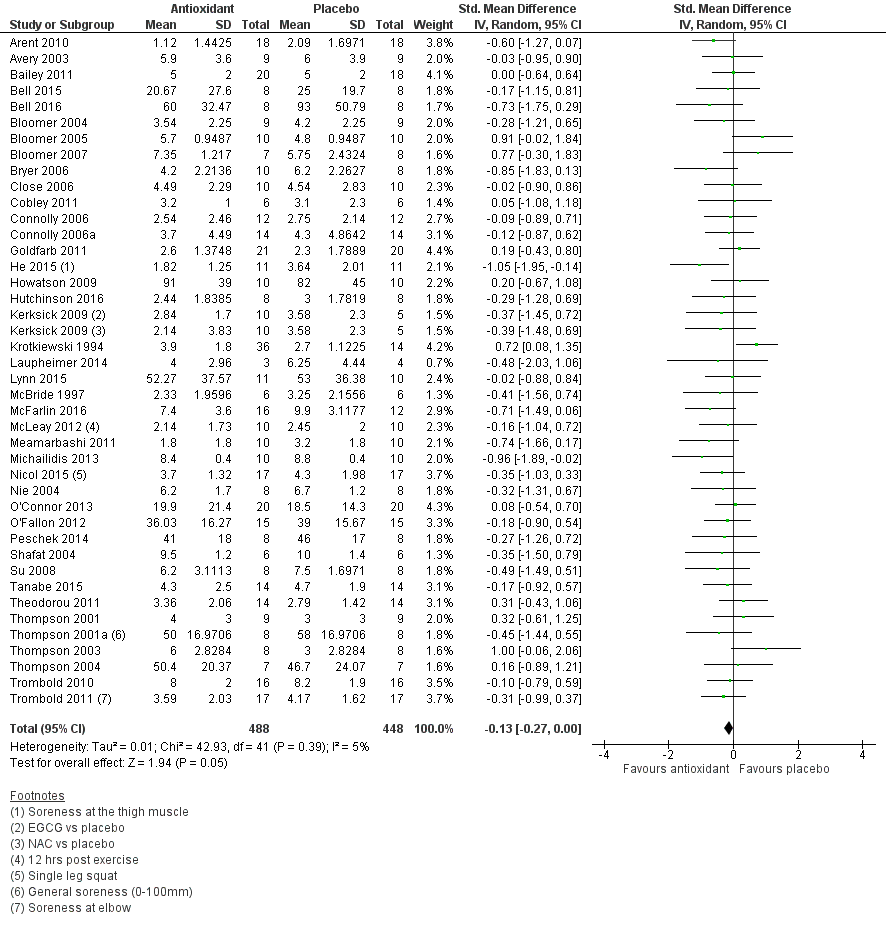
Forest plot of comparison: 1 Antioxidant supplementation vs. placebo for delayed onset muscle soreness (all studies), outcome: 1.2 Muscle soreness at 24 hours; random‐effects model.

Forest plot of comparison: 1 Antioxidant supplementation vs. placebo for delayed onset muscle soreness (all studies), outcome: 1.3 Muscle soreness at 48 hours; random‐effects model.
As there was considerable variation in the units used to measured muscle soreness, we rescaled all trials to the 0 to 10 scale at the first five time points in order to explore the actual difference between groups on a standard scale. The results are as follows: up to 6 hours (mean difference (MD) ‐0.52, 95% CI ‐0.95 to ‐0.08; participants = 525; studies = 21; I2 = 66%; Analysis 1.7); at 24 hours (MD ‐0.17, 95% CI ‐0.42 to 0.07; participants = 936; studies = 41; I2 = 29%; Analysis 1.8); at 48 hours (MD ‐0.41, 95% CI ‐0.69 to ‐0.12; participants = 1047; studies = 45; I2 = 64%; Analysis 1.9); at 72 hours (MD ‐0.29, 95% CI ‐0.59 to 0.02; participants = 657; studies = 28; I2 = 27%; Analysis 1.10); and at 96 hours (MD ‐0.03, 95% CI ‐0.43 to 0.37; participants = 436; studies = 17; I2 = 51%; Analysis 1.11). This rescaling also allows us to examine whether the antioxidant supplement produces a clinically important difference. For consistency with Bleakley 2012, we considered 1.4 cm as the minimal important difference (MID) for pain reduction on a 10 cm visual analogue scale; this was based on an estimated MID for musculoskeletal conditions of the shoulder by Tashjian 2009. It is notable that all of the upper limits of the 95% CIs of these five analyses are lower that this MID and hence all quantitative differences do not appear to represent person‐relevant differences in muscle soreness.
Subgroup and sensitivity analyses
We performed only a few subgroup and sensitivity analyses. We selected the 24 and 48 hours analyses for subgroup analyses given that these were the categories with the largest number of trials. We did not use the up to 6 hours time period because of the variation in the timing of measurement: i.e. some studies measured this outcome immediately after exercise whereas other studies measured this up to 2 hours or up to 6 hours after exercise.
A sensitivity analysis exploring the use of the fixed‐effect model for all eight follow‐up times produced similar results to that of random‐effects model (Table 3; analysis not shown).
| Follow‐up times | No. studies | No. participants | SMD (95% CI) |
| Up to 6 hours | 21 | 525 | ‐0.31 (‐0.49 to ‐0.13) |
| 24 hours | 41 | 936 | ‐0.13 (‐0.26 to ‐0.00) |
| 48 hours | 45 | 1047 | ‐0.22 (‐0.34 to ‐0.09) |
| 72 hours | 28 | 657 | ‐0.17 (‐0.33 to ‐0.02) |
| 96 hours | 17 | 436 | ‐0.04 (‐0.23 to 0.16) |
| 120 hours | 4 | 128 | 0.25 (‐0.12 to 0.61) |
| 144 hours | 1 | 20 | ‐0.23 (‐1.11 to 0.65) |
| 168 hours | 4 | 80 | ‐0.04 (‐0.48 to 0.41) |
CI: confidence interval
SMD: standardised mean difference
A subgroup analysis could not be performed on timing of administration (i.e. pre‐exercise and post‐exercise versus post‐exercise only) because there were very few trials (one or two studies depending on the time of follow‐up) in the post‐exercise group.
We performed a subgroup analysis on the type of exercise, that is, mechanically induced versus whole body aerobic exercise for the 24 and 48 hour follow‐up times (see Analysis 1.12; Analysis 1.13). There is no evidence of subgroup differences for muscle soreness for type of exercise at 24 hours (Chi² = 0.44, df = 1; P = 0.51, I² = 0%) or at 48 hours (Chi² = 0.88, df = 1; P = 0.35, I² = 0%).
Our second subgroup analysis was based on source of funding where we compared studies that were funded by a food company or provider of antioxidant supplements versus studies that there were not (seeAnalysis 1.14; Analysis 1.15). There is no evidence of subgroup differences for muscle soreness according to source of funding at 24 hours (Chi² = 0.03, df = 1, P = 0.87, I² = 0%) or 48 hours (Chi² = 0.10, df = 1, P = 0.875 I² = 0%); no information on funding was available for Su 2008.
We conducted a sensitivity analysis testing trials at unclear risk of bias, relating to random sequence generation, allocation concealment or both, which included 19 trials (Bailey 2011; Bell 2015; Bell 2016; Bloomer 2004; Bloomer 2005; Bloomer 2007; Close 2006; Cobley 2011; He 2015; Herrlinger 2015; Howatson 2009; Laupheimer 2014; McCormick 2016; Meamarbashi 2011; O'Connor 2013; Peschek 2014; Silva 2008; Silva 2010; Tanabe 2015). This analysis made little difference to the overall effect at either 24 hours post‐exercise (SMD ‐0.10, 95% CI ‐0.37 to 0.17; participants = 280; studies = 14; I2 = 19%) or at 48 hours (SMD ‐0.31, 95% CI ‐0.66 to 0.04; participants = 327; studies = 16; I2 = 57%).
Also presented are sensitivity analyses testing the effects of excluding cross‐over studies; these provide reassurance that the inclusion of such trials did not have an important effect on the results (Table 4).
| Follow‐up times | All studies | Parallel group studies only | ||
| No. studies | SMD (95% CI) | No. studies | SMD (95% CI) | |
| Up to 6 hours | 21 | ‐0.30 (‐0.56 to ‐0.04) | 15 | ‐0.35 (‐0.67 to ‐0.03) |
| 24 hours | 41 | ‐0.13 (‐0.27 to 0.00) | 32 | ‐0.08 (‐0.25 to 0.08) |
| 48 hours | 45 | ‐0.24 (‐0.42 to ‐0.07) | 34 | ‐0.19 (‐0.40 to 0.01) |
| 72 hours | 28 | ‐0.19 (‐0.38 to ‐0.00) | 22 | ‐0.11 (‐0.30 to 0.08) |
| 96 hours | 17 | ‐0.05 (‐0.29 to 0.19) | 12 | 0.01 (‐0.33 to 0.34) |
Table produced independently of the authors by Newton Opiyo and checked by Helen Handoll
Subjective recovery
No study measured subjective recovery (return to previous activities without signs or symptoms).
Adverse effects
Nine studies, reporting on a total of 216 participants, reported on this outcome (very low‐quality evidence). One study reported that all six participants in the NAC (N‐acetylcysteine) supplementation group had diarrhoea, which was mild in five participants and severe diarrhoea in one (Cobley 2011). The same study reported mild indigestion in four participants (67%) in the NAC group and one of six participants in the placebo group. Another study reported that tart cherry juice caused mild gastrointestinal distress in one of 26 participants taking the antioxidant supplement (Kuehl 2010). Seven studies reported no adverse effects of taking the antioxidant supplementation (Kerksick 2009; Laupheimer 2014; Lynn 2015; McLeay 2012; Michailidis 2013; O'Connor 2013; Phillips 2003). The remaining 41 studies failed to report adverse effects.
Secondary outcomes
Muscle tenderness
Only four studies measured muscle tenderness using a handheld algometer (Close 2006; Connolly 2006; Connolly 2006a; Peschek 2014) (and Analysis 1.17). Two studies measured tenderness using pressure algometry and reported the results in Newtons (Connolly 2006; Connolly 2006a), and two studies measured tenderness and reported in kg (Close 2006; Peschek 2014). There was very low‐quality evidence of little difference between antioxidant supplementation versus placebo in tenderness (a greater pressure exerted means less tenderness) at the four time points (24, 48, 72 and 96 hours) for the pooled data from the two studies (52 participants) reporting the results in Newtons (Analysis 1.16); nor for five time points (up to 6 hours, 24, 48, 72 and 96 hours) for the data from the two studies (36 participants) reporting the results in kg (Analysis 1.17).
Performance variables
The quality of the evidence for all performance variables was very low; each variable presented here being reported by only one of the five studies reporting these outcomes (Arent 2010; Bell 2015; Bell 2016; Cobley 2011; O'Connor 2013). Arent 2010 (18 participants; cross‐over trial) found no effect of antioxidant supplementation on the 30‐second Wingate performed on a cycle ergometer (the DOMS‐provoking exercise) seven days after supplementation (MD 0.30 W/kg, 95% CI ‐2.74 to 3.34; Analysis 1.18). Cobley 2011 (12 participants) found antioxidant supplementation (NAC) enhanced sprint time over 20 metres at three follow‐up times (lower values = better performance): 24 hours (MD ‐0.41 seconds, 95% CI ‐0.63 to ‐0.19), 48 hours (MD ‐0.30 seconds, 95% CI ‐0.52 to ‐0.08) and 120 hours (MD ‐0.30, 95% CI ‐0.54 to ‐0.06; Analysis 1.19). O'Connor 2013 (40 participants) found no improvements in maximal oxygen consumption when measured after 42 days after antioxidant supplementation (higher values = better performance) (MD 0.20 mL/kg/min, 95% CI ‐5.66 to 6.06; Analysis 1.20). Bell 2016 (16 participants) found no effect of antioxidant supplementation on agility (5‐0‐5 agility: lower values = better performance) at any of the three time points measured: 24 hours (MD 0.01 seconds, 95% CI ‐0.16 to 0.18), 48 hours (MD ‐0.05 seconds, 95% CI ‐0.19 to 0.09) or 72 hours (MD ‐0.02 seconds, 95% CI ‐0.17 to 0.13) (Analysis 1.21). Bell 2015 (16 participants) found no effect of antioxidant supplementation on six‐second sprint power (higher values = better performance) at any of the three time points measured: 24 hours (MD 39.00 W, 95% CI ‐182.33 to 260.33), 48 hours (MD 50.00 W, 95% CI ‐195.44 to 295.44) or 72 hours (MD 53.00 W, 95% CI ‐174.56 to 280.56) (Analysis 1.22).
Muscle force production (maximal voluntary contraction)
Thirty studies measured muscle function at various different time points. Muscle force production was measured in different ways and we pooled results only from studies using the same outcome measure: 15 trials reported the percentage change in force production from baseline; six reported Newton metres, six reported Newtons, two reported Newton metres per kg of body mass and one reported kg. We rated the quality of evidence as very low for all findings. When muscle force production was measured as a percentage change from baseline, antioxidant supplementation appeared to increase force production to a small extent (all under 6%) in comparison with placebo across the first five time points: up to 6 hours after exercise (MD 5.86%, 95% CI 3.29 to 8.42; participants = 255; studies = 11; I2 = 3%), at 24 hours (MD 2.51%, 95% CI 0.99 to 4.04; participants = 375; studies = 15; I2 = 75%), at 48 hours (MD 4.46%, 95% CI 2.94 to 5.98; participants = 375; studies = 15; I2 = 59%), at 72 hours (MD 3.92%, 95% CI 0.88 to 6.96; participants = 277; studies = 11; I2 = 51%), and at 96 hours after exercise (MD 5.29, 95% CI 3.65 to 6.92; participants = 252; studies = 9; I2 = 72%) (Analysis 1.23). (Although in the results for 168 hours after exercise, the antioxidant showed a harmful effect on muscle force production, only two studies measured this outcome at this time point and the results were statistically heterogeneous (MD ‐7.96, 95% CI ‐15.96 to 0.05; participants = 36; studies = 2; I2 = 68%). Where data were pooled, for up to six studies for force production measured in Newton metres, or for up to five studies for force production measured in Newtons, there were no differences found between the antioxidant supplementation and placebo groups across all of the time points measured (see Analysis 1.24 and Analysis 1.25). For completeness, the non‐pooled results for the two trials reporting the strength in Newton metres per kg of body mass are shown in Analysis 1.26 and those for the trial reporting strength in kg in Analysis 1.27. The former are dominated by those of Michailidis 2013, which favour antioxidants in the first five follow‐ups but placebo in the last two follow‐ups.
Range of motion
There was very low‐quality evidence that range of motion, which was measured in 10 studies (Bailey 2011; Bloomer 2004; Bryer 2006Connolly 2006a; Goldfarb 2011; Meamarbashi 2011; O'Connor 2013; Phillips 2003; Tanabe 2015; Theodorou 2011), did not differ importantly between the two groups (antioxidant versus placebo) at any of the follow‐up times (seeAnalysis 1.28). All differences (higher values = better range of motion) were small and unlikely to relate to a clinically important difference at either the elbow or knee. The first five follow‐up time results are presented here: up to 6 hours after exercise (MD ‐0.25 degrees, 95% CI ‐3.31 to 2.81; participants = 163; studies = 6; I2 = 0%), at 24 hours (MD 1.03 degrees, 95% CI ‐0.91 to 2.96; participants = 259; studies = 9; I2 = 0%), at 48 hours (MD 2.71 degrees, 95% CI 0.39 to 5.04; participants = 259; studies = 9; I2 = 61%), at 72 hours (MD 2.93 degrees, 95% CI ‐0.02 to 5.87; participants = 196; studies = 7; I2 = 0%) and at 96 hours (MD 0.79 degrees, 95% CI ‐1.26 to 2.84; participants = 158; studies = 6; I2 = 0%).
High‐dose versus low‐dose, where the low‐dose supplementation is within normal or recommended levels for the antioxidant involved
None of the included studies made this comparison.
Discussion
Summary of main results
This review examined the effectiveness of antioxidants for preventing and treating muscle soreness after exercise. Fifty randomised placebo‐controlled studies were included, 12 of which used a cross‐over design. The 50 studies involved a total of 1089 participants (961 male; 128 female; age range 16 to 55 years). The studies were heterogeneous, including the timing (pre‐exercise or post‐exercise), frequency, dose or duration, and type of antioxidant supplementation, and the type of preceding delayed onset muscle soreness (DOMS)‐producing exercise. All studies used an antioxidant dosage higher than the recommended daily amount. No studies compared high‐dose versus low‐dose, where the low‐dose supplementation was within normal or recommended levels for the antioxidant involved.
The included studies made only one comparison: antioxidant supplements versus control (placebo). Our main outcomes were muscle soreness (up to 6 hours post‐exercise and at 24, 48, 72 and 96 hours), subjective recovery and adverse events.
Antioxidant supplementation versus placebo or no supplementation
A summary of the evidence available for the main outcomes for this comparison is presented in summary of findings Table for the main comparison. The assessment of the quality of the evidence varied between moderate quality, where the effect is probably true but there is a possibility that it could be substantially different, low quality, where the effect may be true but it may also be substantially different from what was found, and very low quality, where we are very uncertain about the estimate.
Pooled standardised mean difference (SMD) results for muscle soreness indicated a small difference in favour of antioxidant supplementation after DOMS‐inducing exercise at all main follow‐ups: up to 6 hours (525 participants; 21 studies; low‐quality evidence); at 24 hours (936 participants; 41 studies; moderate‐quality evidence), at 48 hours (1047 participants; 45 studies; low‐quality evidence); at 72 hours (657 participants; 28 studies; moderate‐quality evidence), and little difference at 96 hours (436 participants; 17 studies; low‐quality evidence). When, however, we rescaled all the trial results to the 0 to 10 cm scale in order to compare the actual difference between groups, we found that the 95% confidence intervals (CIs) for all five follow‐up times were all below 1.0 cm, and thus all below the minimal important difference of 1.4 cm that we used in this review. Thus, all statistical differences in DOMS favouring antioxidant supplementation were unlikely to equate to meaningful or important differences in practice. Neither of our subgroup analyses to examine for differences in effect according to type of DOMS‐inducing exercise (mechanical versus whole body aerobic) or according to funding source confirmed subgroup differences. Sensitivity analyses to test the selection of the statistical model for pooling (fixed‐effect instead of random‐effects) and the exclusion of cross‐over studies all showed similar results to the main analyses.
None of the 50 studies reported on subjective recovery (return to previous activities without signs or symptoms).
Only nine studies (216 participants) reported on adverse effects, with actual events reported in two studies. One study (12 participants) reported that all six participants in the NAC (N‐acetylcysteine) supplementation group had diarrhoea, which was mild in five participants and severe in one (Cobley 2011). The same study reported mild indigestion in four participants (67%) in the NAC group and one of six participants in the placebo group. It should be noted that NAC supplementation is usually prescribed and it has been found to cause uncomfortable side effects including nausea and diarrhoea in other studies. Another study reported that tart cherry juice caused mild gastrointestinal distress in one of 26 participants taking the antioxidant supplement (Kuehl 2010). The other seven studies reported no adverse effects of taking the antioxidant supplementation; this included 10 participants having NAC supplementation in one study. Overall, the available evidence for adverse events is very low‐quality.
Overall completeness and applicability of evidence
Data for muscle soreness, the primary outcome, were available from 48 of the 50 small placebo‐controlled randomised trials, with pooled data available at 24 hours after the exercise from 41 trials (one of which tested two antioxidants), involving 936 participants and from 45 (two of which tested two antioxidants), involving 1047 participants. In contrast there were no data for subjective recovery and few data for adverse effects.
We consider the applicability of the evidence in terms of the population characteristics, the exercise used to induce muscle damage and trial settings, the antioxidants used and outcomes. In particular, the 50 trials included in this review varied regarding dosages of antioxidants, the muscle damage model and adequate control of extraneous variables.
The majority of the 1089 participants included in this review were male (961; 88.2%) and so arguably the findings of the review are mainly applicable to males but there is no biological basis for why antioxidants should have a different effect in the two sexes. These sex differences are typical of what is observed in the athletic recovery literature (Bieuzen 2013; Bleakley 2012; Costello 2014). More noteworthy is that no data from highly‐trained elite athletes were included in the analyses; the data pertaining to nine elite athletes tested in McCormick 2016 were not included in the meta‐analyses because the exercise paradigm was completely different to all the other studies included in this review. As the majority of the participants were either college students or relatively young and active, these findings cannot be generalised in the elite athlete population who have a different physiological and training status. Some reservations in terms of applicability also apply to older individuals due to their anatomical and physiological characteristics as there were no older participants included in this review (age range of participants: 16 to 55 years).
There were large variations regarding the mode of exercise used to induce muscle damage in the studies, with some studies using exhaustive high‐intensity exercise such as downhill running (i.e. whole body aerobic exercise) and other studies using a resistance training protocol (i.e. mechanically induced exercise). Thus the level of muscle damage experienced by the participants will have varied. In addition, the intensity of the exercise used to illicit muscle damage also varied greatly amongst studies: some studies used an extremely demanding and intense exercise protocol such as 10 sets of 10 repetitions knee extensions performed at 80% of one repetition maximum or a marathon run, whereas others used less exhaustive protocols such as a bench stepping exercise. The amount of muscle damage and oxidative stress caused depends on the type, intensity and duration of physical exercise performed (Castrogiovanni 2012). Paulsen 2012 found exercise that has a greater eccentric component that involves a greater range of motion and high force generation is more likely to cause greater levels of damage. Moreover, Bleakley 2012 reported that resistance exercises performed under laboratory conditions are associated with high levels of muscle damage and soreness, particularly in the untrained population. Our subgroup analysis that compared type of exercise at 24 and 48 hours did not show subgroup differences between whole body aerobic exercise and mechanically induced exercise. Despite the variation, the key point for this review is that the exercise protocols, whether in the laboratory or field setting, were all sufficient to induce muscle damage that would result in DOMS in people undergoing sport activities.
There was large variation in the dose and duration of the antioxidants used, with three trials testing supplements started only after exercise. The variation was too great to enable meaningful indirect comparisons (subgroup analyses) and no trial compared high‐ versus low‐dose supplementation, where the low‐dose supplementation was within normal or recommended levels for the antioxidant involved. Nonetheless, all studies used an antioxidant dosage higher than the recommended daily amount.
The timing for assessment of muscle soreness, with the majority of evidence available for 24 and 48 hours after exercise, was appropriate. However, the timing of measurement for up to 6 hours varied greatly amongst the studies where some studies measured muscle soreness immediately after exercise and some studies measured this several hours after exercise. There was considerable variation in the measurement of muscle soreness, which meant that we pooled SMDs for the main analyses. Exploratory analyses, where all results were on a 10 cm scale, allowed an assessment of whether the between‐group differences were clinically relevant. Crucially, the upper limits of the 95% CIs at all five time points were much less than a typical minimal important difference (MID) for pain.
Quality of the evidence
We assessed the quality of evidence using the GRADE framework, which combines considerations of risk of bias,indirectness,inconsistency (heterogeneity),imprecision and publication bias. The findings for the main outcomes are shown in summary of findings Table for the main comparison. We downgraded all outcomes one level for serious risk of bias, due mainly to selective reporting bias (the majority of the trials failed to report on adverse effects) and, to a lesser degree, attrition biases. We did not downgrade for indirectness in relation to muscle soreness. We downgraded two outcomes for serious inconsistency reflecting heterogeneity that could not be traced to the inclusion of just one outlier trial. Pooled evidence did not support downgrading for imprecision. Our tests for publication bias did not reveal a serious concern (Figure 6; Figure 7), although all were small studies. Thus, we did not downgrade for publication bias. We concluded that the quality of the evidence ranged from moderate to very low.
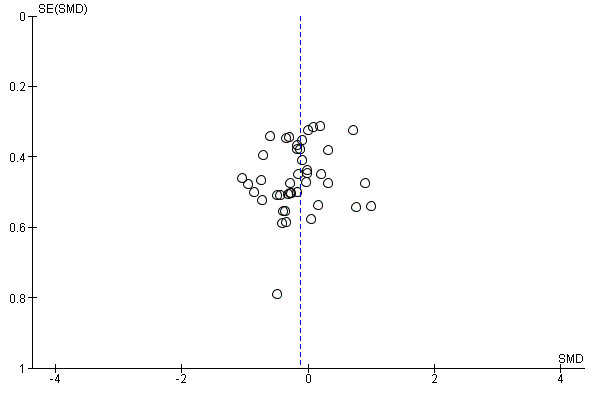
Funnel plot of comparison: 1 Antioxidant supplementation vs. placebo for delayed onset muscle soreness (all studies), outcome: 1.2 Muscle soreness at 24 hours; random‐effects model.

Funnel plot of comparison: 1 Antioxidant supplementation vs. placebo for delayed onset muscle soreness (all studies), outcome: 1.3 Muscle soreness at 48 hours; random‐effects model.
Potential biases in the review process
We used the standard methods described in the Cochrane Handbook for Systematic Reviews of Interventions (Higgins 2011). Although our search was extensive, we cannot exclude the possibility that we have missed relevant evidence. For studies where we required the raw data, we contacted authors via email. The authors of 14 studies did not respond to several emails requesting mean and standard deviation data (Avery 2003; Beaton 2002a; Bryer 2006; Connolly 2006; Connolly 2006a; Goldfarb 2011; Krotkiewski 1994; McFarlin 2016; Michailidis 2013; Peschek 2014; Phillips 2003; Su 2008; Trombold 2010; Trombold 2011). We therefore extracted these data from graphs using Graphclick 2010 Arizona (version 3.0.2, 2010). Whilst this is not ideal, we tried to minimise error by having two review authors (MR and DR) independently extract the data, with any discrepancies resolved by consultation with the third and fourth authors (HS and JC).
One potential source of bias is the post‐hoc exclusion of trials not reporting our primary outcomes (see Types of outcome measures). However, none of the excluded studies were aimed at the prevention, reduction or treatment of DOMS.
We set out "to assess the effects (benefits and harms) of antioxidant supplements and antioxidant‐enriched foods for preventing and reducing the severity and duration of delayed onset muscle soreness following exercise" (Objectives). To achieve this, we decided to pool data from clearly heterogeneous trials; for instance varying in their study design, populations, the exercise protocols, the antioxidant dosage, start and length of supplementation, their accounting for extraneous variables that could affect recovery and to a lesser degree in their timing of measuring muscle soreness (DOMS). In the light of this clinical heterogeneity, the statistical heterogeneity was not extreme and sometimes the heterogeneity could be sourced to a very few outliers (e.g. Michailidis 2013 for muscle soreness at 72 hours (Analysis 1.4)). Subgroup analysis by type of exercise proved reassuring. Keeping the focus on the main characteristic of the intervention (i.e. oral antioxidant supplementation at dosage above the recommended daily dosage) appears justified.
Publication bias is a threat to any systematic review or meta‐analysis and publication bias among nutrition‐related scientific articles remains a problem. Lesser 2007 investigated financial sponsorship of scientific articles addressing the health effects of three commonly consumed beverages to determine how sponsorship affects published conclusions and found that industry funding of nutrition‐related studies may bias conclusions in favour of sponsors' products. However, funnel plots for the outcomes of muscle soreness at 24 hours and 48 hours were not suggestive of publication bias (Figure 6; Figure 7). Moreover, we performed a subgroup analysis on studies that were funded by a food company or provider of antioxidant supplements and compared them with studies that were not funded by a food company or provider of antioxidant supplements and we found no evidence of subgroup differences and thus sponsorship bias (Analysis 1.14; Analysis 1.15).
Our inclusion of cross‐over studies and our analysis of their data as if from a parallel group trial, thus without adjustment for the cross‐over design, are other potential sources of bias. With one exception, the cross‐over studies included in this review used a washout period of two to six weeks, which is sufficient to allow the muscles to recover. The exception used a washout period of only five days between treatments and therefore carries some risk of a carry‐over effect (Arent 2010); sensitivity analysis to check on the effect of excluding the data from this trial did not result in important changes. Further sensitivity analyses checking the effects of excluding the cross‐over trials from the muscle soreness analyses showed that our inclusion and handling of the cross‐over studies did not have an important impact on the review results.
Agreements and disagreements with other studies or reviews
Several narrative reviews have been written on antioxidant supplementation and recovery (e.g. Gross 2011; Howatson 2008b; McGinley 2009; Peternelj 2011). However, to our knowledge this is the first systematic review that has examined the effects of antioxidant supplements for preventing and reducing muscle soreness after exercise. Our review also includes more recently published evidence. For example, of the 45 trials contributing evidence to the 48 hours muscle soreness analysis (Analysis 1.3), 14 were published in 2012 or subsequently, and 14 more were published between 2009 and 2011.
The observations by Howatson 2008b on the large variations in type of, dosage used and duration of antioxidant and exercise modality are consistent with our findings. McGinley 2009, which reviewed the effects of vitamin C, vitamin E and both combined on muscle damage and oxidative stress, also attributed the mixed findings to variations in dosage, timing and duration of antioxidant and exercise modality. McGinley 2009 suggested that there was some evidence to show that both vitamin C and vitamin E antioxidants can reduce oxidative stress but there was poor evidence to show any positive effects on protecting against muscle damage and soreness. It is also notable that there has been some indication that long‐term antioxidant supplementation in high doses, in particular vitamin E, may increase mortality (Bjelakovic 2007). Peternelj 2011 concluded that antioxidant supplementation attenuates exercise‐induced oxidative stress but had no effects on exercise‐induced muscle damage, soreness and performance. Although Peternelj 2011 did not perform a meta‐analysis, they suggested that there is a growing body of evidence indicating that antioxidant supplements may have a detrimental effect as they may interfere with the beneficial effects of exercise training. Gross 2011 in their narrative review on antioxidant supplementation and endurance training noted that the use of antioxidants in sport by amateur and professional athletes was common and that some studies had suggested that these may actually be counterproductive (in particular vitamin C and E supplements) as they may impair and weaken some of the desired signalling roles played by free radicals during training adaptations. The latter, however, was not investigated by Gross 2011. Nonetheless, over the last few years there has been an emergence of studies showing that chronic antioxidant supplementation may actually be counterproductive, particularly in interfering with exercise‐induced cell‐signalling in skeletal muscle thus having an overall detrimental effect of exercise training on both performance and health (Gomez‐Cabrera 2008; Paulsen 2014; Ristow 2009). More specifically, several studies have shown that antioxidant supplements promote exercise‐induced oxidative stress (Avery 2003; Bailey 2011; Beaton 2002; Childs 2001; Knez 2007; Lamprecht 2009; Malm 1996; Nieman 2004), hinder cell adaptation to exercise‐induced oxidative stress (Gomez‐Cabrera 2008; Ristow 2009; Paulsen 2014), and delay healing and recovery from exercise (Close 2006; Teixeira 2009), and long‐term antioxidant supplementation in high doses may increase mortality (Bjelakovic 2014; Slatore 2008).
The risk of adverse effects is likely to be dependent of the type of antioxidant. One of the two trials in the review reporting on adverse effects was testing NAC supplementation and reported that all six participants in the antioxidant group had diarrhoea (Cobley 2011). As well as being a listed side effect of this prescription drug, uncomfortable side effects such as nausea and diarrhoea from NAC supplementation have also been reported elsewhere (Ferreira 2011).
As well as random errors relating to small trials and bias, there are numerous factors that can explain why there are differences between trials and in the antioxidant literature on whether antioxidants are beneficial or not for recovery. The recovery process is complex, and there are many extraneous variables that could interfere or accelerate the recovery process. Factors such as differences in antioxidant dosage, length of supplementation, and accounting for extraneous variables that could affect recovery could explain differences between trials (Close 2014). Second, there are large variations in the type of participants with most studies recruiting untrained, sedentary and relatively young and healthy individuals and far fewer studies recruiting well‐trained athletes. Participants will vary in size, body weight, body composition and they may respond differently to antioxidant supplementation due to metabolic differences; these may also be some reasons that can explain the differences in findings. Nonetheless, as argued above, retaining the focus on the broad question asked in this review has helped to us to examine and summarise the evidence for the overall question of whether antioxidants prevent or reduce muscle soreness after exercise.

Study flow diagram
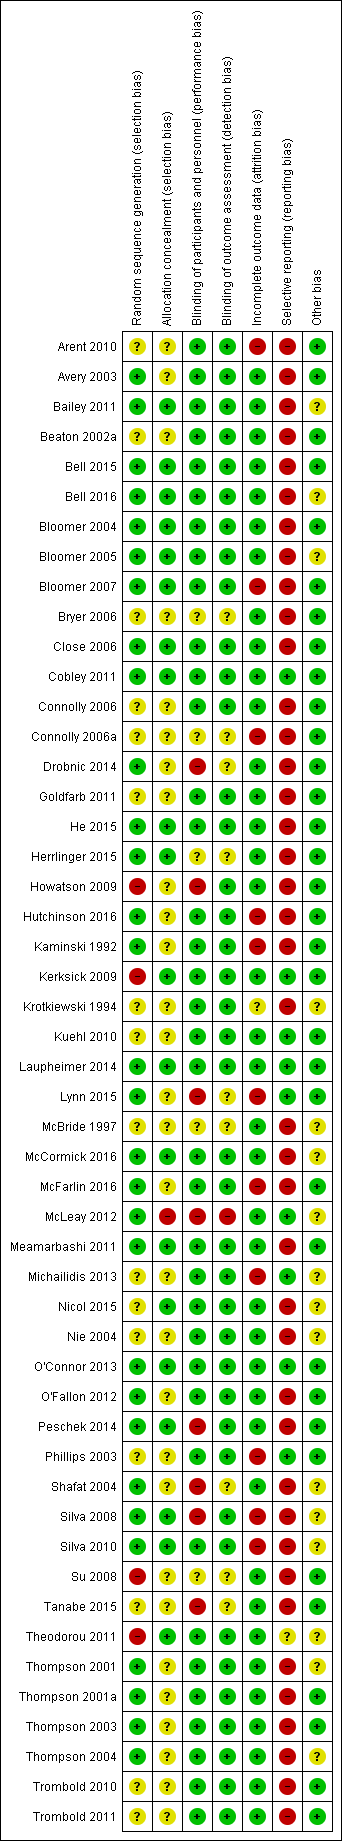
'Risk of bias' summary: review authors' judgements about each risk of bias item for each included study.
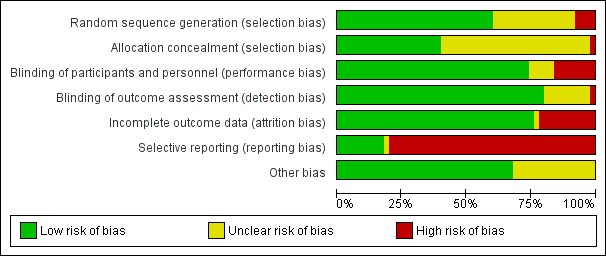
'Risk of bias' graph: review authors' judgements about each risk of bias item presented as percentages across all included studies

Forest plot of comparison: 1 Antioxidant supplementation vs. placebo for delayed onset muscle soreness (all studies), outcome: 1.2 Muscle soreness at 24 hours; random‐effects model.
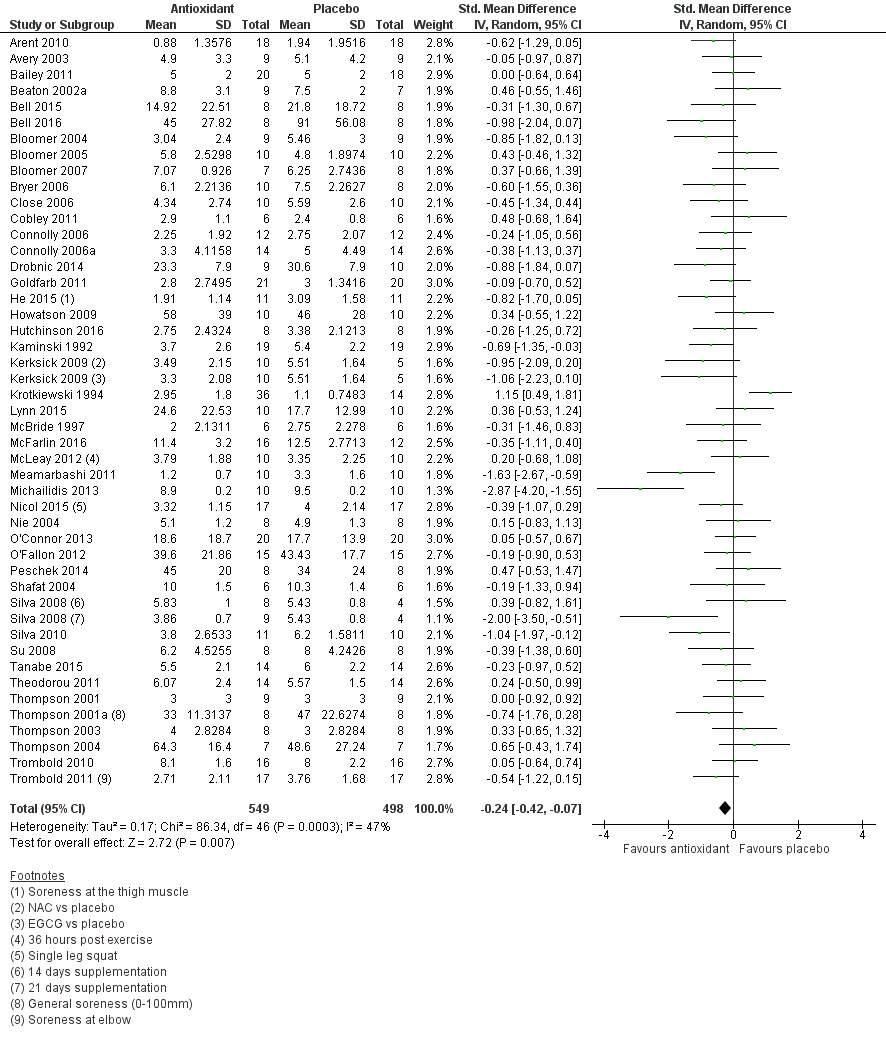
Forest plot of comparison: 1 Antioxidant supplementation vs. placebo for delayed onset muscle soreness (all studies), outcome: 1.3 Muscle soreness at 48 hours; random‐effects model.

Funnel plot of comparison: 1 Antioxidant supplementation vs. placebo for delayed onset muscle soreness (all studies), outcome: 1.2 Muscle soreness at 24 hours; random‐effects model.
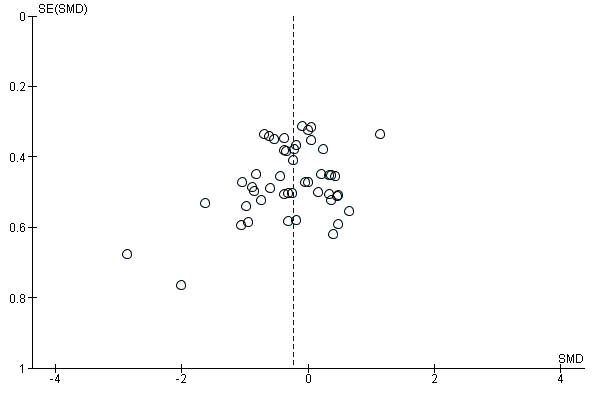
Funnel plot of comparison: 1 Antioxidant supplementation vs. placebo for delayed onset muscle soreness (all studies), outcome: 1.3 Muscle soreness at 48 hours; random‐effects model.
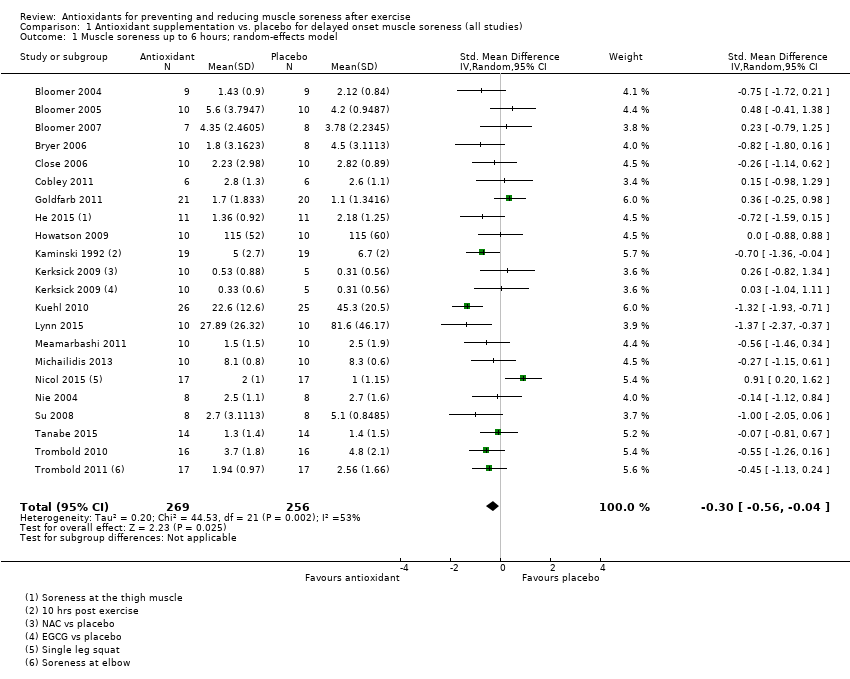
Comparison 1 Antioxidant supplementation vs. placebo for delayed onset muscle soreness (all studies), Outcome 1 Muscle soreness up to 6 hours; random‐effects model.
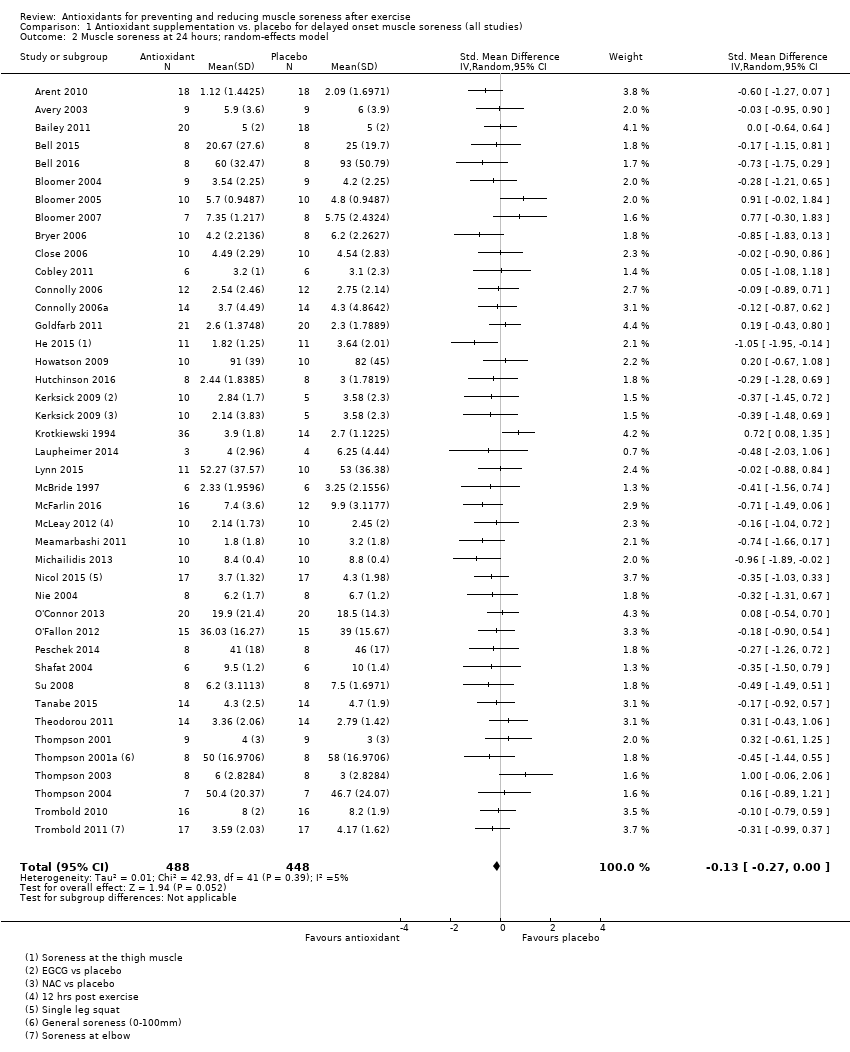
Comparison 1 Antioxidant supplementation vs. placebo for delayed onset muscle soreness (all studies), Outcome 2 Muscle soreness at 24 hours; random‐effects model.
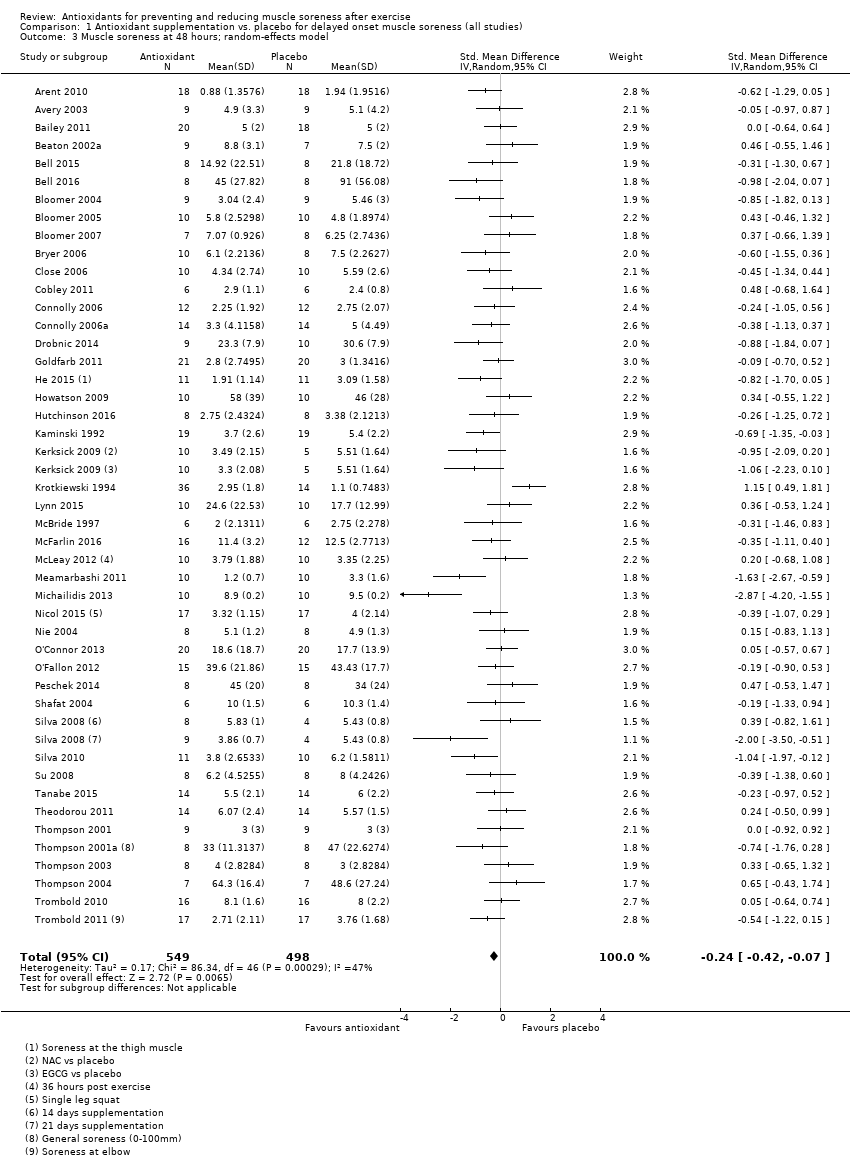
Comparison 1 Antioxidant supplementation vs. placebo for delayed onset muscle soreness (all studies), Outcome 3 Muscle soreness at 48 hours; random‐effects model.
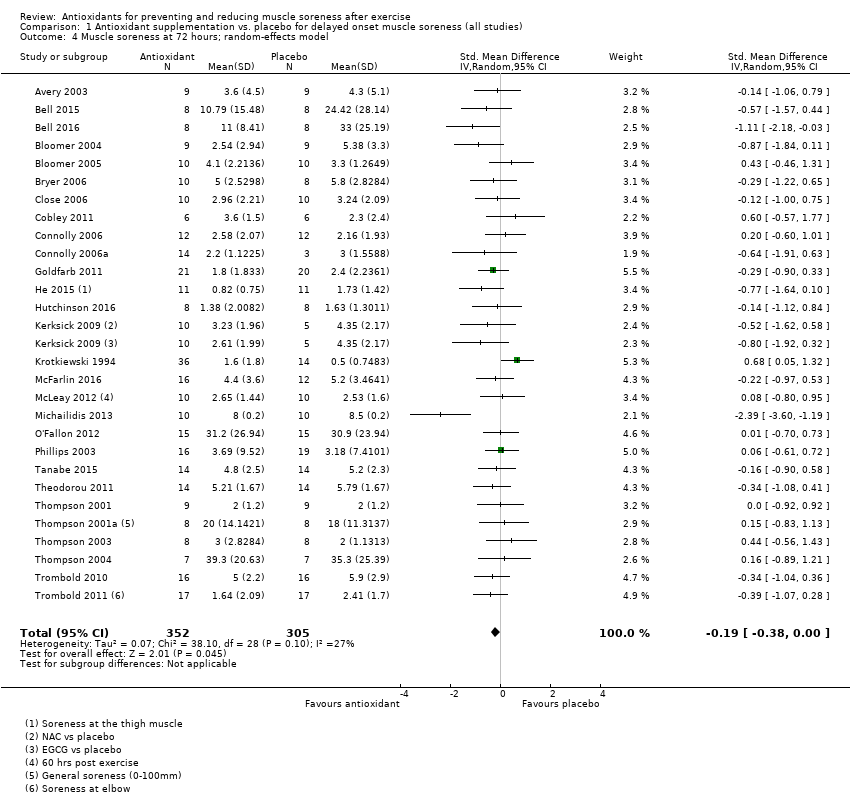
Comparison 1 Antioxidant supplementation vs. placebo for delayed onset muscle soreness (all studies), Outcome 4 Muscle soreness at 72 hours; random‐effects model.
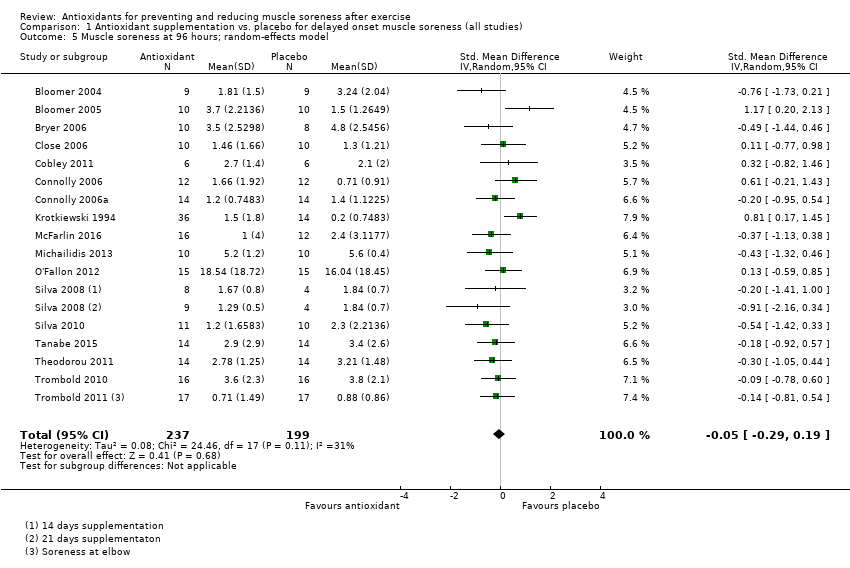
Comparison 1 Antioxidant supplementation vs. placebo for delayed onset muscle soreness (all studies), Outcome 5 Muscle soreness at 96 hours; random‐effects model.
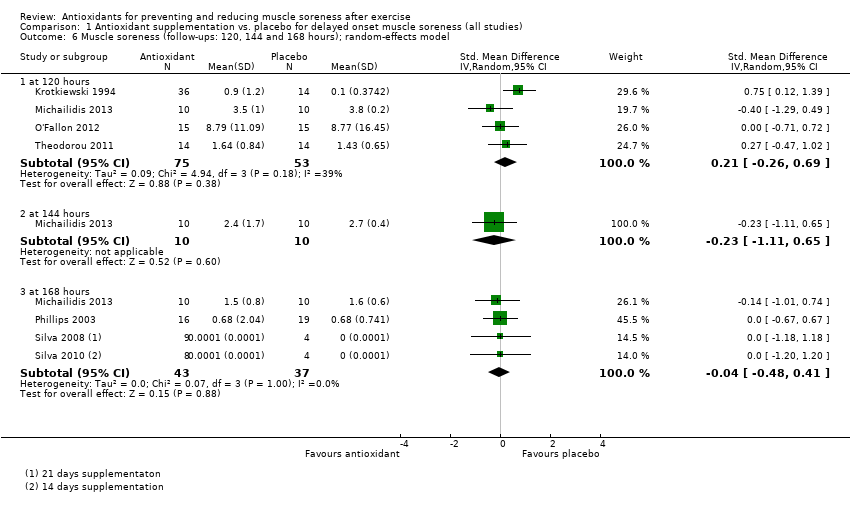
Comparison 1 Antioxidant supplementation vs. placebo for delayed onset muscle soreness (all studies), Outcome 6 Muscle soreness (follow‐ups: 120, 144 and 168 hours); random‐effects model.
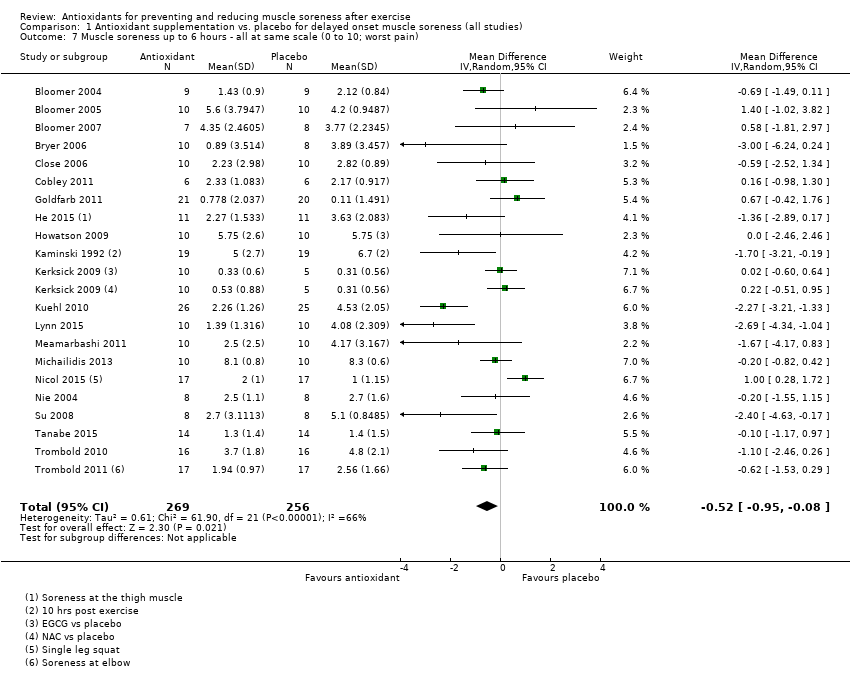
Comparison 1 Antioxidant supplementation vs. placebo for delayed onset muscle soreness (all studies), Outcome 7 Muscle soreness up to 6 hours ‐ all at same scale (0 to 10; worst pain).
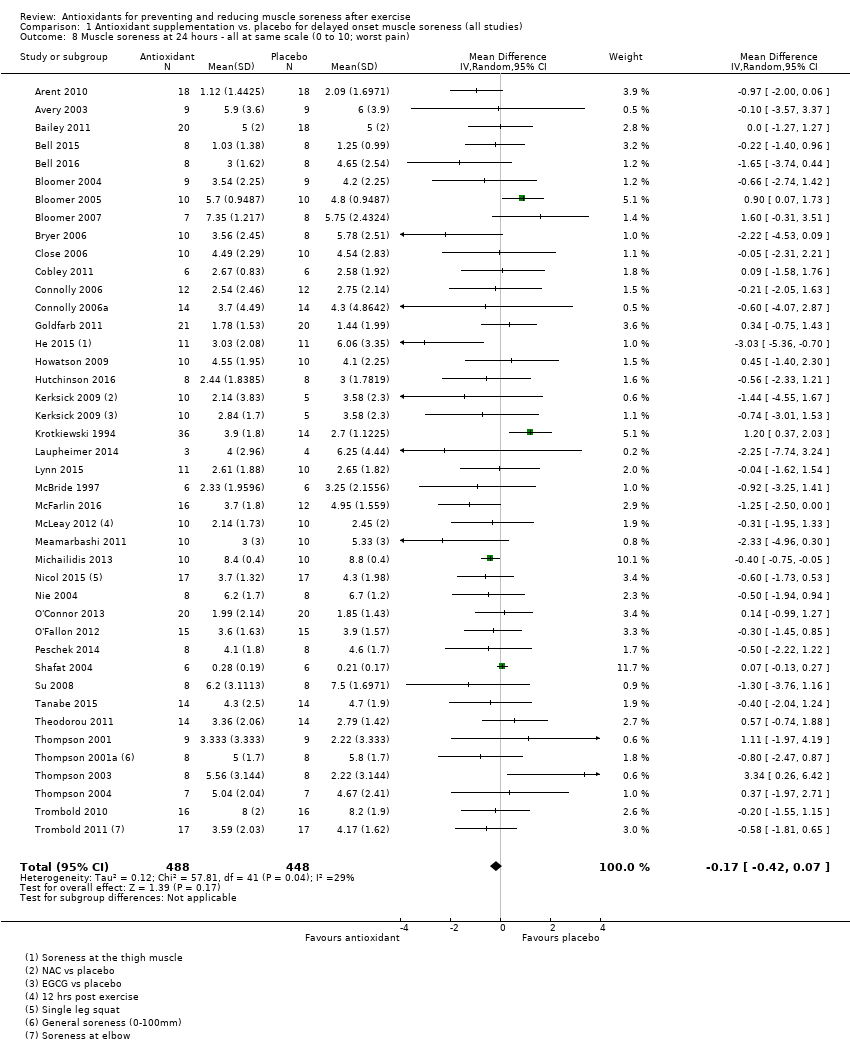
Comparison 1 Antioxidant supplementation vs. placebo for delayed onset muscle soreness (all studies), Outcome 8 Muscle soreness at 24 hours ‐ all at same scale (0 to 10; worst pain).
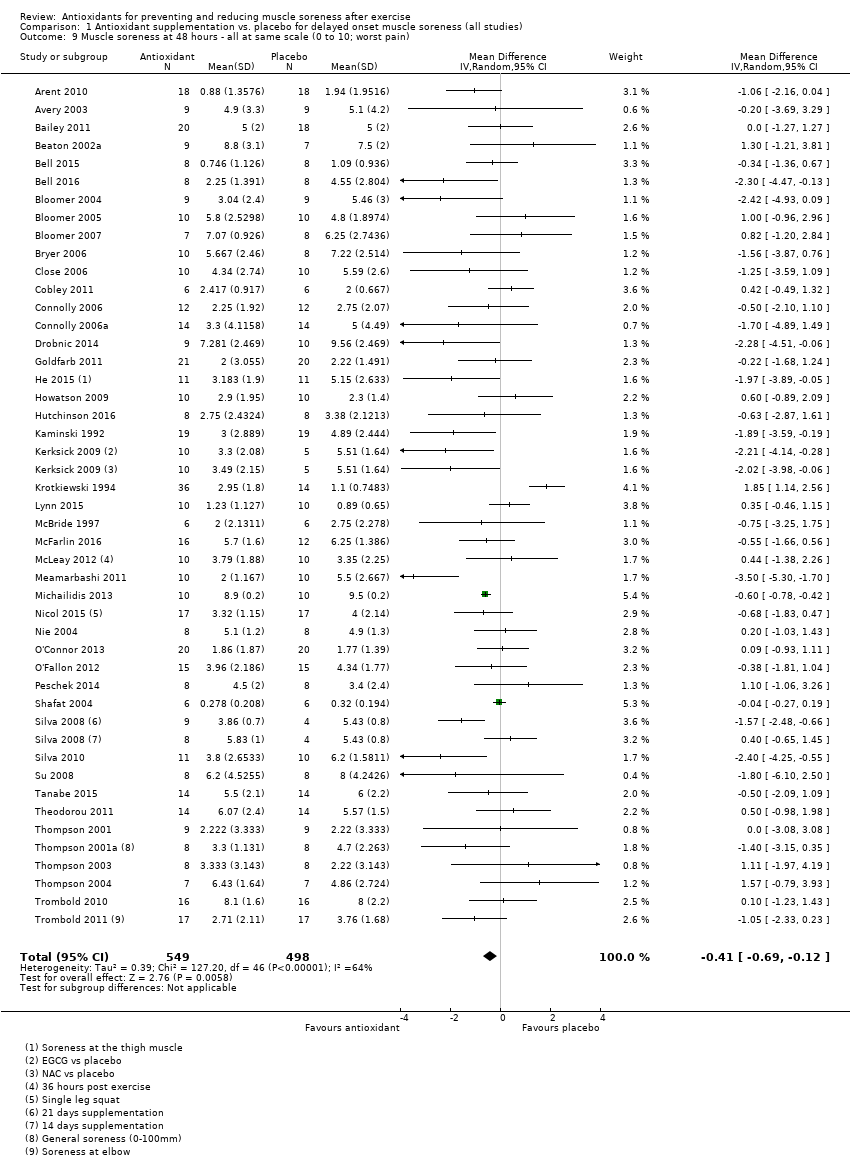
Comparison 1 Antioxidant supplementation vs. placebo for delayed onset muscle soreness (all studies), Outcome 9 Muscle soreness at 48 hours ‐ all at same scale (0 to 10; worst pain).
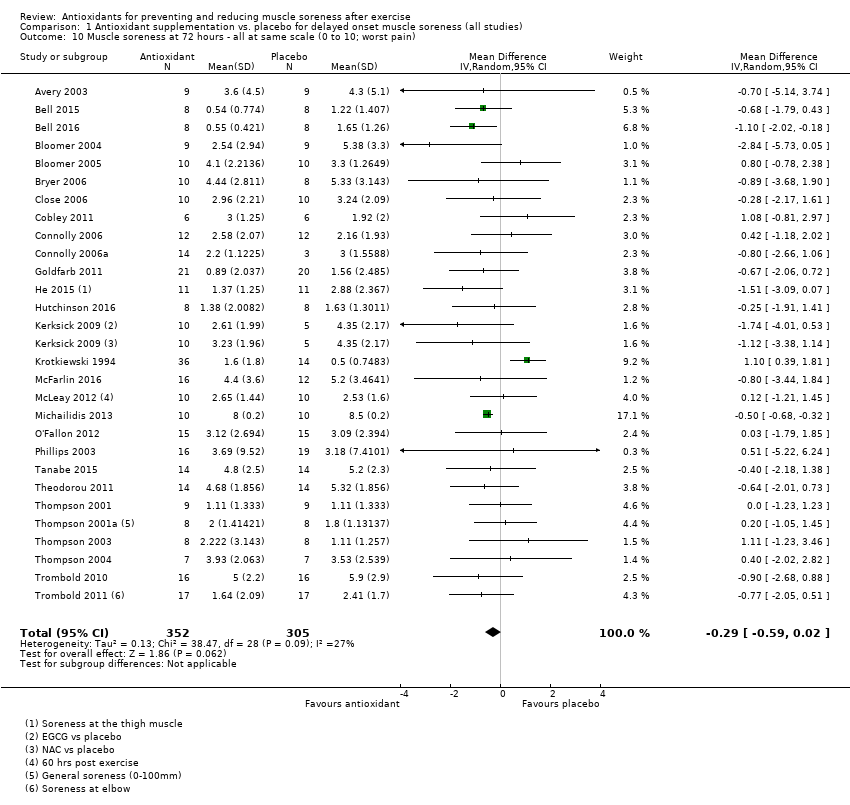
Comparison 1 Antioxidant supplementation vs. placebo for delayed onset muscle soreness (all studies), Outcome 10 Muscle soreness at 72 hours ‐ all at same scale (0 to 10; worst pain).
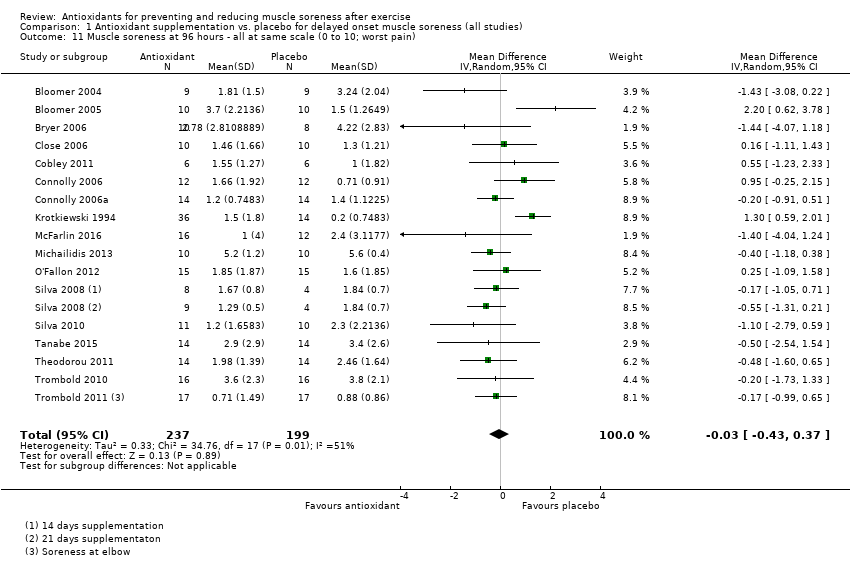
Comparison 1 Antioxidant supplementation vs. placebo for delayed onset muscle soreness (all studies), Outcome 11 Muscle soreness at 96 hours ‐ all at same scale (0 to 10; worst pain).
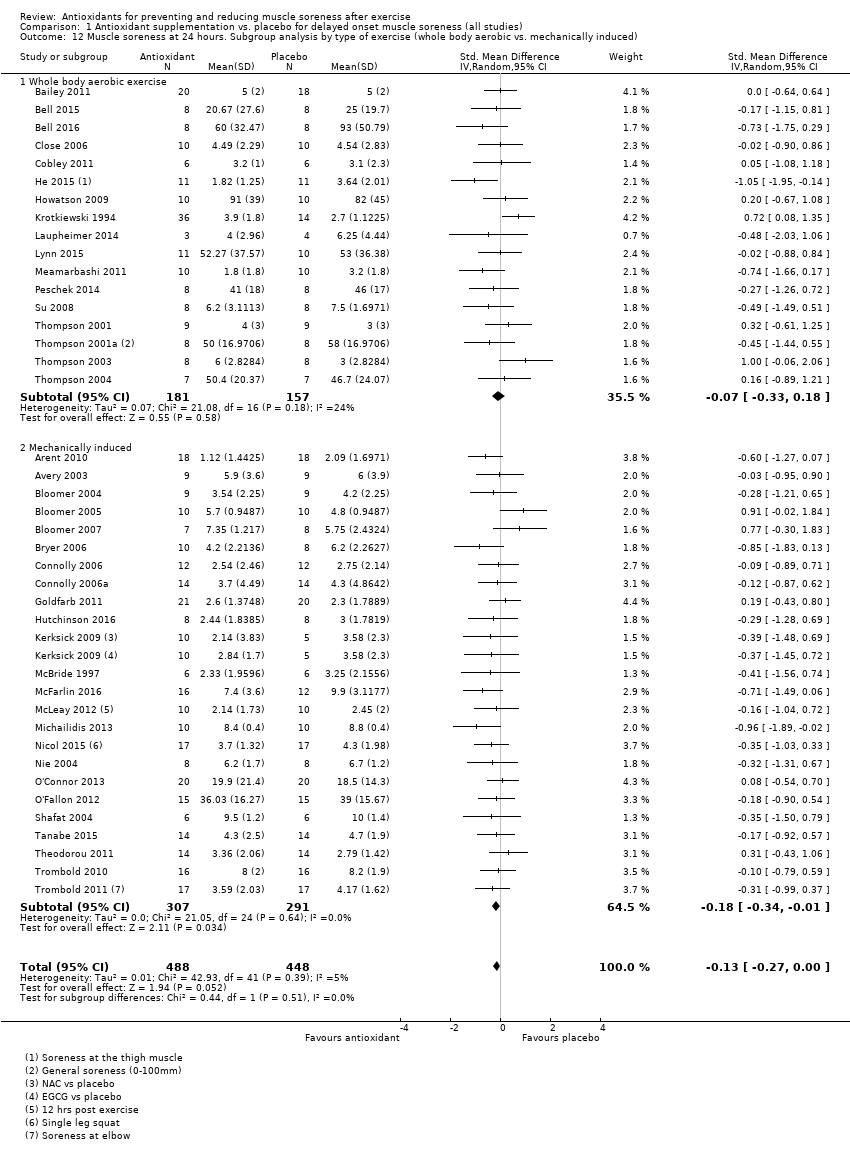
Comparison 1 Antioxidant supplementation vs. placebo for delayed onset muscle soreness (all studies), Outcome 12 Muscle soreness at 24 hours. Subgroup analysis by type of exercise (whole body aerobic vs. mechanically induced).
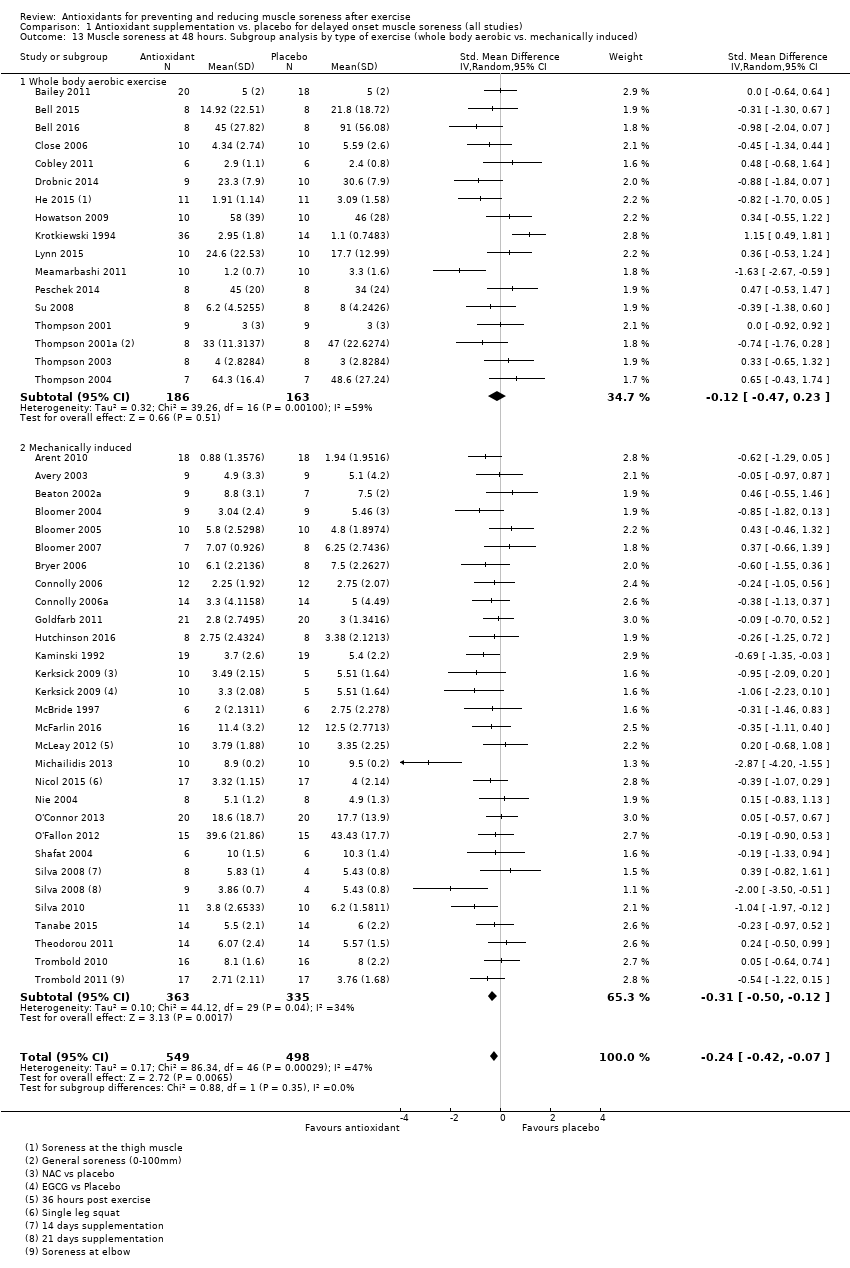
Comparison 1 Antioxidant supplementation vs. placebo for delayed onset muscle soreness (all studies), Outcome 13 Muscle soreness at 48 hours. Subgroup analysis by type of exercise (whole body aerobic vs. mechanically induced).
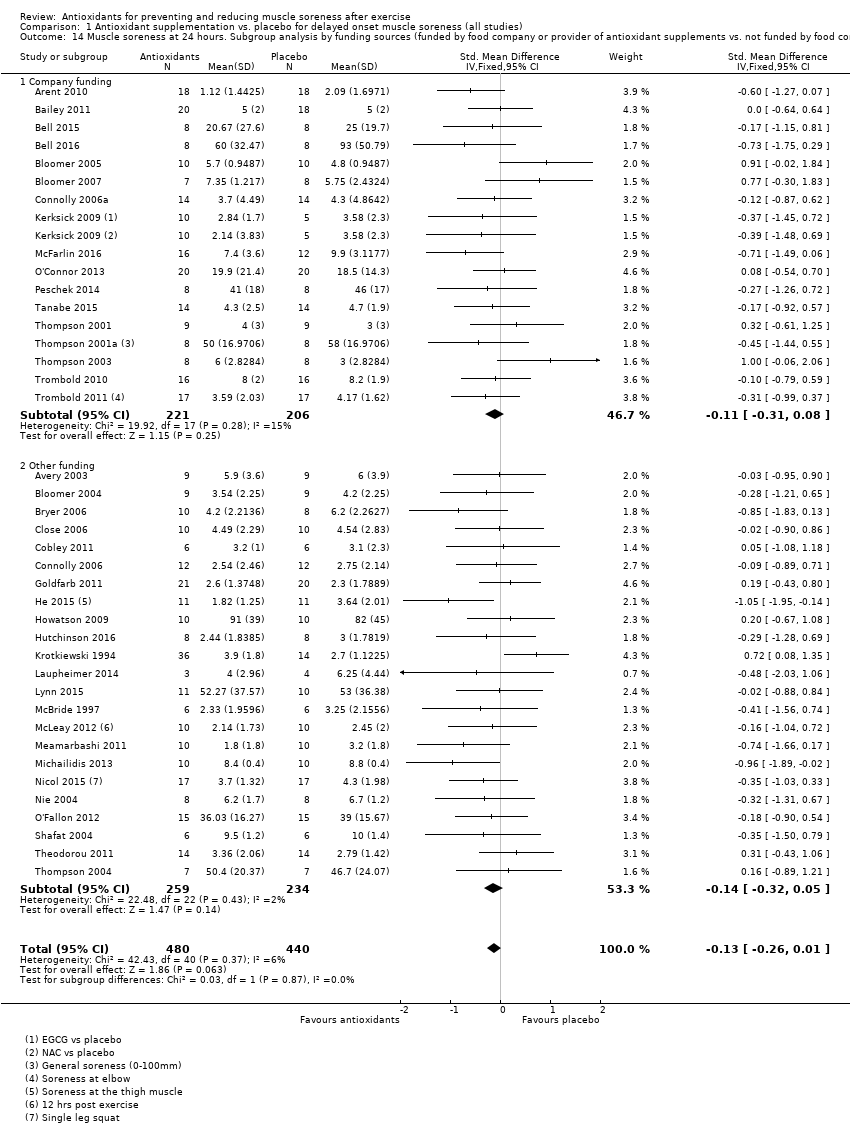
Comparison 1 Antioxidant supplementation vs. placebo for delayed onset muscle soreness (all studies), Outcome 14 Muscle soreness at 24 hours. Subgroup analysis by funding sources (funded by food company or provider of antioxidant supplements vs. not funded by food company or provider of antioxidant supplements).
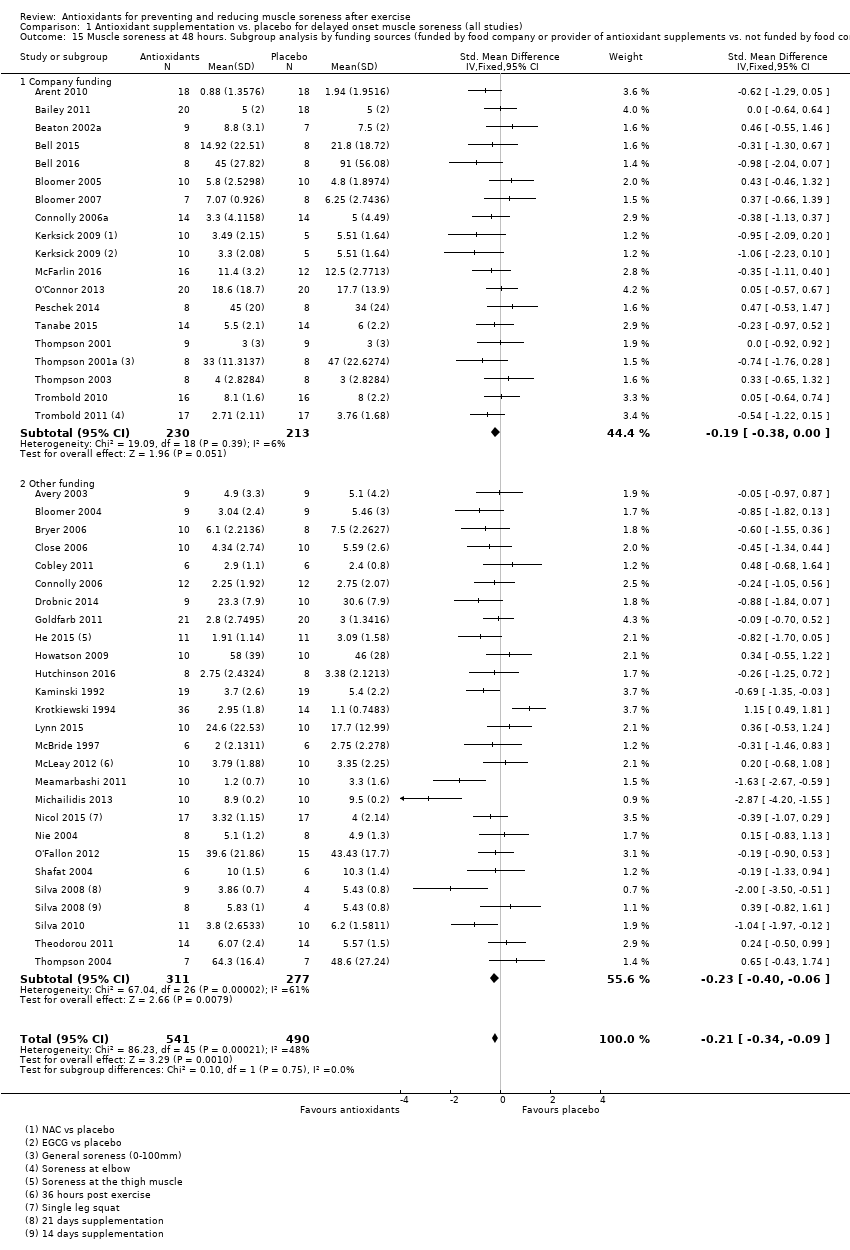
Comparison 1 Antioxidant supplementation vs. placebo for delayed onset muscle soreness (all studies), Outcome 15 Muscle soreness at 48 hours. Subgroup analysis by funding sources (funded by food company or provider of antioxidant supplements vs. not funded by food company or provider of antioxidant supplements).
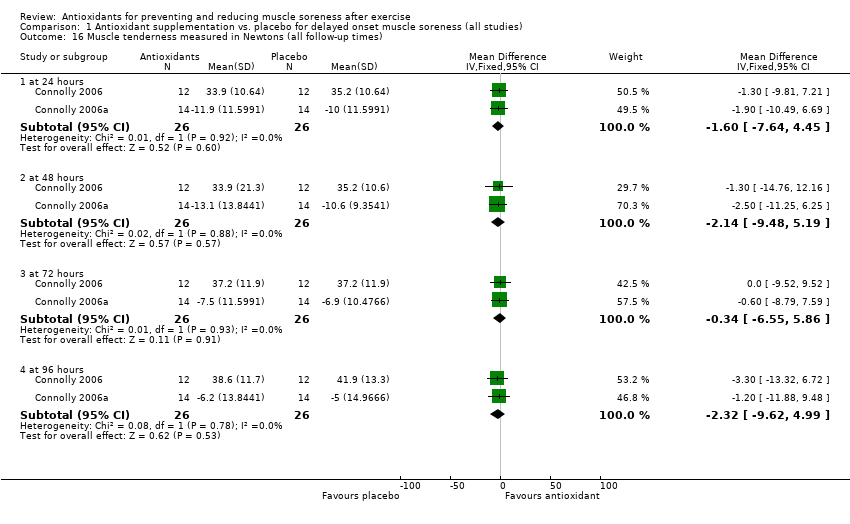
Comparison 1 Antioxidant supplementation vs. placebo for delayed onset muscle soreness (all studies), Outcome 16 Muscle tenderness measured in Newtons (all follow‐up times).
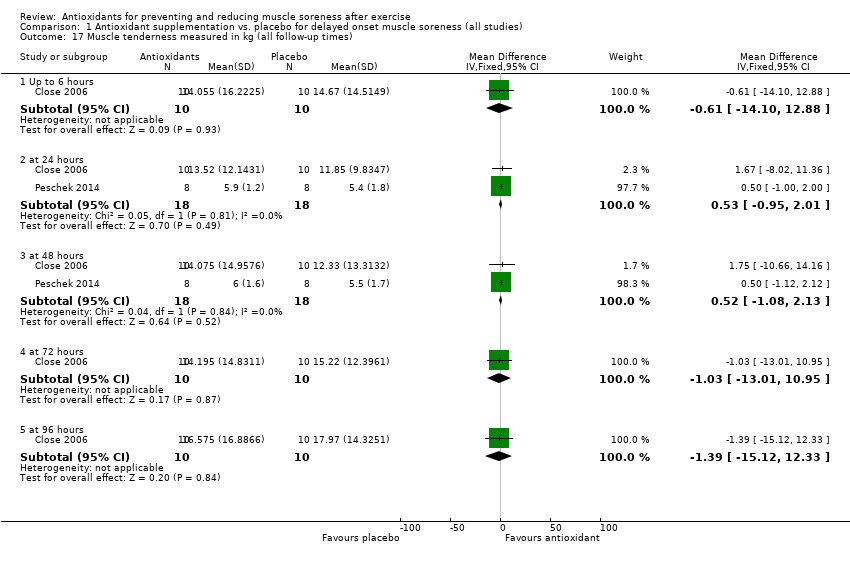
Comparison 1 Antioxidant supplementation vs. placebo for delayed onset muscle soreness (all studies), Outcome 17 Muscle tenderness measured in kg (all follow‐up times).
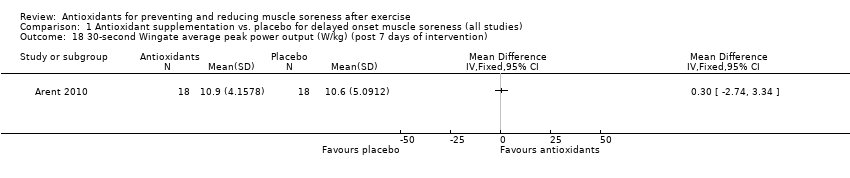
Comparison 1 Antioxidant supplementation vs. placebo for delayed onset muscle soreness (all studies), Outcome 18 30‐second Wingate average peak power output (W/kg) (post 7 days of intervention).
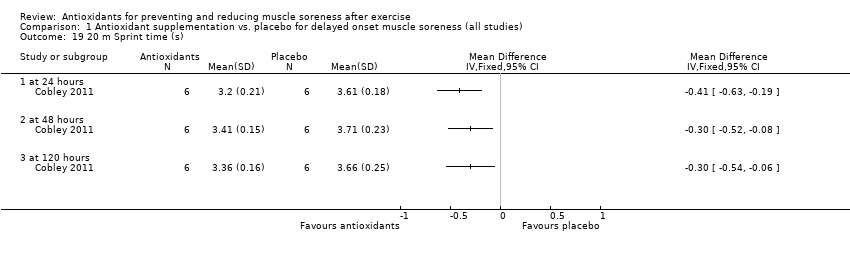
Comparison 1 Antioxidant supplementation vs. placebo for delayed onset muscle soreness (all studies), Outcome 19 20 m Sprint time (s).
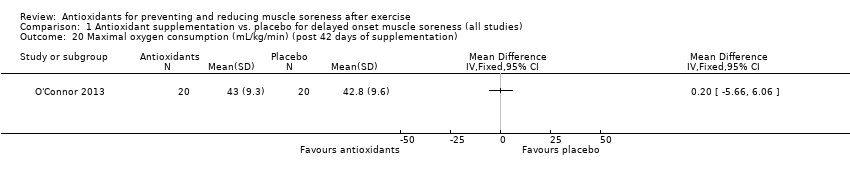
Comparison 1 Antioxidant supplementation vs. placebo for delayed onset muscle soreness (all studies), Outcome 20 Maximal oxygen consumption (mL/kg/min) (post 42 days of supplementation).
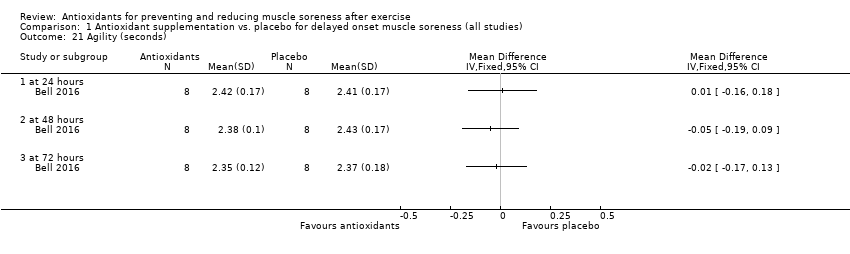
Comparison 1 Antioxidant supplementation vs. placebo for delayed onset muscle soreness (all studies), Outcome 21 Agility (seconds).
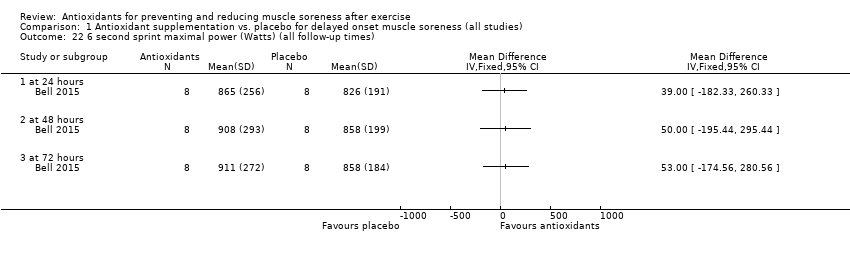
Comparison 1 Antioxidant supplementation vs. placebo for delayed onset muscle soreness (all studies), Outcome 22 6 second sprint maximal power (Watts) (all follow‐up times).
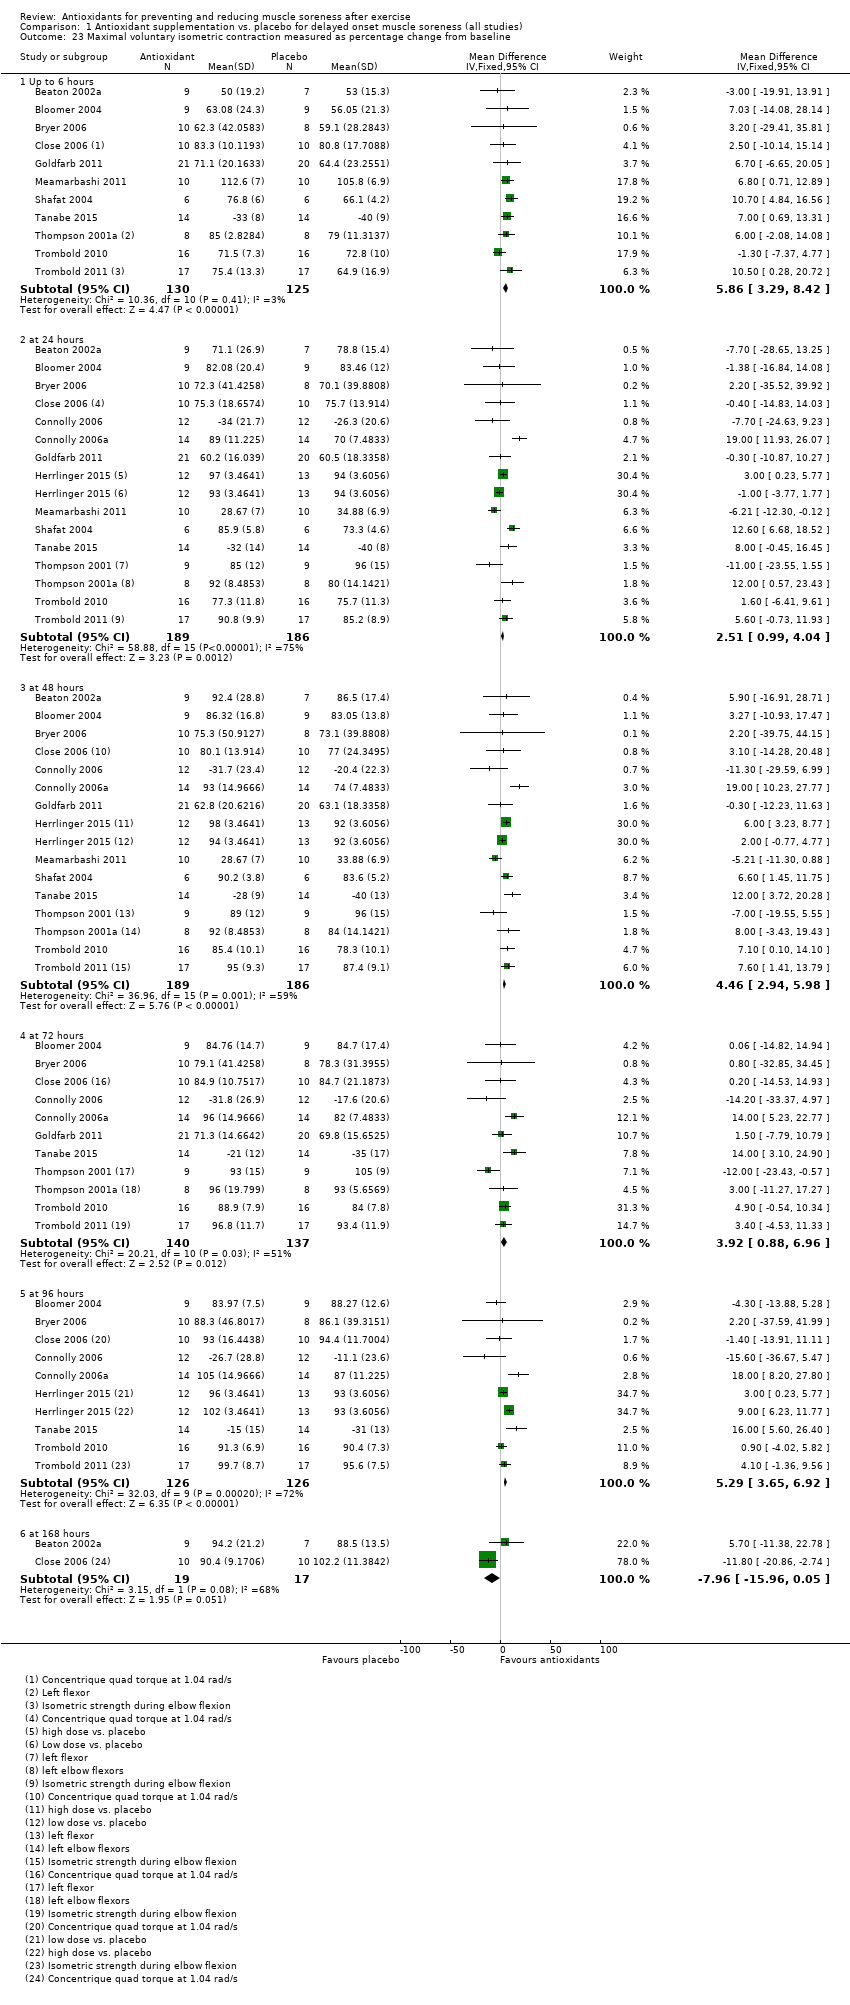
Comparison 1 Antioxidant supplementation vs. placebo for delayed onset muscle soreness (all studies), Outcome 23 Maximal voluntary isometric contraction measured as percentage change from baseline.
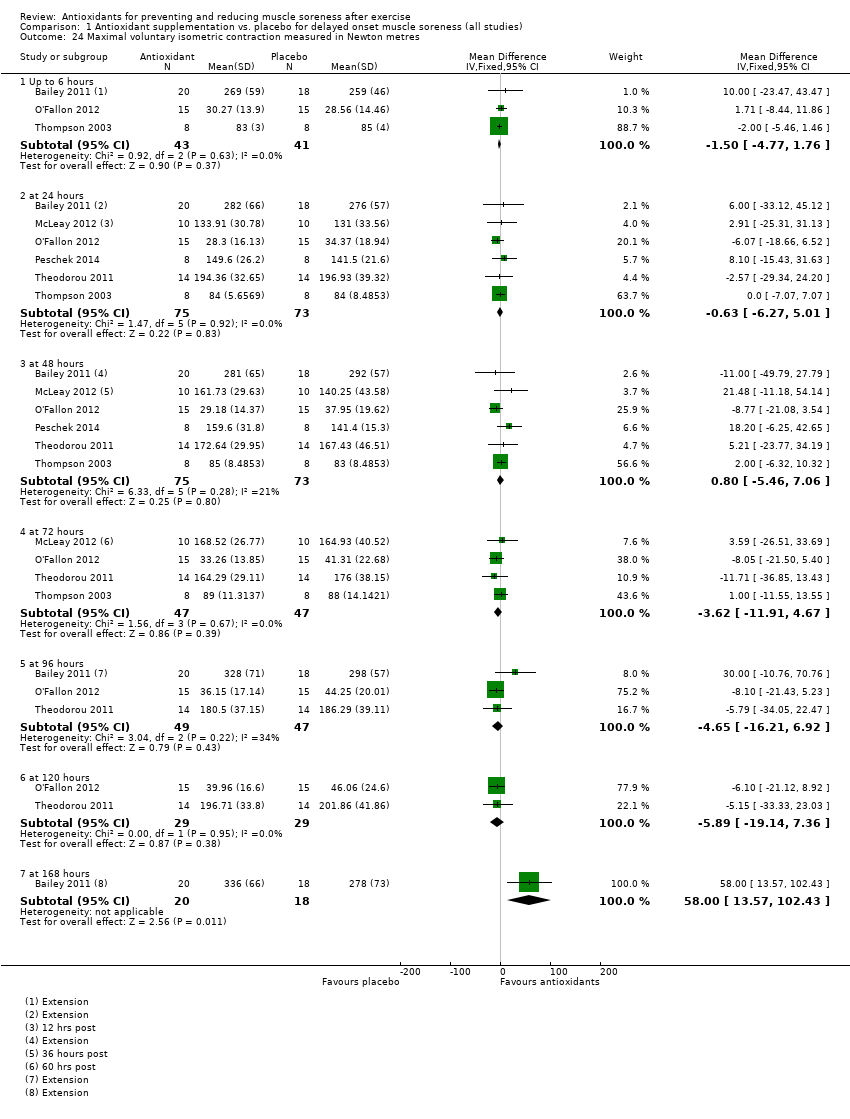
Comparison 1 Antioxidant supplementation vs. placebo for delayed onset muscle soreness (all studies), Outcome 24 Maximal voluntary isometric contraction measured in Newton metres.
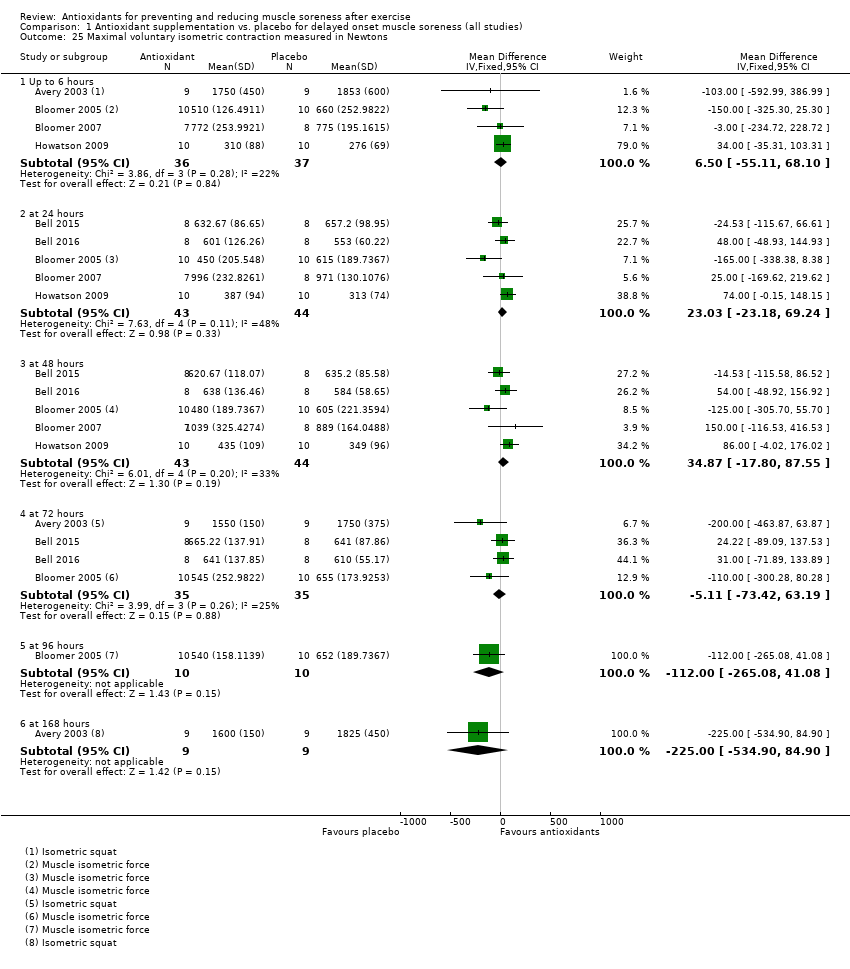
Comparison 1 Antioxidant supplementation vs. placebo for delayed onset muscle soreness (all studies), Outcome 25 Maximal voluntary isometric contraction measured in Newtons.
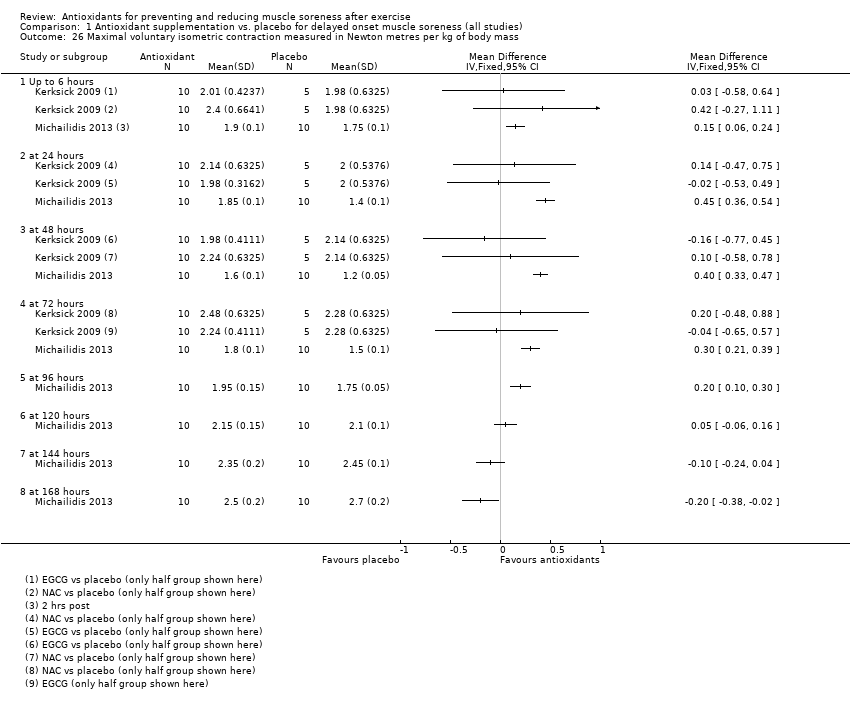
Comparison 1 Antioxidant supplementation vs. placebo for delayed onset muscle soreness (all studies), Outcome 26 Maximal voluntary isometric contraction measured in Newton metres per kg of body mass.
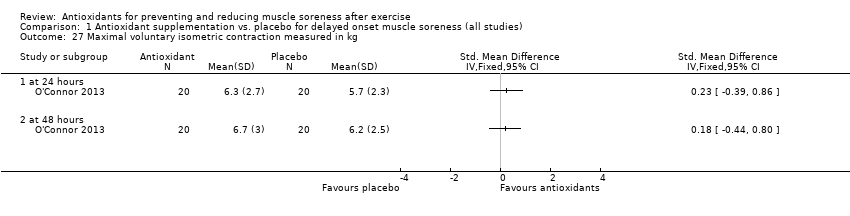
Comparison 1 Antioxidant supplementation vs. placebo for delayed onset muscle soreness (all studies), Outcome 27 Maximal voluntary isometric contraction measured in kg.
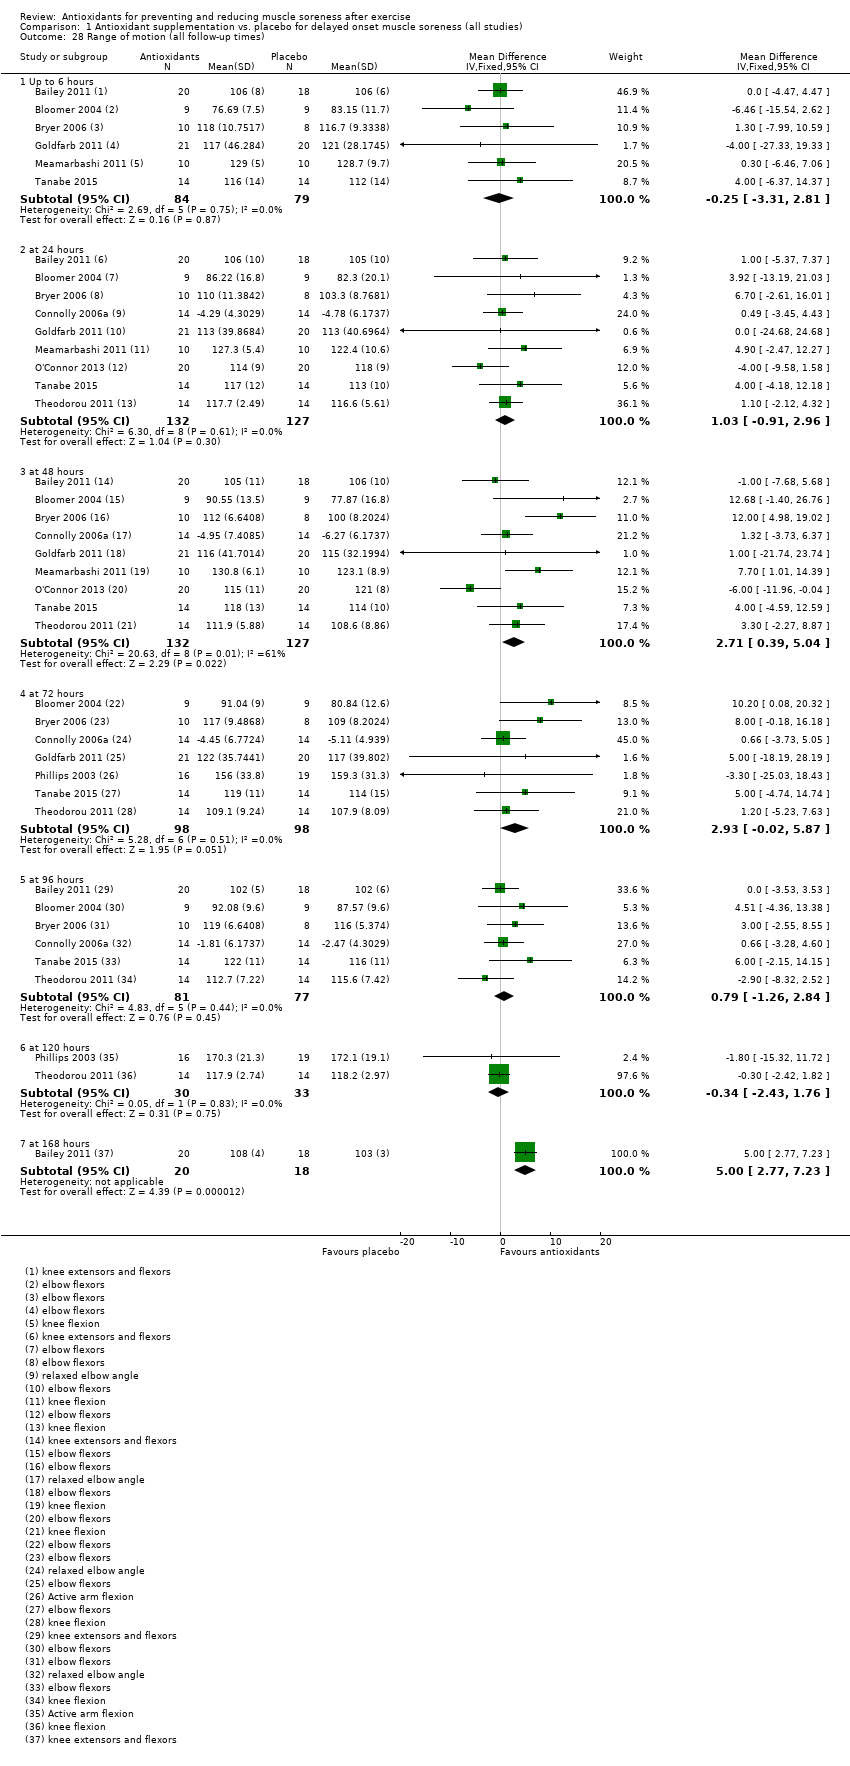
Comparison 1 Antioxidant supplementation vs. placebo for delayed onset muscle soreness (all studies), Outcome 28 Range of motion (all follow‐up times).
| Antioxidants compared with placebo or no treatment for preventing and reducing muscle soreness after exercise | ||||||
| Patient or population: mainly physically active individuals1 partaking in exercise2 designed to produce delayed onset muscle soreness Settings: controlled laboratory studies and field‐based studies Intervention: antioxidant supplements3. These fell into 3 main categories: whole natural food source (e.g. bilberry juice, cherry, pomegranate juice); antioxidant extract or mixed antioxidants (e.g. black tea extract, curcumin); and vitamin C or E or both combined. Comparison: all were placebo controls | ||||||
| Outcomes | Illustrative comparative risks (95% CI) | Relative effect (95% CI) | No of participants | Quality of the evidence | Comments | |
| Assumed risk | Corresponding risk | |||||
| Control (placebo or no antioxidants) | Antioxidant supplementation | |||||
| Muscle soreness Follow‐up: immediately up to 6 hours post‐exercise | The mean level of muscle soreness in the control group ranged from 1.0 to 8.3 cm (adjusted to a 0 to 10 cm scale) | The mean level of muscle soreness after antioxidant supplementation was 0.30 standard deviations lower | SMD ‐0.30 (‐0.56 to ‐0.04) | 525 | ⊕⊕⊝⊝ | One 'rule of thumb' is that 0.2 represents a small difference, 0.5 a moderate difference and 0.8 a large difference. Based on this 'rule of thumb', this result equates to a small to moderate difference in favour of antioxidant supplementation. However, when we rescaled the data to a 0 to 10 cm scale, the MD was lower by 0.52 cm (0.95 to 0.08 cm lower). These are all under the typical MID for pain (taken here as 1.4 cm). |
| Muscle soreness Follow‐up: 24 hours | The mean level of muscle soreness in the control group ranged from 0.21 to 8.8 cm (adjusted to a 0 to 10 cm scale) | The mean level of muscle soreness after antioxidant supplementation was 0.13 standard deviations lower | SMD ‐0.13 (‐0.27 to ‐0.00) | 936 | ⊕⊕⊕⊝ | Based on the above 'rule of thumb', this result equates to a small difference in favour of antioxidant supplementation. However, when we rescaled the data to a 0 to 10 cm scale, the MD was lower by 0.17 cm (0.42 lower to 0.07 higher). These are all under the typical MID for pain (taken here as 1.4 cm). |
| Muscle soreness Follow‐up: 48 hours | The mean level of muscle soreness in the control group ranged from 0.32 to 9.56 cm (adjusted to a 0 to 10 cm scale) | The mean level of muscle soreness after antioxidant supplementation was 0.24 standard deviations lower | SMD ‐0.24 (‐0.42 to ‐0.07) | 1047 | ⊕⊕⊝⊝ | Based on the above 'rule of thumb', this result equates to a small difference in favour of antioxidant supplementation. However, when we rescaled the data to a 0 to 10 cm scale, the MD was lower by 0.41 cm (0.69 to 0.12 lower). These are all under the typical MID for pain (taken here as 1.4 cm). |
| Muscle soreness Follow‐up: 72 hours | The mean level of muscle soreness in the control group ranged from 0.5 to 8.5 cm (adjusted to a 0 to 10 cm scale) | The mean level of muscle soreness after antioxidant supplementation was 0.19 standard deviations lower | SMD ‐0.19 (‐0.38 to ‐0.00) | 657 | ⊕⊕⊕⊝ | Based on the above 'rule of thumb', this result equates to a small difference in favour of antioxidant supplementation. When we rescaled the data to a 0 to 10 cm scale, the MD was lower by 0.29 cm (0.59 lower to 0.02 higher). These are all under the typical MID for pain (taken here as 1.4 cm). |
| Muscle soreness Follow‐up: 96 hours | The mean level of muscle soreness in the control group ranged from 0.2 to 5.6 cm (adjusted to a 0 to 10 cm scale) | The mean level of muscle soreness after antioxidant supplementation was 0.05 standard deviations lower | SMD ‐0.05 (‐0.29 to 0.19) | 436 | ⊕⊕⊝⊝ | Based on the above 'rule of thumb', this result equates to a small difference in favour of antioxidant supplementation but also includes a small effect in favour of placebo or no antioxidants. However, when we rescaled the data to a 0 to 10 cm scale, the MD was lower by 0.03 cm (0.43 lower to 0.37 higher). These are all under the typical MID for pain (taken here as 1.4 cm). |
| Subjective recovery | See comment | See comment | — | See comment | — | None of the 50 studies included in this review measured subjective recovery (return to previous activities without signs or symptoms). |
| Adverse events | See comment | See comment | — | See comment 9 studies | ⊕⊝⊝⊝ | Adverse effects were considered in only 9 studies and actual events reported in 2 studies. One study reported that all 6 participants in the antioxidant supplementation group10 had diarrhoea (5 mild, 1 severe); 4 participants also reported mild indigestion. One placebo group participant also had mild indigestion. The second study reported mild gastrointestinal distress in 1 of 26 participants taking the antioxidant supplement. |
| CI: confidence interval; RR: risk ratio; MD: mean difference; MID: minimal important difference; SMD: standardised mean difference | ||||||
| GRADE Working Group grades of evidence | ||||||
| 1Although some participants were sedentary, the majority of participants were recreationally active or moderately trained athletes. No data were included from highly trained elite athletes. Most trial participants were male. 2Muscle damage was induced either mechanically (e.g. resistance‐based exercise) or through whole body aerobic exercise (e.g. running, cycling, bench stepping). 3Typically, supplementation was taken before, the day of and after exercise for up to several days. The supplements were all taken orally, either as capsules, powders or drinks. All studies used an antioxidant dosage higher than the recommended daily amount. 4In this analysis, one study tested two antioxidants compared with placebo control. 5We downgraded the quality of evidence one level for serious study limitations (high/unclear risk of bias) and one level for serious inconsistency. 6We downgraded the quality of evidence one level for serious study limitations (high/unclear risk of bias). 7In this analysis, two studies tested two antioxidants compared with placebo control. 8We downgraded the quality of evidence one level for serious study limitations (high/unclear risk of bias) and one level for serious inconsistency. 9We downgraded the quality of evidence three levels for very serious study limitations, in particular reflecting bias relating failure to record or report on adverse events by the majority of trials. 10Notably the antioxidant used was NAC (N‐acetylcysteine), which is a prescription medicine with antioxidant properties. Listed side effects of NAC include nausea, vomiting and diarrhoea or constipation. | ||||||
| Study ID | Antioxidant (type: Ex; Vit; Whole)* | Dose** | Form taken | Regimen | Started: before exercise | Duration |
| Ex: black tea extract; theaflavin | 700 mg/day | Capsule | 4 capsules daily | 9 days | 11 days | |
| Vit: vitamin E | 992 mg (1200 IU)/day | Capsule | Not known (daily) | 21 days | 31 days | |
| Ex: mixed supplement: vitamins C, E, B6, B9, B12 and zinc | 400 mg vitamin C | Capsule | 1 capsule daily | 42 days | 6 weeks | |
| Vit: vitamin E | 1200 IU | Capsule | ? | 30 days | 30 days | |
| Whole: tart cherry | 9.2 mg/mL anthocyanins | Drink | 30 mL twice daily | 3 days | 8 days | |
| Whole: tart cherry | 73.5 mg/L total anthocyanin content | Drink | 30 mL twice daily | 4 days | 7 days | |
| Vit: vitamin C, E and selenium | 268 mg vitamin E 1 g vitamin C 90 µg selenium | Capsule | 3 capsules daily | 14 days | 18 days | |
| Ex: astaxanthin | 4 mg astaxanthin 480 mg lutein | Capsule | 2 capsules daily | 21 days | 25 days | |
| Vit: vitamin C and E | 1000 mg of vitamin C 378 mg vitamin E | Capsule | 2 capsules daily | 14 days | 14 days | |
| Vit: vitamin C | 3 g/day vitamin C | Capsule | 3 capsules daily | 14 days | 18 days | |
| Vit: vitamin C | 1 g/day vitamin C | ? | ? | 0 days (day of exercise) | 14 days | |
| Ex: N‐acetyl‐cysteine | 50 mg/kg/day | Powder dissolved in water | 50 mg/kg/day once daily dissolved in 500 mL water | 1 hour | 6 days | |
| Vit: vitamin C | 1 g/day vitamin C | Capsule | 3 capsules daily | 3 days | 8 days | |
| Whole: cherry | 600 mg phenolic compounds 40 mg anthocyanins | Drink | 2 x 12 oz bottle daily | 4 days | 8 days | |
| Ex: curcumin | 400 mg/day curcumin | Capsule | 2 capsules daily | 2 days | 5 days | |
| Ex: Juice Plus powder | 7.5 mg beta‐carotene 276 mg vitamin C | Capsule | 6 capsules daily | 4 days | 8 days | |
| Vit: vitamin C and vitamin E | 100 mg of vitamin C 268 mg (400 IU) of vitamin E | Capsule | ? | 14 days | 17 days | |
| Ex: black and green tea | High‐dose = 2000 mg per Low‐dose = 1000 mg per day polyphenolic blend | Capsule | 4 capsules daily | 91 days | 91 days | |
| Whole: cherry | 600 mg phenolic compounds expressed as gallic acid equivalents, 32 g of carbohydrate and at least 40 mg of anthocyanins | Drink | 2 x 8 fl oz bottles per day | 5 days | 7 days | |
| Whole: blackcurrant nectar | 193.25 mg/day of malvidin glucosides 175.69 mg/day of cyanidin glucosides | Drink | 16 oz bottle per day | 8 days | 8 days | |
| Vit: vitamin C | 1 g/day vitamin C | Capsule | 3 capsules daily | 3 days | 10 days | |
| Ex: N‐acetyl‐cysteine and epigallocatechin gallate (EGCG) | 1800 mg/day N‐acetyl‐cysteine (NAC) 1800 mg/day epigallocatechin gallate (EGCG) | Drink | ? | 14 days | 14 days | |
| Ex: pollen extract | 30,000 units per gram of Polbax | ? | ? | 28 days | 28 days | |
| Whole: cherry | 600 mg phenolic compounds 40 mg anthocyanins | Drink | 2 x 335 mL bottles daily | 7 days | 15 days | |
| Ex: resveratrol | 600 mg/day of resveratrol | Capsules | 6 capsules daily | 7 days | 9 days | |
| Whole: bilberry juice | Total phenol content per 200 mL serving was 744.14 ± 81.75 mg (n = 3) and 80.04 ± 3.51 mg (n = 3) of total anthocyanins | Drink | 2 x 200 mL daily | 5 days | 8 days | |
| Vit: vitamin E | 992 mg/day of vitamin E (1200 IU) | Capsules | 1 capsule daily | 14 days | 14 days | |
| Whole: cherry | 9.117 mg/mL anthocyanins | Drink | 90 mL daily (2 x 30 mL) | 6 days | 6 days | |
| Ex: curcumin | 400 mg/day curcumin | Capsules | Capsules | 2 days | 6 days | |
| Whole: blueberry smoothie | Per 100 mL: total phenolics 168 mg/gallic acid equ.; anthocyanins 96.6 mg; phenolic acid 26 mg, | Drink | 200 g blueberries, 50 g banana + 200 mL apple juice daily | 0 days (day of exercise) | 4 days | |
| Ex: purslane extract | 1200 mg/day purslane extract | Capsules | 2 capsules daily | 3 days | 5 days | |
| Vit: N‐acetyl‐cysteine | 20 mg/kg/day N‐acetyl‐cysteine | Drink | 3 x 500 mL drink daily | 0 days (day of exercise) | 9 days | |
| Ex: curcumin | 2.5 g/day of curcumin | Capsules | 10 capsules daily (2 x 5 capsules) | 2.5 days | 5 days | |
| Vit: vitamin C | 800 mg/day vitamin C | Capsules | ? | 3 hours | 2 days | |
| Whole: grape juice | 1.75 mg/kg resveratrol 19.7 mg/kg catechin 12.6 mg/kg 31.7 mg/kg peonidin 125 mg/kg cyanidin 145.2 mg/kg 32.6 mg/kg quercetin 5.6 mg/kg kaempferol 6.8 mg/kg isorhamnetin | Drink (dissolved powder) | 1 serving of powder daily mixed with 236 mL of water | 45 days | 50 days | |
| Ex: quercetin | 1000 mg/day quercetin | Bar | 2 bars daily | 7 days | 7 days | |
| Whole: cocoa | 350 mg/day flavanols | Drink | 240 mL daily | 0 days (day of exercise) | 3 days | |
| Ex: mixed antioxidants | 300 mg/day tocopherols 800 mg/day docosahexaenoate 300 mg/day flavonoids of which was 100 mg hesperetin and 200 mg quercetin | Capsules | Vitamin E: 1 capsule; docosahexaenoate: 3 capsules; flavonoids: 3 capsules | 14 days | 14 days | |
| Vit: vitamin C + vitamin E | 500 mg/day vitamin C 992 mg/day (1200 IU/day) vitamin E | Capsules | ? | ? | 37 days | |
| Ex: N‐acetyl‐cysteine | 10 mg/kg/day of body mass N‐acetyl‐cysteine | Capsules | 1 capsule daily | 14 days | 21 days | |
| Vit: vitamin E | 536 mg/day (800 IU/day) vitamin E | Capsules | 1 capsule daily | 14 days | 21 days | |
| Ex: allicin | 80 mg/day allicin | Capsules | Capsules | 14 days | 16 days | |
| Ex: curcumin | 150 mg/day curcumin | Capsules | 6 capsules daily | 0 days (day of exercise; 1 hour before) | 1 day | |
| Vit: vitamin C + vitamin E | 1 g/day vitamin C 268 mg/day (1200 IU/day) vitamin E | Capsules | 1 capsule daily | 28 days | 77 days | |
| Vit: vitamin C | 1 g/day vitamin C | Drink | ? | 0 days (day of exercise; 2 hours before) | 1 day | |
| Vit: vitamin C | 1 g/day of vitamin C on day 1 followed by 400 mg/day divided into 2 doses for 12 days | Drink and capsules | 1 g given in a solution followed by 400 mg/day doses in capsules | 14 days | 14 days | |
| Vit: vitamin C | 200 mg/day vitamin C | Drink | Daily drink | 0 days (day of exercise) | 3 days | |
| Vit: vitamin C | 200 mg/day vitamin C | Drink | Daily drink | 14 days | 14 days | |
| Whole: pomegranate juice | 650 mg/day polyphenols, consisting of 95.5% ellagitannins, 3.5% ellagic acid and 1% anthocyanins | Drink | 960 mL per day (as 2 x 480 mL drinks) | 9 days | 32 days | |
| Whole: pomegranate juice | 3958 mg/L of tannins 768 mg/L anthocyanins 242 mg/L of ellagic derivatives | Drink | 500 mL per day (as 2 x 250 mL drinks) | 15 days | 44 days | |
| * Types: Extract, mixed or other (e.g. amino‐acid derivative) antioxidants; Vitamin; and Whole natural food source. | ||||||
| Study ID | Outcome measure | Score (higher = worse) | Timing post‐exercise | Data extraction |
| Muscle soreness during a squat | VAS (0 to 10 cm) | 24, 48 hours | Text (SDs from SEs) | |
| Muscle soreness during shoulder abduction, shoulder horizontal adduction and hip flexion (unloaded squat) | VAS (0 to 10 cm) | 24, 48, 72 hours | Text | |
| General soreness at the quadriceps | VAS (1 to 10 cm) | 24, 48 hours | Text | |
| General soreness at the quadriceps | VAS (0 to 10 cm) | 48 hours | Text | |
| Muscle soreness during a squat | VAS (0 to 200 mm) | 24, 48, 72 hours | Raw data provided by the authors | |
| Muscle soreness during a squat | VAS (0 to 200 mm) | 24, 48, 72 hours | Raw data provided by the authors | |
| Active movement of elbow flexion or extension, as well as following light palpitation by the investigators | VAS (0 to 10 cm) | 0, 2, 6, 24, 48, 72, 96 hours | Raw data provided by the authors | |
| Dominant leg during knee extension | VAS (0 to 10 cm) | 0, 10, 24, 48, 72, 96 hours | Raw data provided by the authors Immediate pain data used for the up to 6 hours analysis | |
| Performance of 2 (concentric‐eccentric) repetitions of the barbell bench press exercise using a standard 20 kg barbell | VAS (0 to 10 cm) | 0, 24, 48 hours | Raw data provided by the authors | |
| Delayed onset muscle soreness was assessed in a rested position and in response to palpation on the muscle of the arms | VAS (1 to 10 cm) | 0, 4, 24, 48, 72, 96 hours | Text (SDs from SEs) Immediate pain data used for the up to 6 hours analysis | |
| Delayed onset muscle soreness was measured at the gastrocnemius, anterior tibialis, hamstrings, quadriceps, gluteals (both sides) and lower back muscles | VAS (0 to 10 cm) | 0, 24, 48, 72, 96, 168, 336 hours | Raw data provided by the authors Immediate pain data used for the up to 6 hours analysis | |
| Total muscle soreness after performing a 90 degree squat | VAS (0 to 12 cm) | 0, 24, 48, 50, 72, 96, 98 hours | Raw data provided by the authors Immediate pain data used for the up to 6 hours analysis | |
| General delayed onset muscle soreness assessed at the quadriceps | VAS (0 to 10 cm) | 24, 48, 72, 96 hours | Text | |
| Pain scores were obtained by asking participants to verbally rate their overall discomfort during active elbow flexion and extension | VAS (0 to 10 cm) | 24, 48, 72, 96 hours | Text (SDs from SEs) | |
| Muscle soreness during descending and climbing stairs. The following 8 sites were measured: anterior right thigh, posterior right thigh, anterior right leg, posterior right leg, anterior left thigh, posterior left thigh, anterior left leg, posterior left leg and added together for a total score. | VAS (0 to 4) | 48 hours | Raw data provided by the authors | |
| Delayed onset muscle soreness was measured at the elbow flexor with the arm rested | VAS (1 to 10 cm) | 0, 2, 6, 24, 48, 72 hours | Text (SDs from SEs) Immediate pain data used for the up to 6 hours analysis | |
| Delayed onset muscle soreness of the quadriceps, hamstrings, gluteus, gastrocnemius and tibialis anterior | VAS (0 to 6) | 0, 24, 48, 72 hours | Raw data provided by the authors Immediate pain data used for the up to 6 hours analysis | |
| Soreness was assessed in a variety of muscle groups including the gastrocnemius, hamstrings, quadriceps, gluteus maximus, lower back, abdominals and the whole body | Likert (0 to 7) | 24, 48, 72, 96 hours | The authors of Herrlinger 2015 were contacted on 2 February 2017 and again on 18February 2017 for missing data as these were not available in the manuscript and could not be extracted from graphs. No response was received and this study was therefore included in the qualitative analysis but not the quantitative analysis. | |
| Squat down to 90 degrees (internal joint angle) rise to the start position | VAS (0 to 200 mm) | 0, 24, 48 hours | Text Immediate pain data used for the up to 6 hours analysis | |
| Full range squat with no external weight | VAS (0 to 10 cm) | 24, 48, 72 hours | Text (SDs from SEs) | |
| General delayed onset muscle soreness was monitored by self‐reporting | VAS (1 to 10 cm) | 0, 10, 24, 48, 58, 72, 96 hours | Raw data provided by the authors Immediate pain data used for the up to 6 hours analysis | |
| Delayed onset muscle soreness was assessed at the quadriceps | VAS (0 to 10 cm) | 6, 24, 48 hours | Raw data provided by the authors 6 hours post‐exercise data used for the up to 6 hours analysis | |
| General soreness | VAS (0 to 10 cm) | 24, 48, 72, 96, 120 hours | Text (SDs from SEs) | |
| General soreness in the legs | VAS (0 to 100 mm) | 0 hours | Text Immediate pain data used for the up to 6 hours analysis | |
| General soreness in both legs | VAS (0 to 10 cm) | 24 hours | Raw data provided by the authors | |
| Squat to a 90 angle and returning to a standing position | VAS (0 to 200 mm) | 0, 24, 48 hours | Text Immediate pain data used for the up to 6 hours analysis | |
| General soreness | VAS (0 to 10 cm) | 24, 48 hours | Text (SDs from SEs) | |
| Upper body, upper legs, lower legs and overall body | VAS (0 to 10 cm) | 24, 48, 72, 96, 120, 144 hours | This study was only included in the qualitative analysis because the exercise paradigm was completely different to all the other studies included in this review | |
| Muscle soreness measured using a gauge. Pressure was applied using standard force (20 to 30 N) over the distal, middle and proximal thigh in a seated position with the knee fully extended and relaxed. The 3 ratings for each quadricep were added together. | VAS (0 to 10 cm) | 24, 48, 72, 96 hours | Text (SDs from SEs) | |
| Step up (concentric muscle action) onto a 40 cm box then step down (eccentric muscular contraction) and the soreness was rated | VAS (0 to 10 cm) | 24, 48, 72 hours | Text | |
| Participants were requested to rate the general discomfort in only the quadriceps and calf regions of the right leg | VAS (0 to 6) | 0, 24, 48 hours | Text Immediate pain data used for the up to 6 hours analysis | |
| Palpation of the muscle belly and the distal region of the vastus medialis, vastus lateralis and rectus femoris after a squat | VAS (1 to 10 cm) | 0, 2, 24, 48, 72, 96, 120, 144, 168 hours | Text Immediate pain data used for the up to 6 hours analysis | |
| Pain was rated for single leg squat, walking downstairs, passive strength of the gluteals and single leg vertical jump | VAS (0 to 10 cm) | 0, 24, 48 hours | Raw data provided by the authors Immediate pain data used for the up to 6 hours analysis | |
| Perceived soreness was done during quadriceps extension | VAS (0 to 10 cm) | 0, 24, 48 hours | Text Immediate pain data used for the up to 6 hours analysis | |
| Delayed onset muscle soreness in the arm was rated in response to isometric strength measurement | VAS (0 to 100 mm) | 24, 48 hours | Text | |
| Delayed onset muscle soreness at the elbow flexor | VAS (0 to 100 mm) | 24, 48, 72, 96, 120 hours | Raw data provided by the authors | |
| Delayed onset muscle soreness at the legs | VAS (0 to 10 cm) | 24, 48 hours | Text | |
| Soreness measures were subjectively evaluated through palpitation for oedema at he elbow | VAS (0 to 10 cm) | 72, 168 hours | Text (SDs from SEs) | |
| Delayed onset muscle soreness was evaluated using a questionnaire employing a visual analogue scale for a total of 8 sites (6 sites on the anterior muscle of the upper leg and 2 sites on the posterior muscles of the upper leg). The participants were asked to palpate the relaxed muscle and rate soreness. | VAS (1 to 10 cm) (x 8): 8 to 80 score | 24, 48 hours | Text | |
| Delayed onset muscle soreness at the elbow flexor | VAS (0 to 10 cm) | 48, 96, 168 hours | Text | |
| Muscle soreness of the biceps muscle was assessed | VAS (0 to 10 cm) | 48, 96, 168 hours | Text (SDs from SEs) | |
| At the beginning of the exercise test, participants were instructed to give CR‐10 values | Borg CR (0‐10) | 0, 24, 48 hours | Text (SDs from SEs) Immediate pain data used for the up to 6 hours analysis | |
| Palpitation of the upper arm and passively extending the elbow joint | VAS (0 to 100 mm) | 0, 24. 48, 72, 96 hours | Raw data provided by the authors Immediate pain data used for the up to 6 hours analysis | |
| Squat using body weight | VAS (0 to 10 cm) | 24, 48, 72, 96, 120 hours | Text | |
| Actively contracted the quadriceps | VAS (1 to 10 cm) | 24, 48, 72 hours | Text (SDs from SEs); there are no decimal places; where SE = 0, we have put this as 0.4 (SD = 1.2) | |
| Actively contracted the quadriceps | VAS (0 to 100 mm) | 24, 48, 72 hours | Text (SDs from SEs) | |
| Actively contracted the quadriceps | VAS (1 to 10 cm) | 24, 48, 72 hours | Text (SDs from SEs); there are no decimal places; where SE = 0, we have put this as 0.4 (SD = 1.1313) | |
| Actively contracting the leg extensors against resistance equivalent to 75% of each individual's 1 repetition maximum | VAS (0 to 10 cm) | 24, 48, 72 hours | Raw data provided by the authors | |
| Unloaded elbow flexion of the tested arm | VAS (0 to 10 cm) | 2, 24, 48, 72, 96 hours | Raw data provided by the authors 2 hours post‐exercise data used for the up to 6 hours analysis | |
| Unloaded elbow flexion and knee extension on the tested arm and leg | VAS (0 to 10 cm) | 2, 24, 48, 72, 96 hours | Raw data provided by the authors 2 hours post‐exercise data used for the up to 6 hours analysis | |
| SD: standard deviation | ||||
| Follow‐up times | No. studies | No. participants | SMD (95% CI) |
| Up to 6 hours | 21 | 525 | ‐0.31 (‐0.49 to ‐0.13) |
| 24 hours | 41 | 936 | ‐0.13 (‐0.26 to ‐0.00) |
| 48 hours | 45 | 1047 | ‐0.22 (‐0.34 to ‐0.09) |
| 72 hours | 28 | 657 | ‐0.17 (‐0.33 to ‐0.02) |
| 96 hours | 17 | 436 | ‐0.04 (‐0.23 to 0.16) |
| 120 hours | 4 | 128 | 0.25 (‐0.12 to 0.61) |
| 144 hours | 1 | 20 | ‐0.23 (‐1.11 to 0.65) |
| 168 hours | 4 | 80 | ‐0.04 (‐0.48 to 0.41) |
| CI: confidence interval | |||
| Follow‐up times | All studies | Parallel group studies only | ||
| No. studies | SMD (95% CI) | No. studies | SMD (95% CI) | |
| Up to 6 hours | 21 | ‐0.30 (‐0.56 to ‐0.04) | 15 | ‐0.35 (‐0.67 to ‐0.03) |
| 24 hours | 41 | ‐0.13 (‐0.27 to 0.00) | 32 | ‐0.08 (‐0.25 to 0.08) |
| 48 hours | 45 | ‐0.24 (‐0.42 to ‐0.07) | 34 | ‐0.19 (‐0.40 to 0.01) |
| 72 hours | 28 | ‐0.19 (‐0.38 to ‐0.00) | 22 | ‐0.11 (‐0.30 to 0.08) |
| 96 hours | 17 | ‐0.05 (‐0.29 to 0.19) | 12 | 0.01 (‐0.33 to 0.34) |
| Table produced independently of the authors by Newton Opiyo and checked by Helen Handoll | ||||
| Outcome or subgroup title | No. of studies | No. of participants | Statistical method | Effect size |
| 1 Muscle soreness up to 6 hours; random‐effects model Show forest plot | 21 | 525 | Std. Mean Difference (IV, Random, 95% CI) | ‐0.30 [‐0.56, ‐0.04] |
| 2 Muscle soreness at 24 hours; random‐effects model Show forest plot | 41 | 936 | Std. Mean Difference (IV, Random, 95% CI) | ‐0.13 [‐0.27, 0.00] |
| 3 Muscle soreness at 48 hours; random‐effects model Show forest plot | 45 | 1047 | Std. Mean Difference (IV, Random, 95% CI) | ‐0.24 [‐0.42, ‐0.07] |
| 4 Muscle soreness at 72 hours; random‐effects model Show forest plot | 28 | 657 | Std. Mean Difference (IV, Random, 95% CI) | ‐0.19 [‐0.38, ‐0.00] |
| 5 Muscle soreness at 96 hours; random‐effects model Show forest plot | 17 | 436 | Std. Mean Difference (IV, Random, 95% CI) | ‐0.05 [‐0.29, 0.19] |
| 6 Muscle soreness (follow‐ups: 120, 144 and 168 hours); random‐effects model Show forest plot | 7 | Std. Mean Difference (IV, Random, 95% CI) | Subtotals only | |
| 6.1 at 120 hours | 4 | 128 | Std. Mean Difference (IV, Random, 95% CI) | 0.21 [‐0.26, 0.69] |
| 6.2 at 144 hours | 1 | 20 | Std. Mean Difference (IV, Random, 95% CI) | ‐0.23 [‐1.11, 0.65] |
| 6.3 at 168 hours | 4 | 80 | Std. Mean Difference (IV, Random, 95% CI) | ‐0.04 [‐0.48, 0.41] |
| 7 Muscle soreness up to 6 hours ‐ all at same scale (0 to 10; worst pain) Show forest plot | 21 | 525 | Mean Difference (IV, Random, 95% CI) | ‐0.52 [‐0.95, ‐0.08] |
| 8 Muscle soreness at 24 hours ‐ all at same scale (0 to 10; worst pain) Show forest plot | 41 | 936 | Mean Difference (IV, Random, 95% CI) | ‐0.17 [‐0.42, 0.07] |
| 9 Muscle soreness at 48 hours ‐ all at same scale (0 to 10; worst pain) Show forest plot | 45 | 1047 | Mean Difference (IV, Random, 95% CI) | ‐0.41 [‐0.69, ‐0.12] |
| 10 Muscle soreness at 72 hours ‐ all at same scale (0 to 10; worst pain) Show forest plot | 28 | 657 | Mean Difference (IV, Random, 95% CI) | ‐0.29 [‐0.59, 0.02] |
| 11 Muscle soreness at 96 hours ‐ all at same scale (0 to 10; worst pain) Show forest plot | 17 | 436 | Mean Difference (IV, Random, 95% CI) | ‐0.03 [‐0.43, 0.37] |
| 12 Muscle soreness at 24 hours. Subgroup analysis by type of exercise (whole body aerobic vs. mechanically induced) Show forest plot | 41 | 936 | Std. Mean Difference (IV, Random, 95% CI) | ‐0.13 [‐0.27, 0.00] |
| 12.1 Whole body aerobic exercise | 17 | 338 | Std. Mean Difference (IV, Random, 95% CI) | ‐0.07 [‐0.33, 0.18] |
| 12.2 Mechanically induced | 24 | 598 | Std. Mean Difference (IV, Random, 95% CI) | ‐0.18 [‐0.34, ‐0.01] |
| 13 Muscle soreness at 48 hours. Subgroup analysis by type of exercise (whole body aerobic vs. mechanically induced) Show forest plot | 45 | 1047 | Std. Mean Difference (IV, Random, 95% CI) | ‐0.24 [‐0.42, ‐0.07] |
| 13.1 Whole body aerobic exercise | 17 | 349 | Std. Mean Difference (IV, Random, 95% CI) | ‐0.12 [‐0.47, 0.23] |
| 13.2 Mechanically induced | 28 | 698 | Std. Mean Difference (IV, Random, 95% CI) | ‐0.31 [‐0.50, ‐0.12] |
| 14 Muscle soreness at 24 hours. Subgroup analysis by funding sources (funded by food company or provider of antioxidant supplements vs. not funded by food company or provider of antioxidant supplements) Show forest plot | 40 | 920 | Std. Mean Difference (IV, Fixed, 95% CI) | ‐0.13 [‐0.26, 0.01] |
| 14.1 Company funding | 17 | 427 | Std. Mean Difference (IV, Fixed, 95% CI) | ‐0.11 [‐0.31, 0.08] |
| 14.2 Other funding | 23 | 493 | Std. Mean Difference (IV, Fixed, 95% CI) | ‐0.14 [‐0.32, 0.05] |
| 15 Muscle soreness at 48 hours. Subgroup analysis by funding sources (funded by food company or provider of antioxidant supplements vs. not funded by food company or provider of antioxidant supplements) Show forest plot | 44 | 1031 | Std. Mean Difference (IV, Fixed, 95% CI) | ‐0.21 [‐0.34, ‐0.09] |
| 15.1 Company funding | 18 | 443 | Std. Mean Difference (IV, Fixed, 95% CI) | ‐0.19 [‐0.38, 0.00] |
| 15.2 Other funding | 26 | 588 | Std. Mean Difference (IV, Fixed, 95% CI) | ‐0.23 [‐0.40, ‐0.06] |
| 16 Muscle tenderness measured in Newtons (all follow‐up times) Show forest plot | 2 | Mean Difference (IV, Fixed, 95% CI) | Subtotals only | |
| 16.1 at 24 hours | 2 | 52 | Mean Difference (IV, Fixed, 95% CI) | ‐1.60 [‐7.64, 4.45] |
| 16.2 at 48 hours | 2 | 52 | Mean Difference (IV, Fixed, 95% CI) | ‐2.14 [‐9.48, 5.19] |
| 16.3 at 72 hours | 2 | 52 | Mean Difference (IV, Fixed, 95% CI) | ‐0.34 [‐6.55, 5.86] |
| 16.4 at 96 hours | 2 | 52 | Mean Difference (IV, Fixed, 95% CI) | ‐2.32 [‐9.62, 4.99] |
| 17 Muscle tenderness measured in kg (all follow‐up times) Show forest plot | 2 | Mean Difference (IV, Fixed, 95% CI) | Subtotals only | |
| 17.1 Up to 6 hours | 1 | 20 | Mean Difference (IV, Fixed, 95% CI) | ‐0.61 [‐14.10, 12.88] |
| 17.2 at 24 hours | 2 | 36 | Mean Difference (IV, Fixed, 95% CI) | 0.53 [‐0.95, 2.01] |
| 17.3 at 48 hours | 2 | 36 | Mean Difference (IV, Fixed, 95% CI) | 0.52 [‐1.08, 2.13] |
| 17.4 at 72 hours | 1 | 20 | Mean Difference (IV, Fixed, 95% CI) | ‐1.03 [‐13.01, 10.95] |
| 17.5 at 96 hours | 1 | 20 | Mean Difference (IV, Fixed, 95% CI) | ‐1.39 [‐15.12, 12.33] |
| 18 30‐second Wingate average peak power output (W/kg) (post 7 days of intervention) Show forest plot | 1 | Mean Difference (IV, Fixed, 95% CI) | Totals not selected | |
| 19 20 m Sprint time (s) Show forest plot | 1 | Mean Difference (IV, Fixed, 95% CI) | Totals not selected | |
| 19.1 at 24 hours | 1 | Mean Difference (IV, Fixed, 95% CI) | 0.0 [0.0, 0.0] | |
| 19.2 at 48 hours | 1 | Mean Difference (IV, Fixed, 95% CI) | 0.0 [0.0, 0.0] | |
| 19.3 at 120 hours | 1 | Mean Difference (IV, Fixed, 95% CI) | 0.0 [0.0, 0.0] | |
| 20 Maximal oxygen consumption (mL/kg/min) (post 42 days of supplementation) Show forest plot | 1 | Mean Difference (IV, Fixed, 95% CI) | Totals not selected | |
| 21 Agility (seconds) Show forest plot | 1 | Mean Difference (IV, Fixed, 95% CI) | Totals not selected | |
| 21.1 at 24 hours | 1 | Mean Difference (IV, Fixed, 95% CI) | 0.0 [0.0, 0.0] | |
| 21.2 at 48 hours | 1 | Mean Difference (IV, Fixed, 95% CI) | 0.0 [0.0, 0.0] | |
| 21.3 at 72 hours | 1 | Mean Difference (IV, Fixed, 95% CI) | 0.0 [0.0, 0.0] | |
| 22 6 second sprint maximal power (Watts) (all follow‐up times) Show forest plot | 1 | Mean Difference (IV, Fixed, 95% CI) | Totals not selected | |
| 22.1 at 24 hours | 1 | Mean Difference (IV, Fixed, 95% CI) | 0.0 [0.0, 0.0] | |
| 22.2 at 48 hours | 1 | Mean Difference (IV, Fixed, 95% CI) | 0.0 [0.0, 0.0] | |
| 22.3 at 72 hours | 1 | Mean Difference (IV, Fixed, 95% CI) | 0.0 [0.0, 0.0] | |
| 23 Maximal voluntary isometric contraction measured as percentage change from baseline Show forest plot | 15 | Mean Difference (IV, Fixed, 95% CI) | Subtotals only | |
| 23.1 Up to 6 hours | 11 | 255 | Mean Difference (IV, Fixed, 95% CI) | 5.86 [3.29, 8.42] |
| 23.2 at 24 hours | 15 | 375 | Mean Difference (IV, Fixed, 95% CI) | 2.51 [0.99, 4.04] |
| 23.3 at 48 hours | 15 | 375 | Mean Difference (IV, Fixed, 95% CI) | 4.46 [2.94, 5.98] |
| 23.4 at 72 hours | 11 | 277 | Mean Difference (IV, Fixed, 95% CI) | 3.92 [0.88, 6.96] |
| 23.5 at 96 hours | 9 | 252 | Mean Difference (IV, Fixed, 95% CI) | 5.29 [3.65, 6.92] |
| 23.6 at 168 hours | 2 | 36 | Mean Difference (IV, Fixed, 95% CI) | ‐7.96 [‐15.96, 0.05] |
| 24 Maximal voluntary isometric contraction measured in Newton metres Show forest plot | 6 | Mean Difference (IV, Fixed, 95% CI) | Subtotals only | |
| 24.1 Up to 6 hours | 3 | 84 | Mean Difference (IV, Fixed, 95% CI) | ‐1.50 [‐4.77, 1.76] |
| 24.2 at 24 hours | 6 | 148 | Mean Difference (IV, Fixed, 95% CI) | ‐0.63 [‐6.27, 5.01] |
| 24.3 at 48 hours | 6 | 148 | Mean Difference (IV, Fixed, 95% CI) | 0.80 [‐5.46, 7.06] |
| 24.4 at 72 hours | 4 | 94 | Mean Difference (IV, Fixed, 95% CI) | ‐3.62 [‐11.91, 4.67] |
| 24.5 at 96 hours | 3 | 96 | Mean Difference (IV, Fixed, 95% CI) | ‐4.65 [‐16.21, 6.92] |
| 24.6 at 120 hours | 2 | 58 | Mean Difference (IV, Fixed, 95% CI) | ‐5.89 [‐19.14, 7.36] |
| 24.7 at 168 hours | 1 | 38 | Mean Difference (IV, Fixed, 95% CI) | 58.0 [13.57, 102.43] |
| 25 Maximal voluntary isometric contraction measured in Newtons Show forest plot | 6 | Mean Difference (IV, Fixed, 95% CI) | Subtotals only | |
| 25.1 Up to 6 hours | 4 | 73 | Mean Difference (IV, Fixed, 95% CI) | 6.50 [‐55.11, 68.10] |
| 25.2 at 24 hours | 5 | 87 | Mean Difference (IV, Fixed, 95% CI) | 23.03 [‐23.18, 69.24] |
| 25.3 at 48 hours | 5 | 87 | Mean Difference (IV, Fixed, 95% CI) | 34.87 [‐17.80, 87.55] |
| 25.4 at 72 hours | 4 | 70 | Mean Difference (IV, Fixed, 95% CI) | ‐5.11 [‐73.42, 63.19] |
| 25.5 at 96 hours | 1 | 20 | Mean Difference (IV, Fixed, 95% CI) | ‐112.0 [‐265.08, 41.08] |
| 25.6 at 168 hours | 1 | 18 | Mean Difference (IV, Fixed, 95% CI) | ‐225.0 [‐534.90, 84.90] |
| 26 Maximal voluntary isometric contraction measured in Newton metres per kg of body mass Show forest plot | 2 | Mean Difference (IV, Fixed, 95% CI) | Totals not selected | |
| 26.1 Up to 6 hours | 2 | Mean Difference (IV, Fixed, 95% CI) | 0.0 [0.0, 0.0] | |
| 26.2 at 24 hours | 2 | Mean Difference (IV, Fixed, 95% CI) | 0.0 [0.0, 0.0] | |
| 26.3 at 48 hours | 2 | Mean Difference (IV, Fixed, 95% CI) | 0.0 [0.0, 0.0] | |
| 26.4 at 72 hours | 2 | Mean Difference (IV, Fixed, 95% CI) | 0.0 [0.0, 0.0] | |
| 26.5 at 96 hours | 1 | Mean Difference (IV, Fixed, 95% CI) | 0.0 [0.0, 0.0] | |
| 26.6 at 120 hours | 1 | Mean Difference (IV, Fixed, 95% CI) | 0.0 [0.0, 0.0] | |
| 26.7 at 144 hours | 1 | Mean Difference (IV, Fixed, 95% CI) | 0.0 [0.0, 0.0] | |
| 26.8 at 168 hours | 1 | Mean Difference (IV, Fixed, 95% CI) | 0.0 [0.0, 0.0] | |
| 27 Maximal voluntary isometric contraction measured in kg Show forest plot | 1 | Std. Mean Difference (IV, Fixed, 95% CI) | Totals not selected | |
| 27.1 at 24 hours | 1 | Std. Mean Difference (IV, Fixed, 95% CI) | 0.0 [0.0, 0.0] | |
| 27.2 at 48 hours | 1 | Std. Mean Difference (IV, Fixed, 95% CI) | 0.0 [0.0, 0.0] | |
| 28 Range of motion (all follow‐up times) Show forest plot | 10 | Mean Difference (IV, Fixed, 95% CI) | Subtotals only | |
| 28.1 Up to 6 hours | 6 | 163 | Mean Difference (IV, Fixed, 95% CI) | ‐0.25 [‐3.31, 2.81] |
| 28.2 at 24 hours | 9 | 259 | Mean Difference (IV, Fixed, 95% CI) | 1.03 [‐0.91, 2.96] |
| 28.3 at 48 hours | 9 | 259 | Mean Difference (IV, Fixed, 95% CI) | 2.71 [0.39, 5.04] |
| 28.4 at 72 hours | 7 | 196 | Mean Difference (IV, Fixed, 95% CI) | 2.93 [‐0.02, 5.87] |
| 28.5 at 96 hours | 6 | 158 | Mean Difference (IV, Fixed, 95% CI) | 0.79 [‐1.26, 2.84] |
| 28.6 at 120 hours | 2 | 63 | Mean Difference (IV, Fixed, 95% CI) | ‐0.34 [‐2.43, 1.76] |
| 28.7 at 168 hours | 1 | 38 | Mean Difference (IV, Fixed, 95% CI) | 5.0 [2.77, 7.23] |