Scolaris Content Display Scolaris Content Display

Study flow diagram.
Figuras y tablas -
Figure 1

Study flow diagram.

'Risk of bias' graph: review authors' judgements about each 'Risk of bias' item presented as percentages across all included studies.
Figuras y tablas -
Figure 2

'Risk of bias' graph: review authors' judgements about each 'Risk of bias' item presented as percentages across all included studies.

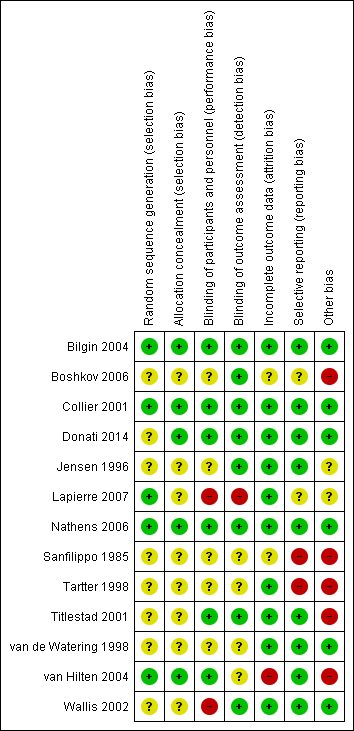
'Risk of bias' summary: review authors' judgements about each 'Risk of bias' item for each included study.
Figuras y tablas -
Figure 3

'Risk of bias' summary: review authors' judgements about each 'Risk of bias' item for each included study.

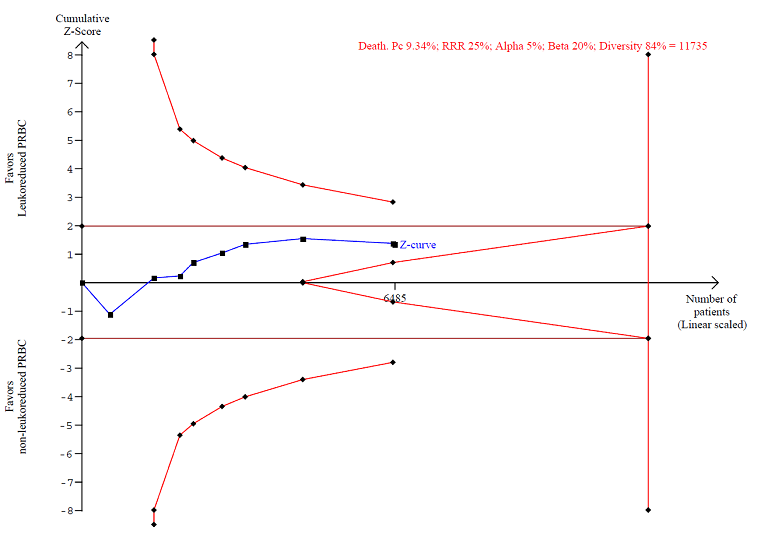
TSA calculated to reliably detect a 25% relative change in the incidence of death from any cause, assuming a control group event rate of 9.34% with a power of 80% at an alpha of 5%
Figuras y tablas -
Figure 4

TSA calculated to reliably detect a 25% relative change in the incidence of death from any cause, assuming a control group event rate of 9.34% with a power of 80% at an alpha of 5%

Funnel plot of comparison: 1 Leukoreduced PRBC versus non‐leukoreduced PRBC. Main Analysis (Randomised patients), outcome: 1.3 Infection. Number of events of the total of randomised patients reported.
Figuras y tablas -
Figure 5

Funnel plot of comparison: 1 Leukoreduced PRBC versus non‐leukoreduced PRBC. Main Analysis (Randomised patients), outcome: 1.3 Infection. Number of events of the total of randomised patients reported.

TSA calculated to reliably detect a 25% relative change in the incidence of infection from any cause, assuming a control group event rate of 20.4% with a power of 80% at an alpha of 5%.
Figuras y tablas -
Figure 6

TSA calculated to reliably detect a 25% relative change in the incidence of infection from any cause, assuming a control group event rate of 20.4% with a power of 80% at an alpha of 5%.

TSA calculated to reliably detect a 25% relative change in the incidence of fever, assuming a control group event rate of 38.7% with a power of 80% at an alpha of 5%.
Figuras y tablas -
Figure 7

TSA calculated to reliably detect a 25% relative change in the incidence of fever, assuming a control group event rate of 38.7% with a power of 80% at an alpha of 5%.

Comparison 1 Leukoreduced PRBC versus non‐leukoreduced PRBC. Main analysis (randomised patients), Outcome 1 TRALI. Number of events of the total of randomised patients reported.
Figuras y tablas -
Analysis 1.1

Comparison 1 Leukoreduced PRBC versus non‐leukoreduced PRBC. Main analysis (randomised patients), Outcome 1 TRALI. Number of events of the total of randomised patients reported.

Comparison 1 Leukoreduced PRBC versus non‐leukoreduced PRBC. Main analysis (randomised patients), Outcome 2 Death. Number of events of the total of randomised patients reported.
Figuras y tablas -
Analysis 1.2

Comparison 1 Leukoreduced PRBC versus non‐leukoreduced PRBC. Main analysis (randomised patients), Outcome 2 Death. Number of events of the total of randomised patients reported.

Comparison 1 Leukoreduced PRBC versus non‐leukoreduced PRBC. Main analysis (randomised patients), Outcome 3 Infection. Number of events of the total of randomised patients reported.
Figuras y tablas -
Analysis 1.3

Comparison 1 Leukoreduced PRBC versus non‐leukoreduced PRBC. Main analysis (randomised patients), Outcome 3 Infection. Number of events of the total of randomised patients reported.

Comparison 1 Leukoreduced PRBC versus non‐leukoreduced PRBC. Main analysis (randomised patients), Outcome 4 Adverse events. Number of events of the total of randomised patients reported.
Figuras y tablas -
Analysis 1.4

Comparison 1 Leukoreduced PRBC versus non‐leukoreduced PRBC. Main analysis (randomised patients), Outcome 4 Adverse events. Number of events of the total of randomised patients reported.

Comparison 2 Leukoreduced PRBC versus non‐leukoreduced PRBC. Secondary analysis (transfused patients), Outcome 1 TRALI. Number of events of the total of transfused patients reported.
Figuras y tablas -
Analysis 2.1

Comparison 2 Leukoreduced PRBC versus non‐leukoreduced PRBC. Secondary analysis (transfused patients), Outcome 1 TRALI. Number of events of the total of transfused patients reported.

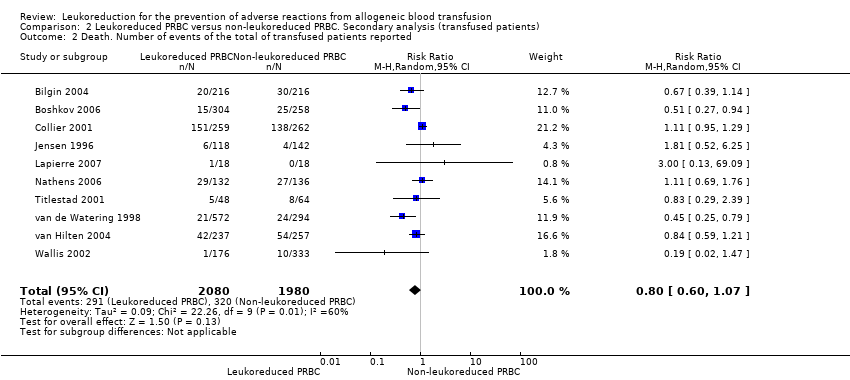
Comparison 2 Leukoreduced PRBC versus non‐leukoreduced PRBC. Secondary analysis (transfused patients), Outcome 2 Death. Number of events of the total of transfused patients reported.
Figuras y tablas -
Analysis 2.2

Comparison 2 Leukoreduced PRBC versus non‐leukoreduced PRBC. Secondary analysis (transfused patients), Outcome 2 Death. Number of events of the total of transfused patients reported.

Comparison 2 Leukoreduced PRBC versus non‐leukoreduced PRBC. Secondary analysis (transfused patients), Outcome 3 Infection. Number of events of the total of transfused patients reported.
Figuras y tablas -
Analysis 2.3

Comparison 2 Leukoreduced PRBC versus non‐leukoreduced PRBC. Secondary analysis (transfused patients), Outcome 3 Infection. Number of events of the total of transfused patients reported.

Comparison 2 Leukoreduced PRBC versus non‐leukoreduced PRBC. Secondary analysis (transfused patients), Outcome 4 Adverse events. Number of events of the total of transfused patients reported.
Figuras y tablas -
Analysis 2.4

Comparison 2 Leukoreduced PRBC versus non‐leukoreduced PRBC. Secondary analysis (transfused patients), Outcome 4 Adverse events. Number of events of the total of transfused patients reported.

Summary of findings for the main comparison. Leukoreduced PRBCs versus non‐leukoreduced PRBCs for preventing adverse reaction from allogeneic blood transfusion

Leukoreduced PRBCs versus non‐leukoreduced PRBCs for preventing adverse reaction from allogeneic blood transfusion

Patient or population: Patients receiving RBC transfusion
Settings: Any
Intervention: Leukoreduced PRBCs
Comparison: Non‐leukoreduced PRBCs

Outcomes

Illustrative comparative risks* (95% CI)

Relative effect
(95% CI)

Number of participants
(studies)

Quality of the evidence
(GRADE)

Comments

Assumed risk

Corresponding risk

Non‐leukoreduced packed RBCs

Leukoreduced packed RBCs

TRALI
Follow‐up: mean 28 days

Study population

RR 0.96
(0.67 to 1.36)

1864
(1 study)

⊕⊕⊝⊝
low1

TSA yielded an inconclusive result.

63 per 1000

61 per 1000
(42 to 86)

Death due to any cause
Follow‐up: median 2.5 months

Study population

RR 0.81
(0.58 to 1.12)

6485
(9 studies)

⊕⊝⊝⊝
very low2

TSA yielded an inconclusive
result.

93 per 1000

76 per 1000
(54 to 104)

Infection from any cause
Follow‐up: mean 2.5 months

Study population

RR 0.80
(0.62 to 1.03)

6709
(10 studies)

⊕⊝⊝⊝
very low3

TSA yielded an inconclusive
result.

204 per 1000

163 per 1000
(127 to 210)

Adverse events
Follow‐up: mean 3 months

Study population

RR 0.81
(0.64 to 1.02)

634
(2 studies)

⊕⊕⊝⊝
low4

TSA yielded an inconclusive
result.

387 per 1000

314 per 1000
(248 to 395)

Non‐infectious complication

Study population

Not estimable

No trial assessed this outcome.

Not estimable

Not estimable

*The basis for the assumed risk was the median control group risk across studies. The corresponding risk (and its 95% CI) is based on the assumed risk in the comparison group and the relative effect of the intervention (and its 95% CI).
CI: Confidence interval; RR: Risk ratio; TRALI: Transfusion‐related acute lung injury; RBC: Red blood cell; PRBC: Packed red blood cell; DARIS: Diversity‐adjusted required information size.

GRADE Working Group grades of evidence
High quality: Further research is very unlikely to change our confidence in the estimate of effect.
Moderate quality: Further research is likely to have an important impact on our confidence in the estimate of effect and may change the estimate.
Low quality: Further research is very likely to have an important impact on our confidence in the estimate of effect and is likely to change the estimate.
Very low quality: We are very uncertain about the estimate.

1Downgraded by two due to imprecision: small sample size as compared with the calculated DARIS and the wide CI overlapping zones of no effect, as well as potential harm or benefit, or both. Few events reported.
2Downgraded due to: high risk of bias (Six of nine included studies have high or unclear risk of bias. ‐1); important heterogeneity (I² statistic: 63%, ‐1); and imprecision as reflected in the wide CI and an insufficient accrued information size compared with the DARIS (‐1).

3Downgraded due to: high risk of bias (Seven of 10 included studies were at high or unclear risk of bias, ‐1); important heterogeneity (I² statistic: 84%, ‐2); and imprecision due to the CI crossing the threshold of meaningful effect and an insufficient sample size as compared with the DARIS (‐1)

4Downgraded due to: high risk of bias (All included studies evaluated were at high risk of bias, ‐1) and imprecision due to the CI crossing the threshold of meaningful effect and an insufficient sample size as compared with the DARIS (‐1).

Figuras y tablas -
Summary of findings for the main comparison. Leukoreduced PRBCs versus non‐leukoreduced PRBCs for preventing adverse reaction from allogeneic blood transfusion
Comparison 1. Leukoreduced PRBC versus non‐leukoreduced PRBC. Main analysis (randomised patients)

Outcome or subgroup title

No. of studies

No. of participants

Statistical method

Effect size

1 TRALI. Number of events of the total of randomised patients reported Show forest plot

1

1864

Risk Ratio (M‐H, Random, 95% CI)

0.96 [0.67, 1.36]

2 Death. Number of events of the total of randomised patients reported Show forest plot

9

6485

Risk Ratio (M‐H, Random, 95% CI)

0.81 [0.58, 1.12]

3 Infection. Number of events of the total of randomised patients reported Show forest plot

10

6709

Risk Ratio (M‐H, Random, 95% CI)

0.80 [0.62, 1.03]

4 Adverse events. Number of events of the total of randomised patients reported Show forest plot

2

634

Risk Ratio (M‐H, Fixed, 95% CI)

0.81 [0.64, 1.02]

4.1 Fever

2

634

Risk Ratio (M‐H, Fixed, 95% CI)

0.81 [0.64, 1.02]

Figuras y tablas -
Comparison 1. Leukoreduced PRBC versus non‐leukoreduced PRBC. Main analysis (randomised patients)
Comparison 2. Leukoreduced PRBC versus non‐leukoreduced PRBC. Secondary analysis (transfused patients)

Outcome or subgroup title

No. of studies

No. of participants

Statistical method

Effect size

1 TRALI. Number of events of the total of transfused patients reported Show forest plot

1

268

Risk Ratio (M‐H, Random, 95% CI)

0.98 [0.74, 1.29]

2 Death. Number of events of the total of transfused patients reported Show forest plot

10

4060

Risk Ratio (M‐H, Random, 95% CI)

0.80 [0.60, 1.07]

3 Infection. Number of events of the total of transfused patients reported Show forest plot

10

3557

Risk Ratio (M‐H, Random, 95% CI)

0.76 [0.58, 1.00]

4 Adverse events. Number of events of the total of transfused patients reported Show forest plot

2

544

Risk Ratio (M‐H, Fixed, 95% CI)

0.75 [0.60, 0.94]

4.1 Fever

2

544

Risk Ratio (M‐H, Fixed, 95% CI)

0.75 [0.60, 0.94]

Figuras y tablas -
Comparison 2. Leukoreduced PRBC versus non‐leukoreduced PRBC. Secondary analysis (transfused patients)