Agentes inotrópicos y estrategias vasodilatadoras para el tratamiento del shock cardiogénico o síndrome de gasto cardíaco bajo
Información
- DOI:
- https://doi.org/10.1002/14651858.CD009669.pub3Copiar DOI

- Base de datos:
-
- Cochrane Database of Systematic Reviews
- Versión publicada:
-
- 29 enero 2018see what's new
- Tipo:
-
- Intervention
- Etapa:
-
- Review
- Grupo Editorial Cochrane:
-
Grupo Cochrane de Corazón
- Copyright:
-
- Copyright © 2018 The Cochrane Collaboration. Published by John Wiley & Sons, Ltd.
Cifras del artículo
Altmetric:
Citado por:
Autores
Contributions of authors
Julia Schumann (contact author): co‐ordination of the review, data collection for the review (screening, appraisal of inclusion criteria and quality of papers, extracting data from papers, screening data on unpublished studies), writing the review
Eva Henrich: data collection for the review (screening, appraisal of inclusion criteria and quality of papers, extracting data from papers, screening data on unpublished studies)
Hellen Strobl: data collection for the review (screening, appraisal of inclusion criteria and quality of papers, extracting data from papers, screening data on unpublished studies)
Roland Prondzinsky: writing the protocol and conclusions, appraisal of inclusion criteria and quality of papers, interpretation of data from a clinical and consumer perspective
Sophie Weiche: data collection for the review (screening, appraisal of inclusion criteria and quality of papers, extracting data from papers, screening data on unpublished studies), providing general advice from a clinical perspective
Holger Thiele: screening data on unpublished studies, contacting authors, providing general advice from a clinical perspective
Karl Werdan: providing general advice from a clinical and a policy perspective
Stefan Frantz: appraisal of inclusion criteria and quality of papers, screening data on unpublished studies, writing the introductory part of the review, providing general advice from a clinical perspective
Susanne Unverzagt: design and co‐ordination of the review, design and organisation of the search strategy, data collection for the review (screening, appraisal of inclusion criteria and quality of papers, extracting data from papers, contacting authors, data management, methodological interpretation of data), analysis of data, writing the review
Sources of support
Internal sources
-
No sources of support supplied
External sources
-
The Cochrane Heart US Satellite is supported by intramural support from the Northwestern University Feinberg School of Medicine and the Northwestern University Clinical and Translational Science (NUCATS) Institute (UL1TR000150), USA.
-
This project was supported by the National Institute for Health Research, via Cochrane Infrastructure to Cochrane Heart. The views and opinions expressed therein are those of the authors and do not necessarily reflect those of the Systematic Reviews Programme, NIHR, NHS or the Department of Health, UK.
Declarations of interest
Julia Schumann: no relevant conflicts of interests
Eva Henrich: no relevant conflicts of interests
Hellen Strobl: no relevant conflicts of interests
Roland Prondzinsky: no relevant conflicts of interests
Sophie Weiche: no relevant conflicts of interests
Holger Thiele has received research funding (Maquet Cardiovascular, Teleflex Medical, Terumo, Lilly Germany, The Medicines Company), honoraria for advisory board activities (Lilly, Maquet Cardiovascular), honoraria for lectures (AstraZeneca, Lilly, Daiichi Sankyo, The Medicines Company, Terumo, Maquet Cardiovascular, Bayer, Boehringer Ingelheim).
Karl Werdan has received honoraria for lectures (Abbott, Biogen, Biotest, Boston scientific, Brahms, Datascope, Maquet, Novartis, Roche, Servier), honoraria for advisory board activities (Abbott, Baxter, Biotest, Datascope, Servier), took part in clinical trials (Arrows, Datascope, MSD, Novartis, Servier) and has received research funding from Biotest, Bayer, Datascope, Novartis Roche, Servier.
Stefan Frantz has received research funding (Charite Berlin, Covance Inc 210 Carnegie Center Princeton, Janssen‐Cilag GmbH, Mapi Life Sciences (Germany) GmbH, Medtronic Bakken Research Center, NOVARTIS PHARMA GMBH, Bayer, Boehringer, BMS, Astra), received honoraria for lectures (AMGEN Europe, AstraZeneca, Assistenz, Bayer Vital, Boehringer Ingelheim, Bristol‐Meyers Squibb GmbH, Daiichi Sankyo, Messe Düsseldorf, MSD, Novartis, ORGASYMPOSIA, Pfizer, Servier) and honoraria for advisory board activities (Bayer, Boehringer, MSD, Pfizer).
Susanne Unverzagt: no relevant conflicts of interests.
Acknowledgements
The excellent support from Cochrane Heart was very much appreciated.
We are grateful to authors of individual studies who provided information and answered our questions concerning their studies: James Baldassare and Trygve Husebye.
Version history
| Published | Title | Stage | Authors | Version |
| 2020 Nov 05 | Inotropic agents and vasodilator strategies for the treatment of cardiogenic shock or low cardiac output syndrome | Review | Konstantin Uhlig, Ljupcho Efremov, Jörn Tongers, Stefan Frantz, Rafael Mikolajczyk, Daniel Sedding, Julia Schumann | |
| 2018 Jan 29 | Inotropic agents and vasodilator strategies for the treatment of cardiogenic shock or low cardiac output syndrome | Review | Julia Schumann, Eva C Henrich, Hellen Strobl, Roland Prondzinsky, Sophie Weiche, Holger Thiele, Karl Werdan, Stefan Frantz, Susanne Unverzagt | |
| 2014 Jan 02 | Inotropic agents and vasodilator strategies for acute myocardial infarction complicated by cardiogenic shock or low cardiac output syndrome | Review | Susanne Unverzagt, Lisa Wachsmuth, Katharina Hirsch, Holger Thiele, Michael Buerke, Johannes Haerting, Karl Werdan, Roland Prondzinsky | |
| 2012 Feb 15 | Inotropic agents and vasodilator strategies for acute myocardial infarction complicated by cardiogenic shock or low cardiac output syndrome | Protocol | Susanne Unverzagt, Katharina Hirsch, Michael Buerke, Holger Thiele, Johannes Haerting, Karl Werdan, Roland Prondzinsky | |
Differences between protocol and review
Handsearching in the annual conference proceedings was planned from 1960 to the present but proceedings were not available in Germany for this period. Due to the first publication of eligible trials in 2003 we restricted our search to the available proceedings in Halle, Leipzig and Munich.
In the update, we expanded the review to all people with CS or LCOS. We included trials with a subgroup of eligible participants. We used the risk ratio to measure treatment effects on mortality, major adverse cardiac events (MACE) and adverse events instead of hazard ratios and odds ratios.
We searched for conference proceedings in ISI Web of Science (Conference Proceedings Citation Index‐Science, Thomson Reuters 1990 to 22 June 2017) and did no separately handsearch in the annual conference proceedings of the American Heart Association (AHA), American College of Cardiology (ACC), European Society of Cardiology (ESC), European Society of Intensive Care (ESICM) and Deutsche Gesellschaft für Kardiologie (DGK) for the years 2013 to 2016.
We excluded trials on children.
We excluded trials not reporting on the acute setting, that is, prevention trials and long‐term studies (treatment lasting one month or more).
We excluded studies that did not report on our primary outcome (all‐cause mortality). We plan to change this in future updates of this review.
We added 'Summary of findings' tables with GRADE rating.
We added adverse events as a secondary outcome.
Keywords
MeSH
Medical Subject Headings (MeSH) Keywords
- Cardiac Output, Low [*drug therapy, etiology, mortality];
- Cardiotonic Agents [*therapeutic use];
- Cause of Death;
- Dobutamine [therapeutic use];
- Enoximone [therapeutic use];
- Epinephrine [therapeutic use];
- Hydrazones [therapeutic use];
- Myocardial Infarction [*complications, mortality];
- Nitric Oxide [therapeutic use];
- Placebos [therapeutic use];
- Pyridazines [therapeutic use];
- Randomized Controlled Trials as Topic;
- Shock, Cardiogenic [*drug therapy, etiology, mortality];
- Simendan [therapeutic use];
- Vasodilator Agents [*therapeutic use];
Medical Subject Headings Check Words
Aged; Humans; Middle Aged;
PICO

Study flow diagram

Risk of bias summary: review authors' judgements about each risk of bias item for each included study

Risk of bias graph: review authors' judgements about each risk of bias item presented as percentages across all included studies

Comparison 1 Levosimendan versus control, Outcome 1 All‐cause short‐term mortality.

Comparison 1 Levosimendan versus control, Outcome 2 All‐cause short‐term mortality: subgroup analysis.
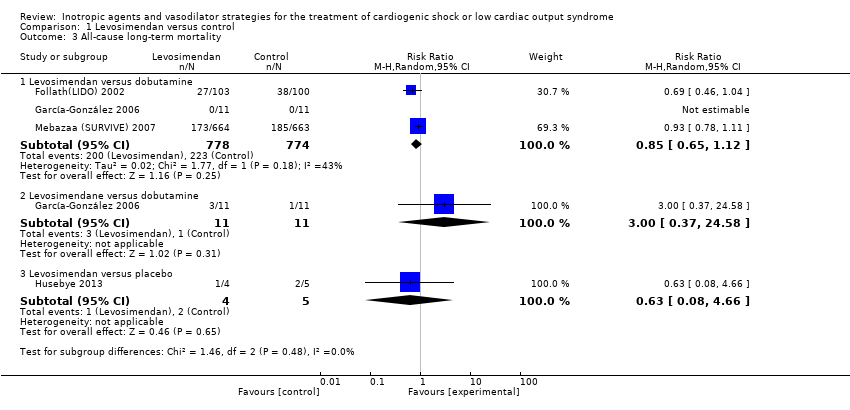
Comparison 1 Levosimendan versus control, Outcome 3 All‐cause long‐term mortality.

Comparison 1 Levosimendan versus control, Outcome 4 All‐cause long‐term mortality:subgroup analysis.
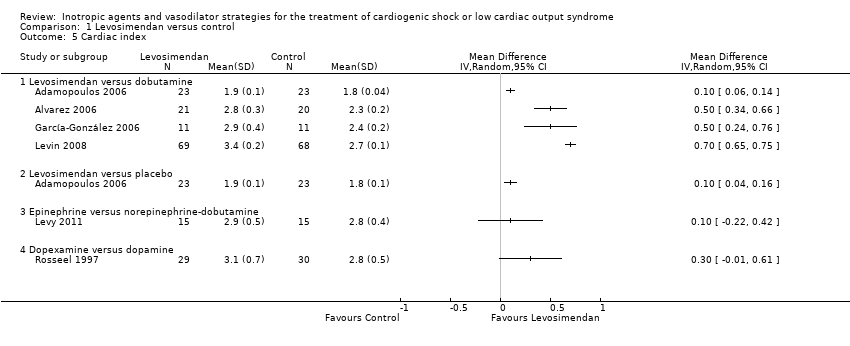
Comparison 1 Levosimendan versus control, Outcome 5 Cardiac index.
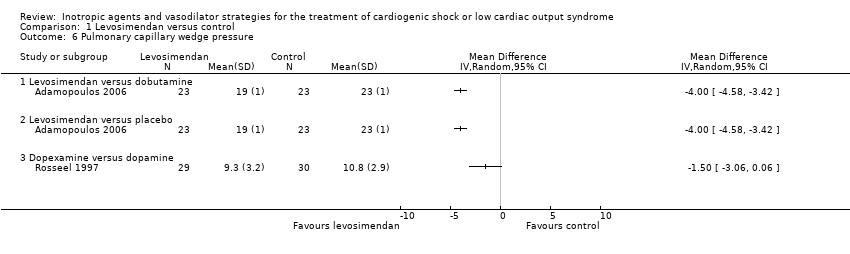
Comparison 1 Levosimendan versus control, Outcome 6 Pulmonary capillary wedge pressure.
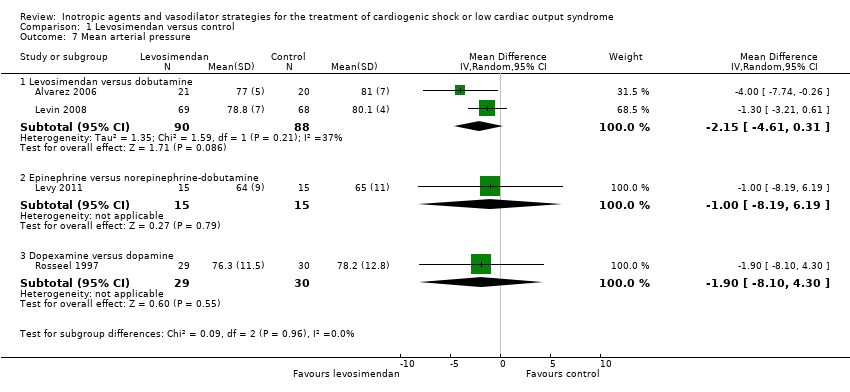
Comparison 1 Levosimendan versus control, Outcome 7 Mean arterial pressure.

Comparison 2 Levosimendan versus control: sensitivity analyses, Outcome 1 All‐cause short‐term mortality: fixed‐effect model.
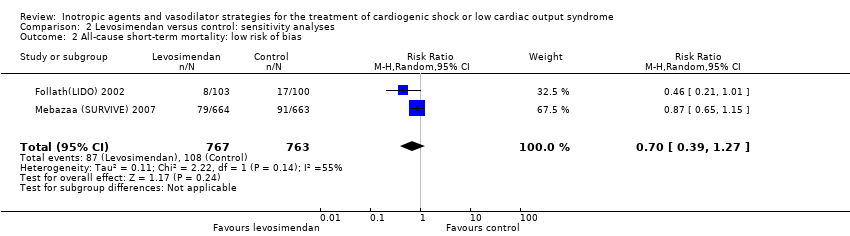
Comparison 2 Levosimendan versus control: sensitivity analyses, Outcome 2 All‐cause short‐term mortality: low risk of bias.
| Levosimendan compared to dobutamine for cardiogenic shock or low cardiac output syndrome | ||||||
| Patient or population: people with cardiogenic shock or low cardiac output syndrome | ||||||
| Outcomes | Anticipated absolute effects (95% CI) | Relative effect | No of participants | Quality | Comments | |
| Risk with dobutamine | Risk with levosimendan | |||||
| All‐cause, short‐term mortality: range 15 days to 12 months | Moderate1 | RR 0.60 | 1776 | ⊕⊕⊝⊝ | Studies included participants with LCOS or CS due to cardiac surgery, HF or AMI | |
| 154 per 1000 | 92 per 1000 | |||||
| High2 | ||||||
| 500 per 1000 | 300 per 1000 | |||||
| *The basis for the assumed risk (e.g. the median control group risk across studies) is provided in footnotes. The corresponding risk (and its 95% confidence interval) is based on the assumed risk in the comparison group and the relative effect of the intervention (and its 95% CI). | ||||||
| GRADE Working Group grades of evidence | ||||||
| 1Control group risk estimate comes from the median risk among the control group risk in included studies with participants with low cardiac output, low cardiac output or cardiogenic shock, or cardiogenic shock. | ||||||
| Levosimendan compared with placebo for cardiogenic shock or low cardiac output syndrome | ||||||
| Patient or population: adults with cardiogenic shock or low cardiac output syndrome Settings: hospital Intervention: levosimendan Comparison: placebo | ||||||
| Outcomes | Anticipated absolute effects (95% CI) | Relative effect | No of participants | Quality | Comments | |
| Risk with placebo | Risk with levosimendan | |||||
| All‐cause short‐term mortality: range 4 to 6 months | Moderate1 | RR 0.48 (0.12 to 1.94) | 55 | ⊕⊕⊝⊝ | Studies included participants with LCOS or CS due to HF or AMI | |
| 187 per 1000 | 90 per 1000 | |||||
| High2 | ||||||
| 500 per 1000 | 240 per 1000 | |||||
| *The basis for the assumed risk (e.g. the median control group risk across studies) is provided in footnotes. The corresponding risk (and its 95% confidence interval) is based on the assumed risk in the comparison group and the relative effect of the intervention (and its 95% CI). | ||||||
| GRADE Working Group grades of evidence | ||||||
| 1Control group risk estimate comes from median risk among the control group risk in included studies with low cardiac output or cardiogenic shock. | ||||||
| Levosimendan compared with enoximone for cardiogenic shock | ||||||
| Patient or population: adults with cardiogenic shock Settings: hospital Intervention: levosimendan Comparison: enoximone | ||||||
| Outcomes | Anticipated absolute effects (95% CI) | Relative effect | No of participants | Quality | Comments | |
| Risk with enoximone | Risk with levosimendan | |||||
| All‐cause short‐term mortality: 30 days | 625 per 10001 | 313 per 1000 (138 to 712) | RR 0.50 (0.22 to 1.14) | 32 | ⊕⊝⊝⊝ very low2,3 | Study included participants with CS due to AMI |
| *The basis for the assumed risk (e.g. the median control group risk across studies) is provided in footnotes. The corresponding risk (and its 95% confidence interval) is based on the assumed risk in the comparison group and the relative effect of the intervention (and its 95% CI). | ||||||
| GRADE Working Group grades of evidence | ||||||
| 1Control group risk estimate comes from the control group risk in a small included study with low cardiac output or cardiogenic shock. | ||||||
| Epinephrine compared with norepinephrine‐dobutamine for low cardiac output syndrome | ||||||
| Patient or population: adults with low cardiac output syndrome Setting: in‐hospital Intervention: epinephrine Comparison: norepinephrine‐dobutamine | ||||||
| Outcomes | Anticipated absolute effects (95% CI) | Relative effect | No of participants | Quality | Comments | |
| Risk with norepinephrine‐dobutamine | Risk with epinephrine | |||||
| All‐cause short‐term mortality: 28 days | 267 per 1000 | 333 per 1000 | RR 1.25 (0.41 to 3.77) | 30 | ⊕⊝⊝⊝ very low1,2 | Study included participants with LCOS due to HF |
| *The basis for the assumed risk (e.g. the median control group risk across studies) is provided in footnotes. The corresponding risk (and its 95% confidence interval) is based on the assumed risk in the comparison group and the relative effect of the intervention (and its 95% CI). | ||||||
| GRADE Working Group grades of evidence | ||||||
| 1Downgraded two steps for imprecision due to few events, and the confidence interval crosses the line of no difference and includes possible benefit from both approaches. | ||||||
| Amrinone compared with dobutamine for low cardiac output syndrome | ||||||
| Patient or population: adults with low cardiac output syndrome Setting: hospital Intervention: amrinone Comparison: dobutamine | ||||||
| Outcomes | Anticipated absolute effects (95% CI) | Relative effect | No of participants | Quality | Comments | |
| Risk with dobutamine | Risk with amrinone | |||||
| All‐cause short‐term mortality: 30 days | 200 per 10001 | 66 per 1000 | RR 0.33 (0.04 to 2.85) | 30 | ⊕⊝⊝⊝ very low2,3 | Study included participants with LCOS following cardiac surgery |
| *The basis for the assumed risk (e.g. the median control group risk across studies) is provided in footnotes. The corresponding risk (and its 95% confidence interval) is based on the assumed risk in the comparison group and the relative effect of the intervention (and its 95% CI). | ||||||
| GRADE Working Group grades of evidence | ||||||
| 1Control group risk estimate comes from the control group risk in participants with low cardiac output and no cardiogenic shock in the included small study. | ||||||
| Dopexamine compared with dopamine for cardiogenic shock or low cardiac output syndrome | ||||||
| Patient or population: adults with cardiogenic shock or low cardiac output syndrome Setting: hospital Intervention: dopexamine Comparison: dopamine | ||||||
| Outcomes | Anticipated absolute effects (95% CI) | Relative effect | No of participants | Quality | Comments | |
| Risk with dopexamine | Risk with dopamine | |||||
| All‐cause short‐term mortality: time in hospital | 500 per 10001 | Not estimable2 | RR not estimable2 | 70 | ⊕⊝⊝⊝ very low3,4 | Study included participants with LCOS/CS following elective surgery for CABG |
| *The basis for the assumed risk (e.g. the median control group risk across studies) is provided in footnotes. The corresponding risk (and its 95% confidence interval) is based on the assumed risk in the comparison group and the relative effect of the intervention (and its 95% CI). | ||||||
| GRADE Working Group grades of evidence | ||||||
| 1Control group risk estimate comes from a large observational study, due to the small size of included studies in this population (Singh 2007). | ||||||
| Enoximone compared with dobutamine for low cardiac output syndrome | ||||||
| Patient or population: adults with low cardiac output syndrome Setting: hospital Intervention: enoximone Comparison: dobutamine | ||||||
| Outcomes | Anticipated absolute effects (95% CI) | Relative effect | No of participants | Quality | Comments | |
| Risk with dobutamine | Risk with enoximone | |||||
| All‐cause short‐term mortality: 1 month | 500 per 10001 | Not estimable2 | RR not estimable2 | 40 | ⊕⊝⊝⊝ very low3,4 | Study included participants with LCOS after mitral valve surgery |
| *The basis for the assumed risk (e.g. the median control group risk across studies) is provided in footnotes. The corresponding risk (and its 95% confidence interval) is based on the assumed risk in the comparison group and the relative effect of the intervention (and its 95% CI). | ||||||
| GRADE Working Group grades of evidence | ||||||
| 1Control group risk estimate comes from a large observational study, due to the small size of included studies in this population (Singh 2007). | ||||||
| Nitric oxide compared with placebo for cardiogenic shock | ||||||
| Patient or population: adults with cardiogenic shock Setting: in‐hospital Intervention: nitric oxide Comparison: placebo | ||||||
| Outcomes | Anticipated absolute effects (95% CI) | Relative effect | No of participants | Quality | Comments | |
| Risk with nitric oxide | Risk with placebo | |||||
| All‐cause short‐term mortality: 1 month | 500 per 10001 | Not estimable2 | RR not estimable2 | 3 | ⊕⊝⊝⊝ | Study included participants with CS due to AMI |
| *The basis for the assumed risk (e.g. the median control group risk across studies) is provided in footnotes. The corresponding risk (and its 95% confidence interval) is based on the assumed risk in the comparison group and the relative effect of the intervention (and its 95% CI). | ||||||
| GRADE Working Group grades of evidence | ||||||
| 1Control group risk estimate comes from a large observational study, due to the small size of included studies in this population (Singh 2007). | ||||||
| Comparison | Primary studies | MACE | Intervention | Control | RR (95% CI) | ||
| events | total | events | total | ||||
| Levosimendan vs dobutamine | Perioperative infarction | 1 (1.4%) | 69 | 8 (11.8%) | 68 | 0.12 (0.02 to 0.96) | |
| Re‐infarction | 0 (0%) | 11 | 0 (0%) | 11 | Not estimable | ||
| Cerebrovascular accidents | 2 (2.9%) | 69 | 6 (8.8%) | 68 | 0.33 (0.07 to 1.57) | ||
| Cerebrovascular accidents | 0 (0%) | 11 | 0 (0%) | 11 | Not estimable | ||
| Levosimendan vs placebo | MACE (death, non‐fatal myocardial infarction, revascularisation of the infarct‐related artery) | 2 (50.0%) | 4 | 2 (40.0%) | 5 | 1.25 (0.29 to 5.35) | |
| Repeat PCI | 1 (25.0%) | 4 | 0 (0%) | 5 | 3.60 (0.18 to 70.34) | ||
| Amrinone vs dobutamine | Re‐infarction (2 h) | 0 (0%) | 15 | 6 (40.0%) | 15 | 0.08 (0.00 to 1.25) | |
| Dopexamine vs dopamine | Perioperative infarction | 3 (8.6%) | 35 | 2 (5.7%) | 35 | 1.50 (0.27 to 8.43) | |
| Nitric oxide vs placebo | Myocardial infarction | 1 (50.0%) | 2 | 1 (100%) | 1 | 0.67 (0.17 to 2.67) | |
| CI: confidence interval; PCI: percutaneous coronary intervention; RR: risk ratio | |||||||
| Comparison | Primary studies | Reported information | Intervention | Control | ||
| Events/time | Total | Events/time | Total | |||
| Levosimendan vs dobutamine | Stay in ICU (hours, median with IQR) | 66 (58‐74) | 69 | 158 (106‐182) | 68 | |
| Levosimendan vs enoximone | Stay in ICU (days, median with IQR) | 10 (5‐23) | 16 | 13 (7‐19) | 16 | |
| Enoximone vs dobutamine | Stay in ICU (hours, mean) | 92 ± 37 | 18 | 155 ± 129 | 19 | |
| ICU: intensive care unit; IQR: intra‐quartile‐range | ||||||
| Comparison | Primary studies | Haemodynamics | Intervention | Control | MD (95% CI) | ||
| Intervention vs control | last measurements | mean ± SD or median (IQR) | total | mean ± SD or median (IQR) | total | ||
| Levosimendan vs dobutamine | Cardiac index (after 72 h, L/min/m2) | 1.9 ± 0.1 | 23 | 1.8 ± 0.04 | 23 | 0.10 (0.06 to 0.14) | |
| Cardiac index (after 48 h, L/min/m2) | 2.8 ± 0.3 | 21 | 2.3 ± 0.2 | 20 | 0.50 (0.34 to 0.66) | ||
| Cardiac index (after 30 h, L/min/m2) | 2.9 ± 0.4 | 11 | 2.4 ± 0.2 | 11 | 0.50 (0.24 to 0.76) | ||
| Cardiac index (after 48 hrs, L/min/m2) | 3.4 ± 0.2 | 69 | 2.7 ± 0.1 | 68 | 0.70 (0.65 to 0.75) | ||
| PCWP (after 72 h, mmHg) | 19.0 ± 1 | 23 | 23.0 ± 1.0 | 23 | ‐4.00 (‐4.60 to ‐3.40) | ||
| MAP (after 48 h, mmHg) | 77.0 ± 5 | 21 | 81.0 ± 7.0 | 20 | ‐4.00 (‐7.70 to ‐0.30) | ||
| MAP (after 48 h, mmHg) | 78.8 ± 7 | 69 | 80.1 ± 4 | 68 | ‐1.30 (‐3.20 to 0.60) | ||
| Levosimendan vs placebo | Cardiac index (after 72 h, (L/min/m2) | 1.9 ± 0.1 | 23 | 1.8 ± 0.1 | 23 | 0.10 (0.04 to 0.16) | |
| PCWP (after 72 h, mmHg) | 19.0 ± 1 | 23 | 23.0 ± 1.0 | 23 | ‐4.00 (‐4.60 to ‐3.40) | ||
| Levosimendan vs enoximone | Cardiac index (after 48 h, L/min/m2) | 3.1 (2.5‐3.5) | 16 | 3.1 (2.8‐3.3) | 16 | Not estimable | |
| MAP (after 48 h (mmHg) | 75.0 (58.0‐79.0) | 16 | 70.0 (63.0‐83.0) | 16 | Not estimable | ||
| Epinephrine vs norepinephrine‐dobutamine | Cardiac index (after 24 h, L/min/m2) | 2.9 ± 0.5 | 15 | 2.8 ± 0.4 | 15 | 0.10 (‐0.22 to 0.42) | |
| MAP (after 24 h, mmHg) | 64 ± 9 | 15 | 65.0 ± 11.0 | 15 | ‐1.00 (‐8.20 to 6.20) | ||
| Dopexamine vs dopamine | Cardiac index (after 6 h, L/min/m2) | 3.1 ± 0.7 | 29 | 2.8 ± 0.5 | 30 | 0.30 (‐0.01 to 0.61) | |
| PCWP (after 6 h, mmHg) | 9.3 ± 3.2 | 29 | 10.8 ± 2.9 | 30 | ‐1.50 (‐3.10 to 0.10) | ||
| MAP (after 6 h, mmHg) | 76.3 ± 11.5 | 29 | 78.2 ± 12.8 | 30 | ‐1.90 (‐8.10 to 4.30) | ||
| CI: confidence interval; IQR: intra‐quartile‐range; MAP: mean arterial pressure; MD: mean difference; PCWP: pulmonary capillary wedge pressure; SD: standard deviation | |||||||
| Comparison | Primary studies | Adverse events (no MACE) | Intervention | Control | ||
| events | total | events | total | |||
| Levosimendan vsdobutamine | Atrial fibrillation | 78 (10.4%) | 750 | 71 (9.5%) | 748 | |
| Ventricular fibrillation | 15 (2.3%) | 660 | 19 (2.9%) | 660 | ||
| Ventricular arrhythmias | 7 (3.6%) | 193 | 25 (13.3%) | 188 | ||
| Ventricular tachycardia | 52 (7.9%) | 660 | 48 (7.3%) | 660 | ||
| Ventricular extrasystoles | 40 (6.1%) | 660 | 24 (3.6%) | 660 | ||
| Tachycardia | 33 (5.0%) | 660 | 33 (5.0%) | 660 | ||
| Bradycardia | 8 (1.2%) | 660 | 17 (2.6%) | 660 | ||
| Headache | 69 (9.0%) | 763 | 36 (4.7%) | 760 | ||
| Cardiac failure | 91 (11.9%) | 763 | 127 (16.7%) | 760 | ||
| Congestive cardiac failure | 26 (3.9%) | 660 | 22 (3.3%) | 660 | ||
| Cardiac arrest | 20 (3.0%) | 660 | 26 (3.9%) | 660 | ||
| Disorder aggravated | 17 (2,2%) | 763 | 27 (3.6%) | 760 | ||
| Gastrointestinal disorders | 54 (7.1%) | 763 | 52 (6.8%) | 760 | ||
| Acute kidney failure | 29 (4.0%) | 729 | 43 (5.9%) | 728 | ||
| Need for dialysis | 2 (2.9%) | 69 | 8 (11.9%) | 68 | ||
| Pneumonia | 34 (4.7%) | 729 | 34 (4.7%) | 728 | ||
| Multiple organ failure | 0 (0%) | 11 | 0 (0%) | 11 | ||
| Stroke | 0 (0%) | 11 | 0 (0%) | 11 | ||
| Vasoplegia | 1 (1.4 %) | 69 | 9 (13.2%) | 68 | ||
| Dyspnoea | 1 (1.4%) | 69 | 4 (5.8%) | 68 | ||
| Inflammatory response syndrome | 4 (5.8%) | 69 | 15 (22.1%) | 68 | ||
| Sepsis | 1 (1.4%) | 69 | 9 (13.2%) | 68 | ||
| Prolonged ventilatory assistance | 6 (8.7%) | 69 | 22 (32.3%) | 68 | ||
| Hypokalaemia | 62 (9.4%) | 660 | 39 (5.9%) | 660 | ||
| Hyperkalaemia | 15 (2.3%) | 660 | 16 (2.4%) | 660 | ||
| Hypotension | 102 (15.5%) | 660 | 92 (13.9%) | 660 | ||
| Nausea | 45 (6.8%) | 660 | 49 (7.4%) | 660 | ||
| Insomnia | 37 (5.6%) | 660 | 29 (4.4%) | 660 | ||
| Chest pain | 32 (4.8%) | 660 | 47 (7.1%) | 660 | ||
| Constipation | 26 (3.9%) | 660 | 28 (4.2%) | 660 | ||
| Pyrexia | 22 (3.3%) | 660 | 19 (2.9%) | 660 | ||
| Urinary tract infection | 21 (3.2%) | 660 | 30 (4.5%) | 660 | ||
| Anexiety | 20 (3.0%) | 660 | 19 (2.9%) | 660 | ||
| Pulmonary oedema | 20 (3.0%) | 660 | 18 (2.7%) | 660 | ||
| Dizziness | 19 (2.9%) | 660 | 16 (2.4%) | 660 | ||
| Cough | 19 (2.9%) | 660 | 21 (3.2%) | 660 | ||
| Pain in extremity | 18 (2.7%) | 660 | 10 (1.5%) | 660 | ||
| Pruritus | 16 (2.4%) | 660 | 7 (1.1%) | 660 | ||
| Anaemia | 15 (2.3%) | 660 | 17 (2.6%) | 660 | ||
| Epistaxis | 14 (2.1%) | 660 | 7 (1.1%) | 660 | ||
| Back pain | 13 (2.0%) | 660 | 18 (2.7%) | 660 | ||
| Angina pectoris | 12 (1.8%) | 660 | 18 (2.7%) | 660 | ||
| Muscle spasms | 12 (1.8%) | 660 | 13 (2.0%) | 660 | ||
| Dyspnoea | 9 (1.4%) | 660 | 17 (2.6%) | 660 | ||
| Hypertension | 9 (1.4%) | 660 | 15 (2.3%) | 660 | ||
| Cataract | 7 (1.1%) | 660 | 14 (2.1%) | 660 | ||
| Agitation | 7 (1.1%) | 660 | 0 (0%) | 660 | ||
| Levosimendan vsplacebo | Non‐sustained ventricular tachycardia | 1 (25.0%) | 4 | 3 (60.0%) | 5 | |
| Atrial fibrillation | 1 (25.0%) | 4 | 0 (0%) | 5 | ||
| Episodes of hypotension during drug infusion (MAP fall > 10 mmHg) | 2 (50.0%) | 4 | 1 (20.0%) | 5 | ||
| Levosimendan vsenoximone | Need of mechanical ventilation | 13 (81.3%) | 16 | 15 (93.8%) | 16 | |
| Acute renal failure | 5 (31.3%) | 16 | 8 (50.0%) | 16 | ||
| Need of continuous renal replacement therapy | 5 (31.5%) | 16 | 8 (50.0%) | 16 | ||
| New onset atrial fibrillation | 7 (43.8%) | 16 | 9 (56.3%) | 16 | ||
| Ventricular tachycardia or fibrillation | 8 (50.0%) | 16 | 11 (68.8%) | 16 | ||
| Development of systemic inflammatory response | 8 (50.0%) | 16 | 13 (81.3%) | 16 | ||
| Pneumonia | 7 (43.8%) | 16 | 7 (43.8%) | 16 | ||
| Urinary infections | 0 (0%) | 16 | 2 (12.5%) | 16 | ||
| Sepsis | 3 (18.8%) | 16 | 2 (12.5%) | 16 | ||
| Epinephrine vs. norepinephrine‐dobutamine | Supraventricular arrhythmia | 2 (13.3%) | 15 | 0 (0%) | 15 | |
| Sustained ventricular tachycardia | 1 (6.7%) | 15 | 0 (0%) | 15 | ||
| Amrinone vs. dobutamine | Cardiac arrhythmias during treatment | 0 (0%) | 15 | 4 (26.7%) | 15 | |
| Myocardial ischemias (within 16 to 20 hrs) | 4 (26.7%) | 15 | 4 (26.7%) | 15 | ||
| Dopexamine vs. dopamine | Cardiac events | 19 (54.3%) | 35 | 22 (62.9%) | 35 | |
| Abnormal blood loss | 2 (5.7%) | 35 | 1 (2.9%) | 35 | ||
| Kidney failure | 1 (2.9%) | 35 | 1 (2.9%) | 35 | ||
| Other adverse events | 5 (14.3%) | 35 | 1 (2.9%) | 35 | ||
| Major adverse events | 0 (0%) | 35 | 0 (0%) | 35 | ||
| MACE: major adverse cardiac events; MAP: mean arterial pressure | ||||||
| Outcome or subgroup title | No. of studies | No. of participants | Statistical method | Effect size |
| 1 All‐cause short‐term mortality Show forest plot | 8 | Risk Ratio (M‐H, Random, 95% CI) | Subtotals only | |
| 1.1 Levosimendan versus dobutamine | 6 | 1776 | Risk Ratio (M‐H, Random, 95% CI) | 0.60 [0.37, 0.95] |
| 1.2 Levosimendan versus placebo | 2 | 55 | Risk Ratio (M‐H, Random, 95% CI) | 0.48 [0.12, 1.94] |
| 1.3 Levosimendan versus enoximone | 1 | 32 | Risk Ratio (M‐H, Random, 95% CI) | 0.5 [0.22, 1.14] |
| 2 All‐cause short‐term mortality: subgroup analysis Show forest plot | 6 | Risk Ratio (M‐H, Random, 95% CI) | Subtotals only | |
| 2.1 Levosimendan versus dobutamine: males | 1 | 956 | Risk Ratio (M‐H, Random, 95% CI) | 0.91 [0.65, 1.27] |
| 2.2 Levosimendan versus dobutamine: females | 1 | 371 | Risk Ratio (M‐H, Random, 95% CI) | 0.78 [0.46, 1.32] |
| 2.3 Levosimendan versus dobutamine: age < 65 years | 1 | 501 | Risk Ratio (M‐H, Random, 95% CI) | 1.01 [0.57, 1.81] |
| 2.4 Levosimendan versus dobutamine: age ≥ 65 years | 1 | 826 | Risk Ratio (M‐H, Random, 95% CI) | 0.80 [0.58, 1.10] |
| 2.5 Levosimendan versus dobutamine: LCOS due to HF | 3 | 1576 | Risk Ratio (M‐H, Random, 95% CI) | 0.69 [0.42, 1.11] |
| 2.6 Levosimendan versus dobutamine: LCOS due to cardiac surgery | 2 | 178 | Risk Ratio (M‐H, Random, 95% CI) | 0.38 [0.17, 0.87] |
| 2.7 Levosimendan versus placebo: LCOS due to HF | 1 | 46 | Risk Ratio (M‐H, Random, 95% CI) | 0.5 [0.10, 2.47] |
| 2.8 Levosimendan versus placebo: CS due to AMI | 1 | 9 | Risk Ratio (M‐H, Random, 95% CI) | 0.4 [0.02, 7.82] |
| 2.9 Levosimendan versus dobutamine: LCOS with no history of CHF | 1 | 156 | Risk Ratio (M‐H, Random, 95% CI) | 1.54 [0.82, 2.87] |
| 2.10 Levosimendan versus dobutamine: LCOS with history of CHF | 1 | 1171 | Risk Ratio (M‐H, Random, 95% CI) | 0.76 [0.55, 1.04] |
| 3 All‐cause long‐term mortality Show forest plot | 4 | Risk Ratio (M‐H, Random, 95% CI) | Subtotals only | |
| 3.1 Levosimendan versus dobutamine | 3 | 1552 | Risk Ratio (M‐H, Random, 95% CI) | 0.85 [0.65, 1.12] |
| 3.2 Levosimendane versus dobutamine | 1 | 22 | Risk Ratio (M‐H, Random, 95% CI) | 3.0 [0.37, 24.58] |
| 3.3 Levosimendan versus placebo | 1 | 9 | Risk Ratio (M‐H, Random, 95% CI) | 0.63 [0.08, 4.66] |
| 4 All‐cause long‐term mortality:subgroup analysis Show forest plot | 1 | Risk Ratio (M‐H, Fixed, 95% CI) | Totals not selected | |
| 4.1 Levosimendan versus dobutamine: males | 1 | Risk Ratio (M‐H, Fixed, 95% CI) | 0.0 [0.0, 0.0] | |
| 4.2 Levosimendan versus dobutamine: females | 1 | Risk Ratio (M‐H, Fixed, 95% CI) | 0.0 [0.0, 0.0] | |
| 4.3 Levosimendan versus dobutamine: age < 65 years | 1 | Risk Ratio (M‐H, Fixed, 95% CI) | 0.0 [0.0, 0.0] | |
| 4.4 Levosimendan versus dobutamine: age ≥ 65 years | 1 | Risk Ratio (M‐H, Fixed, 95% CI) | 0.0 [0.0, 0.0] | |
| 5 Cardiac index Show forest plot | 6 | Mean Difference (IV, Random, 95% CI) | Totals not selected | |
| 5.1 Levosimendan versus dobutamine | 4 | Mean Difference (IV, Random, 95% CI) | 0.0 [0.0, 0.0] | |
| 5.2 Levosimendan versus placebo | 1 | Mean Difference (IV, Random, 95% CI) | 0.0 [0.0, 0.0] | |
| 5.3 Epinephrine versus norepinephrine‐dobutamine | 1 | Mean Difference (IV, Random, 95% CI) | 0.0 [0.0, 0.0] | |
| 5.4 Dopexamine versus dopamine | 1 | Mean Difference (IV, Random, 95% CI) | 0.0 [0.0, 0.0] | |
| 6 Pulmonary capillary wedge pressure Show forest plot | 2 | Mean Difference (IV, Random, 95% CI) | Totals not selected | |
| 6.1 Levosimendan versus dobutamine | 1 | Mean Difference (IV, Random, 95% CI) | 0.0 [0.0, 0.0] | |
| 6.2 Levosimendan versus placebo | 1 | Mean Difference (IV, Random, 95% CI) | 0.0 [0.0, 0.0] | |
| 6.3 Dopexamine versus dopamine | 1 | Mean Difference (IV, Random, 95% CI) | 0.0 [0.0, 0.0] | |
| 7 Mean arterial pressure Show forest plot | 4 | Mean Difference (IV, Random, 95% CI) | Subtotals only | |
| 7.1 Levosimendan versus dobutamine | 2 | 178 | Mean Difference (IV, Random, 95% CI) | ‐2.15 [‐4.61, 0.31] |
| 7.2 Epinephrine versus norepinephrine‐dobutamine | 1 | 30 | Mean Difference (IV, Random, 95% CI) | ‐1.0 [‐8.19, 6.19] |
| 7.3 Dopexamine versus dopamine | 1 | 59 | Mean Difference (IV, Random, 95% CI) | ‐1.90 [‐8.10, 4.30] |
| Outcome or subgroup title | No. of studies | No. of participants | Statistical method | Effect size |
| 1 All‐cause short‐term mortality: fixed‐effect model Show forest plot | 7 | Risk Ratio (M‐H, Fixed, 95% CI) | Subtotals only | |
| 1.1 Levosimendan versus dobutamine | 6 | 1776 | Risk Ratio (M‐H, Fixed, 95% CI) | 0.73 [0.57, 0.93] |
| 1.2 Levosimendan versus placebo | 2 | 55 | Risk Ratio (M‐H, Fixed, 95% CI) | 0.47 [0.12, 1.93] |
| 2 All‐cause short‐term mortality: low risk of bias Show forest plot | 2 | 1530 | Risk Ratio (M‐H, Random, 95% CI) | 0.70 [0.39, 1.27] |