Inotropic agents and vasodilator strategies for the treatment of cardiogenic shock or low cardiac output syndrome
Abstract
Background
Cardiogenic shock (CS) and low cardiac output syndrome (LCOS) are potentially life‐threatening complications of acute myocardial infarction (AMI), heart failure (HF) or cardiac surgery. While there is solid evidence for the treatment of other cardiovascular diseases of acute onset, treatment strategies in haemodynamic instability due to CS and LCOS remains less robustly supported by the given scientific literature. Therefore, we have analysed the current body of evidence for the treatment of CS or LCOS with inotropic and/or vasodilating agents. This is the second update of a Cochrane review originally published in 2014.
Objectives
Assessment of efficacy and safety of cardiac care with positive inotropic agents and vasodilator agents in CS or LCOS due to AMI, HF or after cardiac surgery.
Search methods
We conducted a search in CENTRAL, MEDLINE, Embase and CPCI‐S Web of Science in October 2019. We also searched four registers of ongoing trials and scanned reference lists and contacted experts in the field to obtain further information. No language restrictions were applied.
Selection criteria
Randomised controlled trials (RCTs) enrolling patients with AMI, HF or cardiac surgery complicated by CS or LCOS.
Data collection and analysis
We used standard methodological procedures according to Cochrane standards.
Main results
We identified 19 eligible studies including 2385 individuals (mean or median age range 56 to 73 years) and three ongoing studies. We categorised studies into 11 comparisons, all against standard cardiac care and additional other drugs or placebo. These comparisons investigated the efficacy of levosimendan versus dobutamine, enoximone or placebo; enoximone versus dobutamine, piroximone or epinephrine‐nitroglycerine; epinephrine versus norepinephrine or norepinephrine‐dobutamine; dopexamine versus dopamine; milrinone versus dobutamine and dopamine‐milrinone versus dopamine‐dobutamine.
All trials were published in peer‐reviewed journals, and analyses were done by the intention‐to‐treat (ITT) principle. Eighteen of 19 trials were small with only a few included participants. An acknowledgement of funding by the pharmaceutical industry or missing conflict of interest statements occurred in nine of 19 trials. In general, confidence in the results of analysed studies was reduced due to relevant study limitations (risk of bias), imprecision or indirectness. Domains of concern, which showed a high risk in more than 50% of included studies, encompassed performance bias (blinding of participants and personnel) and bias affecting the quality of evidence on adverse events.
All comparisons revealed uncertainty on the effect of inotropic/vasodilating drugs on all‐cause mortality with a low to very low quality of evidence. In detail, the findings were: levosimendan versus dobutamine (short‐term mortality: RR 0.60, 95% CI 0.36 to 1.03; participants = 1701; low‐quality evidence; long‐term mortality: RR 0.84, 95% CI 0.63 to 1.13; participants = 1591; low‐quality evidence); levosimendan versus placebo (short‐term mortality: no data available; long‐term mortality: RR 0.55, 95% CI 0.16 to 1.90; participants = 55; very low‐quality evidence); levosimendan versus enoximone (short‐term mortality: RR 0.50, 0.22 to 1.14; participants = 32; very low‐quality evidence; long‐term mortality: no data available); epinephrine versus norepinephrine‐dobutamine (short‐term mortality: RR 1.25; 95% CI 0.41 to 3.77; participants = 30; very low‐quality evidence; long‐term mortality: no data available); dopexamine versus dopamine (short‐term mortality: no deaths in either intervention arm; participants = 70; very low‐quality evidence; long‐term mortality: no data available); enoximone versus dobutamine (short‐term mortality RR 0.21; 95% CI 0.01 to 4.11; participants = 27; very low‐quality evidence; long‐term mortality: no data available); epinephrine versus norepinephrine (short‐term mortality: RR 1.81, 0.89 to 3.68; participants = 57; very low‐quality evidence; long‐term mortality: no data available); and dopamine‐milrinone versus dopamine‐dobutamine (short‐term mortality: RR 1.0, 95% CI 0.34 to 2.93; participants = 20; very low‐quality evidence; long‐term mortality: no data available). No information regarding all‐cause mortality were available for the comparisons milrinone versus dobutamine, enoximone versus piroximone and enoximone versus epinephrine‐nitroglycerine.
Authors' conclusions
At present, there are no convincing data supporting any specific inotropic or vasodilating therapy to reduce mortality in haemodynamically unstable patients with CS or LCOS.
Considering the limited evidence derived from the present data due to a high risk of bias and imprecision, it should be emphasised that there is an unmet need for large‐scale, well‐designed randomised trials on this topic to close the gap between daily practice in critical care of cardiovascular patients and the available evidence. In light of the uncertainties in the field, partially due to the underlying methodological flaws in existing studies, future RCTs should be carefully designed to potentially overcome given limitations and ultimately define the role of inotropic agents and vasodilator strategies in CS and LCOS.
PICO
Plain language summary
Inotropic and vasodilator strategies in people with cardiogenic shock or low cardiac output
Review question
We reviewed existing evidence on the treatment with different agents, which act by either increasing the ability of the heart to contract (inotropic drugs) or by expansion of the blood vessels (vasodilating drugs), regarding their effects on mortality in patients with cardiogenic shock (CS; shock due to critical reduction of cardiac pumping capacity) or low cardiac output syndrome (LCOS; reduced heart performance).
Background
CS and LCOS represent life‐threatening entities. Drug therapy of CS and LCOS is based on substances that stimulate contraction of the heart. The potent agents are frequently used for rescue in acute cardiac care. However, evidence for the treatment of patients suffering from unstable blood circulation is limited especially with regard to mortality.
Study characteristics
We included 19 studies with 2385 participants with CS or LCOS complicating myocardial infarction, heart failure or cardiac surgery. The follow‐up periods of the studies varied between the length of the recovery period and a period of up to 12 months. Eight studies were funded by the manufacturer of the investigated drug. In one study, the relationship to the pharmaceutical industry was not determined.
Key results
We compared different strategies employing inotropic or vasodilating drugs (i.e. levosimendan, enoximone, piroximone, epinephrine, norepinephrine, dopexamine, milrinone, dopamine and dobutamine). Low‐quality evidence reflects uncertainty regarding short‐ and long‐term mortality in the comparison of levosimendan with dobutamine. Very low‐quality evidence reflects uncertainty regarding long‐term mortality in the comparison of levosimendan with placebo; no data were available for the short‐term follow‐up. Very low‐quality evidence reflects uncertainty regarding short‐term mortality in the comparison of levosimendan with enoximone, epinephrine with norepinephrine‐dobutamine, dopexamine with dopamine, enoximone with dobutamine, and dopamine‐milrinone with dopamine‐dobutamine; no data were available for the long‐term follow‐up. Very low‐quality evidence reflects uncertainty for all‐cause mortality in the short and long term when comparing epinephrine with norepinephrine. No data on all‐cause mortality were available in the comparison of milrinone with dobutamine, enoximone with piroximone and enoximone with epinephrine‐nitroglycerine.
Quality of evidence
This evidence is current to October 2019. We have very little confidence in the results of the studies that we analysed (low‐ or very low‐quality evidence) due to relevant study limitations (risk of bias), imprecision or indirectness.
Authors' conclusions
Summary of findings
| Levosimendan compared to dobutamine for cardiogenic shock or low cardiac output syndrome | ||||||
| Patient or population: people with cardiogenic shock or low cardiac output syndrome | ||||||
| Outcomes | Anticipated absolute effects (95% CI) | Relative effect | No of participants | Quality of the evidence | Comments | |
|---|---|---|---|---|---|---|
| Risk with dobutamine | Risk with levosimendan | |||||
| All‐cause short‐term mortality: range 15 to 31 days | 148 per 10001 | 89 per 1000 | RR 0.60 (0.36 to 1.03) | 1701 | ⊕⊕⊝⊝ | Studies included participants with LCOS or CS due to cardiac surgery or HF. |
| All‐cause long‐term mortality: range 4 to 12 months | 288 per 10001 | 242 per 1000 | RR 0.84 | 1591 | ⊕⊕⊝⊝ | Studies included participants with LCOS or CS due to HF or AMI. |
| *The basis for the assumed risk (e.g. the median control group risk across studies) is provided in footnotes. The corresponding risk (and its 95% confidence interval) is based on the assumed risk in the comparison group and the relative effect of the intervention (and its 95% CI). | ||||||
| GRADE Working Group grades of evidence | ||||||
| 1Control group risk estimate comes from the control group risk in included studies with low cardiac output or cardiogenic shock. 2Downgraded 1 level for imprecision due to optimal information size criterion not being met and 1 level for study limitation due to stopping trial early for benefit and methodological limitations from lack of blinding. | ||||||
| Levosimendan compared with placebo for cardiogenic shock or low cardiac output syndrome | ||||||
| Patient or population: adults with cardiogenic shock or low cardiac output syndrome Settings: hospital Intervention: levosimendan Comparison: placebo | ||||||
| Outcomes | Anticipated absolute effects (95% CI) | Relative effect | No of participants | Quality of the evidence | Comments | |
|---|---|---|---|---|---|---|
| Risk with placebo | Risk with levosimendan | |||||
| All‐cause short‐term mortality: 1 month | Outcome not reported in any of the included studies. | |||||
| All‐cause long‐term mortality: range 4 to 6 months | 214 per 10001 | 118 per 1000 | RR 0.55 (0.16 to 1.90) | 55 | ⊕⊝⊝⊝ | Studies included participants with LCOS or CS due to HF or AMI. |
| *The basis for the assumed risk (e.g. the median control group risk across studies) is provided in footnotes. The corresponding risk (and its 95% confidence interval) is based on the assumed risk in the comparison group and the relative effect of the intervention (and its 95% CI). | ||||||
| GRADE Working Group grades of evidence | ||||||
| 1Control group risk estimate comes from the control group risk in included studies with low cardiac output or cardiogenic shock. 2Downgraded 2 levels for imprecision due to optimal information size criterion not being met and confidence interval crossing line of null effect and including appreciable benefit and harm and 1 level for study limitation due to methodological limitations from lack of blinding. | ||||||
| Levosimendan compared with enoximone for cardiogenic shock | ||||||
| Patient or population: adults with cardiogenic shock Settings: hospital Intervention: levosimendan Comparison: enoximone | ||||||
| Outcomes | Anticipated absolute effects (95% CI) | Relative effect | No of participants | Quality of the evidence | Comments | |
|---|---|---|---|---|---|---|
| Risk with enoximone | Risk with levosimendan | |||||
| All‐cause short‐term mortality: 30 days | 625 per 10001 | 313 per 1000 (138 to 712) | RR 0.50 (0.22 to 1.14) | 32 | ⊕⊝⊝⊝ very low2 | Study included participants with CS due to AMI. |
| All‐cause long‐term mortality | Outcome not reported in any of the included studies. | |||||
| *The basis for the assumed risk (e.g. the median control group risk across studies) is provided in footnotes. The corresponding risk (and its 95% confidence interval) is based on the assumed risk in the comparison group and the relative effect of the intervention (and its 95% CI). | ||||||
| GRADE Working Group grades of evidence | ||||||
| 1Control group risk estimate comes from the control group risk in a small included study with low cardiac output or cardiogenic shock. | ||||||
| Epinephrine compared with norepinephrine‐dobutamine for cardiogenic shock | ||||||
| Patient or population: adults with cardiogenic shock Setting: hospital Intervention: epinephrine Comparison: norepinephrine‐dobutamine | ||||||
| Outcomes | Anticipated absolute effects (95% CI) | Relative effect | No of participants | Quality of the evidence | Comments | |
|---|---|---|---|---|---|---|
| Risk with norepinephrine‐dobutamine | Risk with epinephrine | |||||
| All‐cause short‐term mortality: 28 days | 267 per 10001 | 333 per 1000 | RR 1.25 (0.41 to 3.77) | 30 | ⊕⊝⊝⊝ very low2 | Study included participants with CS due to HF. |
| All‐cause long‐term mortality | Outcome not reported in any of the included studies. | |||||
| *The basis for the assumed risk (e.g. the median control group risk across studies) is provided in footnotes. The corresponding risk (and its 95% confidence interval) is based on the assumed risk in the comparison group and the relative effect of the intervention (and its 95% CI). | ||||||
| GRADE Working Group grades of evidence | ||||||
| 1Control group risk estimate comes from the control group risk in a small included study with low cardiac output or cardiogenic shock. 2Downgraded 2 levels for imprecision due to optimal information size criterion not being met and confidence interval crossing line of null effect and including appreciable benefit and harm, and 1 level for study limitation due to methodological limitations from lack of blinding. | ||||||
| Dopexamine compared with dopamine for low cardiac output syndrome | ||||||
| Patient or population: adults with low cardiac output syndrome Setting: hospital Intervention: dopexamine Comparison: dopamine | ||||||
| Outcomes | Anticipated absolute effects (95% CI) | Relative effect | No of participants | Quality of the evidence | Comments | |
|---|---|---|---|---|---|---|
| Risk with dopamine | Risk with dopexamine | |||||
| All‐cause short‐term mortality: time in hospital | Not estimable1 | Not estimable1 | RR not estimable1 | 70 | ⊕⊝⊝⊝ very low2 | Study included participants with LCOS following elective surgery for CABG. |
| All‐cause long‐term mortality | Outcome not reported in any of the included studies. | |||||
| *The basis for the assumed risk (e.g. the median control group risk across studies) is provided in footnotes. The corresponding risk (and its 95% confidence interval) is based on the assumed risk in the comparison group and the relative effect of the intervention (and its 95% CI). | ||||||
| GRADE Working Group grades of evidence | ||||||
| 1No in‐hospital deaths were observed in the study. | ||||||
| Milrinone compared with dobutamine for low cardiac output syndrome | ||||||
| Patient or population: adults with low cardiac output syndrome Settings: hospital Intervention: milrinone Comparison: dobutamine | ||||||
| Outcomes | Anticipated absolute effects (95% CI) | Relative effect | No of Participants | Quality of the evidence | Comments | |
|---|---|---|---|---|---|---|
| Risk with dobutamine | Risk with milrinone | |||||
| All‐cause mortality | Outcome not reported in any of the included studies. | |||||
| *The basis for the assumed risk (e.g. the median control group risk across studies) is provided in footnotes. The corresponding risk (and its 95% confidence interval) is based on the assumed risk in the comparison group and the relative effect of the intervention (and its 95% CI). | ||||||
| GRADE Working Group grades of evidence | ||||||
| Enoximone compared with dobutamine for low cardiac output syndrome | ||||||
| Patient or population: adults with low cardiac output syndrome Setting: hospital Intervention: enoximone Comparison: dobutamine | ||||||
| Outcomes | Anticipated absolute effects (95% CI) | Relative effect | No of participants | Quality of the evidence | Comments | |
|---|---|---|---|---|---|---|
| Risk with dobutamine | Risk with enoximone | |||||
| All‐cause short‐term mortality: 1 month | 500 per 10001 | Not estimable2 | RR 0.21 (0.01 to 4.11) | 37 | ⊕⊕⊝⊝ very low3 | Study included participants with LCOS after mitral valve surgery. |
| All‐cause long‐term mortality | Outcome not reported in any of the included studies. | |||||
| *The basis for the assumed risk (e.g. the median control group risk across studies) is provided in footnotes. The corresponding risk (and its 95% confidence interval) is based on the assumed risk in the comparison group and the relative effect of the intervention (and its 95% CI). | ||||||
| GRADE Working Group grades of evidence | ||||||
| 1Control group risk estimate comes from a large observational study due to the small size of included studies in this population (Singh 2007). 2No in‐hospital deaths were observed in the study. | ||||||
| Epinephrine compared with norepinephrine for cardiogenic shock | ||||||
| Patient or population: adults with cardiogenic shock Settings: hospital Intervention: epinephrine Comparison: norepinephrine | ||||||
| Outcomes | Anticipated absolute effects (95% CI) | Relative effect | No of Participants | Quality of the evidence | Comments | |
|---|---|---|---|---|---|---|
| Risk with norepinephrine | Risk with epinephrine | |||||
| All‐cause short‐term mortality: 28 days | 266 per 10001 | 482 per 1000 (237 to 979) | RR 1.81 (0.89 to 3.68) | 57 | ⊕⊝⊝⊝ | Study included participants with CS due to AMI. |
| All‐cause long‐term mortality: 60 days | 366 per 10001 | 516 per 1000 | RR 1.41 (0.78 to 2.56) | 57 | ⊕⊝⊝⊝ | Study included participants with CS due to AMI. |
| *The basis for the assumed risk (e.g. the median control group risk across studies) is provided in footnotes. The corresponding risk (and its 95% confidence interval) is based on the assumed risk in the comparison group and the relative effect of the intervention (and its 95% CI). | ||||||
| GRADE Working Group grades of evidence | ||||||
| 1Control group risk estimate comes from the control group risk in a small included study with low cardiac output or cardiogenic shock. 2Downgraded 2 levels for imprecision due to optimal information size criterion not being met and confidence interval crossing line of null effect and including appreciable benefit and harm and 1 level for study limitation due to stopping trial early for benefit. | ||||||
| Dopamine‐milrinone compared with dopamine‐dobutamine for cardiogenic shock | ||||||
| Patient or population: adults with cardiogenic shock Settings: hospital Intervention: dopamine‐milrinone Comparison: dopamine‐dobutamine | ||||||
| Outcomes | Anticipated absolute effects (95% CI) | Relative effect | No of Participants | Quality of the evidence | Comments | |
|---|---|---|---|---|---|---|
| Risk with dopamine‐dobutamine | Risk with dopamine‐milrinone | |||||
| All‐cause short‐term mortality: at intensive care unit | 400 per 10001 | 400 per 1000 | RR 1.0 (0.34 to 2.93) | 20 | ⊕⊝⊝⊝ | Study included participants with CS due to HF. |
| All‐cause long‐term mortality | Outcome not reported in any of the included studies. | |||||
| *The basis for the assumed risk (e.g. the median control group risk across studies) is provided in footnotes. The corresponding risk (and its 95% confidence interval) is based on the assumed risk in the comparison group and the relative effect of the intervention (and its 95% CI). | ||||||
| GRADE Working Group grades of evidence | ||||||
| 1Control group risk estimate comes from the control group risk in a small included study with low cardiac output or cardiogenic shock. 2Downgraded 2 levels for imprecision due to optimal information size criterion not being met and confidence interval crossing line of null effect and including appreciable benefit and harm and 1 level for study limitation due to methodological limitations from lack of blinding and inappropriate random sequence generation. | ||||||
| Enoximone compared with piroximone for low cardiac output syndrome | ||||||
| Patient or population: adults with low cardiac output syndrome Settings: hospital Intervention: enoximone Comparison: piroximone | ||||||
| Outcomes | Anticipated absolute effects (95% CI) | Relative effect | No of Participants | Quality of the evidence | Comments | |
|---|---|---|---|---|---|---|
| Risk with piroximone | Risk with enoximone | |||||
| All‐cause mortality | Outcome not reported in any of the included studies. | |||||
| *The basis for the assumed risk (e.g. the median control group risk across studies) is provided in footnotes. The corresponding risk (and its 95% confidence interval) is based on the assumed risk in the comparison group and the relative effect of the intervention (and its 95% CI). | ||||||
| GRADE Working Group grades of evidence | ||||||
| Enoximone compared with epinephrine‐nitroglycerine for low cardiac output syndrome | ||||||
| Patient or population: adults with low cardiac output syndrome Settings: hospital Intervention: enoximone Comparison: epinephrine‐nitroglycerine | ||||||
| Outcomes | Anticipated absolute effects (95% CI) | Relative effect | No of Participants | Quality of the evidence | Comments | |
|---|---|---|---|---|---|---|
| Risk with epinephrine‐nitroglycerine | Risk with enoximone | |||||
| All‐cause mortality | Outcome not reported in any of the included studies. | |||||
| *The basis for the assumed risk (e.g. the median control group risk across studies) is provided in footnotes. The corresponding risk (and its 95% confidence interval) is based on the assumed risk in the comparison group and the relative effect of the intervention (and its 95% CI). | ||||||
| GRADE Working Group grades of evidence | ||||||
Background
Cardiovascular diseases are the leading causes of morbidity, loss of disability‐adjusted life years and mortality worldwide (Benjamin 2019). In 2013, the overall rate of death attributable to cardiovascular disease was 222.9 per 100,000 US citizens (Mozaffarian 2016). The estimated direct and indirect annual costs for cardiovascular disease and stroke were 351 billion USD between 2014 and 2015 (Benjamin 2019). As the population ages, the economic burden of cardiovascular diseases on the nation's healthcare system becomes even greater (CDC 2019). Data from the INTERHEART study showed that rates of cardiovascular disease have greatly increased with about 80% of the global burden in low‐income and middle‐income countries (Yusuf 2004).
Despite substantial progress in the cardiovascular field, acute heart failure continues to occur in a substantial number of cases. The underlying pathologies of impaired myocardial function are broad, spanning from valvular heart disease to systemic illness such as septic cardiomyopathy. These heterogeneously impair myocardial function and can rapidly cumulate into hypotension and tissue hypoperfusion via the complex cascade of the shock spiral (Hochman 2003).
Among many others, myocardial ischaemia is the most frequent cause of acutely impaired cardiac function (low cardiac output syndrome, LCOS) and, if clinically manifest, of haemodynamic instability (cardiogenic shock, CS). Acute myocardial infarction (AMI) is complicated by CS in approximately 5% to 10% of cases (Elbadawi 2019; Jeger 2008; Yeh 2010). While AMI has occurred less frequently in most recent years, the incidence of acute heart failure has remained unchanged (De Luca 2015). Reflecting the ageing and multi‐morbid society in Western countries, the proportion of patients with cumulating cardiovascular risk and/or manifest coronary artery disease are continually increasing. Urgent interventional revascularisation is the gold standard in AMI, which is even more true in cases complicated by LCOS or CS.
Despite modern therapy of acute heart failure, including rapid revascularisation if indicated, a substantial number of patients destabilises. In the case of continuing instability despite optimisation, different agents that enhance contractility (inotropes) and/or modulate afterload after the left ventricle are used to augment cardiac output and perfusion pressure, thereby stabilising patients at risk (O'Gara 2013; Ponikowski 2016; Steg 2012). More recently, agents that integrate inotropic and vasodilating effects (i.e. inodilation), phosphodiesterase (PDE) inhibitors or calcium sensitisers have been established (Reyentovich 2016; Thiele 2019).
Description of the condition
There is a continuum from LCOS to CS with uncertainty on the definite definition of a low cardiac output state. Haemodynamic criteria that are used include a reduced cardiac function (cardiac index (CI) < 1.8 L/min/m2 or < 2.2 L/min/m2 under inotropic therapy) and an elevated pulmonary capillary wedge pressure (PCWP) exceeding 15 mmHg (Reyentovich 2016). However, the definition in clinical trials vary (Reyentovich 2016). Clinically the condition presents with hypotension (systolic blood pressure < 90 mmHg for at least 30 minutes or the need for supportive means to maintain a systolic blood pressure of > 90 mmHg) and end‐organ hypoperfusion (such as cool extremities, urine output of less than 30 mL per hour, altered mental status or elevated serum lactate) (Reynolds 2008). In CS, low system oxygen delivery is going along with low cardiac output and is complicated by multi‐organ dysfunction. CS represents an acute, life‐threatening medical condition, which needs immediate attention.
Description of the intervention
Drug therapy can be characterised according to the following effects:
-
stimulation of myocardial contractility (inotropes)
-
left ventricular unloading by arterial vasodilation (vasodilators)
Drug therapy of CS is predominantly based on inotropic and vasoactive substances. They are administered for haemodynamic stabilisation by increasing cardiac output and, in turn, perfusion pressures and by optimising systemic vascular resistance (SVR). In early stages of LCOS, increased SVR often requires vasodilation to reduce afterload. Later stages are characterised by an escalating systemic inflammatory response syndrome and vasoplegia. At that point, only vasopressors at increasing dosages can restore the decreased SVR to maintain perfusion pressure.
How the intervention might work
The main strategy in the treatment of CS and LCOS is to re‐establish adequate macro‐ and microcirculation in order to stabilise oxygen supply at the cellular level and to modulate systemic inflammatory response to avoid functional and morphological cellular damage thereby preventing multi‐organ dysfunction and subsequent failure. Once cellular damage has become irreversible, therapeutic intervention, regardless of whether pharmacological‐ or device‐dependent, cannot impact long‐term mortality (De Luca 2004; Elbadawi 2019; Windecker 2013).
In order to stabilise patients with CS or LCOS, inotropes and/or vasopressors/vasodilators are used. Several drugs such as dobutamine, dopexamine, enoximone, milrinone, amrinone, levosimendan and istaroxime are used to increase cardiac contractility and to additionally reduce SVR thereby unloading the left ventricle from its afterload (Cholley 2019; How 2010; Leopold 2018; Nieminen 2016; Pietrangelo 2010; Rognoni 2011).
In contrast to this mainly haemodynamic concept, there is a lack of proof in solid endpoints. Levosimendan, for example, has not proven a clear superiority to placebo in the patient populations that have been enrolled in various recent multicentre randomised controlled trials in CS (Cholley 2019). Since there is limited satisfying evidence for catecholamines in CS, beneficial effects on quality of life or cost become relevant (Harjola 2010; HFMA 2010). However, while there is some evidence that inotropes like levosimendan might be cost‐effective in elective, high‐risk, cardiac surgery patients (Sanfilippo 2017), there is no comparable evidence in CS.
It is an accepted notion to limit the use of inotropic agents activating the beta‐receptor cyclic adenosine monophosphate (cAMP) pathway to 'rescue' therapy of CS refractory to standard means such as volume replacement, diuretics and vasodilators. This approach is largely supported by observations from clinical trials suggesting that both short‐term as well as long‐term inotropic therapy can increase arrhythmias and mortality (Chioncel 2020). Overall, we assume that the potential benefits of inotropic support in CS enables haemodynamic stabilisation by enhancing myocardial function. With increasing dosages of inotropic support, potential benefits need to be weighed against an increase of myocardial oxygen consumption. This is particularly true in the case of ischaemic myocardium. These disadvantages may be seen as adverse effects of inotropic therapy. At present, there is only poor evidence for a reduction of cellular damage using inotropic drugs (Triposkiadis 2009; Zheng 2009). Sole vasodilators, such as nitroglycerin or nitroprusside, on the other hand may only be used under guidance of haemodynamic monitoring in certain subgroups of CS (Chioncel 2020; Ponikowski 2016) to improve left ventricular performance by unloading via vasodilation (Den Uil 2009a; Hollenberg 2007).
Why it is important to do this review
While there is a broad body of evidence for the acute treatment of many cardiovascular diseases such as acute coronary syndromes (ACS) in stable haemodynamic conditions, there is only limited evidence for treatment of unstable patients due to CS. The recent revision of the German‐Austrian S3 Guideline continues to solely guide the treatment of infarct‐related CS (Werdan 2019). Of note, these recommendations reveal the lack of evidence for recommended catecholamine therapy. Particularly in unstable CS patients who continue to come along with critical mortality, randomised clinical trials are difficult to design and conduct. Considering the frequent numbers and crucial outcomes of CS and LCOS, however, further insights will likely have major implications on acute cardiac care.
Vasopressors are relevant to the overall topic but were excluded, as they are covered by another Cochrane Review on vasopressors in hypotensive shock (Gamper 2016).
Most of the existing randomised trials on CS have shown improved haemodynamics without affecting outcome (Thiele 2019). Thus, haemodynamic status might not be a suitable surrogate marker of survival. Given that quality of life is not the relevant endpoint in the context of acute cardiac care, it is important to assess the effects of interventions on all‐cause mortality even though definitive proof may be difficult to achieve.
Objectives
To assess efficacy and safety of cardiac care with positive inotropic agents and vasodilator strategies in people with CS or LCOS due to AMI, HF or cardiac surgery.
Methods
Criteria for considering studies for this review
Types of studies
We included randomised controlled trials (RCTs) of parallel‐group design that evaluated efficacy and safety within a follow‐up including at least the in‐hospital period. We excluded cross‐over trials due to the investigation of all‐cause mortality as the primary outcome. Our focus was on the acute setting and, therefore, we excluded prevention trials and long‐term studies (treatment lasting one month or more).
Types of participants
Adult patients, aged 18 years and over, with acute LCOS (medium‐risk study population) or CS (high‐risk study population) with a follow‐up period that included at least hospitalisation.
Types of interventions
-
Experimental intervention: we summarised treatments with investigational single drugs or combinations (whatever the dosage or intensity and mode, frequency, timing and duration of delivery) in one intervention group per substance. Therapeutic regimens were 'investigational' if they had been recently introduced into clinical practice or were compared to accepted therapeutic strategies, no matter whether these drugs had been investigated in regard to therapeutic efficacy or superiority.
-
Control intervention: treatments without specific experimental single drugs or corresponding combinations or treatment options including other inotropic or vasodilative drugs. We summarised placebo or no treatment in one control group.
Types of outcome measures
Results of prespecified outcomes were collected. Reporting one or more of the outcomes listed here in the trial was not an inclusion criterion for the review. Where a published report did not appear to report one of these outcomes, we planned to access the trial protocol and contact the trial authors to ascertain whether the outcomes were measured but not reported. Relevant trials which measured these outcomes but did not report the data at all, or not in a usable format, were included in the review as part of the narrative.
Primary outcomes
-
All‐cause mortality (short‐term: up to 1 month after treatment; long‐term: more than 1 month after treatment)
Secondary outcomes
-
Major adverse cardiac events (MACE) (AMI, re‐infarction, peri‐operative infarction, cerebrovascular accidents, repeat PCI, coronary artery bypass graft (CABG) surgery) (in hospital or ICU)
-
Length of hospital stay
-
Quality of life (in hospital or ICU; measured with validated scales, such as SF‐36)
-
Haemodynamics (cardiac index, pulmonary capillary wedge pressure (PCWP), mean arterial pressure (MAP) (in hospital or ICU))
-
Adverse events (in hospital or ICU)
-
Costs (in hospital or ICU)
Search methods for identification of studies
We conducted searches in cooperation with Cochrane Heart to identify published and unpublished RCTs.
Electronic searches
We updated our searches in the following databases on 24 October 2019:
-
Cochrane Central Register of Controlled Trials (CENTRAL) in the Cochrane Library (Issue 10 of 12, 2019);
-
MEDLINE Epub Ahead of Print, In‐Process & Other Non‐Indexed Citations, Daily and MEDLINE (Ovid, 1946 to 23 October 2019);
-
Embase Classic and Embase (Ovid, 1947 to 23 October 2019);
-
CPCI‐S (Conference Proceedings Citation Index‐Science) Web of Science (Clarivate Analytics, 1990 to 24 October 2019).
We used a combination of subject headings and text terms relating to CS, LCOS, drug therapy and comparative therapy trials to construct the search strategy for the review (Appendix 1). We applied the Cochrane sensitivity‐maximising RCT search filter to MEDLINE and adaptations of it to Embase and Web of Science (Lefebvre 2011). No language restrictions were imposed.
We also searched the following registers of ongoing and completed trials (Appendix 1):
-
controlled-trials.com (25 September 2019)
-
centerwatch.com (26 September 2019)
-
clinicalTrials.gov (26 September 2019)
-
The World Health Organisation (WHO) International Clinical Trials Registry Platform (ICTRP) apps.who.int/trialsearch (26 September 2019)
Searching other resources
We contacted members of Cochrane Heart, experts in the field and manufacturers of the drugs (Carinoharm GmbH Germany, Fresenius Kabi Germany, Orion Corporation Finland, Sanofi Aventis Deutschland GmbH Germany, UCB Pharma GmbH Germany) for further information. In addition, we scanned reference lists from eligible trials and contacted the first authors to obtain further information on study design and to collect individual participant data.
Data collection and analysis
Selection of studies
Two review authors (JS plus KU) independently screened studies identified using the search strategy described above by title, keywords and abstract. We accessed the full articles for further assessment if the information given suggested that the study:
-
included patients with AMI, HF or cardiac surgery complicated by CS or LCOS
-
compared
-
cardiac care with versus without inotropic therapies, or
-
cardiac care with versus without therapies having vasodilator properties
-
-
used designs with randomised allocation of participants
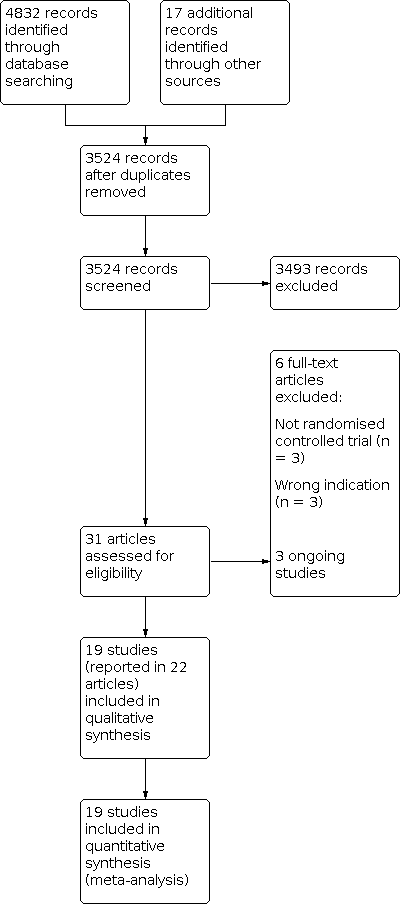
We settled differences in opinion by consensus with a third review author (SF). After the exclusion of non‐relevant publications and duplicates, we assessed the full‐text versions of the remaining papers against the inclusion and exclusion criteria, extracted data and entered them into standardised data extraction tables. We recorded the selection process in a PRISMA flow chart according to Moher 2009 (Figure 1).
Study flow diagram
Data extraction and management
Two review authors independently extracted the details of study population, interventions and outcomes (JS plus KU). The data extraction tables included the following items.
-
General information: title, authors, source, contact address, country, published or unpublished, language and year of publication, sponsoring of trial
-
Trial characteristics including study design, timing and follow‐up, quality assessment as specified below
-
Participants: inclusion and exclusion criteria, definition of indication, baseline characteristics, similarity of groups at baseline, number of people eligible/randomised/completing/analysed, reasons for withdrawals/loss to follow‐up
-
Interventions: dosage, route and timing of drug therapy/comparison intervention
-
Outcomes: participants per group, mortality at specific time points, adverse effects (with definitions, methods for monitoring), MACE, haemodynamics (cardiac index, PCWP, MAP), length of hospital and ICU stay, quality of life, costs
Assessment of risk of bias in included studies
Two review authors (JS plus KU) independently assessed the internal validity of eligible studies according to the Cochrane 'Risk of bias' tool (Higgins 2011a), resolving any disagreements by discussion until consensus was obtained. We described risk of bias and judged it as high, low or unclear in six specific domains:
-
random sequence generation
-
allocation concealment
-
blinding of participants, personnel and outcome assessment
-
incomplete outcome data addressed
-
selective reporting
-
other sources of bias (cross‐over design, baseline differences regarding the most important prognostic factors, conduct of the study affected by interim results, deviation from the study protocol not reflecting clinical practice, inappropriate administration of an intervention, contra‐active or similar pre‐randomisation intervention)
We used the following items to assess the risk of bias of adverse events reporting with the response options low or high risk of bias or unclear risk of bias (Higgins 2011a).
-
Are definitions of reported adverse events given?
-
Were the methods that were used for monitoring adverse events reported (e.g. use of prospective or routine monitoring; spontaneous reporting; participant checklist, questionnaire or diary; systematic survey of participants)?
-
Were any participants excluded from the adverse events analysis?
-
Does the report provide numerical data by intervention group?
-
Which categories of adverse events were reported by the investigators?
Measures of treatment effect
We presented dichotomous data (such as all‐cause mortality, frequencies of MACE events) as risk ratios (RRs) with their 95% confidence intervals (CIs) and continuous data (such as haemodynamic measures) as mean differences and 95% CIs. The data on haemodynamics (cardiac index, PCWP, MAP) were reported differently for the included studies and are summarised in an additional table. No information on quality of life or costs was available from the eligible trials.
Unit of analysis issues
Participants were randomised into treatment groups. The unit of analysis was the individual participant with one single measurement for each outcome. As we only included RCTs with a parallel design, unit of analysis issues did not occur.
Dealing with missing data
If data were not available in the trial report or data collection, we contacted the trial investigators to provide missing data.
Assessment of heterogeneity
This systematic review brings together diverse material, with studies differing in the participants, interventions and exposure times, therefore we did not expect a single‐study effect and planned to apply a random‐effects model. To quantify the extent of variability among the studies, we planned to estimate the Q‐test for heterogeneity in order to quantify heterogeneity as a proportion of variability with Thompson’s I2 statistic and to calculate the between‐study variance τ2 (Higgins 2002; Rücker 2008). Thresholds used for interpretation of I2 were: 0% to 40% low heterogeneity, 30% to 60% moderate heterogeneity, 50% to 90% substantial heterogeneity, 75% to 100% considerable heterogeneity. Since the improtance of the observed value of I2 depends on (i) the magnitude and direction of effects and (ii) the strength of evidence for heterogeneity those factors were taken into account in the categorization. In case of considerable heterogeneity results were reported by trial rather than the summary effect measure.
The following factors are possible sources of clinically relevant heterogeneity and we have summarised them in the table Characteristics of included studies.
-
Different variations of standard therapies (other vasoactive drugs, re‐vascularisation, intra‐aortal balloon pump (IABP), mechanical ventilation, renal replacement therapy)
-
Different variations of the experimental intervention (doses and scheduling)
-
Different variations of control groups (treatment without investigated single drugs or combinations, treatment with placebo or no treatment)
-
Differences in outcome‐relevant prognostic factors (age, gender, comorbidities, cardiac index, ejection fraction, time from symptom onset to intervention)
-
Different definition of the indication (CS versus LCOS)
-
Quality of studies
Assessment of reporting biases
The use of funnel plots for the graphical detection of publication bias was not possible due to the small number of eligible trials.
Data synthesis
The data we extracted from randomised studies was based on the intention‐to‐treat (ITT) principle. We undertook meta‐analyses using a random‐effects model with reference to the expected clinical heterogeneity of the comparable studies arising from differences in study characteristics and the associated assumption that the effects being estimated in the different studies were not identical but followed some distribution.
Subgroup analysis and investigation of heterogeneity
We planned subgroup analyses for all‐cause mortality with regard to sex, age, and cause of LCOS/CS. However, due to lack of available data, no subgroup analyses were conducted.
Sensitivity analysis
We performed a sensitivity analysis by comparing results of the random‐effects model and the fixed‐effect model.
Summary of findings and assessment of the certainty of the evidence
We created 'Summary of findings' tables using GRADEpro GDT (GRADEpro GDT 2015) to summarise evidence and included our primary outcome (all‐cause mortality) (Guyatt 2011a; Guyatt 2013). We used the five GRADE considerations (study limitations, inconsistency, imprecision, indirectness and other considerations) to rate our overall confidence in effect estimates. We used methods and recommendations as described in GRADE to rate the quality of evidence (Balshem 2011; Guyatt 2011b; Guyatt 2011c; Guyatt 2011d; Guyatt 2011e; Guyatt 2011f) and justified all decisions to downgrade the quality of evidence using footnotes. We added comments to aid the reader's understanding of the review where necessary (Santesso 2016).
To estimate the assumed risk of death in the control group, we used the median risk among control groups from the included studies to describe the baseline risk for people with CS or LCOS. Due to the small size of some of the included studies, we also used the control group risk from a well‐designed observational study to describe the high baseline risk of mortality for people with LCOS/CS having standard cardiac care (Singh 2007).
Results
Description of studies
Randomised controlled trials (RCTs) in people with AMI, HF or cardiac surgery complicated by CS or LCOS.
Results of the search
The previous version of this review included 13 studies. We updated the searches to identify any new potentially relevant references and identified a total of 3524 references after duplicates had been removed. In total, we thought 31 papers were of relevance and assessed them against the inclusion and exclusion criteria. Of these, 19 studies (reported in 22 papers) met our predefined inclusion criteria (see Characteristics of included studies). The remaining studies are listed in Characteristics of excluded studies. We recorded the process in a PRISMA flow chart (Figure 1).
Included studies
Nineteen randomised controlled trials met the inclusion criteria. Four of these investigated people with AMI complicated by CS or LCOS (Fuhrmann 2008; Garcίa‐González 2006; Husebye 2013; Levy 2018), seven investigated people with acute HF complicated by CS or LCOS (Adamopoulos 2006; Follath (LIDO) 2002; Galinier 1990; Levy 2011; Mebazaa (SURVIVE) 2007; Meissner 1996; Slawsky 2000), and eight investigated people with cardiac surgery complicated by CS or LCOS (Alvarez 2006; Atallah 1990; Feneck 2001; Lancon 1990; Levin 2008; Patel 1993; Rosseel 1997; Zwölfer 1995).
The majority of published clinical trials examined levosimendan (Adamopoulos 2006; Alvarez 2006; Follath (LIDO) 2002; Fuhrmann 2008; Garcίa‐González 2006; Husebye 2013; Levin 2008; Mebazaa (SURVIVE) 2007; Slawsky 2000). Five trials investigated enoximone (Atallah 1990; Galinier 1990; Lancon 1990; Patel 1993; Zwölfer 1995). There were only two trials investigating epinephrine (Levy 2011; Levy 2018), one trial investigating dopexamine (Rosseel 1997), one trial investigating milrinone (Feneck 2001) and one trial investigating dopamine plus milrinone (Meissner 1996). Control group participants were treated with dobutamine (Adamopoulos 2006; Alvarez 2006; Atallah 1990; Feneck 2001; Follath (LIDO) 2002; Galinier 1990; Garcίa‐González 2006; Lancon 1990; Levin 2008; Mebazaa (SURVIVE) 2007), dopamine (Rosseel 1997), dopamine plus dobutamine (Meissner 1996), enoximone (Fuhrmann 2008), norepinephrine (Levy 2018), norepinephrine plus dobutamine (Levy 2011), piroximone (Patel 1993), epinephrine plus nitroglycerine (Zwölfer 1995) or placebo (Adamopoulos 2006; Husebye 2013; Slawsky 2000).
Twelve studies were conducted as single‐centre trials in France (Atallah 1990; Galinier 1990; Lancon 1990; Levy 2011), Spain (Alvarez 2006; Garcίa‐González 2006), Germany (Fuhrmann 2008; Meissner 1996), Austria (Zwölfer 1995), Greece (Adamopoulos 2006), Norway (Husebye 2013) and the UK (Patel 1993). Seven studies were conducted as multicentre trials in Argentina (Levin 2008), France (Levy 2018), the UK (Feneck 2001), the USA (Slawsky 2000), the Netherlands plus Belgium (Rosseel 1997), Europe (Follath (LIDO) 2002) or Europe, Israel and Russia (Mebazaa (SURVIVE) 2007).
Trials acknowledging funding by the pharmaceutical industry were Feneck 2001 (supported by Sanofi Winthrop Limited and statistical advice from J.M. White Associate); Follath (LIDO) 2002 (supported by Orion Pharma, Ercopharma and Quintiles/Innovex); Husebye 2013 (supported by Orion Pharma); Lancon 1990 (author associated with Merrell Dow), Levy 2018 (supported by INSERM‐DHOS; authors associated with Pulsion, Baxter, Orion, Lilly, Novartis, Aguettant, Merck, Sharp and Dohme, Gilead, Relypsa, AstraZeneca, Grünenthal, Stealth Peptides, Fresenius, Vifor Fresenius Medical Care Renal Pharma, Vifor, CTMA, Bayer, CVRx, CardioRenal, Servier, Abbott, Roche, Bristol Myers Squibb, Adrenomed, Neurotronik, Sanofi, Sphyngotec); Mebazaa (SURVIVE) 2007 (supported by Orion Pharma, Abbott Laboratories and ICON Clinical Research; authors associated with Orion Pharma, Abbott, Protein Design Biopharma, Sigma‐Tau, Guidant, Edwards Life Sciences, Scios, Medtronic, Pfizer, AstraZeneca, Amgen, Takeda, Menarini); Patel 1993 (supported by Merrel Dow) and Zwölfer 1995 (authors associated with Merrell Dow). In Levy 2011, conflict of interest was not disclosed.
Each study characteristic is presented briefly in the table Characteristics of included studies. We included information from two secondary publications of two eligible trials (Atallah 1990; Garcίa‐González 2006). A more comprehensive assessment of the included studies is given below.
Participants
Altogether, 1979 participants were enrolled in the trials on levosimendan; 1005 were treated with levosimendan, and 974 served as controls and were treated with dobutamine (23 participants in Adamopoulos 2006, 20 participants in Alvarez 2006, 100 participants in Follath (LIDO) 2002, 11 participants in Garcίa‐González 2006, 68 participants in Levin 2008, 660 participants in Mebazaa (SURVIVE) 2007); enoximone (16 participants in Fuhrmann 2008); or placebo (23 participants in Adamopoulos 2006, five participants in Husebye 2013, 48 participants in Slawsky 2000). Husebye 2013 investigated 61 participants with AMI complicated by acute HF. The trial authors provided individual personal data on all participants with CS. 109 participants were enrolled in trials on enoximone; 54 were treated with enoximone, and 55 served as controls and were treated with dobutamine (19 participants in Atallah 1990, 10 participants in Galinier 1990, 10 participants in Lancon 1990); piroximone (10 participants in Patel 1993); or epinephrine plus nitroglycerine (six participants in Zwölfer 1995). Eighty‐seven participants were enrolled in trials on epinephrine; 42 were treated with epinephrine and 45 served as controls and were treated with norepinephrine (30 participants in Levy 2018) or norepinephrine plus dobutamine (15 participants in Levy 2011). One trial on dopexamine (Rosseel 1997) included 70 participants with 35 of them receiving dopamine as control. One trial on milrinone (Feneck 2001) included 120 participants with 60 of them receiving dobutamine as control. One trial on dopamine plus milrinone (Meissner 1996) included 20 participants with 10 of them receiving dopamine plus dobutamine as control.
The mean or median age varied between 56 and 73 years. Husebye 2013 excluded participants under 20 years of age, Follath (LIDO) 2002 excluded participants under 21 years of age and Rosseel 1997 excluded participants over 75 years of age. In all other trials, adult patients (aged 18 years and over) with no age restriction were enrolled. Between 30% (Atallah 1990) and 87% (Follath (LIDO) 2002) of participants in the included trials were male.
Time of randomisation varied between trials. Participants in Fuhrmann 2008 had to be included within two hours following PCI and 24 hours of CS, participants in Garcίa‐González 2006 had to be included within 24 hours and participants in Husebye 2013 within 48 hours following PCI. Participants in Meissner 1996 were eligible with acute AMI within the past two weeks. Participants in Alvarez 2006 had to be included within four hours and participants in Levin 2008 within six hours post‐cardiac surgery. Participants in Feneck 2001 had to be included within two hours after separation from cardiopulmonary bypass and at least 15 minutes after protamine administration. Information concerning time of randomisation was unavailable in Adamopoulos 2006, Atallah 1990, Follath (LIDO) 2002, Galinier 1990, Lancon 1990, Levy 2011, Levy 2018, Mebazaa (SURVIVE) 2007, Patel 1993, Rosseel 1997, Slawsky 2000 and Zwölfer 1995.
Baseline MAP varied between 55 ± 9 mmHg and 54 ± 8 mmHg in Levy 2011's two treatment groups, and 81 ± 16 mmHg and 88 ± 15 mmHg in Galinier 1990's two treatment groups. Baseline CI varied between 1.6 ± 0.4 L/min/m2 in both treatment groups of Levy 2011, and 2.3 (interquartile range (IQR) 2.1 to 2.5) L/min/m2 and 2.2 (IQR 1.7 to 2.4) L/min/m2 in the two treatment groups of Fuhrmann 2008. Baseline PCWP varied between 10.3 ± 2.7 mmHg and 10.1 ± 1.3 mmHg in the two treatment groups of Patel 1993 and 28.2 ± 7.9 mmHg and 31.0 ± 6.7 mmHg in the two treatment groups of Galinier 1990. Information concerning baseline MAP, CI or PCWP was unavailable in Mebazaa (SURVIVE) 2007.
According to the inclusion and exclusion criteria described, 12 studies included solely participants suffering from LCOS (Adamopoulos 2006; Alvarez 2006; Atallah 1990; Feneck 2001; Follath (LIDO) 2002; Galinier 1990; Lancon 1990; Levin 2008; Patel 1993; Rosseel 1997; Slawsky 2000; Zwölfer 1995), six studies included solely participants suffering from CS (Fuhrmann 2008; Garcίa‐González 2006; Husebye 2013; Levy 2011; Levy 2018; Meissner 1996) and one study included participants suffering from either LCOS or CS (Mebazaa (SURVIVE) 2007).
Interventions
Nine included trials investigated the efficacy and safety of the calcium‐sensitiser levosimendan in combination with established therapeutic regimens. The comparisons were the following.
-
Adamopoulos 2006: levosimendan (10 min intravenous injection of 6 µg/kg followed by a continuous 24 h infusion at 0.1 µg/kg/min) compared with either placebo (continuous 24 h infusion of dextrose 5%) or dobutamine (continuous 24 h infusion at 5 µg/kg/min; if a symptomatic reduction was not achieved after 2 h, the rate of dobutamine infusion was gradually doubled)
-
Alvarez 2006: levosimendan (loading dose of 12 µg/kg over 15 – 20 min followed by continuous infusion of 0.2 µg/kg/min for 24 h) compared with dobutamine (continuous infusion of 7.5 µg/kg/min for 24 h)
-
Follath (LIDO) 2002: levosimendan (loading dose of 24 µg/kg over 10 min followed by continuous infusion of 0.1 µg/kg/min for 24 h) compared with dobutamine (continuous infusion of 5 µg/kg/min for 24 h); the infusion rate of either levosimendan or dobutamine was doubled if an adequate haemodynamic response was not achieved after 2 h
-
Fuhrmann 2008: levosimendan (front loading of 12 µg/kg over 10 min followed by 0.1 µg/kg/min for 50 min and 0.2 µg/kg/min infused for 23 h) compared with enoximone (fractional bolus of 0.5 µg/kg over 30 min followed by 2 to 10 µg/kg/min continuously titrated to the best haemodynamic response)
-
Garcίa‐González 2006: levosimendan (loading dose of 24 µg/kg over 10 min followed by continuous infusion of 0.1 µg/kg/min for 24 h) compared with dobutamine (continuous 24 h infusion at 5 µg/kg/min; if an adequate response (defined as an increase in CPO of at least 30%) was not achieved after 2 h, the rate of dobutamine infusion was doubled until the desired haemodynamic response was achieved)
-
Husebye 2013: levosimendan (0.2 µg/kg/min for 1 h followed by 0.1 µg/kg/min for 24 h) compared with placebo (infusion for 25 h matching size, colour of solution and packaging)
-
Levin 2008: levosimendan (loading dose of 10 µg/kg over 1 h followed by continuous infusion of 0.1 µg/kg/min for 24 h) compared with dobutamine (continuous 24 h infusion at 5 µg/kg/min; if a favourable haemodynamic response was not observed the dose was increased successively to 7.5/10/12.5 µg/kg/min at 15 min intervals)
-
Mebazaa (SURVIVE) 2007: levosimendan (loading dose of 12 µg/kg over 10 min followed by an infusion of 0.1 µg/kg/min for 50 min followed by an infusion of 0.2 µg/kg/min for 23 h) compared with dobutamine (infusion initiated at 5 µg/kg/min; dose could be increased at the discretion of the investigator to a maximum rate of 40 µg/kg/min; infusion was maintained as long as clinically appropriate (minimum 24 h) and was tapered according to each participant`s clinical status)
-
Slawsky 2000: levosimendan (bolus of 6 µg/kg followed by a continuous infusion initially at a rate of 0.1 µg/kg/h; at hourly intervals a repeated bolus (6 µg/kg) was given and the infusion rate was increased by increments of 0.1 µg/kg; up‐titration was continued until a maximum rate of 0.4 µg/kg/min was achieved or a dose‐limiting event (HR > 130 beats per minute (bpm) or an increase in HR of > 15 bpm above baseline for 10 min; symptomatic hypotension or a drop in SBP to < 75 mmHg; decrease in PCWP to ≤ 10 mmHg; any adverse event that in the opinion of the site investigator required drug dose modification) occurred); if a dose‐limiting event occurred the study drug was discontinued until the event resolved and was then restarted at the next lower dose compared with placebo
Five included trials investigated the efficacy and safety of enoximone:
-
Atallah 1990: enoximone (bolus of 1 mg/kg for 10 min followed by a continuous infusion of 5 to 10 µg/kg/min for at least 24 h according to each participant`s clinical status) compared with dobutamine (continuous infusion of 5 to 10 µg/kg/min for at least 24 h according to each participant`s clinical status)
-
Galinier 1990: enoximone (loading dose of 50 µg/kg/min over 30 min followed by an infusion of 10 µg/kg/min for 12 h) compared with dobutamine (infusion of 10 µg/kg/min for 12 h)
-
Lancon 1990: enoximone (bolus of 0.5 to 1 mg/kg followed by a continuous infusion of 2 to 20 µg/kg/min as required to achieve an increase in CI of at least 30 % by the end of the first hour; the study period lasted 14 h) compared with dobutamine (continuous infusion of 5 to 15 µg/kg/min as required to achieve an increase in CI of at least 30% by the end of the first hour; the study period lasted 14 h)
-
Patel 1993: enoximone (loading dose of 0.5 mg/kg over 20 min followed by an infusion of 5 µg/kg/h; the study period was until 3h after the start of infusion the study drug) compared with piroximone (loading dose of 0.5 mg/kg over 20 min followed by an infusion of 5 µg/kg/h; the study period was until 3 h after the start of infusion the study drug)
-
Zwölfer 1995: enoximone (bolus of 0.5 mg/kg over 10 min followed by an infusion of 5 µg/kg/min increased up to 20 µg/kg/min according to haemodynamic response (MAP 60 – 80 mmHg) for 4 h) compared with epinephrine‐nitroglycerine (epinephrine infusion starting with 0.05 µg/kg/min in combination with a nitroglycerin infusion of 0.5 µg/kg/min according to haemodynamic response (MAP 60 – 80 mmHg) for 4 h)
Two included trials investigated the efficacy and safety of epinephrine:
-
Levy 2011: epinephrine (initiated at 0.1 µg/kg/min; infusion rate was titrated at 5‐min intervals to a MAP between 65 and 70 mmHg with a stable or increased CI; tapering of study drug if the target MAP had been maintained for 8 h) compared with norepinephrine‐dobutamine (norepinephrine initiated at 0.1 µg/kg/min; infusion rate of norepinephrine was titrated at 5‐min intervals to a MAP between 65 and 70 mmHg with a stable or increased CI; infusion of dobutamine at a dose of up to 10 µg/kg/min; tapering of study drugs if the target MAP had been maintained for 8 h)
-
Levy 2018: epinephrine (continuous infusion increased by 0.02 µg/kg/min (or higher in emergency cases) to the targeted MAP of 65 – 70 mmHg; a participant was considered to be weaned from vasopressor therapy after 24 h of haemodynamic stability without vasopressor support – during this time lag, if MAP decreased to < 65 – 70 mmHg, the study drug was reintroduced; the study period lasted a maximum of 60 days) compared with norepinephrine (continuous infusion increased by 0.02 µg/kg/min (or higher in emergency cases) to the targeted MAP of 65 – 70 mmHg; a participant was considered to be weaned from vasopressor therapy after 24 h of haemodynamic stability without vasopressor support – during this time lag, if MAP decreased to < 65 – 70 mmHg, the study drug was reintroduced; the study period lasted a maximum of 60 days)
One included trial investigated the efficacy and safety of dopexamine:
-
Rosseel 1997: dopexamine (titration in 3 steps each at 15 min intervals: 0.5/1.0/2.0 µg/kg/min until CI was > 2.5 L/min/m2; continuous infusion at effective dose level for 6 h) compared with dopamine (titration in 3 steps each at 15‐min intervals: 1.5/3.0/6.0 µg/kg/min until CI was > 2.5 L/min/m2; continuous infusion at effective dose level for 6 h)
One included trial investigated the efficacy and safety of milrinone:
-
Feneck 2001: milrinone (loading dose of 50 µg/kg over 10 min followed by an infusion of 0.5 µg/kg/min; after 1 h an upward dose adjustment could be made if clinically indicated by giving a second loading dose (50 µg/kg over 10 min) and an infusion of 0.75 µg/kg/min; the study drug was continued as long as clinically indicated) compared with dobutamine (continuous infusion started at 10 µg/kg/min; at 15‐min intervals an upward dose adjustment to 15 µg/kg/min, then 20 µg/kg/min could be made if clinically indicated; the study drug was continued as long as clinically indicated)
One included trial investigated the efficacy and safety of dopamine‐milrinone:
-
Meissner 1996: dopamine‐milrinone (continuous infusion of dopamine (10 – 12 µg/kg/min for 4 h) combined with a loading dose of milrinone (50 µg/kg over 10 min) followed by an continuous infusion of milrinone (0.5 µg/kg/min for 4 h)) compared with dopamine‐dobutamine (continuous infusion of dopamine (10 – 12 µg/kg/min for 4 h) combined with a continuous infusion of dobutamine in cumulatively increasing dosage of 3/6/9 µg/kg/min in 20‐minute intervals each; from 1 h maintenance dose of 9 µg/kg/min dobutamine for further 3 h)
Excluded studies
We excluded six trials because they were not RCTs (El Mokhtari 2007; Pomer 1986; Rychter 1985) or due to wrong indication (Al‐Shawaf 2006; Dupuis 1992; Seino 1996). Reasons for exclusion are presented briefly in tabulated form (see Characteristics of excluded studies).
Ongoing studies
We identified three ongoing studies investigating milrinone versus dobutamine for LCOS/CS treatment (NCT03207165), norepinephrine versus norepinephrine‐dobutamine for CS treatment (NCT03340779) or levosimendan versus placebo for CS treatment (NCT04020263). For details of the planned investigations in tabulated form, please see Characteristics of ongoing studies.
Risk of bias in included studies
All trials were published in peer‐reviewed journals. Included trials were small with the exception of Mebazaa (SURVIVE) 2007, which enrolled 1320 participants. In all trials, analysis was done by intention‐to‐treat. Figure 2 and Figure 3 present a summary of all investigated sources of bias in the 19 eligible studies. The 'Risk of bias' tables of the individual trials are given in Characteristics of included studies.

Risk of bias summary: review authors' judgements about each risk of bias item for each included study

Risk of bias graph: review authors' judgements about each risk of bias item presented as percentages across all included studies
Allocation
Risk of bias for random sequence generation was rated low for 10 studies, unclear for eight studies (no information provided), and high for one study (inappropriate approach). Risk of bias for allocation concealment was rated low for five studies, unclear for five studies (no information provided), and high for nine studies (open‐label trials without concealment).
The method of random sequence generation was reported in 11 trials (Atallah 1990; Follath (LIDO) 2002; Fuhrmann 2008; Galinier 1990; Husebye 2013; Lancon 1990; Levin 2008; Levy 2018; Mebazaa (SURVIVE) 2007; Meissner 1996; Rosseel 1997). A block randomisation by means of a computer‐generated code was used by Follath (LIDO) 2002; Fuhrmann 2008; Husebye 2013; Levin 2008; Levy 2018 and Rosseel 1997 with Husebye 2013 using an extra stratum for participants with CS. Drawing of lots was performed by Atallah 1990 and Galinier 1990 and shuffling of envelopes by Lancon 1990. Mebazaa (SURVIVE) 2007 randomised participants centrally using an interactive voice‐response system, which was stratified by a biased coin algorithm with previous acute decompensated heart failure and country as factors. An inadequate method of sequence generation, i.e. assignment based on date of birth, was used by Meissner 1996.
Follath (LIDO) 2002; Husebye 2013; Levy 2018; Mebazaa (SURVIVE) 2007 and Rosseel 1997 described the method of allocation concealment. Allocation was performed by a blinded investigator according to a pre‐determined list. No information was available from Adamopoulos 2006; Atallah 1990; Meissner 1996; Slawsky 2000 and Zwölfer 1995. All other studies were assigned as open‐label trials without concealment.
Blinding
Risk of bias for blinding of participants and personnel was rated low for six studies and high for 13 studies (open‐label trials or different administration of the study drug). Risk of bias for outcome assessment was rated low for seven studies, unclear for three studies (no information provided), and high for nine studies (open‐label trials without concealment).
Risk of bias due to performance or detection was low in Follath (LIDO) 2002; Husebye 2013; Levy 2018; Mebazaa (SURVIVE) 2007 and Rosseel 1997. In Atallah 1990 and Garcίa‐González 2006, outcome assessment was blinded but not personnel/participants. In Slawsky 2000, personnel/participants were blinded, but blinding of outcome assessment was opened. In all other studies, blinding was either not performed or not possible due to different administration of the study drug.
Incomplete outcome data
Risk of bias for incomplete outcome data was rated low for 14 studies and high for five studies (exclusion of participants with no data reported for these participants).
In sum, eight studies reported exclusion of participants (Alvarez 2006; Atallah 1990; Feneck 2001; Follath (LIDO) 2002; Mebazaa (SURVIVE) 2007; Patel 1993; Rosseel 1997; Slawsky 2000). Fuhrmann 2008 reported haemodynamic changes in 36 participants but randomised only 32 participants.
Selective reporting
Risk of bias for selective reporting was rated low for all studies. All outcomes prespecified in the method sections were reported, however, prespecified secondary endpoints were missing in Galinier 1990; Meissner 1996 and Patel 1993.
Other potential sources of bias
Risk of bias for other potential sources of bias was rated low for nine studies, unclear for two studies (affected by interim results), and high for eight studies (inappropriate delivery and interruptions of study drug administration, concerns regarding the eligibility of the included participant).
None of the included trials reported any cross‐over or deviation from the study protocol.
The conduct of three trials was affected by interim results. Fuhrmann 2008 was stopped as a result of an interim analysis performed after recruitment of 32 participants in consultation with the ethics committee due to a trend towards reduced mortality for levosimendan. Levy 2018 was terminated prematurely by the data and safety monitoring board given the higher incidence of refractory shock in the epinephrine group. In Mebazaa (SURVIVE) 2007, the originally targeted number of participants (n = 700) was increased to 1320 following a blinded review of mortality after 131 deaths to achieve the target number of 330 deaths.
Seven trials reported inappropriate delivery and interruptions of study drug administration (Feneck 2001; Follath (LIDO) 2002; Husebye 2013; Mebazaa (SURVIVE) 2007; Patel 1993; Rosseel 1997; Slawsky 2000).
All trials addressed the problem of pre‐randomisation drug‐treatment strategies. Most of the included participants were not randomised to the study drug at the index event (onset of LCOS/CS) and they were therefore pretreated with different inotropic and vasoactive drugs, which could have influenced microcirculation and thereby affected prognosis.
To the best of our knowledge, no trial used a complex standardised study protocol for vasopressor titration for the assessment of the lowest necessary vasopressor dosage in each individual participant.
Although the title and inclusion criteria of the study conducted by Garcίa‐González 2006 implied that the enrolled participants suffered from CS, there remained major concerns regarding the eligibility of the included participants. This was because none of them developed multi‐organ failure and the mortality rates appeared very low in comparison to commonly reported data.
Bias affecting the quality of evidence on adverse events
Risk of bias for adverse events was rated low for nine studies and high for 10 studies (none or very limited monitoring).
Reports on adverse events were missing in two trials (Adamopoulos 2006; Lancon 1990). Fuhrmann 2008; Garcίa‐González 2006; Husebye 2013; Levin 2008; Levy 2018; Mebazaa (SURVIVE) 2007 and Rosseel 1997 reported on previously defined adverse events but only Husebye 2013; Levin 2008 and Levy 2018 gave definitions of the reported adverse events. In Meissner 1996, solely all‐cause mortality within stay at the ICU was monitored. In Feneck 2001, a report of adverse events was limited to those occurring in more than five participants and in Slawsky 2000 to those occurring within 6 h. In Alvarez 2006; Atallah 1990; Follath (LIDO) 2002; Galinier 1990; Levy 2011; Patel 1993 and Zwölfer 1995, monitoring was restricted to spontaneous reports of some adverse events which occurred. None of the studies (with the limitation of Adamopoulos 2006 and Lancon 1990, who have not provided any information) excluded participants from adverse event analysis.
Effects of interventions
See: Summary of findings 1 Levosimendan compared to dobutamine for cardiogenic shock or low cardiac output syndrome; Summary of findings 2 Levosimendan compared to placebo for cardiogenic shock or low cardiac output syndrome; Summary of findings 3 Levosimendan compared to enoximone for cardiogenic shock; Summary of findings 4 Epinephrine compared to norepinephrine‐dobutamine for cardiogenic shock; Summary of findings 5 Dopexamine compared to dopamine for low cardiac output syndrome; Summary of findings 6 Milrinone compared to dobutamine for low cardiac output syndrome; Summary of findings 7 Enoximone compared to dobutamine for low cardiac output syndrome; Summary of findings 8 Epinephrine compared to norepinephrine for cardiogenic shock; Summary of findings 9 Dopamine‐milrinone compared to dopamine‐dobutamine for cardiogenic shock; Summary of findings 10 Enoximone compared to piroximone for low cardiac output syndrome; Summary of findings 11 Enoximone compared to epinephrine‐nitroglycerine for low cardiac output syndrome
1. Levosimendan versus dobutamine
Three small, single‐centre trials with 109 participants (Adamopoulos 2006; Alvarez 2006; Garcίa‐González 2006) as well as three multicentre trials with 1660 participants (Follath (LIDO) 2002; Levin 2008; Mebazaa (SURVIVE) 2007) investigated levosimendan compared with dobutamine in people with AMI (Garcίa‐González 2006), acute HF (Adamopoulos 2006; Follath (LIDO) 2002; Mebazaa (SURVIVE) 2007) or cardiac surgery (Alvarez 2006; Levin 2008) complicated by CS/LCOS (summary of findings Table 1).
All‐cause mortality
Short‐term
Levosimendan when compared to dobutamine may reduce all‐cause mortality in the short term with 94 deaths out of 853 participants (11.0%) in the intervention arm with levosimendan compared with 126 deaths out of 848 participants (14.9%) in the control group treated with dobutamine (RR 0.60, 95% CI 0.36 to 1.03; participants = 1701; studies = 4; low‐quality evidence) with moderate heterogeneity between single studies (I2 = 46%) (Analysis 1.1). Out of 1000 people with CS, approximately 148 would be expected to die with standard cardiac care with dobutamine within a short‐term follow‐up period compared to 89 (95% CI 53 to 152) with levosimendan.
Long‐term
Levosimendan when compared to dobutamine may make little or no difference in the long‐term with 205 deaths out of 797 participants (25.7%) in the intervention arm with levosimendan compared with 229 deaths out of 794 participants (28.8%) in the control group treated with dobutamine (RR 0.84, 95% CI 0.63 to 1.13; participants = 1591; studies = 4; low‐quality evidence) with low heterogeneity between single studies (I2 = 27%) (Analysis 1.3). Out of 1000 people, approximately 288 would be expected to die with standard cardiac care with dobutamine within a long‐term follow‐up period compared to 242 (95% CI 181 to 325) with levosimendan.
Subgroup analyses
No subgroup analysis was performed due to the small number of studies.
In one study (Mebazaa (SURVIVE) 2007), the effect was compared according to sex and age. In this study, no interaction was observed.
Sensitivity analyses
There were differences when fixed effects were used for short‐term mortality (smaller confidence interval) in favour of levosimendan (Analysis 1.2), however, due to moderate heterogeneity (I2 = 46%) this has to be interpreted with caution. Regarding short‐term mortality, sensitivity analysis showed no differences according to which statistical model was used (Analysis 1.4).
Major adverse cardiac events (MACE)
Information on MACE was restricted to Follath (LIDO) 2002; Garcίa‐González 2006; Levin 2008 and Mebazaa (SURVIVE) 2007. Both Follath (LIDO) 2002 and Mebazaa (SURVIVE) 2007 claimed that there were no MACE in either intervention arm; Garcίa‐González 2006 documented no re‐infarction or cerebrovascular accident in either group during hospitalisation. In Levin 2008, from the participants randomised to levosimendan, one out of 69 (1.4%) suffered from perioperative infarction and two out of 69 (2.9%) suffered from cerebrovascular accidents whereas, from the participants randomised to dobutamine, eight out of 68 (11.8%) and six out of 68 (8.8%) suffered from perioperative infarction and cerebrovascular accidents, respectively (Analysis 1.5; Analysis 1.6).
Length of hospital stay
Information on length of hospital stay was restricted to Levin 2008, which reported a shorter median intensive care unit (ICU) time in the levosimendan intervention arm compared to the dobutamine intervention arm, with high imprecision (66 h (IQR 58 to 74) compared to 158 h (106 to 182)).
Quality of life
No results were available from the included studies.
Haemodynamics
Information on CI was restricted to Adamopoulos 2006; Alvarez 2006 and Levin 2008; information on PCWP was restricted to Adamopoulos 2006; Follath (LIDO) 2002 and Levin 2008 and information on MAP was restricted to Alvarez 2006 and Levin 2008. In both the analysis of CI and PCWP, the I2 was considerable (94% and 76%, respectively) making it inappropriate to pool studies. The reported CI showed no differences in Adamopoulos 2006 (1.9 ± 0.47 versus 1.8 ± 0.19). However, differences were found in Alvarez 2006 and Levin 2008 (Alvarez 2006: 2.8 ± 0.3 versus 2.3 ± 0.2; Levin 2008: 3.4 ± 0.2 versus 2.7 ± 0.1) (Table 1; Analysis 1.7). The reported PCWP showed differences in all three studies (Adamopoulos 2006: 19 ± 4.79 versus 23 ± 4.79; Follath (LIDO) 2002: 18 ± 8 versus 24 ± 7; Levin 2008: 12.1 ± 1 versus 15 ± 2) (Table 1; Analysis 1.8). The reported MAP indicated no differences between groups in Levin 2008 (78.8 ± 7 versus 80.1 ± 4) but did find differences between groups in Alvarez 2006 (77 ± 5 versus 81 ± 7) (Table 1; Analysis 1.9).
| Comparison | Primary studies | Haemodynamics | Intervention | Control | MD (95% CI) | ||
|---|---|---|---|---|---|---|---|
| Intervention vs control | last measurements | mean ± SD or median (IQR) | total | mean ± SD or median (IQR) | total | ||
| Levosimendan versus dobutamine | Cardiac index (72 h after treatment initiation; L/min/m2) | 1.9 ± 0.47 | 23 | 1.8 ± 0.19 | 23 | 0.10 (‐0.11 to 0.31) | |
| Cardiac index (48 h after treatment initiation; L/min/m2) | 2.8 ± 0.3 | 21 | 2.3 ± 0.2 | 20 | 0.50 (0.34 to 0.66) | ||
| Cardiac index (48 h after treatment initiation; L/min/m2) | 3.4 ± 0.2 | 69 | 2.7 ± 0.1 | 68 | 0.70 (0.65 to 0.75) | ||
| PCWP (72 h after treatment initiation; mmHg) | 19.0 ± 4.79 | 23 | 23.0 ± 4.79 | 23 | ‐4.00 (‐6.77 to ‐1.23) | ||
| PCWP (24 h after treatment initiation; mmHg) | 18.0 ± 8.0 | 103 | 24.0 ± 7.0 | 100 | ‐6.00 (‐8.07 to ‐3.93) | ||
| PCWP (48 h after treatment initiation; mmHg) | 12.1 ± 1.0 | 69 | 15.0 ± 2.0 | 68 | ‐2.90 (‐3.43 to ‐2.37) | ||
| MAP (48 h after treatment initiation; mmHg) | 77.0 ± 5 | 21 | 81.0 ± 7.0 | 20 | ‐4.00 (‐7.74 to ‐0.26) | ||
| MAP (48 h after treatment initiation; mmHg) | 78.7 ± 7.0 | 69 | 80.1 ± 4.0 | 68 | ‐1.30 (‐3.21 to 0.61) | ||
| Levosimendan versus placebo | Cardiac index (72 h after treatment initiation; L/min/m2) | 1.9 ± 0.47 | 23 | 1.8 ± 0.47 | 23 | 0.10 (‐0.17 to 0.37) | |
| Cardiac index (6 h after treatment initiation; L/min/m2) | 2.5 ± 0.98 | 98 | 1.9 ± 0.69 | 48 | 0.60 (0.32 to 0.88) | ||
| PCWP (72 h after treatment initiation; mmHg) | 19.0 ± 4.79 | 23 | 23.0 ± 4.79 | 23 | ‐4.00 (‐6.77 to ‐1.23) | ||
| PCWP (6 h after treatment initiation; mmHg) | 21.0 ± 9.89 | 98 | 28.0 ± 6.92 | 48 | ‐7.0 (‐9.77 to ‐4.23) | ||
| MAP (6 h after treatment initiation; mmHg) | 81.0 ± 19 | 98 | 85.0 ± 13.85 | 48 | ‐4.0 (‐9.54 to 1.54) | ||
| Levosimendan versus enoximone | Cardiac index (48 h after treatment initiation; L/min/m2) | 3.1 (2.5 ‐ 3.5) | 16 | 3.1 (2.8 ‐ 3.3) | 16 | not estimable | |
| PCWP (48 h after treatment initiation; mmHg) | 17.0 (16.0 ‐ 20.0) | 16 | 21.0 (19.0 ‐ 28.0) | 16 | not estimable | ||
| MAP (48 h after treatment initiation; mmHg) | 75.0 (58.0 ‐ 79.0) | 16 | 70.0 (63.0 ‐ 83.0) | 16 | not estimable | ||
| Epinephrine versus norepinephrine‐dobutamine | Cardiac index (24 h after treatment initiation; L/min/m2) | 2.9 ± 0.5 | 15 | 2.8 ± 0.4 | 15 | 0.10 (‐0.22 to 0.42) | |
| PCWP (24 h after treatment initiation; mmHg) | 18.0 ± 7.0 | 15 | 18.0 ± 7.0 | 15 | 0.00 (‐5.01 to 5.01) | ||
| MAP (24 h after treatment initiation; mmHg) | 64.0 ± 9.0 | 15 | 65.0 ± 11.0 | 15 | ‐1.0 (‐8.19 to 6.19) | ||
| Dopexamine versus dopamine | Cardiac index (6 h after treatment initiation; L/min/m2) | 3.1 ± 0.7 | 35 | 2.8 ± 0.5 | 35 | 0.30 (0.02 to 0.58) | |
| PCWP (6 h after treatment initiation; mmHg) | 9.3 ± 3.2 | 35 | 10.8 ± 2.9 | 35 | ‐1.50 (‐2.93 to ‐0.07) | ||
| MAP (6 h after treatment initiation; mmHg) | 76.3 ± 11.5 | 35 | 78.2 ± 12.8 | 35 | ‐1.90 (‐7.60 to 3.80) | ||
| Milrinone versus dobutamine | Cardiac index (4 h after treatment initiation; L/min/m2) | 2.4 ± 0.77 | 60 | 2.7 ± 2.32 | 60 | ‐0.30 (‐0.92 to 0.32) | |
| PCWP (4 h after treatment initiation; mmHg) | 11.2 ± 3.09 | 60 | 12.6 ± 5.42 | 60 | ‐1.40 (‐2.98 to 0.18) | ||
| MAP (4 h after treatment initiation; mmHg) | 68.5 ± 21.68 | 60 | 75.5 ± 32.53 | 60 | ‐7.0 (‐16.89 to 2.89) | ||
| Enoximone versus dobutamine | Cardiac index (12 h after treatment initiation; L/min/m2) | 2.56 ± 0.74 | 10 | 2.8 ± 0.35 | 10 | ‐0.74 (‐0.75 to 0.27) | |
| Cardiac index (14 h after treatment initiation; L/min/m2) | 2.8 ± 0.6 | 10 | 3.1 ± 0.9 | 10 | ‐0.30 (‐0.97 to 0.37) | ||
| PCWP (12 h after treatment initiation; mmHg) | 20.0 ± 5.7 | 10 | 23.7 ± 6.6 | 10 | ‐3.70 (‐9.11 to 1.71) | ||
| PCWP (14 h after treatment initiation; mmHg) | 13.1 ± 4.2 | 10 | 12.8 ± 4.1 | 10 | 0.30 (‐3.34 to 3.94) | ||
| MAP (12 h after treatment initiation; mmHg) | 78.0 ± 11.0 | 10 | 93.0 ± 17.0 | 10 | ‐15.0 (‐27.55 to ‐2.45) | ||
| Epinephrine versus norepinephrine | Cardiac index (72 h after treatment initiation; L/min/m2) | 2.6 (1.9 ‐ 3.3) | 27 | 2.6 (2.2 ‐ 3.2) | 30 | not estimable | |
| PCWP (72 h after treatment initiation; mmHg) | 12.5 ± 4.1 | 27 | 15.8 ± 5.7 | 30 | ‐3.30 (‐5.86 to ‐0.74) | ||
| MAP (72 h after treatment initiation; mmHg) | 83.7 ± 12.3 | 27 | 76.5 ± 8.1 | 30 | 7.20 (1.73 to 12.67) | ||
| Dopamine‐milrinone versus dopamine‐dobutamine | Cardiac index (1 h after treatment initiation; L/min/m2) | 2.6 ± 0.31 | 10 | 2.9 ± 0.63 | 10 | ‐0.30 (‐0.74 to 0.14) | |
| PCWP (1 h after treatment initiation; mmHg) | 17.0 ± 4.42 | 10 | 19.0 ± 6.32 | 10 | ‐2.0 (‐6.78 to 2.78) | ||
| MAP (1 h after treatment initiation; mmHg) | 65.0 ± 7.9 | 10 | 71.0 ± 12.01 | 10 | ‐6.0 (‐14.91 to 2.91) | ||
| Enoximone versus piroximone | Cardiac index (3 h after treatment initiation; L/min/m2) | 2.4 ± 0.5 | 10 | 2.5 ± 0.4 | 10 | ‐0.10 (‐0.50 to 0.30) | |
| PCWP (3 h after treatment initiation; mmHg) | 8.5 ± 2.0 | 10 | 9.2 ± 1.9 | 10 | ‐0.70 (‐2.41 to 1.01) | ||
| MAP (3 h after treatment initiation; mmHg) | 72.9 ± 8.7 | 10 | 69.6 ± 7.0 | 10 | 3.30 (‐3.62 to 10.22) | ||
CI: confidence interval
IQR: interquartile range
MAP: mean arterial pressure
MD: mean difference
PCWP: pulmonary capillary wedge pressure
SD: standard deviation
Costs
No results were available from the included studies.
Adverse events
Adverse events were reported by Alvarez 2006; Follath (LIDO) 2002; Garcίa‐González 2006; Levin 2008 and (very detailed) Mebazaa (SURVIVE) 2007. In Garcίa‐González 2006, no adverse events occurred (Table 2). Levin 2008 reported a better safety profile of levosimendan compared to dobutamine (Table 2). In contrast, Alvarez 2006; Follath (LIDO) 2002 and Mebazaa (SURVIVE) 2007 did not observe marked differences in the safety profile of the drugs compared (Table 2).
| Comparison | Primary studies | Adverse events (no MACE) | Intervention | Control | ||
|---|---|---|---|---|---|---|
| events | total | events | total | |||
| Levosimendan versus dobutamine | Acute kidney failure | 5 (7.2%) | 69 | 21 (30.9%) | 68 | |
| Agitation | 7 (1.1%) | 660 | 0 (0%) | 660 | ||
| Anaemia | 15 (2.3%) | 660 | 17 (2.6%) | 660 | ||
| Angina pectoris | 12 (1.8%) | 681 | 25 (3.7%) | 680 | ||
| Anxiety | 20 (3.0%) | 660 | 19 (2.9%) | 660 | ||
| Alvarez 2006, Follath (LIDO) 2002, Levin 2008, Mebazaa (SURVIVE) 2007 | Atrial fibrillation | 80 (9.4%) | 853 | 72 (8.5%) | 848 | |
| Back pain | 13 (2.0%) | 660 | 18 (2.7%) | 660 | ||
| Bradycardia | 9 (1.2%) | 763 | 18 (2.4%) | 760 | ||
| Cardiac arrest | 20 (3.0%) | 660 | 26 (3.9%) | 660 | ||
| Cataract | 7 (1.1%) | 660 | 14 (2.1%) | 660 | ||
| Chest pain | 32 (4.8%) | 660 | 47 (7.1%) | 660 | ||
| (Congestive) cardiac failure | 107 (16.2%) | 660 | 134 (20.3%) | 660 | ||
| Constipation | 26 (3.9%) | 660 | 28 (4.2%) | 660 | ||
| Cough | 19 (2.9%) | 660 | 21 (3.2%) | 660 | ||
| Diarrhea | 30 (4.5%) | 660 | 21 (3.2%) | 660 | ||
| Disorder aggravated | 2 (1,9%) | 103 | 4 (4.0%) | 100 | ||
| Dizziness | 19 (2.5%) | 763 | 17 (2.2%) | 760 | ||
| Dyspnoea | 10 (1.4%) | 729 | 21 (2.9%) | 728 | ||
| Epistaxis | 14 (2.1%) | 660 | 7 (1.1%) | 660 | ||
| Extrasystoles | 1 (1.0%) | 103 | 3 (3.0%) | 100 | ||
| Flushing | 1 (1.0%) | 103 | 3 (3.0%) | 100 | ||
| Gastrointestinal disorders | 2 (1.9%) | 103 | 7 (7.0%) | 100 | ||
| Headache | 69 (9.0%) | 763 | 36 (4.7%) | 760 | ||
| Hyperkalaemia | 15 (2.3%) | 660 | 16 (2.4%) | 660 | ||
| Hypertension | 9 (1.4%) | 660 | 15 (2.3%) | 660 | ||
| Hypokalaemia | 62 (9.4%) | 660 | 39 (5.9%) | 660 | ||
| Hypotension | 111 (14.5%) | 763 | 96 (12.6%) | 760 | ||
| Insomnia | 37 (5.6%) | 660 | 29 (4.4%) | 660 | ||
| Multiple organ failure | 0 (0%) | 11 | 0 (0%) | 11 | ||
| Muscle spasms | 12 (1.8%) | 660 | 13 (2.0%) | 660 | ||
| Nausea | 45 (6.8%) | 660 | 49 (7.4%) | 660 | ||
| Need for dialysis | 2 (2.9%) | 69 | 8 (11.9%) | 68 | ||
| Pain in extremity | 18 (2.7%) | 660 | 10 (1.5%) | 660 | ||
| Pneumonia | 34 (4.7%) | 729 | 34 (4.7%) | 728 | ||
| Prolonged ventilatory assistance | 6 (8.7%) | 69 | 22 (32.3%) | 68 | ||
| Pruritus | 16 (2.4%) | 660 | 7 (1.1%) | 660 | ||
| Pulmonary oedema | 20 (3.0%) | 660 | 18 (2.7%) | 660 | ||
| Pyrexia | 22 (3.3%) | 660 | 19 (2.9%) | 660 | ||
| Renal failure | 24 (3.6%) | 660 | 22 (3.3%) | 660 | ||
| Sepsis | 1 (1.4%) | 69 | 9 (13.2%) | 68 | ||
| Systemic inflammatory response syndrome | 4 (5.8%) | 69 | 15 (22.1%) | 68 | ||
| Tachycardia | 86 (11.3%) | 763 | 88 (11.6%) | 760 | ||
| Urinary infections | 21 (3.2%) | 660 | 30 (4.5%) | 660 | ||
| Vasoplegia | 1 (1.4%) | 69 | 9 (13.2%) | 68 | ||
| Ventricular arrhythmia | 3 (3.3%) | 90 | 12 (13.6%) | 88 | ||
| Ventricular extrasystoles | 40 (6.1%) | 660 | 24 (3.6%) | 660 | ||
| Ventricular fibrillation | 16 (2.1%) | 763 | 20 (2.6%) | 760 | ||
| Vomiting | 22 (3.3%) | 660 | 24 (3.6%) | 660 | ||
| Levosimendan versus placebo | Atrial fibrillation | 1 (25.0%) | 4 | 0 (0%) | 5 | |
| Ventricular tachycardia | 3 (2.9%) | 102 | 3 (5.7%) | 53 | ||
| Levosimendan versus enoximone | Acute renal failure | 5 (31.3%) | 16 | 8 (50.0%) | 16 | |
| Atrial fibrillation | 7 (43.8%) | 16 | 9 (56.3%) | 16 | ||
| Need of mechanical ventilation | 13 (81.3%) | 16 | 15 (93.8%) | 16 | ||
| Pneumonia | 7 (43.8%) | 16 | 7 (43.8%) | 16 | ||
| Sepsis | 3 (18.8%) | 16 | 2 (12.5%) | 16 | ||
| Systemic inflammatory response | 8 (50.0%) | 16 | 13 (81.3%) | 16 | ||
| Urinary infections | 0 (0%) | 16 | 2 (12.5%) | 16 | ||
| Ventricular tachycardia or fibrillation | 8 (50.0%) | 16 | 11 (68.8%) | 16 | ||
| Epinephrine versus norepinephrine‐dobutamine | Supraventricular arrhythmia | 2 (13.3%) | 15 | 0 (0%) | 15 | |
| Sustained ventricular tachycardia | 1 (6.7%) | 15 | 0 (0%) | 15 | ||
| Dopexamine versus dopamine | Abnormal blood loss | 2 (5.7%) | 35 | 1 (2.9%) | 35 | |
| Bradycardia | 2 (5.7%) | 35 | 4 (11.4%) | 35 | ||
| Hypertension | 3 (8.6%) | 35 | 7 (20.0%) | 35 | ||
| Junctional rhythm | 0 (0%) | 35 | 2 (5.7%) | 35 | ||
| Kidney failure | 1 (2.9%) | 35 | 1 (2.9%) | 35 | ||
| Premature atrial contractions | 2 (5.7%) | 35 | 6 (17.1%) | 35 | ||
| Premature ventricular contractions | 9 (25.7%) | 35 | 11 (31.4%) | 35 | ||
| ST elevation | 2 (5.7%) | 35 | 0 (0%) | 35 | ||
| Milrinone versus dobutamine | Atrial fibrillation | 3 (5.0%) | 60 | 11 (18.3%) | 60 | |
| Bradycardia | 8 (13.3%) | 60 | 1 (1.7%) | 60 | ||
| Haemorrhage | 9 (15.0%) | 60 | 3 (5.0%) | 60 | ||
| Hypertension | 8 (13.3%) | 60 | 24 (40.0%) | 60 | ||
| Hypotension | 12 (20.0%) | 60 | 6 (10.0%) | 60 | ||
| Oligouria | 6 (10.0%) | 60 | 2 (3.3%) | 60 | ||
| Tachycardia | 5 (8.3%) | 60 | 11 (18.3%) | 60 | ||
| Enoximone versus dobutamine | Haemorrhage | 0 (0%) | 18 | 1 (5.3%) | 19 | |
| Hepatic cytolysis | 0 (0%) | 10 | 0 (0%) | 10 | ||
| Tachycardia and/or hypertension | 0 (0%) | 18 | 4 (21.1%) | 19 | ||
| Thrombocytopenia | 0 (0%) | 10 | 0 (0%) | 10 | ||
| Ventricular hyperexcitability | 0 (0%) | 10 | 0 (0%) | 10 | ||
| Epinephrine versus norepinephrine | Arrhythmia | 11 (40.7%) | 27 | 10 (33.3%) | 30 | |
| Need for extracorporeal life support | 3 (11.1%) | 27 | 1 (3.3%) | 30 | ||
| Refactory shock | 10 (37.0%) | 27 | 2 (6.7%) | 30 | ||
| Enoximone versus piroximone | Arrhythmia | 1 (10.0%) | 10 | 0 (0%) | 10 | |
| Hypotension | 2 (20.0%) | 10 | 2 (20.0%) | 10 | ||
| Enoximone versus epinephrine/nitroglycerine | Arrhytmia | 0 (0%) | 6 | 0 (0%) | 6 | |
| Tachycardia | 0 (0%) | 6 | 0 (0%) | 6 | ||
LIDO: study title ("levosimendan infusion versus dobutamine")
MACE: major adverse cardiac events
MAP: mean arterial pressure
ST: segment of the electrocardiogram
SURVIVE: study title ("survival of patients with acute heart failure in need of intravenous inotropic support")
2. Levosimendan versus placebo
Two small, single‐centre trials with 55 participants (Adamopoulos 2006; Husebye 2013) as well as one multicentre trial with 146 participants (Slawsky 2000) investigated levosimendan compared with placebo in the context of people suffering from AMI (Husebye 2013) or acute HF (Adamopoulos 2006; Slawsky 2000) complicated by LCOS/CS (summary of findings Table 2).
All‐cause mortality
Information on mortality was restricted to two studies (Adamopoulos 2006; Husebye 2013).
Short‐term
No results were available from the included studies.
Long‐term
We are uncertain about the effects on long‐term mortality with three deaths out of 27 participants (11.1%) in the intervention arm with levosimendan compared with six deaths out of 28 participants (21.4%) in the control group treated with placebo (RR 0.55, 95% CI 0.16 to 1.90; participants = 55; studies = 2; very low‐quality evidence) with low heterogeneity between single studies (I2 = 0%) (Analysis 2.1). Out of 1000 people, approximately 218 would be expected to die with standard cardiac care with placebo within a long‐term follow‐up period compared to 118 (95% CI 35 to 407) with levosimendan.
Subgroup analyses
No subgroup analysis was performed due to the small number of studies.
Sensitivity analyses
Sensitivity analysis showed no differences according to which statistical model was used (Analysis 2.2).
MACE
Information on MACE was restricted to Husebye 2013. The authors claimed that there were no MACE in either intervention arm.
Length of hospital stay
No results were available from the included studies.
Quality of life
No results were available from the included studies.
Haemodynamics
Information on CI and PCWP was restricted to Adamopoulos 2006 and Slawsky 2000; information on MAP was restricted to Slawsky 2000. In the analysis of CI, the I2 was considerable (83%) between single studies. The reported CI showed no differences in Adamopoulos 2006 (1.9 ± 0.47 versus 1.8 ± 0.19). However, differences were found in Slawsky 2000 (2.5 ± 0.98 versus 1.9 ± 0.69) (Table 1; Analysis 2.3). The reported PCWP and MAP showed differences between participants randomised to levosimendan and placebo (Adamopoulos 2006: 19 ± 4.79 versus 23 ± 4.79; Slawsky 2000: PCWP: 21 ± 9.89 versus 28 ± 6.92; MAP: 81 ± 19.79 versus 85 ± 13.85) (Table 1; Analysis 2.4; Analysis 2.5).
Costs
No results were available from the included studies.
Adverse events
Information on adverse events was restricted to two studies (Husebye 2013; Slawsky 2000). Reported adverse events included atrial fibrillation and ventricular tachycardia (Table 2). No intervention group was superior with regard to the safety profile.
3. Levosimendan versus enoximone
There was only one small, single‐centre study with 32 participants investigating levosimendan compared with enoximone in people with AMI complicated by CS (Fuhrmann 2008) (summary of findings Table 3).
All‐cause mortality
Short‐term
We are uncertain about the effects on short‐term mortality with five deaths out of 16 participants (31.3%) in the intervention arm with levosimendan compared with 10 deaths out of 16 participants (62.5%) in the control group treated with enoximone (RR 0.50, 0.22 to 1.14; participants = 32; studies = 1; very low‐quality evidence). Out of 1000 people, approximately 625 would be expected to die with standard cardiac care with enoximone within a short‐term follow‐up period compared to 313 (95% CI 138 to 712) with levosimendan (Analysis 3.1; Analysis 3.2).
Long‐term
No results were available from the included studies.
Subgroup and sensitivity analyses
Subgroup and sensitivity analyses were not applicable on the basis of this one trial without internally reported subgroup analyses.
MACE
From the participants randomised to enoximone one out of 16 (6.3%) suffered from MACE (cerebrovascular accidents) whereas no MACE were reported for participants randomised to levosimendan (Analysis 3.3).
Length of hospital stay
A shorter median ICU time was reported in the levosimendan group compared to the enoximone group with high imprecision (10 days (IQR 5 to 23) compared to 13 days (IQR 7 to 19)).
Quality of life
No results were available from the included study.
Haemodynamics
The reported CI showed no differences between participants randomised to levosimendan or enoximone (median CI 3.1 L/min/m2 in both groups; IQR 2.5 to 3.5 on levosimendan versus 2.8 to 3.3 on enoximone) (Table 1). Small differences were found in PCWP and MAP (median PCWP 17 mmHg (IQR 16 to 20) on levosimendan versus 21 mmHg (IQR 19 to 28) on enoximone; median MAP 75 mmHg (IQR 58 to 79) on levosimendan versus 70 mmHg (IQR 63 to 83) on enoximone) (Table 1).
Costs
No results were available from the included study.
Adverse events
Reported adverse events included acute renal failure, atrial fibrillation, need of mechanical ventilation, pneumonia, sepsis, systemic inflammatory response, urinary infections and ventricular tachycardia or fibrillation (Table 2). Levosimendan showed a slightly better safety profile compared to enoximone.
4. Epinephrine versus norepinephrine‐dobutamine
There was only one small, single‐centre study with 30 participants investigating epinephrine compared with norepinephine‐dobutamine in the context of acute HF complicated by CS (Levy 2011) (summary of findings Table 4).
All‐cause mortality
Short‐term
We found no clear reported difference in short‐term mortality with five deaths out of 15 participants (33.3%) in the intervention arm with epinephrine compared with four deaths out of 15 participants (26.7%) in the control group treated with norepinephrine‐dobutamine (RR 1.25; 95% CI 0.41 to 3.77; participants = 30; studies = 1; very low‐quality evidence). Out of 1000 people, approximately 267 per 1000 would be expected to die with standard cardiac care with norepinephrine‐dobutamine within a short‐term follow‐up period compared to 333 (95% CI 109 to 1003) with epinephrine (Analysis 4.1; Analysis 4.2).
Long‐term
No results were available from the included study.
Subgroup and sensitivity analyses
Subgroup and sensitivity analyses were not applicable on the basis of this one trial without internally reported subgroup analyses.
MACE
No results were available from the included study.
Length of hospital stay
No results were available from the included study.
Quality of life
No results were available from the included study.
Haemodynamics
The reported CI, PCWP and MAP showed no differences between participants randomised to either epinephrine or norepinephrine‐dobutamine (CI: 2.9 ± 0.5 versus 2.8 ± 0.4; PCWP: 18 ± 7 versus 18 ± 7; MAP: 64 ± 9 versus 65 ± 11) (Table 1; Analysis 4.3; Analysis 4.4; Analysis 4.5).
Costs
No results were available from the included study.
Adverse events
In the epinephrine group, two out of 15 (13.3%) participants suffered from supraventricular arrhythmia, and one out of 15 (6.7%) participants suffered from sustained ventricular tachycardia. No such adverse events were reported for the participants treated with norepinephrine‐dobutamine (Table 2).
5. Dopexamine versus dopamine
There was only one small, multicentre study with 70 participants investigating dopexamine compared with dopamine in the context of cardiac surgery complicated by LCOS (Rosseel 1997). No RR and resulting estimations on absolute risk reduction were possible (summary of findings Table 5).
All‐cause mortality
Short‐term
The study reported that no deaths in hospital occurred in either intervention arm. We are uncertain about the effects due to very low quality of evidence.
Long‐term
No results were available from the included study.
Subgroup and sensitivity analyses
Subgroup and sensitivity analyses were not applicable on the basis of this one trial without internally reported subgroup analyses.
MACE
Perioperative infarctions were reported for three out of 35 participants (8.6%) in the dopexamine intervention arm and two out of 35 (5.7%) participants in the dopamine intervention arm (Analysis 5.1).
Length of hospital stay
No results were available from the included study.
Quality of life
No results were available from the included study.
Haemodynamics
Small differences were found in CI and PCWP (CI: 3.1 ± 0.7 versus 2.8 ± 0.5; PCWP: 9.3 ± 3.2 versus 10.8 ± 2.9) (Table 1; Analysis 5.2; Analysis 5.3). The reported MAP showed no differences between participants randomised to dopexamine or dopamine (76.3 ± 11.5 versus 78.2 ± 12.8) (Table 1; Analysis 5.4).
Costs
No results were available from the included study.
Adverse events
Reported adverse events included abnormal blood loss, bradycardia, hypertension, junctional rhythm, kidney failure, premature atrial and ventricular contractions and ST elevation (Table 2). Dopexamine showed a slightly better safety profile compared to dopamine.
6. Milrinone versus dobutamine
There was only one small, multicentre study with 120 participants investigating milrinone compared with dobutamine in the context of cardiac surgery complicated by LCOS (Feneck 2001) (summary of findings Table 6).
All‐cause mortality
No results were available from the included study.
MACE
The study authors claimed that there were no MACE in either intervention arm.
Length of hospital stay
No results were available from the included study.
Quality of life
No results were available from the included study.
Haemodynamics
The reported CI, PCWP and MAP showed no differences between participants randomised to milrinone and dobutamine (CI: 2.4 ± 0.77 versus 2.7 ± 2.32; PCWP: 11.2 ± 3.09 versus 12.6 ± 5.42; MAP: 68.5 ± 21.68 versus 75.5 ± 32.53) (Table 1; Analysis 6.1; Analysis 6.2; Analysis 6.3).
Costs
No results were available from the included study.
Adverse events
Reported adverse events included atrial fibrillation, bradycardia, haemorrhage, hypertension, hypotension, oligouria and tachycardia (Table 2). No intervention group was superior with regard to the safety profile.
7. Enoximone versus dobutamine
There were three small, single‐centre trials with 77 participants investigating enoximone compared with dobutamine in the context of acute HF (Galinier 1990) or cardiac surgery (Atallah 1990; Lancon 1990) complicated by LCOS/CS (summary of findings Table 7).
All‐cause mortality
Information on mortality was restricted to one study (Atallah 1990).
Short‐term
We are uncertain about the effects on short‐term mortality with no deaths out of 18 participants in the intervention arm with enoximone compared with two deaths out of 19 participants (10.5%) in the control group treated with dobutamine (RR 0.21; 95% CI 0.01 to 4.11; participants = 37; studies = 1; very low‐quality evidence). Since there were no events in the intervention group, the anticipated absolute effects were not reliably estimable (Analysis 7.1; Analysis 7.2).
Long‐term
No results were available from the included study.
Subgroup and sensitivity analyses
Subgroup and sensitivity analyses were not applicable on the basis of this one trial without internally reported subgroup analyses.
MACE
In Atallah 1990, the study authors claimed that there were no MACE in either intervention arm. No results were available from Galinier 1990 and Lancon 1990.
Length of hospital stay
Information on length of hospital stay was restricted to one study (Atallah 1990). A shorter stay in the ICU was reported in the enoximone group compared to the dobutamine group, with high imprecision in particular in the dobutamine intervention arm (92 ± 37 h compared to 155 ± 129 h).
Quality of life
No results were available from the included study.
Haemodynamics
Information on haemodynamics was restricted to two studies (Galinier 1990; Lancon 1990) with missing information on MAP in Lancon 1990. The reported CI and PCWP showed no differences between participants randomised to enoximone and dobutamine (Galinier 1990: CI: 2.56 ± 0.74 versus 2.80 ± 0.35; PCWP: 20.0 ± 5.7 versus 23.7 ± 6.6; Lancon 1990: CI: 2.8 ± 0.6 versus 3.1 ± 0.9; PCWP: 13.1 ± 4.2 versus 12.8 ± 4.1) (Table 1; Analysis 7.3; Analysis 7.4). Small differences were found by Galinier 1990 in MAP (78 ± 11 versus 93 ± 17) (Table 1; Analysis 7.5).
Costs
No results were available from the included study.
Adverse events
Information on adverse events was restricted to two studies (Atallah 1990; Galinier 1990). Reported adverse events included haemorrhage, hepatic cytolysis, thrombocytopenia, tachycardia and/or hypertension and ventricular hyperexcitability (Table 2). No intervention group was superior with regard to the safety profile.
8. Epinephrine versus norepinephrine
There was only one small, multicentre study with 57 participants investigating epinephrine compared with norepinephrine in the context of CS complicating AMI (Levy 2018) (summary of findings Table 8).
All‐cause mortality
Short‐term
We are uncertain about the effects on short‐term mortality with 13 deaths out of 27 participants (48.1%) in the intervention arm with epinephrine compared with eight deaths out of 30 participants (26.7%) in the control group treated with norepinephrine (RR 1.81, 0.89 to 3.68; participants = 57; studies = 1; very low‐quality evidence). Out of 1000 people, approximately 266 would be expected to die with standard cardiac care with norepinephrine within a short‐term follow‐up period compared to 482 (95% CI 237 to 979) with epinephrine (Analysis 8.1; Analysis 8.2).
Long‐term
We are uncertain about the effects on long‐term mortality with 14 deaths out of 27 participants (51.9%) in the intervention arm with epinephrine compared with 11 deaths out of 30 participants (36.7%) in the control group treated with norepinephrine (RR 1.41, 0.78 to 2.56; participants = 57; studies = 1; very low‐quality evidence). Out of 1000 people, approximately 366 would be expected to die with standard cardiac care with norepinephrine within a long‐term follow‐up period compared to 516 (95% CI 285 to 937) with epinephrine (Analysis 8.3; Analysis 8.4)
Subgroup and sensitivity analyses
Subgroup and sensitivity analyses were not applicable on the basis of this one trial without internally reported subgroup analyses..
MACE
The study authors claimed that there were no MACE in either intervention arm.
Length of hospital stay
No results were available from the included study.
Quality of life
No results were available from the included study.
Haemodynamics
The reported CI showed no differences between participants randomised to epinephrine or norepinephrine (median CI 2.6 L/min/m2 in both groups; IQR 1.9 to 3.3 on epinephrine versus 2.2 to 3.2 on norepinephrine) (Table 1). Small differences were found in PCWP and MAP (PCWP: 12.5 ± 4.1 versus 15.8 ± 5.7; MAP: 83.7 ± 12.3 versus 76.5 ± 8.1) (Table 1; Analysis 8.5; Analysis 8.6).
Costs
No results were available from the included study.
Adverse events
Reported adverse events included arrhythmia, need for extracorporeal life support and refractory shock (Table 2). Norepinephrine showed a slightly better safety profile compared to epinephrine.
9. Dopamine‐milrinone versus dopamine‐dobutamine
There was only one small, single‐centre study with 20 participants investigating dopamine‐milrinone compared with dopamine‐dobutamine in the context of CS complicating acute HF (Meissner 1996) (summary of findings Table 9).
All‐cause mortality
Short‐term
We are uncertain about the effects on ICU mortality with four deaths out of 10 participants in either intervention arm (40%) (RR 1.0; 95% CI 0.34 to 2.93; participants = 20; studies = 1; very low‐quality evidence). Out of 1000 people, approximately 400 per 1000 would be expected to die with standard cardiac care with dopamine‐dobutamine within ICU compared to 400 (95% CI 136 to 1172) with dopamine‐milrinone (Analysis 9.1; Analysis 9.2).
Long‐term
No results were available from the included study.
Subgroup and sensitivity analyses
Subgroup and sensitivity analyses were not applicable on the basis of this one trial without internally reported subgroup analyses.
MACE
No results were available from the included study.
Length of hospital stay
No results were available from the included study.
Quality of life
No results were available from the included study.
Haemodynamics
The reported CI, PCWP and MAP showed no differences between participants randomised to dopamine‐milrinone and dopamine‐dobutamine (CI: 2.6 ± 0.31 versus 2.9 ± 0.63; PCWP: 17 ± 4.42 versus 19 ± 6.32; MAP: 65 ± 7.9 versus 71 ± 12.01) (Table 1; Analysis 9.3; Analysis 9.4; Analysis 9.5).
Costs
No results were available from the included study.
Adverse events
No results were available from the included study.
10. Enoximone versus piroximone
There was only one small, single‐centre study with 20 participants investigating enoximone compared with piroximone in the context of cardiac surgery complicated by LCOS (Patel 1993) (summary of findings Table 10).
All‐cause mortality
No results were available from the included study.
MACE
No results were available from the included study.
Length of hospital stay
No results were available from the included study.
Quality of life
No results were available from the included study.
Haemodynamics
The reported CI, PCWP and MAP showed no differences between participants randomised to enoximone and piroximone (CI: 2.4 ± 0.5 versus 2.5 ± 0.4; PCWP: 8.5 ± 2.0 versus 9.2 ± 1.9; MAP: 72.9 ± 8.7 versus 69.6 ± 7.0) (Table 1; Analysis 10.1; Analysis 10.2; Analysis 10.3).
Costs
No results were available from the included study.
Adverse events
Reported adverse events included arrhythmia and hypotension (Table 2). No intervention group was superior with regard to the safety profile.
11. Enoximone versus epinephrine‐nitroglycerine
There was only one small, single‐centre study with 12 participants investigating enoximone compared with epinephrine‐nitroglycerine in the context of cardiac surgery complicated by LCOS (Zwölfer 1995) (summary of findings Table 11).
All‐cause mortality
No results were available from the included study.
MACE
No results were available from the included study.
Length of hospital stay
No results were available from the included study.
Quality of life
No results were available from the included study.
Haemodynamics
The study authors claimed that there were no treatment‐related differences.
Costs
No results were available from the included study.
Adverse events
Reported adverse events included arrhythmia and tachycardia (Table 2). No events were reported in either intervention group.
Discussion
This systematic review included 19 RCTs that analysed 2385 participants in trials with greatly differing mortality rates of between 0% and 47%.
Summary of main results
Drugs examined
Nine studies investigated levosimendan and compared its efficacy and safety with standard cardiac care plus dobutamine, enoximone or placebo. Five trials investigated enoximone and compared its efficacy and safety with standard cardiac care plus dobutamine, piroximone or epinephrine‐nitroglycerine. Two trials investigated epinephrine in comparison to either norepinephrine or the combination of norepinephrine and dobutamine. Single trials compared dopexamine to dopamine, milrinone to dobutamine or the combination of dopamine and milrinone to the combined use of dopamine and dobutamine.
Endpoints
Thirteen studies reported mortality outcomes, while length of ICU and intra‐hospital stay were reported in three trials only. Haemodynamic parameters (surrogate markers for morbidity) were available in 15 trials and MACE/adverse events were reported in 16 studies. No data were available for quality of life or medical costs in any trial.
Mortality
Levosimendan compared to dobutamine may reduce all‐cause mortality in the short term but may make little or no difference in the long term (low‐quality evidence) (Adamopoulos 2006; Alvarez 2006; Follath (LIDO) 2002; Garcίa‐González 2006; Levin 2008; Mebazaa (SURVIVE) 2007). Very low‐quality evidence shows uncertainty around the effect of levosimendan versus placebo (long‐term data; no short‐term data available) (Adamopoulos 2006; Husebye 2013); levosimendan versus enoximone (short‐term data; no long‐term data available) (Fuhrmann 2008); epinephrine versus norepinephrine‐dobutamine (short‐term data; no long‐term data available) (Levy 2011); dopexamine versus dopamine (no deaths occurred in the short‐term; no long‐term data available) (Rosseel 1997); enoximone versus dobutamine (short‐term data; no long‐term data available) (Atallah 1990); and epinephrine versus norepinephrine (short‐term and long‐term data) (Levy 2018). The study investigating the comparison of dopamine‐milrinone with dopamine‐dobutamine (Meissner 1996) was restricted to short‐term mortality and presented no differences in the intra‐hospital period with very low‐quality evidence. No data were available to address the effect of milrinone compared to dobutamine (Feneck 2001) and of enoximone compared to either piroximone (Patel 1993) or epinephrine‐nitroglycerine (Zwölfer 1995).
Length of ICU and intra‐hospital stay
Only three of the 19 trials reported length of ICU stay (Atallah 1990; Fuhrmann 2008; Levin 2008). Levin 2008 indicated that participants had a shorter time in the ICU with levosimendan compared to dobutamine, Fuhrmann 2008 with levosimendan compared to enoximone and Atallah 1990 with enoximone compared to dobutamine. In all of these studies, the results of comparison groups indicated a high level of uncertainty. There were no data concerning intra‐hospital stay.
Haemodynamics
Some beneficial effects on certain haemodynamic variables (CI, PCWP, MAP) were reported for levosimendan in comparison to dobutamine (Adamopoulos 2006; Alvarez 2006; Follath (LIDO) 2002; Levin 2008), enoximone (Fuhrmann 2008) or placebo (Adamopoulos 2006; Slawsky 2000); for epinephrine in comparison to norepinephrine (Levy 2018); as well as for dopexamine in comparison to dopamine (Rosseel 1997). No clinically relevant differences in CI, PCWP and MAP were reported for epinephrine compared to norepinephrine‐dobutamine (Levy 2011); for milrinone compared to dobutamine (Feneck 2001); for dopamine‐milrinone compared to dopamine‐dobutamine (Meissner 1996); as well as for enoximone compared to dobutamine (Galinier 1990; Lancon 1990), piroximone (Patel 1993) or epinephrine‐nitroglycerine (Zwölfer 1995).
Adverse events
Levin 2008 reported a better safety profile of levosimendan compared to dobutamine, but this observation was not found in the studies of Alvarez 2006; Follath (LIDO) 2002; Garcίa‐González 2006 and Mebazaa 2007. A slightly better safety profile was reported by Fuhrmann 2008 for levosimendan compared to enoximone; by Rosseel 1997 for dopexamine compared to dopamine; by Levy 2011 for norepinephrine‐dobutamine compared to epinephrine; and by Levy 2018 for norepinephrine compared to epinephrine. No intervention group was superior with regard to the safety profile for the comparisons levosimendan versus placebo (Husebye 2013; Slawsky 2000), milrinone versus dobutamine (Feneck 2001), enoximone versus epinephrine‐nitroglycerine (Zwölfer 1995), as well as enoximone versus dobutamine (Atallah 1990; Galinier 1990) or piroximone (Patel 1993). No data were available to address the comparison dopamine‐milrinone versus dopamine‐dobutamine (Meissner 1996).
Quality of life and costs
No data addressing quality of life and health care costs were available in any of these trials.
Overall completeness and applicability of evidence
Data from the included studies were too limited to support therapeutic strategies on the basis of the derived evidence on the efficacy and safety of the investigated drugs. Furthermore, it must be noted that some of the included studies dated back many years. The resulting differences in the guidelines and clinical standards applicable at earlier times when studies were conducted (for example, with regard to myocardial revascularisation) may have had an influence on effects observed. This is not a judgement concerning the potential benefits of the investigated therapeutic strategies and does not rule out the possibility that larger RCTs might verify potential beneficial effects in the future.
Quality of the evidence
We identified a total of 19 eligible studies with 2385 participants and included these studies in 11 comparisons to current standard therapies. All these studies were published as full texts; eight of them were sponsored by manufacturers of the drugs (Feneck 2001; Follath (LIDO) 2002; Husebye 2013; Lancon 1990; Levy 2018; Mebazaa (SURVIVE) 2007; Patel 1993; Zwölfer 1995). In Levy 2011, a conflict of interest statement was lacking.
Effect estimates for our primary outcome, all‐cause mortality, are based on the results from one to six RCTs of small to moderate size. Due to the small number of eligible trials, the use of funnel plots for the graphical detection of publication bias was not possible since the power of the tests was too low to distinguish chance from real asymmetry. The mortality rates reported by Alvarez 2006; Atallah 1990; Garcίa-González 2006 and Rosseel 1997 were surprisingly low and in marked contrast to the expected mortality rates of between 40% and 80%. The limited data available on haemodynamic parameters showed clinically relevant differences in CI at baseline in different studies. The heterogeneity in the baseline haemodynamic characteristics, however, raises concerns over the definitions of CS and LCOS used in these trials. This could also be an explanation for the differences in mortality rates.
We downgraded the high‐quality evidence of eligible RCTs due to relevant imprecision, publication bias and study limitations (risk of bias). Quality of the evidence was downgraded for imprecision if the optimal information size criterion was not met and if clinical action would differ if the lower or the upper boundary of the CI represented the truth (Guyatt 2011b). We downgraded the quality of the evidence for high probability of publication bias due to incomplete outcome data with exclusion of particular participants (Guyatt 2011f). Downgrading took place with respect to high risk of performance and detection bias due to lack of blinding of participants, personnel and outcome assessment, methodological limitations from inappropriate random sequence generation or inappropriate administration of an intervention or stopping trial early for benefit (Guyatt 2011c).
Potential biases in the review process
We contacted all authors of eligible trials requesting individual patient data. Considering that the total number of eligible studies and included participants was relatively small, bias could have been introduced merely by the fact that individual patient data were not provided.
As CS is a haemodynamically defined state, it is of major concern if haemodynamic parameters were not available for all participants. As a result, inclusion criteria and definition of CS fully relied on the definition of CS originally required for study inclusion. For this reason, we cannot verify that all reported data were related to patients appropriately diagnosed with CS as it was defined in the SHOCK trial (Hochman 1999).
In all except one trial investigating levosimendan, the drug was started by an initial bolus. As the bolus of levosimendan might be associated with hypotensive side effects, we cannot rule out the possibility that the potentially beneficial effects of the drug might have been masked by the adverse effect of bolus application.
Agreements and disagreements with other studies or reviews
During recent decades, several randomised trials, cohort studies and systematic reviews have investigated inotropic drugs (in particular, levosimendan) studying patients with CS or LCOS. These original trials have been summarised in 14 systematic reviews and meta‐analyses (Belletti 2015; Delaney 2010; Fang 2018;Harrison 2013; Huang 2013; Karami 2020; Koster 2015; Landoni 2010a; Landoni 2010b; Landoni 2012; Leopold 2018;Maharaj 2011; Ribeiro 2010; Thackray 2002).
Regarding levosimendan, no significant effects on mortality compared to control were described by Belletti 2015; Fang 2018 and Ribeiro 2010. Belletti 2015 performed a meta‐analysis of randomised trials to investigate the effect of inotrope/vasopressor treatment on mortality of critically ill patients. The search was updated in April 2015. A total of 28,280 participants from 177 trials were summarised; three of those studies were also included in this review (Adamopoulos 2006; Husebye 2013; Slawsky 2000). Pooled estimates showed no difference in mortality between the group receiving inotropes/vasopressors and the control group (RR 0.98, 95% CI 0.96 to 1.01) with low heterogeneity (I2 = 6%). Fang 2018 evaluated whether levosimendan improved clinical outcome in patients with CS complicating AMI. That search, which was finalised in May 2016, combined 13 studies (both randomised and non‐randomised trials) comprising a total of 648 participants, which included three studies from this review (Fuhrmann 2008; Husebye 2013; Samimi‐Fard 2008 (secondary publication of Garcίa‐González 2006)). There was a non‐significant reduction in mortality with the use of levosimendan compared to the controls (RR 0.82, 95% CI 0.65 to 1.01) with no heterogeneity between the results of individual studies (I2 = 0%). Ribeiro 2010 analysed morbidity and mortality associated with levosimendan in the treatment of acutely decompensated HF. The search was set to an end date of July 2009 and included 19 randomised trials with 3719 participants. No significant reduction in relative risk for overall death was found for the comparison of levosimendan with placebo (seven trials enrolling 1652 participants, including one trial also being part of the present review (Adamopoulos 2006); RR 0.87, 95% CI 0.65 to 1.18) with low heterogeneity between the results of individual studies (I2 = 12%). Likewise, the comparison of levosimendan with dobutamine supported no treatment option (10 trials enrolling 2067 participants, including five trials also being part of the present review (Adamopoulos 2006; Alvarez 2006; Follath (LIDO) 2002; Mebazaa (SURVIVE) 2007;Samimi‐Fard 2008 (secondary publication of Garcίa‐González 2006)); RR 0.87, 95% CI 0.75 to 1.02) with no heterogeneity between the results of individual studies (I2 = 0%).
Differential results regarding the levosimendan effect, according to control group and subgroup analyses, were gained by Delaney 2010 and Koster 2015. Delaney 2010 described the efficacy and safety of levosimendan for the treatment of acute severe HF. The systematic search was finalised in June 2007. The meta‐analysis included 19 randomised trials with 3650 participants. Six studies with a total of 1578 participants, including one trial we also analysed in this review (Adamopoulos 2006), compared levosimendan with placebo. There was no significant reduction in mortality with levosimendan (OR 0.83, 95% CI 0.62 to 1.10) with low heterogeneity between the results of the individual trials (I2 = 25.7%). Eight studies with a total of 1979 participants enrolled, including four trials also analysed in this review (Adamopoulos 2006; Alvarez 2006; Follath (LIDO) 2002; Mebazaa (SURVIVE) 2007), compared levosimendan to dobutamine and reported a significant reduction in mortality after levosimendan therapy (OR 0.75, 95% CI 0.61 to 0.92) with moderate heterogeneity (I2 = 44.6%). Koster 2015 assessed the benefit and harm of levosimendan in critically ill patients suffering from LCOS. The electronic literature search strategy was last updated in February 2014 and included 49 randomised trials overseeing a total of 6688 participants. Nine of these studies are also part of the present review (Adamopoulos 2006; Alvarez 2006; Follath (LIDO) 2002; Fuhrmann 2008; Garcίa‐González 2006; Husebye 2013; Levin 2008; Mebazaa (SURVIVE) 2007;Slawsky 2000). Pooled analysis of the studies on critically ill participants without cardiac surgery compared to varying controls showed an association between levosimendan and mortality (RR 0.83, 95% CI 0.59 to 0.97). Likewise, pooled analysis of all trials, including cardiac surgery participants, showed an association between levosimendan and mortality (RR 0.52, 95% CI 0.37 to 0.73). However, subgroup analyses showed that the association between levosimendan therapy and mortality could not be confirmed if only studies with a low risk of bias were considered (participants without cardiac surgery: RR 0.83, 95% CI 0.48 to 1.55; cardiac surgery participants RR 1.02, 95% CI 0.48 to 2.16).
Significant effects of levosimendan compared to control were reported by Harrison 2013; Huang 2013; Landoni 2010a; Landoni 2010b; Landoni 2012 and Maharaj 2011. Harrison 2013 performed a meta‐analysis investigating the effects of levosimendan in cardiac surgery with and without preexisting systolic dysfunction prior to the procedure in 14 randomised trials enrolling a total of 1155 participants. The timing of levosimendan treatment varied between preoperative to intraoperative and postoperative phases. The search was finalised in May 2012 with one study of this review being incorporated (Alvarez 2006). Pooled results demonstrated a significant reduction in mortality with levosimendan (risk difference ‐4.2%, 95% CI ‐7.2% to ‐1.1%) and low heterogeneity (I2 = 28%), which was not significantly affected by the timing of levosimendan administration or the type of control (either placebo or dobutamine or milrinone or IABP). Subgroup analysis showed that the benefit associated with levosimendan was restricted to studies investigating participants with reduced ejection fraction (mean ejection fraction < 40%). This condition does not apply to participants studied in the trial performed by Alvarez 2006. Huang 2013 analysed the clinical efficacy of levosimendan versus dobutamine in any setting in critically ill participants. The search was finalised in February 2012 and included 22 randomised trials with a total of 3052 participants. Six trials of the present review were included as well (Adamopoulos 2006; Alvarez 2006; Follath (LIDO) 2002; Levin 2008; Mebazaa (SURVIVE) 2007;Samimi‐Fard 2008 (secondary publication of Garcίa‐González 2006)). Compared with dobutamine, levosimendan was found to be associated with a significant reduction in mortality (RR 0.81, 95% CI 0.70 to 0.92). The heterogeneity between the results of individual studies was small (I2 = 6%). According to the reported subgroup analyses, benefit from levosimendan was present in participants undergoing cardiac surgery, ischaemic HF and concomitant beta‐blocker therapy, but not in hypotensive participants or in the case of (supra‐)ventricular arrhythmias. The studies by Alvarez 2006 and Levin 2008 were included in the cardiac surgery setting; the studies by Adamopoulos 2006; Follath (LIDO) 2002, Mebazaa (SURVIVE) 2007 and Samimi‐Fard 2008 were included in the cardiology setting. Landoni 2010a studied whether levosimendan was associated with improved survival in people undergoing cardiac surgery. The search was updated in January 2009 and identified 10 randomised trials with 440 participants including two studies being part of this review (Alvarez 2006; Levin 2008). Levosimendan led to a significant reduction in postoperative mortality compared to control (either placebo or dobutamine or milrinone) with OR 0.35 (95% CI 0.18 to 0.71) with low heterogeneity (I2 = 27.4%). Landoni 2010b also investigated the impact of levosimendan on mortality in critically ill participants of variable origin. The systematic search was updated in November 2008 identifying 27 randomised trials comparing levosimendan versus control with a total of 3350 participants, also including seven studies included in this review (Adamopoulos 2006; Alvarez 2006; Follath (LIDO) 2002; Levin 2008; Mebazaa (SURVIVE) 2007;Samimi‐Fard 2008 (secondary publication of Garcίa‐González 2006); Slawsky 2000). Levosimendan was associated with a significant reduction in mortality (OR 0.74, 95% CI 0.62 to 0.89) with low heterogeneity between the results of individual studies (I2 = 11.3%) as well as an increase in the rate of hypotension (OR 1.38; 95% CI 1.06 to 1.80) with moderate heterogeneity (I2 = 37.7%). Landoni 2012 further updated a meta‐analysis of all RCTs on levosimendan to reach a definite conclusion of its role in participants requiring inotropic drugs. The search was updated in November 2010 and identified 45 randomised trials with 5480 participants. Levosimendan was associated with a significant reduction in mortality (RR 0.80, 95% CI 0.72 to 0.89) and low heterogeneity between study results (I2 = 15.4%). This result was confirmed in studies with different control groups and in different settings. Six studies included in this review (Adamopoulos 2006; Follath (LIDO) 2002; Fuhrmann 2008; Garcίa-González 2006; Mebazaa (SURVIVE) 2007;Slawsky 2000) were in the subgroup designated 'cardiology', where a similar reduction of mortality was confirmed (RR 0.75, 95% CI 0.63 to 0.91) with low heterogeneity (I2 = 25.5%). Two studies included in this review (Alvarez 2006; Levin 2008) were in the subgroup designated 'cardiac surgery', where the reduction in mortality was confirmed as well (RR 0.52, 95% CI 0.35 to 0.76) with no heterogeneity between the results of individual studies (I2 = 0%). Maharaj 2011 evaluated the effect of levosimendan versus control on mortality after coronary revascularisation. This systematic review was based on a search period up to August 2010 and included 17 randomised trials involving 729 participants. Levosimendan was associated with a reduced mortality after coronary revascularisation (OR 0.40, 95% CI 0.21 to 0.76) with low heterogeneity of study results (I2 = 12%). Elective revascularisation showed a significant benefit (OR 0.36, 95% CI 0.18 to 0.72) over acute revascularisation (OR 0.61, 95% CI 0.19 to 1.89). The electively revascularised group included two studies (Alvarez 2006; Levin 2008) and the acutely revascularised group included two further studies also included in this review (Fuhrmann 2008;Samimi‐Fard 2008 (secondary publication of Garcίa‐González 2006)).
Only three meta‐analyses deal with inotropics other than levosimendan. Leopold 2018 evaluated the association between epinephrine use and short‐term mortality in all‐cause CS participants. The meta‐analysis was based on a search finalised in November 2017 and included 14 published cohorts and two unpublished data sets involving 2583 participants including one study also included in this review (Levy 2018). A positive correlation was found between percentages of epinephrine use and short‐term mortality (OR 3.3, 95% CI 2.8 to 3.9). Thackray 2002 systematically reviewed the use of inotropic drugs acting through the adrenergic pathway in people with HF. In total, 21 randomised trials involving 632 participants were analysed including three studies comprising 75 participants comparing dobutamine with enoximone, of which two trials were also included in this review (Atallah 1990; Galinier 1990). No differences in mortality were identified between dobutamine and alternative inotropic agents (OR 1.37, 95 % CI 0.23 to 8.46). Karami 2020 investigated the effect of vasopressors and inotropes (i.e. adrenaline, noradrenaline, vasopressin, milrinone, levosimendan, dobutamine, dopamine) on mortality in AMI‐related CS including both randomised and observational studies. The meta‐analysis was conducted on the basis of a search finalised in February 2019 comprising 19 studies (six RCTs, 13 prospective or retrospective cohorts) and 2478 participants including four studies also included in this review (Fuhrmann 2008; Husebye 2013; Levy 2018; Samimi‐Fard 2008). No association in mortality between therapy and control group was found; however, there was a trend toward better outcome in short‐term mortality with levosimendan compared to control (RR 0.69, 95% CI 0.47 to 1.00; I2 = 39%).
In conclusion, while some of the studies included in this review have been considered in published reviews, our systematic review differs from previously published reviews for several major reasons. This review:
-
focusses on patients with AMI, HF or cardiac surgery complicated by CS or LCOS;
-
excludes studies with prophylactic use of inotropic drugs in the context of cardiac surgery;
-
is based on a previously published protocol as recommended by Shea 2009;
-
constitutes the most up‐to‐date literature review (as of October 2019);
-
is not restricted to levosimendan and more broadly investigates different inotropic drugs including enoximone, piroximone, epinephrine, norepinephrine, dopexamine, milrinone, dopamine and dobutamine.
This systematic review focusses on CS and LCOS in the acute setting. Trials on stable outpatient collectives discussed by Nieminen 2014 and Silvetti 2014 are not within the scope of this meta‐analysis.

Study flow diagram

Risk of bias summary: review authors' judgements about each risk of bias item for each included study

Risk of bias graph: review authors' judgements about each risk of bias item presented as percentages across all included studies

Comparison 1: Levosimendan versus dobutamine, Outcome 1: All‐cause short‐term mortality

Comparison 1: Levosimendan versus dobutamine, Outcome 2: All‐cause short‐term mortality: sensitivity analysis

Comparison 1: Levosimendan versus dobutamine, Outcome 3: All‐cause long‐term mortality

Comparison 1: Levosimendan versus dobutamine, Outcome 4: All‐cause long‐term mortality: sensitivity analysis

Comparison 1: Levosimendan versus dobutamine, Outcome 5: MACE (Perioperative infarction)

Comparison 1: Levosimendan versus dobutamine, Outcome 6: MACE (Cerebrovascular accidents)

Comparison 1: Levosimendan versus dobutamine, Outcome 7: Haemodynamics (Cardiac index)

Comparison 1: Levosimendan versus dobutamine, Outcome 8: Haemodynamics (Pulmonary capillary wedge pressure)

Comparison 1: Levosimendan versus dobutamine, Outcome 9: Haemodynamics (Mean arterial pressure)

Comparison 2: Levosimendan versus placebo, Outcome 1: All‐cause long‐term mortality

Comparison 2: Levosimendan versus placebo, Outcome 2: All‐cause long‐term mortality: sensitivity analysis

Comparison 2: Levosimendan versus placebo, Outcome 3: Haemodynamics (Cardiac index)

Comparison 2: Levosimendan versus placebo, Outcome 4: Haemodynamics (Pulmonary capillary wedge pressure)

Comparison 2: Levosimendan versus placebo, Outcome 5: Haemodynamics (Mean arterial pressure)

Comparison 3: Levosimendan versus enoximone, Outcome 1: All‐cause short‐term mortality

Comparison 3: Levosimendan versus enoximone, Outcome 2: All‐cause short‐term mortality: sensitivity analysis

Comparison 3: Levosimendan versus enoximone, Outcome 3: MACE (Cerebrovascular accidents)

Comparison 4: Epinephrine versus norepinephrine‐dobutamine, Outcome 1: All‐cause short‐term mortality

Comparison 4: Epinephrine versus norepinephrine‐dobutamine, Outcome 2: All‐cause short‐term mortality: sensitivity analysis

Comparison 4: Epinephrine versus norepinephrine‐dobutamine, Outcome 3: Haemodynamics (Cardiac index)

Comparison 4: Epinephrine versus norepinephrine‐dobutamine, Outcome 4: Haemodynamics (Pulmonary capillary wedge pressure)

Comparison 4: Epinephrine versus norepinephrine‐dobutamine, Outcome 5: Haemodynamics (Mean arterial pressure)

Comparison 5: Dopexamine versus dopamine, Outcome 1: MACE (Perioperative infarctions)

Comparison 5: Dopexamine versus dopamine, Outcome 2: Haemodynamics (Cardiac index)

Comparison 5: Dopexamine versus dopamine, Outcome 3: Hemodynamics (Pulmonary capillary wedge pressure)

Comparison 5: Dopexamine versus dopamine, Outcome 4: Haemodynamics (Mean arterial pressure)

Comparison 6: Milrinone versus dobutamine, Outcome 1: Haemodynamics (Cardiac index)

Comparison 6: Milrinone versus dobutamine, Outcome 2: Haemodynamics (Pulmonary capillary wedge pressure)

Comparison 6: Milrinone versus dobutamine, Outcome 3: Haemodynamics (Mean arterial pressure)

Comparison 7: Enoximone versus dobutamine, Outcome 1: All‐cause short‐term mortality

Comparison 7: Enoximone versus dobutamine, Outcome 2: All‐cause short‐term mortality: sensitivity analysis

Comparison 7: Enoximone versus dobutamine, Outcome 3: Haemodynamics (Cardiac index)

Comparison 7: Enoximone versus dobutamine, Outcome 4: Haemodynamics (Pulmonary capillary wedge pressure)

Comparison 7: Enoximone versus dobutamine, Outcome 5: Haemodynamics (Mean arterial pressure)

Comparison 8: Epinephrine versus norepinephrine, Outcome 1: All‐cause short‐term mortality

Comparison 8: Epinephrine versus norepinephrine, Outcome 2: All‐cause short‐term mortality: sensitivity analysis

Comparison 8: Epinephrine versus norepinephrine, Outcome 3: All‐cause long‐term mortality

Comparison 8: Epinephrine versus norepinephrine, Outcome 4: All‐cause long‐term mortality: sensitivity analysis

Comparison 8: Epinephrine versus norepinephrine, Outcome 5: Haemodynamics (Pulmonary capillary wedge pressure)

Comparison 8: Epinephrine versus norepinephrine, Outcome 6: Haemodynamics (Mean arterial pressure)

Comparison 9: Dopamine‐milrinone versus dopamine‐dobutamine, Outcome 1: All‐cause short‐term mortality

Comparison 9: Dopamine‐milrinone versus dopamine‐dobutamine, Outcome 2: All‐cause short‐term mortality: sensitivity analysis

Comparison 9: Dopamine‐milrinone versus dopamine‐dobutamine, Outcome 3: Haemodynamics (Cardiac index)

Comparison 9: Dopamine‐milrinone versus dopamine‐dobutamine, Outcome 4: Haemodynamics (Pulmonary capillary wedge pressure)

Comparison 9: Dopamine‐milrinone versus dopamine‐dobutamine, Outcome 5: Haemodynamics (Mean arterial pressure)

Comparison 10: Enoximone versus piroximone, Outcome 1: Haemodynamics (Cardiac index)

Comparison 10: Enoximone versus piroximone, Outcome 2: Haemodynamics (Pulmonary capillary wedge pressure)

Comparison 10: Enoximone versus piroximone, Outcome 3: Haemodynamics (Mean arterial pressure)
| Levosimendan compared to dobutamine for cardiogenic shock or low cardiac output syndrome | ||||||
| Patient or population: people with cardiogenic shock or low cardiac output syndrome | ||||||
| Outcomes | Anticipated absolute effects (95% CI) | Relative effect | No of participants | Quality of the evidence | Comments | |
|---|---|---|---|---|---|---|
| Risk with dobutamine | Risk with levosimendan | |||||
| All‐cause short‐term mortality: range 15 to 31 days | 148 per 10001 | 89 per 1000 | RR 0.60 (0.36 to 1.03) | 1701 | ⊕⊕⊝⊝ | Studies included participants with LCOS or CS due to cardiac surgery or HF. |
| All‐cause long‐term mortality: range 4 to 12 months | 288 per 10001 | 242 per 1000 | RR 0.84 | 1591 | ⊕⊕⊝⊝ | Studies included participants with LCOS or CS due to HF or AMI. |
| *The basis for the assumed risk (e.g. the median control group risk across studies) is provided in footnotes. The corresponding risk (and its 95% confidence interval) is based on the assumed risk in the comparison group and the relative effect of the intervention (and its 95% CI). | ||||||
| GRADE Working Group grades of evidence | ||||||
| 1Control group risk estimate comes from the control group risk in included studies with low cardiac output or cardiogenic shock. 2Downgraded 1 level for imprecision due to optimal information size criterion not being met and 1 level for study limitation due to stopping trial early for benefit and methodological limitations from lack of blinding. | ||||||
| Levosimendan compared with placebo for cardiogenic shock or low cardiac output syndrome | ||||||
| Patient or population: adults with cardiogenic shock or low cardiac output syndrome Settings: hospital Intervention: levosimendan Comparison: placebo | ||||||
| Outcomes | Anticipated absolute effects (95% CI) | Relative effect | No of participants | Quality of the evidence | Comments | |
|---|---|---|---|---|---|---|
| Risk with placebo | Risk with levosimendan | |||||
| All‐cause short‐term mortality: 1 month | Outcome not reported in any of the included studies. | |||||
| All‐cause long‐term mortality: range 4 to 6 months | 214 per 10001 | 118 per 1000 | RR 0.55 (0.16 to 1.90) | 55 | ⊕⊝⊝⊝ | Studies included participants with LCOS or CS due to HF or AMI. |
| *The basis for the assumed risk (e.g. the median control group risk across studies) is provided in footnotes. The corresponding risk (and its 95% confidence interval) is based on the assumed risk in the comparison group and the relative effect of the intervention (and its 95% CI). | ||||||
| GRADE Working Group grades of evidence | ||||||
| 1Control group risk estimate comes from the control group risk in included studies with low cardiac output or cardiogenic shock. 2Downgraded 2 levels for imprecision due to optimal information size criterion not being met and confidence interval crossing line of null effect and including appreciable benefit and harm and 1 level for study limitation due to methodological limitations from lack of blinding. | ||||||
| Levosimendan compared with enoximone for cardiogenic shock | ||||||
| Patient or population: adults with cardiogenic shock Settings: hospital Intervention: levosimendan Comparison: enoximone | ||||||
| Outcomes | Anticipated absolute effects (95% CI) | Relative effect | No of participants | Quality of the evidence | Comments | |
|---|---|---|---|---|---|---|
| Risk with enoximone | Risk with levosimendan | |||||
| All‐cause short‐term mortality: 30 days | 625 per 10001 | 313 per 1000 (138 to 712) | RR 0.50 (0.22 to 1.14) | 32 | ⊕⊝⊝⊝ very low2 | Study included participants with CS due to AMI. |
| All‐cause long‐term mortality | Outcome not reported in any of the included studies. | |||||
| *The basis for the assumed risk (e.g. the median control group risk across studies) is provided in footnotes. The corresponding risk (and its 95% confidence interval) is based on the assumed risk in the comparison group and the relative effect of the intervention (and its 95% CI). | ||||||
| GRADE Working Group grades of evidence | ||||||
| 1Control group risk estimate comes from the control group risk in a small included study with low cardiac output or cardiogenic shock. | ||||||
| Epinephrine compared with norepinephrine‐dobutamine for cardiogenic shock | ||||||
| Patient or population: adults with cardiogenic shock Setting: hospital Intervention: epinephrine Comparison: norepinephrine‐dobutamine | ||||||
| Outcomes | Anticipated absolute effects (95% CI) | Relative effect | No of participants | Quality of the evidence | Comments | |
|---|---|---|---|---|---|---|
| Risk with norepinephrine‐dobutamine | Risk with epinephrine | |||||
| All‐cause short‐term mortality: 28 days | 267 per 10001 | 333 per 1000 | RR 1.25 (0.41 to 3.77) | 30 | ⊕⊝⊝⊝ very low2 | Study included participants with CS due to HF. |
| All‐cause long‐term mortality | Outcome not reported in any of the included studies. | |||||
| *The basis for the assumed risk (e.g. the median control group risk across studies) is provided in footnotes. The corresponding risk (and its 95% confidence interval) is based on the assumed risk in the comparison group and the relative effect of the intervention (and its 95% CI). | ||||||
| GRADE Working Group grades of evidence | ||||||
| 1Control group risk estimate comes from the control group risk in a small included study with low cardiac output or cardiogenic shock. 2Downgraded 2 levels for imprecision due to optimal information size criterion not being met and confidence interval crossing line of null effect and including appreciable benefit and harm, and 1 level for study limitation due to methodological limitations from lack of blinding. | ||||||
| Dopexamine compared with dopamine for low cardiac output syndrome | ||||||
| Patient or population: adults with low cardiac output syndrome Setting: hospital Intervention: dopexamine Comparison: dopamine | ||||||
| Outcomes | Anticipated absolute effects (95% CI) | Relative effect | No of participants | Quality of the evidence | Comments | |
|---|---|---|---|---|---|---|
| Risk with dopamine | Risk with dopexamine | |||||
| All‐cause short‐term mortality: time in hospital | Not estimable1 | Not estimable1 | RR not estimable1 | 70 | ⊕⊝⊝⊝ very low2 | Study included participants with LCOS following elective surgery for CABG. |
| All‐cause long‐term mortality | Outcome not reported in any of the included studies. | |||||
| *The basis for the assumed risk (e.g. the median control group risk across studies) is provided in footnotes. The corresponding risk (and its 95% confidence interval) is based on the assumed risk in the comparison group and the relative effect of the intervention (and its 95% CI). | ||||||
| GRADE Working Group grades of evidence | ||||||
| 1No in‐hospital deaths were observed in the study. | ||||||
| Milrinone compared with dobutamine for low cardiac output syndrome | ||||||
| Patient or population: adults with low cardiac output syndrome Settings: hospital Intervention: milrinone Comparison: dobutamine | ||||||
| Outcomes | Anticipated absolute effects (95% CI) | Relative effect | No of Participants | Quality of the evidence | Comments | |
|---|---|---|---|---|---|---|
| Risk with dobutamine | Risk with milrinone | |||||
| All‐cause mortality | Outcome not reported in any of the included studies. | |||||
| *The basis for the assumed risk (e.g. the median control group risk across studies) is provided in footnotes. The corresponding risk (and its 95% confidence interval) is based on the assumed risk in the comparison group and the relative effect of the intervention (and its 95% CI). | ||||||
| GRADE Working Group grades of evidence | ||||||
| Enoximone compared with dobutamine for low cardiac output syndrome | ||||||
| Patient or population: adults with low cardiac output syndrome Setting: hospital Intervention: enoximone Comparison: dobutamine | ||||||
| Outcomes | Anticipated absolute effects (95% CI) | Relative effect | No of participants | Quality of the evidence | Comments | |
|---|---|---|---|---|---|---|
| Risk with dobutamine | Risk with enoximone | |||||
| All‐cause short‐term mortality: 1 month | 500 per 10001 | Not estimable2 | RR 0.21 (0.01 to 4.11) | 37 | ⊕⊕⊝⊝ very low3 | Study included participants with LCOS after mitral valve surgery. |
| All‐cause long‐term mortality | Outcome not reported in any of the included studies. | |||||
| *The basis for the assumed risk (e.g. the median control group risk across studies) is provided in footnotes. The corresponding risk (and its 95% confidence interval) is based on the assumed risk in the comparison group and the relative effect of the intervention (and its 95% CI). | ||||||
| GRADE Working Group grades of evidence | ||||||
| 1Control group risk estimate comes from a large observational study due to the small size of included studies in this population (Singh 2007). 2No in‐hospital deaths were observed in the study. | ||||||
| Epinephrine compared with norepinephrine for cardiogenic shock | ||||||
| Patient or population: adults with cardiogenic shock Settings: hospital Intervention: epinephrine Comparison: norepinephrine | ||||||
| Outcomes | Anticipated absolute effects (95% CI) | Relative effect | No of Participants | Quality of the evidence | Comments | |
|---|---|---|---|---|---|---|
| Risk with norepinephrine | Risk with epinephrine | |||||
| All‐cause short‐term mortality: 28 days | 266 per 10001 | 482 per 1000 (237 to 979) | RR 1.81 (0.89 to 3.68) | 57 | ⊕⊝⊝⊝ | Study included participants with CS due to AMI. |
| All‐cause long‐term mortality: 60 days | 366 per 10001 | 516 per 1000 | RR 1.41 (0.78 to 2.56) | 57 | ⊕⊝⊝⊝ | Study included participants with CS due to AMI. |
| *The basis for the assumed risk (e.g. the median control group risk across studies) is provided in footnotes. The corresponding risk (and its 95% confidence interval) is based on the assumed risk in the comparison group and the relative effect of the intervention (and its 95% CI). | ||||||
| GRADE Working Group grades of evidence | ||||||
| 1Control group risk estimate comes from the control group risk in a small included study with low cardiac output or cardiogenic shock. 2Downgraded 2 levels for imprecision due to optimal information size criterion not being met and confidence interval crossing line of null effect and including appreciable benefit and harm and 1 level for study limitation due to stopping trial early for benefit. | ||||||
| Dopamine‐milrinone compared with dopamine‐dobutamine for cardiogenic shock | ||||||
| Patient or population: adults with cardiogenic shock Settings: hospital Intervention: dopamine‐milrinone Comparison: dopamine‐dobutamine | ||||||
| Outcomes | Anticipated absolute effects (95% CI) | Relative effect | No of Participants | Quality of the evidence | Comments | |
|---|---|---|---|---|---|---|
| Risk with dopamine‐dobutamine | Risk with dopamine‐milrinone | |||||
| All‐cause short‐term mortality: at intensive care unit | 400 per 10001 | 400 per 1000 | RR 1.0 (0.34 to 2.93) | 20 | ⊕⊝⊝⊝ | Study included participants with CS due to HF. |
| All‐cause long‐term mortality | Outcome not reported in any of the included studies. | |||||
| *The basis for the assumed risk (e.g. the median control group risk across studies) is provided in footnotes. The corresponding risk (and its 95% confidence interval) is based on the assumed risk in the comparison group and the relative effect of the intervention (and its 95% CI). | ||||||
| GRADE Working Group grades of evidence | ||||||
| 1Control group risk estimate comes from the control group risk in a small included study with low cardiac output or cardiogenic shock. 2Downgraded 2 levels for imprecision due to optimal information size criterion not being met and confidence interval crossing line of null effect and including appreciable benefit and harm and 1 level for study limitation due to methodological limitations from lack of blinding and inappropriate random sequence generation. | ||||||
| Enoximone compared with piroximone for low cardiac output syndrome | ||||||
| Patient or population: adults with low cardiac output syndrome Settings: hospital Intervention: enoximone Comparison: piroximone | ||||||
| Outcomes | Anticipated absolute effects (95% CI) | Relative effect | No of Participants | Quality of the evidence | Comments | |
|---|---|---|---|---|---|---|
| Risk with piroximone | Risk with enoximone | |||||
| All‐cause mortality | Outcome not reported in any of the included studies. | |||||
| *The basis for the assumed risk (e.g. the median control group risk across studies) is provided in footnotes. The corresponding risk (and its 95% confidence interval) is based on the assumed risk in the comparison group and the relative effect of the intervention (and its 95% CI). | ||||||
| GRADE Working Group grades of evidence | ||||||
| Enoximone compared with epinephrine‐nitroglycerine for low cardiac output syndrome | ||||||
| Patient or population: adults with low cardiac output syndrome Settings: hospital Intervention: enoximone Comparison: epinephrine‐nitroglycerine | ||||||
| Outcomes | Anticipated absolute effects (95% CI) | Relative effect | No of Participants | Quality of the evidence | Comments | |
|---|---|---|---|---|---|---|
| Risk with epinephrine‐nitroglycerine | Risk with enoximone | |||||
| All‐cause mortality | Outcome not reported in any of the included studies. | |||||
| *The basis for the assumed risk (e.g. the median control group risk across studies) is provided in footnotes. The corresponding risk (and its 95% confidence interval) is based on the assumed risk in the comparison group and the relative effect of the intervention (and its 95% CI). | ||||||
| GRADE Working Group grades of evidence | ||||||
| Comparison | Primary studies | Haemodynamics | Intervention | Control | MD (95% CI) | ||
|---|---|---|---|---|---|---|---|
| Intervention vs control | last measurements | mean ± SD or median (IQR) | total | mean ± SD or median (IQR) | total | ||
| Levosimendan versus dobutamine | Cardiac index (72 h after treatment initiation; L/min/m2) | 1.9 ± 0.47 | 23 | 1.8 ± 0.19 | 23 | 0.10 (‐0.11 to 0.31) | |
| Cardiac index (48 h after treatment initiation; L/min/m2) | 2.8 ± 0.3 | 21 | 2.3 ± 0.2 | 20 | 0.50 (0.34 to 0.66) | ||
| Cardiac index (48 h after treatment initiation; L/min/m2) | 3.4 ± 0.2 | 69 | 2.7 ± 0.1 | 68 | 0.70 (0.65 to 0.75) | ||
| PCWP (72 h after treatment initiation; mmHg) | 19.0 ± 4.79 | 23 | 23.0 ± 4.79 | 23 | ‐4.00 (‐6.77 to ‐1.23) | ||
| PCWP (24 h after treatment initiation; mmHg) | 18.0 ± 8.0 | 103 | 24.0 ± 7.0 | 100 | ‐6.00 (‐8.07 to ‐3.93) | ||
| PCWP (48 h after treatment initiation; mmHg) | 12.1 ± 1.0 | 69 | 15.0 ± 2.0 | 68 | ‐2.90 (‐3.43 to ‐2.37) | ||
| MAP (48 h after treatment initiation; mmHg) | 77.0 ± 5 | 21 | 81.0 ± 7.0 | 20 | ‐4.00 (‐7.74 to ‐0.26) | ||
| MAP (48 h after treatment initiation; mmHg) | 78.7 ± 7.0 | 69 | 80.1 ± 4.0 | 68 | ‐1.30 (‐3.21 to 0.61) | ||
| Levosimendan versus placebo | Cardiac index (72 h after treatment initiation; L/min/m2) | 1.9 ± 0.47 | 23 | 1.8 ± 0.47 | 23 | 0.10 (‐0.17 to 0.37) | |
| Cardiac index (6 h after treatment initiation; L/min/m2) | 2.5 ± 0.98 | 98 | 1.9 ± 0.69 | 48 | 0.60 (0.32 to 0.88) | ||
| PCWP (72 h after treatment initiation; mmHg) | 19.0 ± 4.79 | 23 | 23.0 ± 4.79 | 23 | ‐4.00 (‐6.77 to ‐1.23) | ||
| PCWP (6 h after treatment initiation; mmHg) | 21.0 ± 9.89 | 98 | 28.0 ± 6.92 | 48 | ‐7.0 (‐9.77 to ‐4.23) | ||
| MAP (6 h after treatment initiation; mmHg) | 81.0 ± 19 | 98 | 85.0 ± 13.85 | 48 | ‐4.0 (‐9.54 to 1.54) | ||
| Levosimendan versus enoximone | Cardiac index (48 h after treatment initiation; L/min/m2) | 3.1 (2.5 ‐ 3.5) | 16 | 3.1 (2.8 ‐ 3.3) | 16 | not estimable | |
| PCWP (48 h after treatment initiation; mmHg) | 17.0 (16.0 ‐ 20.0) | 16 | 21.0 (19.0 ‐ 28.0) | 16 | not estimable | ||
| MAP (48 h after treatment initiation; mmHg) | 75.0 (58.0 ‐ 79.0) | 16 | 70.0 (63.0 ‐ 83.0) | 16 | not estimable | ||
| Epinephrine versus norepinephrine‐dobutamine | Cardiac index (24 h after treatment initiation; L/min/m2) | 2.9 ± 0.5 | 15 | 2.8 ± 0.4 | 15 | 0.10 (‐0.22 to 0.42) | |
| PCWP (24 h after treatment initiation; mmHg) | 18.0 ± 7.0 | 15 | 18.0 ± 7.0 | 15 | 0.00 (‐5.01 to 5.01) | ||
| MAP (24 h after treatment initiation; mmHg) | 64.0 ± 9.0 | 15 | 65.0 ± 11.0 | 15 | ‐1.0 (‐8.19 to 6.19) | ||
| Dopexamine versus dopamine | Cardiac index (6 h after treatment initiation; L/min/m2) | 3.1 ± 0.7 | 35 | 2.8 ± 0.5 | 35 | 0.30 (0.02 to 0.58) | |
| PCWP (6 h after treatment initiation; mmHg) | 9.3 ± 3.2 | 35 | 10.8 ± 2.9 | 35 | ‐1.50 (‐2.93 to ‐0.07) | ||
| MAP (6 h after treatment initiation; mmHg) | 76.3 ± 11.5 | 35 | 78.2 ± 12.8 | 35 | ‐1.90 (‐7.60 to 3.80) | ||
| Milrinone versus dobutamine | Cardiac index (4 h after treatment initiation; L/min/m2) | 2.4 ± 0.77 | 60 | 2.7 ± 2.32 | 60 | ‐0.30 (‐0.92 to 0.32) | |
| PCWP (4 h after treatment initiation; mmHg) | 11.2 ± 3.09 | 60 | 12.6 ± 5.42 | 60 | ‐1.40 (‐2.98 to 0.18) | ||
| MAP (4 h after treatment initiation; mmHg) | 68.5 ± 21.68 | 60 | 75.5 ± 32.53 | 60 | ‐7.0 (‐16.89 to 2.89) | ||
| Enoximone versus dobutamine | Cardiac index (12 h after treatment initiation; L/min/m2) | 2.56 ± 0.74 | 10 | 2.8 ± 0.35 | 10 | ‐0.74 (‐0.75 to 0.27) | |
| Cardiac index (14 h after treatment initiation; L/min/m2) | 2.8 ± 0.6 | 10 | 3.1 ± 0.9 | 10 | ‐0.30 (‐0.97 to 0.37) | ||
| PCWP (12 h after treatment initiation; mmHg) | 20.0 ± 5.7 | 10 | 23.7 ± 6.6 | 10 | ‐3.70 (‐9.11 to 1.71) | ||
| PCWP (14 h after treatment initiation; mmHg) | 13.1 ± 4.2 | 10 | 12.8 ± 4.1 | 10 | 0.30 (‐3.34 to 3.94) | ||
| MAP (12 h after treatment initiation; mmHg) | 78.0 ± 11.0 | 10 | 93.0 ± 17.0 | 10 | ‐15.0 (‐27.55 to ‐2.45) | ||
| Epinephrine versus norepinephrine | Cardiac index (72 h after treatment initiation; L/min/m2) | 2.6 (1.9 ‐ 3.3) | 27 | 2.6 (2.2 ‐ 3.2) | 30 | not estimable | |
| PCWP (72 h after treatment initiation; mmHg) | 12.5 ± 4.1 | 27 | 15.8 ± 5.7 | 30 | ‐3.30 (‐5.86 to ‐0.74) | ||
| MAP (72 h after treatment initiation; mmHg) | 83.7 ± 12.3 | 27 | 76.5 ± 8.1 | 30 | 7.20 (1.73 to 12.67) | ||
| Dopamine‐milrinone versus dopamine‐dobutamine | Cardiac index (1 h after treatment initiation; L/min/m2) | 2.6 ± 0.31 | 10 | 2.9 ± 0.63 | 10 | ‐0.30 (‐0.74 to 0.14) | |
| PCWP (1 h after treatment initiation; mmHg) | 17.0 ± 4.42 | 10 | 19.0 ± 6.32 | 10 | ‐2.0 (‐6.78 to 2.78) | ||
| MAP (1 h after treatment initiation; mmHg) | 65.0 ± 7.9 | 10 | 71.0 ± 12.01 | 10 | ‐6.0 (‐14.91 to 2.91) | ||
| Enoximone versus piroximone | Cardiac index (3 h after treatment initiation; L/min/m2) | 2.4 ± 0.5 | 10 | 2.5 ± 0.4 | 10 | ‐0.10 (‐0.50 to 0.30) | |
| PCWP (3 h after treatment initiation; mmHg) | 8.5 ± 2.0 | 10 | 9.2 ± 1.9 | 10 | ‐0.70 (‐2.41 to 1.01) | ||
| MAP (3 h after treatment initiation; mmHg) | 72.9 ± 8.7 | 10 | 69.6 ± 7.0 | 10 | 3.30 (‐3.62 to 10.22) | ||
| CI: confidence interval | |||||||
| Comparison | Primary studies | Adverse events (no MACE) | Intervention | Control | ||
|---|---|---|---|---|---|---|
| events | total | events | total | |||
| Levosimendan versus dobutamine | Acute kidney failure | 5 (7.2%) | 69 | 21 (30.9%) | 68 | |
| Agitation | 7 (1.1%) | 660 | 0 (0%) | 660 | ||
| Anaemia | 15 (2.3%) | 660 | 17 (2.6%) | 660 | ||
| Angina pectoris | 12 (1.8%) | 681 | 25 (3.7%) | 680 | ||
| Anxiety | 20 (3.0%) | 660 | 19 (2.9%) | 660 | ||
| Alvarez 2006, Follath (LIDO) 2002, Levin 2008, Mebazaa (SURVIVE) 2007 | Atrial fibrillation | 80 (9.4%) | 853 | 72 (8.5%) | 848 | |
| Back pain | 13 (2.0%) | 660 | 18 (2.7%) | 660 | ||
| Bradycardia | 9 (1.2%) | 763 | 18 (2.4%) | 760 | ||
| Cardiac arrest | 20 (3.0%) | 660 | 26 (3.9%) | 660 | ||
| Cataract | 7 (1.1%) | 660 | 14 (2.1%) | 660 | ||
| Chest pain | 32 (4.8%) | 660 | 47 (7.1%) | 660 | ||
| (Congestive) cardiac failure | 107 (16.2%) | 660 | 134 (20.3%) | 660 | ||
| Constipation | 26 (3.9%) | 660 | 28 (4.2%) | 660 | ||
| Cough | 19 (2.9%) | 660 | 21 (3.2%) | 660 | ||
| Diarrhea | 30 (4.5%) | 660 | 21 (3.2%) | 660 | ||
| Disorder aggravated | 2 (1,9%) | 103 | 4 (4.0%) | 100 | ||
| Dizziness | 19 (2.5%) | 763 | 17 (2.2%) | 760 | ||
| Dyspnoea | 10 (1.4%) | 729 | 21 (2.9%) | 728 | ||
| Epistaxis | 14 (2.1%) | 660 | 7 (1.1%) | 660 | ||
| Extrasystoles | 1 (1.0%) | 103 | 3 (3.0%) | 100 | ||
| Flushing | 1 (1.0%) | 103 | 3 (3.0%) | 100 | ||
| Gastrointestinal disorders | 2 (1.9%) | 103 | 7 (7.0%) | 100 | ||
| Headache | 69 (9.0%) | 763 | 36 (4.7%) | 760 | ||
| Hyperkalaemia | 15 (2.3%) | 660 | 16 (2.4%) | 660 | ||
| Hypertension | 9 (1.4%) | 660 | 15 (2.3%) | 660 | ||
| Hypokalaemia | 62 (9.4%) | 660 | 39 (5.9%) | 660 | ||
| Hypotension | 111 (14.5%) | 763 | 96 (12.6%) | 760 | ||
| Insomnia | 37 (5.6%) | 660 | 29 (4.4%) | 660 | ||
| Multiple organ failure | 0 (0%) | 11 | 0 (0%) | 11 | ||
| Muscle spasms | 12 (1.8%) | 660 | 13 (2.0%) | 660 | ||
| Nausea | 45 (6.8%) | 660 | 49 (7.4%) | 660 | ||
| Need for dialysis | 2 (2.9%) | 69 | 8 (11.9%) | 68 | ||
| Pain in extremity | 18 (2.7%) | 660 | 10 (1.5%) | 660 | ||
| Pneumonia | 34 (4.7%) | 729 | 34 (4.7%) | 728 | ||
| Prolonged ventilatory assistance | 6 (8.7%) | 69 | 22 (32.3%) | 68 | ||
| Pruritus | 16 (2.4%) | 660 | 7 (1.1%) | 660 | ||
| Pulmonary oedema | 20 (3.0%) | 660 | 18 (2.7%) | 660 | ||
| Pyrexia | 22 (3.3%) | 660 | 19 (2.9%) | 660 | ||
| Renal failure | 24 (3.6%) | 660 | 22 (3.3%) | 660 | ||
| Sepsis | 1 (1.4%) | 69 | 9 (13.2%) | 68 | ||
| Systemic inflammatory response syndrome | 4 (5.8%) | 69 | 15 (22.1%) | 68 | ||
| Tachycardia | 86 (11.3%) | 763 | 88 (11.6%) | 760 | ||
| Urinary infections | 21 (3.2%) | 660 | 30 (4.5%) | 660 | ||
| Vasoplegia | 1 (1.4%) | 69 | 9 (13.2%) | 68 | ||
| Ventricular arrhythmia | 3 (3.3%) | 90 | 12 (13.6%) | 88 | ||
| Ventricular extrasystoles | 40 (6.1%) | 660 | 24 (3.6%) | 660 | ||
| Ventricular fibrillation | 16 (2.1%) | 763 | 20 (2.6%) | 760 | ||
| Vomiting | 22 (3.3%) | 660 | 24 (3.6%) | 660 | ||
| Levosimendan versus placebo | Atrial fibrillation | 1 (25.0%) | 4 | 0 (0%) | 5 | |
| Ventricular tachycardia | 3 (2.9%) | 102 | 3 (5.7%) | 53 | ||
| Levosimendan versus enoximone | Acute renal failure | 5 (31.3%) | 16 | 8 (50.0%) | 16 | |
| Atrial fibrillation | 7 (43.8%) | 16 | 9 (56.3%) | 16 | ||
| Need of mechanical ventilation | 13 (81.3%) | 16 | 15 (93.8%) | 16 | ||
| Pneumonia | 7 (43.8%) | 16 | 7 (43.8%) | 16 | ||
| Sepsis | 3 (18.8%) | 16 | 2 (12.5%) | 16 | ||
| Systemic inflammatory response | 8 (50.0%) | 16 | 13 (81.3%) | 16 | ||
| Urinary infections | 0 (0%) | 16 | 2 (12.5%) | 16 | ||
| Ventricular tachycardia or fibrillation | 8 (50.0%) | 16 | 11 (68.8%) | 16 | ||
| Epinephrine versus norepinephrine‐dobutamine | Supraventricular arrhythmia | 2 (13.3%) | 15 | 0 (0%) | 15 | |
| Sustained ventricular tachycardia | 1 (6.7%) | 15 | 0 (0%) | 15 | ||
| Dopexamine versus dopamine | Abnormal blood loss | 2 (5.7%) | 35 | 1 (2.9%) | 35 | |
| Bradycardia | 2 (5.7%) | 35 | 4 (11.4%) | 35 | ||
| Hypertension | 3 (8.6%) | 35 | 7 (20.0%) | 35 | ||
| Junctional rhythm | 0 (0%) | 35 | 2 (5.7%) | 35 | ||
| Kidney failure | 1 (2.9%) | 35 | 1 (2.9%) | 35 | ||
| Premature atrial contractions | 2 (5.7%) | 35 | 6 (17.1%) | 35 | ||
| Premature ventricular contractions | 9 (25.7%) | 35 | 11 (31.4%) | 35 | ||
| ST elevation | 2 (5.7%) | 35 | 0 (0%) | 35 | ||
| Milrinone versus dobutamine | Atrial fibrillation | 3 (5.0%) | 60 | 11 (18.3%) | 60 | |
| Bradycardia | 8 (13.3%) | 60 | 1 (1.7%) | 60 | ||
| Haemorrhage | 9 (15.0%) | 60 | 3 (5.0%) | 60 | ||
| Hypertension | 8 (13.3%) | 60 | 24 (40.0%) | 60 | ||
| Hypotension | 12 (20.0%) | 60 | 6 (10.0%) | 60 | ||
| Oligouria | 6 (10.0%) | 60 | 2 (3.3%) | 60 | ||
| Tachycardia | 5 (8.3%) | 60 | 11 (18.3%) | 60 | ||
| Enoximone versus dobutamine | Haemorrhage | 0 (0%) | 18 | 1 (5.3%) | 19 | |
| Hepatic cytolysis | 0 (0%) | 10 | 0 (0%) | 10 | ||
| Tachycardia and/or hypertension | 0 (0%) | 18 | 4 (21.1%) | 19 | ||
| Thrombocytopenia | 0 (0%) | 10 | 0 (0%) | 10 | ||
| Ventricular hyperexcitability | 0 (0%) | 10 | 0 (0%) | 10 | ||
| Epinephrine versus norepinephrine | Arrhythmia | 11 (40.7%) | 27 | 10 (33.3%) | 30 | |
| Need for extracorporeal life support | 3 (11.1%) | 27 | 1 (3.3%) | 30 | ||
| Refactory shock | 10 (37.0%) | 27 | 2 (6.7%) | 30 | ||
| Enoximone versus piroximone | Arrhythmia | 1 (10.0%) | 10 | 0 (0%) | 10 | |
| Hypotension | 2 (20.0%) | 10 | 2 (20.0%) | 10 | ||
| Enoximone versus epinephrine/nitroglycerine | Arrhytmia | 0 (0%) | 6 | 0 (0%) | 6 | |
| Tachycardia | 0 (0%) | 6 | 0 (0%) | 6 | ||
| LIDO: study title ("levosimendan infusion versus dobutamine") | ||||||
| Outcome or subgroup title | No. of studies | No. of participants | Statistical method | Effect size |
| 1.1 All‐cause short‐term mortality Show forest plot | 4 | 1701 | Risk Ratio (M‐H, Random, 95% CI) | 0.60 [0.36, 1.03] |
| 1.2 All‐cause short‐term mortality: sensitivity analysis Show forest plot | 4 | 1701 | Risk Ratio (M‐H, Fixed, 95% CI) | 0.74 [0.58, 0.95] |
| 1.3 All‐cause long‐term mortality Show forest plot | 4 | 1591 | Risk Ratio (M‐H, Random, 95% CI) | 0.84 [0.63, 1.13] |
| 1.4 All‐cause long‐term mortality: sensitivity analysis Show forest plot | 4 | 1591 | Risk Ratio (M‐H, Fixed, 95% CI) | 0.89 [0.76, 1.05] |
| 1.5 MACE (Perioperative infarction) Show forest plot | 1 | Risk Ratio (M‐H, Random, 95% CI) | Totals not selected | |
| 1.6 MACE (Cerebrovascular accidents) Show forest plot | 1 | Risk Ratio (M‐H, Random, 95% CI) | Totals not selected | |
| 1.7 Haemodynamics (Cardiac index) Show forest plot | 3 | 224 | Mean Difference (IV, Random, 95% CI) | 0.45 [0.14, 0.76] |
| 1.8 Haemodynamics (Pulmonary capillary wedge pressure) Show forest plot | 3 | 386 | Mean Difference (IV, Random, 95% CI) | ‐4.14 [‐6.23, ‐2.06] |
| 1.9 Haemodynamics (Mean arterial pressure) Show forest plot | 2 | 178 | Mean Difference (IV, Random, 95% CI) | ‐2.15 [‐4.61, 0.31] |
| Outcome or subgroup title | No. of studies | No. of participants | Statistical method | Effect size |
| 2.1 All‐cause long‐term mortality Show forest plot | 2 | 55 | Risk Ratio (M‐H, Random, 95% CI) | 0.55 [0.16, 1.90] |
| 2.2 All‐cause long‐term mortality: sensitivity analysis Show forest plot | 2 | 55 | Risk Ratio (M‐H, Fixed, 95% CI) | 0.54 [0.15, 1.89] |
| 2.3 Haemodynamics (Cardiac index) Show forest plot | 2 | 192 | Mean Difference (IV, Random, 95% CI) | 0.35 [‐0.14, 0.84] |
| 2.4 Haemodynamics (Pulmonary capillary wedge pressure) Show forest plot | 2 | 192 | Mean Difference (IV, Random, 95% CI) | ‐5.50 [‐8.44, ‐2.56] |
| 2.5 Haemodynamics (Mean arterial pressure) Show forest plot | 1 | Mean Difference (IV, Random, 95% CI) | Totals not selected | |
| Outcome or subgroup title | No. of studies | No. of participants | Statistical method | Effect size |
| 3.1 All‐cause short‐term mortality Show forest plot | 1 | Risk Ratio (M‐H, Random, 95% CI) | Totals not selected | |
| 3.2 All‐cause short‐term mortality: sensitivity analysis Show forest plot | 1 | Risk Ratio (M‐H, Fixed, 95% CI) | Totals not selected | |
| 3.3 MACE (Cerebrovascular accidents) Show forest plot | 1 | Risk Ratio (M‐H, Random, 95% CI) | Totals not selected | |
| Outcome or subgroup title | No. of studies | No. of participants | Statistical method | Effect size |
| 4.1 All‐cause short‐term mortality Show forest plot | 1 | Risk Ratio (M‐H, Random, 95% CI) | Totals not selected | |
| 4.2 All‐cause short‐term mortality: sensitivity analysis Show forest plot | 1 | Risk Ratio (M‐H, Fixed, 95% CI) | Totals not selected | |
| 4.3 Haemodynamics (Cardiac index) Show forest plot | 1 | Mean Difference (IV, Random, 95% CI) | Totals not selected | |
| 4.4 Haemodynamics (Pulmonary capillary wedge pressure) Show forest plot | 1 | Mean Difference (IV, Random, 95% CI) | Totals not selected | |
| 4.5 Haemodynamics (Mean arterial pressure) Show forest plot | 1 | Mean Difference (IV, Random, 95% CI) | Totals not selected | |
| Outcome or subgroup title | No. of studies | No. of participants | Statistical method | Effect size |
| 5.1 MACE (Perioperative infarctions) Show forest plot | 1 | Risk Ratio (M‐H, Random, 95% CI) | Totals not selected | |
| 5.2 Haemodynamics (Cardiac index) Show forest plot | 1 | Mean Difference (IV, Random, 95% CI) | Totals not selected | |
| 5.3 Hemodynamics (Pulmonary capillary wedge pressure) Show forest plot | 1 | Mean Difference (IV, Random, 95% CI) | Totals not selected | |
| 5.4 Haemodynamics (Mean arterial pressure) Show forest plot | 1 | Mean Difference (IV, Random, 95% CI) | Totals not selected | |
| Outcome or subgroup title | No. of studies | No. of participants | Statistical method | Effect size |
| 6.1 Haemodynamics (Cardiac index) Show forest plot | 1 | Mean Difference (IV, Random, 95% CI) | Totals not selected | |
| 6.2 Haemodynamics (Pulmonary capillary wedge pressure) Show forest plot | 1 | Mean Difference (IV, Random, 95% CI) | Totals not selected | |
| 6.3 Haemodynamics (Mean arterial pressure) Show forest plot | 1 | Mean Difference (IV, Random, 95% CI) | Totals not selected | |
| Outcome or subgroup title | No. of studies | No. of participants | Statistical method | Effect size |
| 7.1 All‐cause short‐term mortality Show forest plot | 1 | Risk Ratio (M‐H, Random, 95% CI) | Totals not selected | |
| 7.2 All‐cause short‐term mortality: sensitivity analysis Show forest plot | 1 | Risk Ratio (M‐H, Fixed, 95% CI) | Totals not selected | |
| 7.3 Haemodynamics (Cardiac index) Show forest plot | 2 | 40 | Mean Difference (IV, Random, 95% CI) | ‐0.24 [‐0.64, 0.16] |
| 7.4 Haemodynamics (Pulmonary capillary wedge pressure) Show forest plot | 2 | 40 | Mean Difference (IV, Random, 95% CI) | ‐1.18 [‐4.97, 2.61] |
| 7.5 Haemodynamics (Mean arterial pressure) Show forest plot | 1 | Mean Difference (IV, Random, 95% CI) | Totals not selected | |
| Outcome or subgroup title | No. of studies | No. of participants | Statistical method | Effect size |
| 8.1 All‐cause short‐term mortality Show forest plot | 1 | Risk Ratio (M‐H, Random, 95% CI) | Totals not selected | |
| 8.2 All‐cause short‐term mortality: sensitivity analysis Show forest plot | 1 | Risk Ratio (M‐H, Fixed, 95% CI) | Totals not selected | |
| 8.3 All‐cause long‐term mortality Show forest plot | 1 | Risk Ratio (M‐H, Random, 95% CI) | Totals not selected | |
| 8.4 All‐cause long‐term mortality: sensitivity analysis Show forest plot | 1 | Risk Ratio (M‐H, Fixed, 95% CI) | Totals not selected | |
| 8.5 Haemodynamics (Pulmonary capillary wedge pressure) Show forest plot | 1 | Mean Difference (IV, Random, 95% CI) | Totals not selected | |
| 8.6 Haemodynamics (Mean arterial pressure) Show forest plot | 1 | Mean Difference (IV, Random, 95% CI) | Totals not selected | |
| Outcome or subgroup title | No. of studies | No. of participants | Statistical method | Effect size |
| 9.1 All‐cause short‐term mortality Show forest plot | 1 | Risk Ratio (IV, Random, 95% CI) | Totals not selected | |
| 9.2 All‐cause short‐term mortality: sensitivity analysis Show forest plot | 1 | Risk Ratio (IV, Fixed, 95% CI) | Totals not selected | |
| 9.3 Haemodynamics (Cardiac index) Show forest plot | 1 | Mean Difference (IV, Random, 95% CI) | Totals not selected | |
| 9.4 Haemodynamics (Pulmonary capillary wedge pressure) Show forest plot | 1 | Mean Difference (IV, Random, 95% CI) | Totals not selected | |
| 9.5 Haemodynamics (Mean arterial pressure) Show forest plot | 1 | Mean Difference (IV, Random, 95% CI) | Totals not selected | |
| Outcome or subgroup title | No. of studies | No. of participants | Statistical method | Effect size |
| 10.1 Haemodynamics (Cardiac index) Show forest plot | 1 | Mean Difference (IV, Random, 95% CI) | Totals not selected | |
| 10.2 Haemodynamics (Pulmonary capillary wedge pressure) Show forest plot | 1 | Mean Difference (IV, Random, 95% CI) | Totals not selected | |
| 10.3 Haemodynamics (Mean arterial pressure) Show forest plot | 1 | Mean Difference (IV, Random, 95% CI) | Totals not selected | |