Farmacoterapia para la hiperuricemia en pacientes con hipertensión
Información
- DOI:
- https://doi.org/10.1002/14651858.CD008652.pub3Copiar DOI

- Base de datos:
-
- Cochrane Database of Systematic Reviews
- Versión publicada:
-
- 13 abril 2017see what's new
- Tipo:
-
- Intervention
- Etapa:
-
- Review
- Grupo Editorial Cochrane:
-
Grupo Cochrane de Hipertensión
- Copyright:
-
- Copyright © 2017 The Cochrane Collaboration. Published by John Wiley & Sons, Ltd.
Cifras del artículo
Altmetric:
Citado por:
Autores
Contributions of authors
| Drafting the protocol | Pedro Gois and Edison Souza |
| Developing and running the search strategy | Pedro Gois |
| Obtaining copies of studies | Pedro Gois |
| Selecting which studies to include | Pedro Gois and Edison Souza |
| Extracting data from studies | Pedro Gois and Edison Souza |
| Entering data into RevMan | Pedro Gois |
| Carrying out the analysis | Pedro Gois |
| Interpreting the analysis | Pedro Gois and Edison Souza |
| Drafting the final review | Pedro Gois |
| Updating the review | Pedro Gois |
Declarations of interest
Nothing to declare.
Acknowledgements
This protocol of this systematic review was based on a work undertaken as part of the postgraduate course in Evidence‐Based Health, which was organized by Sírio‐Libanês Hospital‐Sao Paulo/Brazil. We are sincerely grateful to the Cochrane Hypertension Review Group (specially to Mr Doug Salzwedel for the valuable contribution with the search strategies, as well as to Mr Ciprian Jauca and Dr. James M Wright for their inestimable assistance). We are grateful to Prof. Dr Daniel O'Connor (in memoriam) and Prof. Dr Sucheta Vaingankar for providing us with the conclusion of the study "Febuxostat in prehypertensive individuals". We also thank Prof. Dr Antonio Carlos Seguro for reading this manuscript.
Version history
| Published | Title | Stage | Authors | Version |
| 2020 Sep 02 | Pharmacotherapy for hyperuricaemia in hypertensive patients | Review | Pedro Henrique França Gois, Edison Regio de Moraes Souza | |
| 2017 Apr 13 | Pharmacotherapy for hyperuricemia in hypertensive patients | Review | Pedro Henrique França Gois, Edison Regio de Moraes Souza | |
| 2013 Jan 31 | Pharmacotherapy for hyperuricemia in hypertensive patients | Review | Pedro Henrique França Gois, Edison Regio de Moraes Souza | |
| 2010 Aug 04 | Pharmacotherapy for hyperuricemia in hypertensive patients | Protocol | Pedro Henrique França Gois, Edison Regio de Moraes Souza, Carolina Urbini dos Santos | |
Differences between protocol and review
The affiliation and contact information for the review contact person changed. We amended the study protocol to allow the inclusion of studies involving prehypertensive individuals. Due to lack of data, we were unable to perform subgroup and sensitivity analyses in this review. GRADE was incorporated into this review update to assess the quality of evidence. Two new databases, clinical trials registry platform (WHO) and database of abstracts of reviews of effectiveness (DARE), were searched for this review update.
Keywords
MeSH
Medical Subject Headings (MeSH) Keywords
- Allopurinol [*therapeutic use];
- Blood Pressure [drug effects];
- Hypertension [complications, *drug therapy];
- Hyperuricemia [complications, *drug therapy];
- Patient Dropouts [statistics & numerical data];
- Placebos [therapeutic use];
- Prehypertension [drug therapy];
- Randomized Controlled Trials as Topic;
- Uricosuric Agents [*therapeutic use];
Medical Subject Headings Check Words
Adolescent; Adult; Child; Humans;
PICO

Flow diagram of the study selection
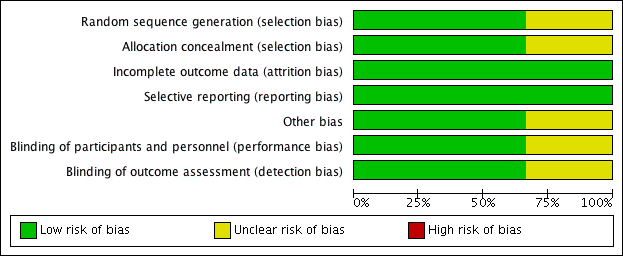
Risk of bias graph: review authors' judgements about each risk of bias item presented as percentages across all included studies.

Risk of bias summary: review authors' judgements about each risk of bias item for each included study.
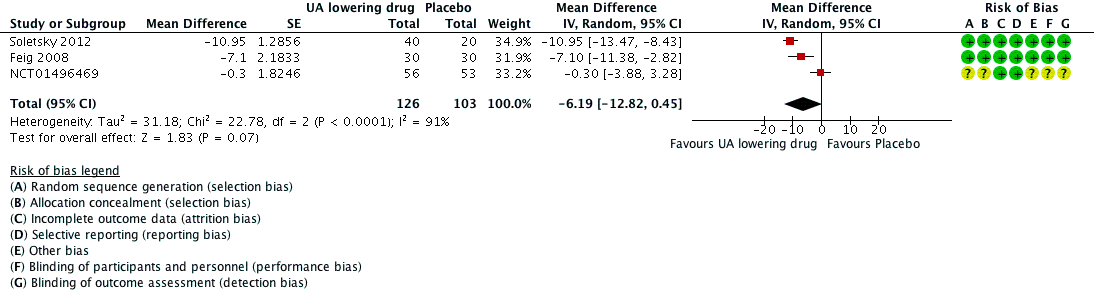
Forest plot of comparison: 1 Uric acid (UA)‐lowering drug vs. placebo, outcome: 1.1 systolic 24‐hour ambulatory blood pressure.
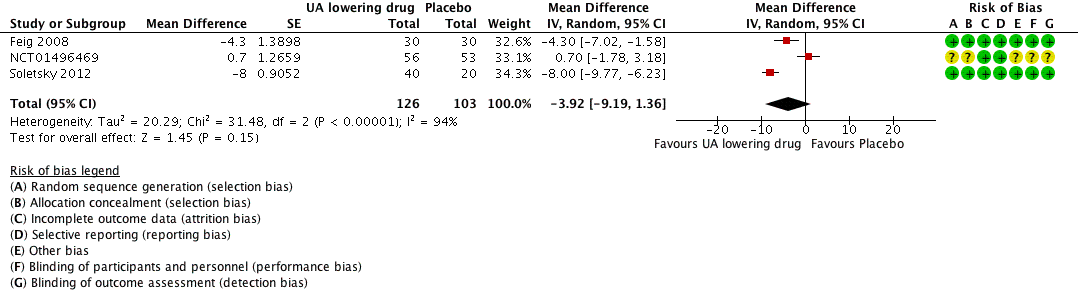
Forest plot of comparison: 1 Uric acid (UA)‐lowering drug vs. placebo, outcome: 1.2 diastolic 24‐hour ambulatory blood pressure.

Forest plot of comparison: 1 Uric acid (UA)‐lowering drug vs. placebo, outcome: 1.3 Clinic systolic blood pressure.

Forest plot of comparison: 1 Uric acid (UA)‐lowering drug vs. placebo, outcome: 1.4 clinic diastolic blood pressure.

Forest plot of comparison: 1 Uric acid (UA)‐lowering drug vs. placebo, outcome: 1.5 serum uric acid.
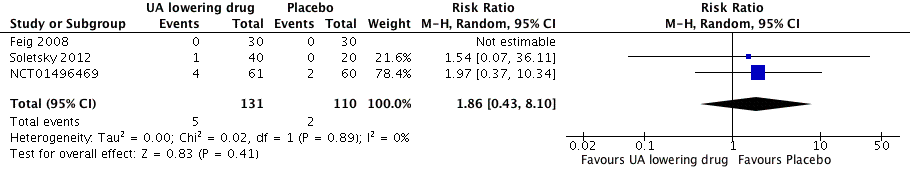
Forest plot of comparison: 1 Uric acid (UA)‐lowering drug vs placebo, outcome: 1.6 Withdrawals due to adverse effects.

Comparison 1 Uric acid (UA) lowering drug vs placebo, Outcome 1 24h‐Systolic Blood Pressure.

Comparison 1 Uric acid (UA) lowering drug vs placebo, Outcome 2 24h‐Diastolic Blood Pressure.
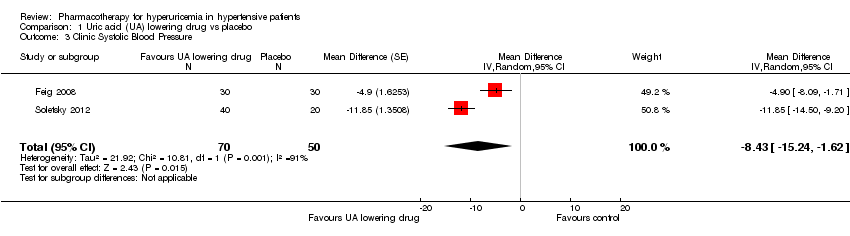
Comparison 1 Uric acid (UA) lowering drug vs placebo, Outcome 3 Clinic Systolic Blood Pressure.
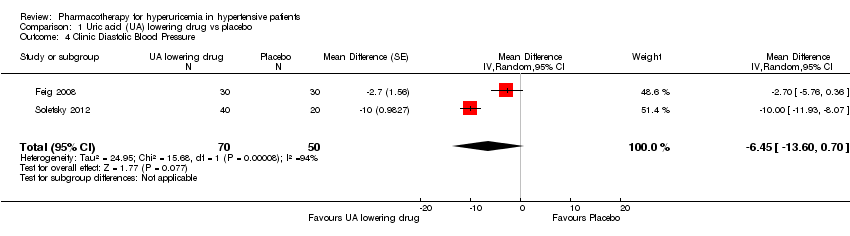
Comparison 1 Uric acid (UA) lowering drug vs placebo, Outcome 4 Clinic Diastolic Blood Pressure.

Comparison 1 Uric acid (UA) lowering drug vs placebo, Outcome 5 Serum uric acid.

Comparison 1 Uric acid (UA) lowering drug vs placebo, Outcome 6 Withdrawals due to adverse effects.
| Uric acid (UA)‐lowering drug compared to placebo for hyperuricemia in hypertensive patients | ||||||
| Patient or population: hyperuricemia in hypertensive patients | ||||||
| Outcomes | Anticipated absolute effects* (95% CI) | Relative effect | № of participants | Quality of the evidence | Comments | |
| Risk with placebo | Risk with Uric acid (UA) lowering drug | |||||
| 24h‐Systolic Blood Pressure | ‐ | MD 6.19 lower | MD ‐6.2 (‐12.8, 0.5) | 229 | ⊕⊕⊝⊝ | |
| 24h‐Diastolic Blood Pressure | ‐ | MD 3.92 lower | MD ‐3.9 (‐9.2, 1.4) | 229 | ⊕⊕⊝⊝ | |
| Clinic Systolic Blood Pressure | ‐ | MD 8.43 lower | MD ‐8.4 (‐15.2, ‐1.6) | 120 | ⊕⊕⊝⊝ | |
| Clinic Diastolic Blood Pressure | ‐ | MD 6.45 lower | MD ‐6.5 (‐13.6, 0.7) | 120 | ⊕⊕⊝⊝ | |
| Serum uric acid | ‐ | MD 3.09 lower | MD ‐3.1 (‐3.8, ‐2.4) | 223 | ⊕⊕⊕⊕ | |
| Withdrawals due to adverse effects | 18 per 1,000 | 34 per 1,000 | RR 1.86 | 241 | ⊕⊝⊝⊝ | NCT01496469 reported only one withdrawal due to adverse events. However, four adverse events were described in the febuxostat group, which might be drug‐related. Therefore, we decided to include all four cases in the assessment of RR for this study. |
| *The risk in the intervention group (and its 95% confidence interval) is based on the assumed risk in the comparison group and the relative effect of the intervention (and its 95% CI). | ||||||
| GRADE Working Group grades of evidence | ||||||
| 1 Downgraded for wide CIs 2 Downgraded for high unexplained heterogeneity 3 Downgraded for small number of events and incomplete reporting 4 Unclear randomisation processes in the largest trial (highest weight in meta‐analysis) | ||||||
| Outcome or subgroup title | No. of studies | No. of participants | Statistical method | Effect size |
| 1 24h‐Systolic Blood Pressure Show forest plot | 3 | 229 | Mean Difference (Random, 95% CI) | ‐6.19 [‐12.82, 0.45] |
| 2 24h‐Diastolic Blood Pressure Show forest plot | 3 | 229 | Mean Difference (Random, 95% CI) | ‐3.92 [‐9.19, 1.36] |
| 3 Clinic Systolic Blood Pressure Show forest plot | 2 | 120 | Mean Difference (Random, 95% CI) | ‐8.43 [‐15.24, ‐1.62] |
| 4 Clinic Diastolic Blood Pressure Show forest plot | 2 | 120 | Mean Difference (Random, 95% CI) | ‐6.45 [‐13.60, 0.70] |
| 5 Serum uric acid Show forest plot | 3 | 223 | Mean Difference (Random, 95% CI) | ‐3.09 [‐3.76, ‐2.43] |
| 6 Withdrawals due to adverse effects Show forest plot | 3 | 241 | Risk Ratio (M‐H, Random, 95% CI) | 1.86 [0.43, 8.10] |