Farmacoterapia para la hiperuricemia en pacientes con hipertensión
Resumen
Antecedentes
Esta es la segunda actualización de esta revisión sistemática. La hipertensión arterial representa un problema importante de salud pública. A nivel mundial, cerca de una cuarta parte de la población adulta presenta hipertensión. Los estudios epidemiológicos y experimentales indican una conexión entre la hiperuricemia y la hipertensión. La hiperuricemia afecta a entre el 25% y el 40% de las personas con hipertensión no tratada; se ha informado de una prevalencia mucho menor en las personas con una presión arterial normal (normotensión) o en la población en general. Sin embargo, sigue sin responderse la pregunta de si la disminución del ácido úrico sérico (AUS) podría reducir la presión arterial (PA).
Objetivos
Determinar si los agentes hipouricemiantes reducen la PA en los personas con hipertensión primaria o prehipertensión en comparación con un placebo.
Métodos de búsqueda
El especialista en información del Grupo Cochrane de Hipertensión (Cochrane Hypertension Group) buscó ensayos aleatorizados en las siguientes bases de datos hasta mayo de 2020: Registro Cochrane Especializado en Hipertensión (Cochrane Hypertension Specialised Register); CENTRAL 2018, número 12), MEDLINE (desde 1946), Embase (desde 1974), la plataforma de registros internacionales de ensayos clínicos de la Organización Mundial de la Salud y ClinicalTrials.gov. También se realizaron búsquedas en LILACS (1982 hasta mayo de 2020) y se estableció contacto con autores de artículos relevantes sobre trabajos publicados y no publicados. En la búsqueda no hubo restricciones de idioma o fecha.
Criterios de selección
Para incluirlos en esta actualización de la revisión, los estudios debían cumplir los siguientes criterios: 1) aleatorizado o cuasialeatorizado, con un grupo asignado a recibir un agente reductor del ácido úrico (AU) y otro grupo asignado a recibir placebo; 2) doble ciego, simple ciego o abierto; 3) diseño de ensayo paralelo o cruzado (cross‐over); 4) los ensayos cruzados debían tener un período de lavado de al menos dos semanas; 5) la duración mínima del tratamiento debía ser de cuatro semanas; 6) los participantes debían tener un diagnóstico de hipertensión esencial o de prehipertensión más hiperuricemia (AU sérico superior a 6 mg/dL en las mujeres, 7 mg/dL en los hombres, y 5,5 mg/dL en niños o adolescentes); 7) las medidas de desenlace incluían cambios en la presión arterial sistólica o diastólica ambulatoria de 24 horas, o ambas; o la presión arterial sistólica o diastólica medida en la clínica, o ambas.
Obtención y análisis de los datos
Los dos autores de la revisión, de forma independiente, recopilaron los datos utilizando un formulario de extracción de datos, y se resolvió cualquier desacuerdo mediante discusión. El riesgo de sesgo se evaluó mediante la herramienta Cochrane " Riesgo de sesgo'. La certeza de la evidencia se evaluó mediante los criterios GRADE.
Resultados principales
En esta actualización de la revisión se revisaron 722 registros y se seleccionaron 26 informes de texto completo para su evaluación. No se identificaron estudios en curso ni se añadieron nuevos estudios. Se incluyeron tres ensayos controlados aleatorizados (ECA), que reclutaron a 211 personas con hipertensión o prehipertensión más hiperuricemia.
La evidencia de certeza baja de tres ECA encontraron resultados no concluyentes entre los que recibieron fármacos reductores del ácido úrico y placebo, en la presión arterial sistólica ambulatoria de 24 horas (DM ‐6,2 mmHg, IC del 95%: ‐12,8 a 0,5) o la presión arterial diastólica (‐3,9 mmHg, IC del 95%: ‐9,2 a 1,4).
La evidencia de certeza baja de dos ECA indican que los fármacos que disminuyen el ácido úrico reducen la presión arterial sistólica medida en la clínica (‐8,43 mmHg, IC del 95%: ‐15,24 a ‐1,62), pero los resultados de la presión arterial diastólica medida en la clínica no fueron concluyentes (‐6,45 mmHg, IC del 95%: ‐13,60 a 0,70).
La evidencia de certeza alta de tres ECA encontró que el ácido úrico en suero se redujo en 3,1 mg/dl (IC del 95%: 2,4 a 3,8) en los participantes que recibieron fármacos reductores del ácido úrico.
La evidencia de certeza baja de tres ECA encontraron resultados no concluyentes con respecto a la aparición de eventos adversos entre los que recibieron fármacos reductores del ácido úrico y el placebo (RR 1,86; IC del 95%: 0,43 a 8,10).
Conclusiones de los autores
En esta revisión Cochrane actualizada, los datos de los ECA actuales son insuficientes para determinar si el tratamiento de reducción del ácido úrico reduce la PA. Se necesitan más estudios.
PICO
Resumen en términos sencillos
Farmacoterapia para el tratamiento de la hiperuricemia en personas con hipertensión
Antecedentes
Esta es la segunda actualización de esta revisión Cochrane. La evidencia está actualizada hasta mayo de 2020.
El ácido úrico es el producto final natural que resulta de la desintegración de los tejidos corporales y de los alimentos, particularmente las proteínas. Habitualmente, el ácido úrico es eliminado de la sangre por el riñón y excretado en la orina. Si se produce demasiado ácido úrico o el riñón no es capaz de eliminarlo, aumentan los niveles del ácido en sangre (hiperuricemia). Desde el siglo XIX se ha reconocido una conexión entre la hiperuricemia y la hipertensión. Esta revisión pretende evaluar si la reducción de los niveles de ácido úrico en sangre también podía disminuir también la presión arterial.
Características de los estudios
En esta actualización se examinaron 722 registros y se seleccionaron 26 para una evaluación más detallada. No se encontraron más estudios para añadir a los tres estudios (211 participantes) que ya estaban incluidos en la revisión. Estos estudios evaluaron a adolescentes y adultos. Compararon la farmacoterapia para disminuir el ácido úrico, con un control de placebo, en personas diagnosticadas de hipertensión.
Lo que dice la investigación
No se encontraron resultados concluyentes sobre si el tratamiento farmacológico para reducir el ácido úrico disminuyó la presión arterial más que el placebo en personas con hipertensión y altos niveles de ácido úrico en la sangre. La farmacoterapia disminuyó los niveles de ácido úrico en la sangre mejor que el placebo. Los resultados de los efectos secundarios no fueron concluyentes entre el grupo de la farmacoterapia y el de placebo.
No hay suficiente evidencia que demuestre que los fármacos que reducen los niveles de ácido úrico en la sangre también disminuyan la presión arterial en las personas con hipertensión. Se necesita más investigación sobre este tema.
Certeza de la evidencia
La baja calidad de la evidencia no pudo determinar si la farmacoterapia para tratar los niveles altos de ácido úrico en la sangre reduce la presión arterial. Se redujo la certeza de la evidencia porque los estudios presentaron datos limitados y resultados inconsistentes para este desenlace.
Hay evidencia de certeza alta de que los fármacos destinados a disminuir el ácido úrico, lo reducen.
La evidencia de certeza baja no permitió determinar si la farmacoterapia aumentaba la aparición de efectos secundarios. Se redujo la certeza de la evidencia por problemas con el diseño del estudio, falta de datos y resultados inconsistentes entre los estudios.
No está claro que los estudios futuros no vayan a cambiar estas conclusiones.
Authors' conclusions
Summary of findings
| Uric acid‐lowering drug compared to placebo for hyperuricaemia in people with hypertension | ||||||
|---|---|---|---|---|---|---|
| Patient or population: hyperuricaemia in people with hypertension | ||||||
| Outcomes | Anticipated absolute effects* (95% CI) | Relative effect | № of participants | Certainty of the evidence | Comments | |
| Matched placebo | Risk difference with UA‐lowering drug | |||||
| 24‐h ambulatory systolic BP | The mean change in BP across control groups ranged from: ‐3.4 to 1.9 mmHg | MD was 6.19 mmHg lower (12.82 lower to 0.45 higher) | ‐ | 229 participants' data | ⊕⊕⊝⊝ | |
| 24‐h ambulatory diastolic BP | The mean change in BP across control groups ranged from: ‐2.7 to 1.3 mmHg | MD was 3.92 mmHg lower (9.19 lower to 1.36 higher) | ‐ | 229 participants' data | ⊕⊕⊝⊝ | |
| Clinic‐measured systolic BP | The mean change in BP across control groups ranged from: ‐2 to 1.7 mmHg | MD was 8.43 mmHg lower (15.24 lower to 1.62 lower) | ‐ | 120 participants' data | ⊕⊕⊝⊝ | |
| Clinic‐measured diastolic BP | The mean change in BP across control groups ranged from: ‐2.4 to 1.6 mmHg | MD was 6.45 mmHg lower (13.6 lower to 0.7 higher) | ‐ | 120 participants' data | ⊕⊕⊝⊝ | |
| Serum UA | The mean change in serum UA across control groups ranged from: ‐0.3 to 0.2 mg/dL | MD was 3.09 mg/dL lower (3.76 lower to 2.43 lower) | ‐ | 223 participants' data | ⊕⊕⊕⊕ | |
| Adverse events (withdrawals due to side effects) | 18 per 1000 | 34 per 1000 | RR 1.86 | 241 participants' data | ⊕⊕⊝⊝ | |
| *The risk in the intervention group (and its 95% confidence interval) is based on the assumed risk in the comparison group and the relative effect of the intervention (and its 95% CI). | ||||||
| GRADE Working Group grades of evidence | ||||||
| aDowngraded for wide CIs | ||||||
Background
This is the second update of this Cochrane Review. Uric acid (UA) is the final breakdown product derived from purine metabolism. Urate oxidase (uricase) is the enzyme responsible for converting UA into allantoin, which is soluble and can be easily excreted by the kidneys. During human evolution, several cumulative mutations on the uricase gene have resulted in a non‐functional gene. Thus, the lack of uricase in humans leads to the potential development of hyperuricaemia and its complications (Kasper 2004; Poon 2009; Sachs 2009).
Hyperuricaemia can be defined as a serum uric acid (UA) concentration greater than 6 mg/dL in women, 7 mg/dL in men, and 5.5 mg/dL in children and adolescents, and can result from increased UA production, reduced excretion, or both (Kasper 2004).
The relationship between hyperuricaemia and hypertension is not a recent observation. In fact, its first mention was in a paper published in 1879 by Frederick Akbar Mohamed, who noticed that some people with hypertension came from gouty families (Feig 2006). Since the Framingham Heart Study, numerous epidemiological studies have demonstrated an association between hyperuricaemia and hypertension. Several of them, including large prospective studies, have found serum UA to independently predict the development of hypertension (Alper 2005; Hunt 1991; Ouppatham 2008; Perlstein 2006; Sundström 2005; Taniguchi 2001).
Therefore, a new question has emerged, which remains unanswered: does lowering serum UA lower blood pressure (BP) or impact the natural history of essential hypertension (Feig 2006; Johnson 2005; Trachtman 2007)?
Description of the condition
According to the Seventh Report of the Joint National Committee (JNC) on Prevention, Detection, Evaluation and Treatment of High Blood Pressure, hypertension is defined as systolic BP > 140 mmHg, or diastolic BP ≥ 90 mmHg, or both (Chobanian 2003). A diagnosis is made when the average of two or more measurements, made during at least two consecutive medical visits, reaches these values. The burden of hypertension‐related cardiovascular risk and mortality is well established. High BP increases the risk for a heart attack, congestive heart failure, stroke, and renal disease (Carretero 2000; Chobanian 2003).
Hypertension represents a major public health problem. Worldwide, approximately one‐fourth of the adult population has hypertension, and the prevalence is expected to increase to 29% by 2025 (Kearney 2005). Furthermore, only a minority of people with hypertension achieve optimal BP control; 30% of people are unaware of their disease (Germino 2009; Mittal 2010; Williams 2010).
Hyperuricaemia affects 25% to 40% of people with untreated hypertension; a much lower prevalence has been reported in people with normal BP, or in the general population. Strikingly, essential hypertension was found in 89% of children with a serum UA level of 5.5 mg/dL or higher (Cannon 1966; Feig 2008; Kinsey 1961).
Description of the intervention
The agents to lower serum UA can be divided into two distinct categories of drugs:
-
xanthine‐oxidase inhibitors (allopurinol, febuxostat and topiroxostat);
-
uricosuric agents (benzbromarone, benziodarone, probenecid, lesinurad, sulfinpyrazone, ethebencid, zoxazolamine and ticrynafen).
Treatment with one of these drugs is recommended for people with a history of recurring gouty attacks. Their use in asymptomatic hyperuricaemia is controversial and non‐consensual.
How the intervention might work
Inquiry into the possible link between hyperuricaemia and hypertension has led to experimental studies in laboratory animals. Raising serum UA in rats caused a reduction in endothelial nitric oxide levels and overactivation of the renin‐angiotensin system, which explained the UA‐mediated arteriolopathy and interstitial inflammation observed in the kidneys (Mazzali 2002). In humans, studies have postulated that high serum UA is related to impaired endothelial function (de A Coutinho 2007; Feig 2008). Thus far, evidence from animal studies suggested that the involvement of UA in the pathogenesis of hypertension could occur in two phases (Mazzali 2002). First, high UA leads to the activation of the renin‐angiotensin system, increased oxidative stress, and endothelial dysfunction (with reduced levels of nitric oxide). These changes have been associated with increased systemic BP and vascular resistance. During this initial phase, it is proposed that BP rises independently of a low salt diet, and could be treated by UA‐lowering agents. The second phase is marked by renal microvascular disease (mostly involving the afferent arterioles) associated with tubulointerstitial inflammation, resulting in salt‐sensitive hypertension, which is not responsive to UA‐lowering therapy (Mazzali 2002). If these experimental observations could be translated to humans, it is possible that pharmacotherapy for hyperuricaemia could be effective, especially in the early stages of hypertension.
If there is a causal link between UA and hypertension, UA‐lowering drugs might have antihypertensive properties. Whether hyperuricaemia is a modifiable risk factor for the development and control of hypertension is a matter of debate. The JNC, a recognized authority in hypertension issues, does not recognize hyperuricaemia as a risk factor. This might be due to the uncertainty as to whether hyperuricaemia has a causal role in the development of hypertension, or is secondary to a reduction in renal function.
Why it is important to do this review
The aim of this Cochrane Review was to determine whether or not the treatment of hyperuricaemia also lowered BP in people with hypertension, or impacted the natural history of essential hypertension. The findings could support a novel indication for UA‐lowering agents, independent of issues directly relating to hyperuricaemia or its complications.
Objectives
To determine whether uric acid‐lowering agents reduce blood pressure in people with primary hypertension or prehypertension, compared with placebo.
Methods
Criteria for considering studies for this review
Types of studies
We included published and non‐published clinical trials involving the randomised (RCT) or quasi‐randomised (Q‐RCT) allocation (double‐blind, single‐blind or open‐label) of a uric acid (UA)‐lowering agent or placebo, with parallel or cross‐over study designs (with an adequate washout period of at least two weeks before cross‐over).
We only included studies with a minimum duration of four weeks of treatment with a UA‐lowering agent.
We did not include cluster‐randomised trials in this review.
Types of participants
We included participants of any gender, age, or ethnicity, with primary hypertension or prehypertension, plus hyperuricaemia. We defined primary hypertension as systolic blood pressure (BP) ≥ 140 mmHg, diastolic BP ≥ 90 mmHg, or both; prehypertension as systolic BP 120 mmHg to 139 mmHg or diastolic BP 80 mmHg to 89 mmHg in adults, and as average systolic or diastolic BP levels ≥ 90th percentile but < 95th percentile in children, or ≥ 120/80 mmHg in adolescents (Falkner 2004); and hyperuricaemia as serum UA greater than 6 mg/dL in women, 7 mg/dL in men, and 5.5 mg/dL in children and adolescents. In comparison to a previous version of this review, we expanded the inclusion criteria to cover studies enrolling people with prehypertension (Gois 2013a).
Types of interventions
UA‐lowering agents: either a xanthine‐oxidase inhibitor (allopurinol, febuxostat, topiroxostat or a pharmaceutically acceptable salt thereof) or a uricosuric agent (benzbromarone, benziodarone, probenecid, lesinurad, sulfinpyrazone, ethebencid, zoxazolamine, or a pharmaceutically acceptable salt thereof). We excluded ticrynafen, an uricosuric agent, because of its known direct effect on blood pressure.
Comparison: placebo
Types of outcome measures
Primary outcomes
-
Change in BP (24‐hour ambulatory systolic, 24‐hour ambulatory diastolic, or both; clinic‐measured systolic, clinic‐measured diastolic, or both)
Secondary outcomes
-
Change in UA levels
-
Adverse events: mortality, nonfatal serious adverse events, cardiovascular events (defined as stroke, myocardial infarction, heart failure), and withdrawals due to adverse events
Search methods for identification of studies
Electronic searches
The Cochrane Hypertension Information Specialist conducted systematic searches in the following databases for randomised controlled trials, without language, publication year, or publication status restrictions:
-
the Cochrane Hypertension Specialised Register via the Cochrane Register of Studies (CRS‐Web; searched 6 May 2020);
-
the Cochrane Central Register of Controlled Trials (CENTRA) (2020, Issue 4) via the Cochrane Register of Studies (CRS‐Web; searched 11 May 2020);
-
MEDLINE Ovid, MEDLINE Ovid Epub ahead of print, and MEDLINE Ovid In‐process & other non‐indexed citations (from 1946; searched 6 May 2020);
-
Embase Ovid (from 1974; searched 6 May 2020);
-
ClinicalTrials.gov (www.clinicaltrials.gov; searched 6 May 2020);
-
World Health Organization International Clinical Trials Registry Platform (www.who.int/trialsearch; searched 6 May 2020);
-
LILACS (Latin American and Caribbean Health Science Information database)(searched 6 May 2020).
The Information Specialist (IS) modelled subject strategies for databases on the search strategy designed for MEDLINE. Where appropriate, the IS combined them with subject strategy adaptations of the highly sensitive search strategy designed by Cochrane for identifying randomised controlled (as described in the Cochrane Handbook for Systematic Reviews of Interventions Version 5.1.0, Box 6.4.b. (Higgins 2011)). Please see Appendix 1 for the search strategies for major databases.
Searching other resources
-
The Cochrane Hypertension Information Specialist searched the Hypertension Specialised Register segment (which includes searches of MEDLINE and Epistemonikos for systematic reviews) on 6 May 2020 to retrieve existing systematic reviews relevant to this review, so that we could scan their reference lists for additional trials. The Specialised Register also includes searches of Commonwealth Agricultural Bureau (CAB) Abstracts & Global Health, CINAHL (Cumulative Index to Nursing and Allied Health Literature), ProQuest Dissertations & Theses, and Web of Science.
-
We searched the Database of Abstracts of Reviews of Effects (DARE) on 22 May 2020 for related reviews.
-
We checked the bibliographies of included studies and any relevant systematic reviews identified for further references to relevant trials.
-
Where necessary, we contacted authors of key papers and abstracts to request additional information about their trials.
Data collection and analysis
Selection of studies
The two review authors independently selected the studies for evaluation by analysing titles and abstracts identified from the databases searched. We itemised the selection criteria in a customised checklist, which we used to select studies and exclude irrelevant reports. We retrieved the full text of potentially relevant reports for evaluation, and linked multiple reports of the same study under one study ID.
Data extraction and management
We created a data collection and abstraction form, and trained ourselves to use it. We performed a pilot test using 336 abstracts retrieved for the first version of this review. If a study was reported in more than one publication, we used only one data collection form for that study.
We encountered no disagreements about which studies to include in the review.
Assessment of risk of bias in included studies
Both review authors used the Cochrane 'Risk of bias' tool to assess the risk of bias in included studies (Higgins 2011). We evaluated the following items: randomisation; allocation concealment; blinding; incomplete outcome data reporting; selective reporting; and other biases (e.g. industry sponsorship).
Measures of treatment effect
For pooled continuous variables, we presented BP data (clinic‐measured and 24‐hour ambulatory systolic and diastolic BP) and serum UA as mean differences (MDs) with a 95% confidence interval (CI). For the dichotomous variable (adverse events), we presented the data as a risk ratio (RR) with a 95% CI.
Unit of analysis issues
All included trials used an intention‐to‐treat analysis, including all randomised participants.
For cross‐over trials that met the inclusion criteria, we aimed to use the first parallel‐group period in the analysis, whenever possible.
Dealing with missing data
We contacted Dr Daniel Feig, contact author of two included trials (Feig 2008; Soletsky 2012), requesting standard deviations for all changes in BP (clinical and 24‐hour ambulatory), and data from the first parallel‐group period in the cross‐over trial (Feig 2008). As we did not obtain the requested data, we used Review Manager (RevMan 5) software to calculate the standard deviations from the CIs (Review Manager 2014). For the same reason, we combined the data from both periods of Feig 2008 in our analysis, using the generic inverse variance method.
Assessment of heterogeneity
We calculated the heterogeneity of treatment effects between the trials in RevMan 5, using a standard Chi² test and the I² statistic. According to the Cochrane Handbook for Systematic Reviews of Interventions (Higgins 2011), we used these thresholds to interpret the I²: 0% to 40% might not be important; 30% to 60% may represent moderate heterogeneity; 50% to 90% may represent substantial heterogeneity; 75% to 100% indicates considerable heterogeneity.
Assessment of reporting biases
There were no unpublished trials with complete reporting to be included in the analysis.
Data synthesis
We carried out statistical analysis according to the guidelines referenced in the Cochrane Handbook for Systematic Reviews of Interventions (Higgins 2011). We conducted data synthesis and analysis using RevMan 5 software. Where studies were sufficiently similar in terms of inclusion criteria, interventions and/or outcomes, we pooled the data using meta‐analysis. We anticipated at least moderate heterogeneity among trials given different age groups of participants, UA‐lowering drugs and trial duration. For 24‐hour ambulatory and clinic‐measured BP, we used a random‐effects model to obtain summary statistics for estimates of effect given the substantial heterogeneity among trials (I² > 50%). For serum UA and adverse events, we used fixed‐effect model as the heterogeneity among trials were respectively moderate and not important.
Subgroup analysis and investigation of heterogeneity
We had planned to conduct subgroup analysis for adolescents and for different UA‐lowering drugs (e.g. allopurinol vs. placebo; febuxostat vs. placebo; and probenecid vs. placebo). We performed subgroup analysis for the outcome change in 24‐hour ambulatory systolic and diastolic BP in adolescents. For the outcome change in clinic‐measured systolic and diastolic BP, data was only available in adolescents. There were too few studies to perform subgroup analysis for different UA‐lowering drugs.
Sensitivity analysis
We were unable to perform sensitivity analysis in this review due to lack of data.
Summary of findings and assessment of the certainty of the evidence
Both review authors assessed the overall certainty of the evidence for each outcome, using the GRADE approach, as recommended in the Cochrane Handbook for Systematic Reviews of Interventions (Higgins 2011). The certainty of the evidence on a specific outcome is based on the assessment of the studies against the following criteria: study design and limitations (risk of bias of a study); directness; consistency; precision of results; and publication bias. The overall GRADE rating starts at high when RCTs with a low risk of bias provide results for the outcome, and it is reduced by one level for each of the following criteria not met.
-
High‐certainty evidence: at least 75% of RCTs present no limitations of study design, consistency, directness, and precision of the result. There are no known or suspected publication biases. Further research is unlikely to change the estimate or the confidence in the results.
-
Moderate‐certainty evidence: one of the domains is not met. Further research is likely to have an important impact on the confidence in the estimate of effect, and may change the estimate.
-
Low‐certainty evidence: two of the domains are not met. Further research is very likely to have an important impact on our confidence in the estimate of effect, and is likely to change the estimate.
-
Very low‐certainty evidence: three of the domains are not met. We are very uncertain about the results.
-
No evidence: No RCTs were identified that addressed this outcome.
For assessments of the overall certainty of evidence for each outcome that included pooled data from RCTs only, we downgraded the evidence from ’high certainty’ by one level for serious (or by two for very serious) study limitations (risk of bias), indirectness of evidence, serious inconsistency, imprecision of effect estimates, or potential publication bias. We did not assess the evidence for any outcomes as moderate‐ or high‐certainty, since no pooled estimates revealed a large magnitude of effect.
We used GRADEpro GDT software to import data from RevMan 5 and create a 'Summary of findings’ table (GRADEpro GDT; Higgins 2011). This table provides outcome‐specific information concerning the overall certainty of evidence from studies included in the comparison, the magnitude of effect of the interventions examined, and the sum of available data for the outcomes evaluated. We included the following outcomes in the 'Summary of findings' table: 24‐hour systolic BP; 24‐hour diastolic BP; clinic‐measured systolic BP; clinic‐measured diastolic BP; serum UA; and withdrawals due to adverse effects (summary of findings Table 1).
Results
Description of studies
Results of the search
In this second update, we screened 722 records and selected 26 full‐text articles for evaluation. Following review of the full‐text reports, we included three studies; identified six studies that are awaiting classification; and excluded 23 studies. Please see Figure 1, which illustrates our study selection process.
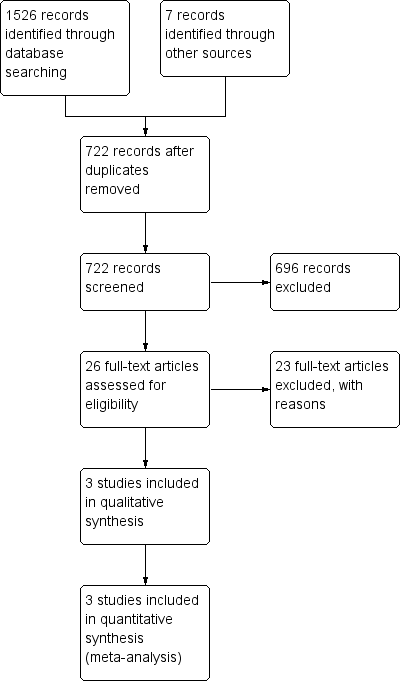
Flow diagram of the study selection
Included studies
See also Characteristics of included studies.
We included three randomised studies (211 participants); two were double‐blind, placebo‐controlled, parallel trials (Gunawardhana 2017; Soletsky 2012), and one was a randomised cross‐over trial (Feig 2008). Compared with the previous version of this review (Gois 2017), we added published data from Gunawardhana 2017 to the meta‐analysis.
Feig 2008 and Soletsky 2012 included a total of 90 adolescents (aged 11 to 17 years); Gunawardhana 2017 included 121 adults (aged ≥ 18 years). Feig 2008 and Gunawardhana 2017 recruited participants with hypertension, whilst Soletsky 2012 recruited pre‐hypertensive individuals. In all three trials included in the meta‐analysis, participants met the definition criteria for hyperuricaemia. UA‐lowering agents varied among included studies. Participants received allopurinol in Feig 2008 and Soletsky 2012, whereas febuxostat was the UA‐lowering drug used in Gunawardhana 2017. Soletsky 2012 investigated an additional group of individuals who were treated with probenecid. Feig 2008, Soletsky 2012 and Gunawardhana 2017 treated participants for four, eight and six weeks respectively. All three trials were placebo‐controlled. Feig 2008 and Soletsky 2012 reported as primary and secondary outcomes, respectively change in clinic‐measured and 24‐hour ambulatory BP (systolic and diastolic). Gunawardhana 2017 evaluated changes in 24‐hour ambulatory systolic BP (primary outcome) and 24‐hour ambulatory diastolic BP (secondary outcome).
Excluded studies
Twenty‐three studies did not meet the inclusion criteria for qualitative and quantitative data synthesis. Twelve studies did not have a placebo control group, six studies had major concerns in the study design and five studies included non‐hypertensive or normouricaemic participants. See Characteristics of excluded studies for details.
Studies awaiting classification
Six studies are awaiting classification (Eguchi 2015; Gaffo 2019; O`Connor 2014; Omrani 2014; Pendon‐Ruiz De Mier 2018; Yuan 2013). See Characteristics of studies awaiting classification for details.
Risk of bias in included studies
See Characteristics of included studies for details, Figure 2 for the review authors’ judgements about each risk of bias for each included study, and Figure 3 for each risk of bias item presented as percentages across all included studies.

Risk of bias summary: review authors' judgements about each risk of bias item for each included study

Risk of bias graph: review authors' judgements about each risk of bias item presented as percentages across all included studies
Allocation
Feig 2008 and Soletsky 2012 described the method of randomisation using a random numbers table; allocation concealment was assured by pharmacy‐controlled randomisation. Gunawardhana 2017 carried out randomisation and allocation concealment by interactive voice response system. We considered all studies to be at low risk of bias for this domain.
Blinding
In Feig 2008 and Soletsky 2012, the principal investigator and study staff were blinded to the interventions and to serum UA levels. Drugs were prepared in identical and unmarked capsules at a central pharmacy. We considered these to be at low risk of bias for blinding.
In Gunawardhana 2017, medication was dispensed and managed via interactive voice response system. Authors did not report whether the study drug and placebo had similar presentation forms, therefore, this study was considered at unclear risk of bias for blinding.
Incomplete outcome data
Missing outcome data was balanced across intervention groups in all included studies. Similar reasons for missing data across groups were reported in all the included studies. We considered all studies to be at low risk of bias for this domain.
Selective reporting
Prespecified primary and secondary outcomes were described in the results of all included studies, hence they were considered low risk of bias for selective reporting.
Other potential sources of bias
In Feig 2008 and Soletsky 2012, we did not identify any other potential source of bias.
Although Gunawardhana 2017 was funded by the pharmaceutical industry, published and unpublished data of this 'negative' trial were available. We considered this study at low risk for other potential sources of bias.
Effects of interventions
See: Summary of findings 1 Uric acid‐lowering drug compared to placebo for people with hyperuricaemia
See: summary of findings Table 1
Primary outcomes
Change in blood pressure (24‐hour ambulatory systolic, 24‐hour ambulatory diastolic, or both; clinic‐measured systolic, clinic‐measured diastolic, or both)
All three included RCTs reported two of the primary outcomes (24‐hour ambulatory systolic and 24‐hour ambulatory diastolic BP). Two of the studies also reported clinic‐measured systolic and diastolic BP in adolescents (Feig 2008; Soletsky 2012).
Low‐quality evidence from three RCTs showed inconclusive results between those who received UA‐lowering drugs and placebo, for 24‐hour ambulatory systolic (mean difference (MD) ‐6.19 mmHg, 95% confidence interval (CI) ‐12.82 to 0.45; 229 participants' data; I² = 91%; Analysis 1.1), and 24‐hour ambulatory diastolic BP (MD ‐3.92 mmHg, 95% CI ‐9.19 to 1.36; 229 participants' data; I² = 94%; Analysis 1.2).
Low‐quality evidence from two RCTs showed that UA‐lowering drugs reduced clinic‐measured systolic BP (MD ‐8.43 mmHg, 95% CI ‐15.24 to ‐1.62; I² = 91%; 120 adolescents' data; Analysis 1.3), but results were inconclusive between groups for clinic‐measured diastolic BP (MD ‐6.45 mmHg, 95% CI ‐13.60 to 0.70; I² = 94%; 120 adolescents' data; Analysis 1.4).
If we consider only the population of adolescents with prehypertension or newly diagnosed stage 1 hypertension, low‐quality evidence from two RCTs showed that UA‐lowering drugs reduced 24‐hour ambulatory systolic (MD ‐9.43 mmHg, 95% CI ‐13.12 to ‐5.74; 120 adolescents' data; I² = 57%; Analysis 1.7) and 24‐hour ambulatory diastolic BP (MD ‐6.30, 95% CI ‐9.91 to ‐2.69; 120 adolescents' data; I² = 80%; Analysis 1.8).
Heterogeneity was considerable between trials for all I² > 90%, except for the analysis on the two trials of adolescents for the outcome 24‐hour ambulatory systolic and diastolic BP.
Secondary outcomes
All three included studies reported the secondary outcomes (change in serum UA levels and adverse events).
Change in serum uric acid levels
High‐quality evidence from three RCTs showed that serum UA levels were reduced by a MD of 3.09 mg/dL (95% CI ‐3.76 to ‐2.43; 223 participants' data; I² = 45%; Analysis 1.5) in the participants who received UA‐lowering drugs. There was moderate heterogeneity between trials.
Adverse events
Low‐certainty evidence from three RCTs (241 participants' data) found inconclusive results regarding the occurrence of adverse events between those who received UA‐lowering drugs and placebo (RR 1.86, 95% CI 0.43 to 8.10; Analysis 1.6). Although rare, UA‐lowering therapy, in particular allopurinol, can be associated with serious side effects (e.g. fatal Stevens‐Johnson syndrome and interstitial nephritis). Soletsky 2012 reported a number of cutaneous adverse reactions, accounting for 5% of the participants treated with allopurinol.
Discussion
Summary of main results
We identified three completed randomised controlled trials (RCT), including 211 participants. Two of the trials were parallel‐group trials; one was a cross‐over trial. Our objective was to assess whether UA‐lowering agents reduced BP in people with primary hypertension or prehypertension, compared with placebo.
Low‐quality evidence from three trials (229 participants' data) showed inconclusive results between those receiving UA‐lowering agents and placebo, for 24‐hour ambulatory systolic and diastolic BP. Low‐quality evidence from two trials (120 participants' data), conducted in the same institution, and comprising a population of adolescents with prehypertension or newly diagnosed stage 1 hypertension, found that UA‐lowering drugs significantly reduced 24‐hour ambulatory systolic and diastolic BP, and clinic‐measured systolic BP, but results for clinic‐measured diastolic BP were inconclusive.
These results should be interpreted cautiously.
High‐quality evidence from three RCTs (223 participants' data) showed that serum UA levels were reduced in those who received UA‐lowering drugs.
Low‐quality evidence from three RCTs (241 participants' data) suggested that adverse events were neither increased nor decreased with UA‐lowering drugs.
The main findings of this review are summarised in summary of findings Table 1.
Overall completeness and applicability of evidence
We found very limited data on pharmacotherapy for hyperuricaemia in people with hypertension. Because we included only three trials, we were unable to assess publication bias. It is possible that small RCTs, assessing the BP‐lowering effect of hyperuricaemic drugs might have been completed, and were not submitted or rejected for publication because of negative results. Of note, five out of six studies awaiting classification are reported to be completed, but were not published.
Soletsky 2012 addressed the question of whether UA could be a mediator of hypertension, rather than an associated marker, by including in the study a group of participants receiving probenecid (N = 19 adolescents). Probenecid is a UA‐lowering drug that acts by inhibiting the renal excretion of organic acids, consequently reducing UA tubular reabsorption and promoting uricosuria. It has no effect on the xanthine oxidase enzyme; hence, probenecid exerts no direct influence on oxidative stress. Since probenecid and allopurinol showed similar BP‐lowering effect in this study, the authors suggested that UA may be involved in the pathogenesis of hypertension, as a biochemical mediator. However, further studies are needed in order to validate this hypothesis.
Quality of the evidence
The included studies were well‐conducted RCTs but had some limitations: small sample sizes; exclusion of people with more severe hypertension; short duration of treatment, that was not sufficient to detect adverse events associated with allopurinol, or to evaluate whether the effect on BP is sustained after long‐term therapy; and two studies, conducted in adolescents with either prehypertension or mild, newly diagnosed hypertension, lacked external validation.
We explored statistical heterogeneity using the I² statistic. We found high heterogeneity for the primary outcomes (change in BP), and moderate heterogeneity for the secondary outcome (change in serum UA). This suggests that in situations in which a non‐statistically significant result was found, it could still have been influenced by heterogeneity.
Overall, we found low‐certainty evidence that drug therapy for hyperuricaemia reduces blood pressure. The main limiting factor was the inconsistency and imprecision of results across the small number of included studies. There was a low certainty of the evidence for adverse events (withdrawals due to side effects). The key reasons for this were issues with study design, small number of events, incomplete reporting, and high heterogeneity.
In summary, due to the low‐certainty evidence supporting our main outcomes, it is uncertain whether UA‐lowering therapy reduces BP in people with hyperuricaemia.
Potential biases in the review process
We performed this systematic review and meta‐analyses as recommended in the Cochrane Handbook for Systematic Reviews of Interventions (Higgins 2011). We followed our peer reviewed and prepublished protocol with predefined participants, interventions, comparisons, and outcomes to avoid biases in the review preparation (Gois 2013a). We amended the study protocol, broadening the range of inclusion criteria.
Initially, we aimed to use the first parallel‐group period of a cross‐over trial in the meta‐analysis. Feig 2008 did not provide data from the first parallel‐group period of their cross‐over trial, therefore, we included participants' data from two periods in the meta‐analysis, meaning that the same individuals provided different data for both allopurinol and placebo groups at two different time points. This explains the different numbers of participants and participants' data for each of the outcomes. The main potential source bias of including the two trial periods is the carry‐over effect of the intervention during the placebo phase of the trial. Nevertheless, it was unlikely to have happened in Feig 2008's trial as no difference between BP readings was observed at the beginning of each phase.
We performed a comprehensive and extensive literature search in a variety of sources, for both published and unpublished reports that met our predefined inclusion criteria. We extracted all available data, and based our meta‐analyses on the intention‐to‐treat principle. Although we contacted several experts in the field, and pharmaceutical companies, our search might have missed unpublished reports, including trials with negative results. This bias remains difficult to avoid.
Agreements and disagreements with other studies or reviews
Agarwal 2013 published a systematic review in which the meta‐analysis included data from heterogeneous studies, and those with poor methodological quality (not included in the analysis in our previously published Cochrane Review Gois 2013a)). They concluded that allopurinol and other xanthine oxidase inhibitors may be used as adjunctive therapy to antihypertensive agents. In a letter to the editor (Allopurinol on hypertension: insufficient evidence to recommend), we communicated our concerns about how clinicians could misinterpret the conclusion of this meta‐analysis and the possible implications of incautious prescription of allopurinol (Gois 2013).

Flow diagram of the study selection

Risk of bias summary: review authors' judgements about each risk of bias item for each included study

Risk of bias graph: review authors' judgements about each risk of bias item presented as percentages across all included studies

Comparison 1: Uric acid (UA)‐lowering drug vs placebo, Outcome 1: 24‐h ambulatory systolic blood pressure

Comparison 1: Uric acid (UA)‐lowering drug vs placebo, Outcome 2: 24‐h ambulatory diastolic blood pressure

Comparison 1: Uric acid (UA)‐lowering drug vs placebo, Outcome 3: Clinic‐measured systolic blood pressure

Comparison 1: Uric acid (UA)‐lowering drug vs placebo, Outcome 4: Clinic‐measured diastolic blood pressure

Comparison 1: Uric acid (UA)‐lowering drug vs placebo, Outcome 5: Serum uric acid

Comparison 1: Uric acid (UA)‐lowering drug vs placebo, Outcome 6: Adverse events

Comparison 1: Uric acid (UA)‐lowering drug vs placebo, Outcome 7: 24‐h ambulatory systolic blood pressure in adolescents (subgroup analysis)

Comparison 1: Uric acid (UA)‐lowering drug vs placebo, Outcome 8: 24‐h ambulatory diastolic blood pressure in adolescents (subgroup analysis)
| Uric acid‐lowering drug compared to placebo for hyperuricaemia in people with hypertension | ||||||
|---|---|---|---|---|---|---|
| Patient or population: hyperuricaemia in people with hypertension | ||||||
| Outcomes | Anticipated absolute effects* (95% CI) | Relative effect | № of participants | Certainty of the evidence | Comments | |
| Matched placebo | Risk difference with UA‐lowering drug | |||||
| 24‐h ambulatory systolic BP | The mean change in BP across control groups ranged from: ‐3.4 to 1.9 mmHg | MD was 6.19 mmHg lower (12.82 lower to 0.45 higher) | ‐ | 229 participants' data | ⊕⊕⊝⊝ | |
| 24‐h ambulatory diastolic BP | The mean change in BP across control groups ranged from: ‐2.7 to 1.3 mmHg | MD was 3.92 mmHg lower (9.19 lower to 1.36 higher) | ‐ | 229 participants' data | ⊕⊕⊝⊝ | |
| Clinic‐measured systolic BP | The mean change in BP across control groups ranged from: ‐2 to 1.7 mmHg | MD was 8.43 mmHg lower (15.24 lower to 1.62 lower) | ‐ | 120 participants' data | ⊕⊕⊝⊝ | |
| Clinic‐measured diastolic BP | The mean change in BP across control groups ranged from: ‐2.4 to 1.6 mmHg | MD was 6.45 mmHg lower (13.6 lower to 0.7 higher) | ‐ | 120 participants' data | ⊕⊕⊝⊝ | |
| Serum UA | The mean change in serum UA across control groups ranged from: ‐0.3 to 0.2 mg/dL | MD was 3.09 mg/dL lower (3.76 lower to 2.43 lower) | ‐ | 223 participants' data | ⊕⊕⊕⊕ | |
| Adverse events (withdrawals due to side effects) | 18 per 1000 | 34 per 1000 | RR 1.86 | 241 participants' data | ⊕⊕⊝⊝ | |
| *The risk in the intervention group (and its 95% confidence interval) is based on the assumed risk in the comparison group and the relative effect of the intervention (and its 95% CI). | ||||||
| GRADE Working Group grades of evidence | ||||||
| aDowngraded for wide CIs | ||||||
| Outcome or subgroup title | No. of studies | No. of participants | Statistical method | Effect size |
| 1.1 24‐h ambulatory systolic blood pressure Show forest plot | 3 | Mean Difference (IV, Random, 95% CI) | ‐6.19 [‐12.82, 0.45] | |
| 1.2 24‐h ambulatory diastolic blood pressure Show forest plot | 3 | Mean Difference (IV, Random, 95% CI) | ‐3.92 [‐9.19, 1.36] | |
| 1.3 Clinic‐measured systolic blood pressure Show forest plot | 2 | Mean Difference (IV, Random, 95% CI) | ‐8.43 [‐15.24, ‐1.62] | |
| 1.4 Clinic‐measured diastolic blood pressure Show forest plot | 2 | Mean Difference (IV, Random, 95% CI) | ‐6.45 [‐13.60, 0.70] | |
| 1.5 Serum uric acid Show forest plot | 3 | Mean Difference (IV, Fixed, 95% CI) | ‐3.20 [‐3.60, ‐2.80] | |
| 1.6 Adverse events Show forest plot | 3 | Risk Ratio (IV, Fixed, 95% CI) | Subtotals only | |
| 1.7 24‐h ambulatory systolic blood pressure in adolescents (subgroup analysis) Show forest plot | 2 | Mean Difference (IV, Random, 95% CI) | ‐9.43 [‐13.12, ‐5.74] | |
| 1.8 24‐h ambulatory diastolic blood pressure in adolescents (subgroup analysis) Show forest plot | 2 | Mean Difference (IV, Random, 95% CI) | ‐6.30 [‐9.91, ‐2.69] | |