Pharmacotherapy for hyperuricaemia in hypertensive patients
Information
- DOI:
- https://doi.org/10.1002/14651858.CD008652.pub4Copy DOI

- Database:
-
- Cochrane Database of Systematic Reviews
- Version published:
-
- 02 September 2020see what's new
- Type:
-
- Intervention
- Stage:
-
- Review
- Cochrane Editorial Group:
-
Cochrane Hypertension Group
- Copyright:
-
- Copyright © 2020 The Cochrane Collaboration. Published by John Wiley & Sons, Ltd.
Article metrics
Altmetric:
Cited by:
Authors
Contributions of authors
| Drafting the protocol | Pedro Gois and Edison Souza |
| Obtaining copies of studies | Pedro Gois |
| Selecting which studies to include | Pedro Gois and Edison Souza |
| Extracting data from studies | Pedro Gois and Edison Souza |
| Entering data into RevMan 5 | Pedro Gois |
| Carrying out the analysis | Pedro Gois |
| Interpreting the analysis | Pedro Gois and Edison Souza |
| Drafting the final review | Pedro Gois |
| Updating the review | Pedro Gois |
Declarations of interest
Gois P: nothing to declare
Souza E: nothing to declare
Acknowledgements
This protocol of this systematic review was based on a work undertaken as part of the postgraduate course in Evidence‐Based Health, which was organized by Sírio‐Libanês Hospital‐Sao Paulo, Brazil. We are sincerely grateful to the Cochrane Hypertension Review Group (especially to Mr Douglas M Salzwedel for the valuable contribution with the search strategies, Mr Ciprian Jauca, and Dr James M Wright for their inestimable assistance).
Version history
| Published | Title | Stage | Authors | Version |
| 2020 Sep 02 | Pharmacotherapy for hyperuricaemia in hypertensive patients | Review | Pedro Henrique França Gois, Edison Regio de Moraes Souza | |
| 2017 Apr 13 | Pharmacotherapy for hyperuricemia in hypertensive patients | Review | Pedro Henrique França Gois, Edison Regio de Moraes Souza | |
| 2013 Jan 31 | Pharmacotherapy for hyperuricemia in hypertensive patients | Review | Pedro Henrique França Gois, Edison Regio de Moraes Souza | |
| 2010 Aug 04 | Pharmacotherapy for hyperuricemia in hypertensive patients | Protocol | Pedro Henrique França Gois, Edison Regio de Moraes Souza, Carolina Urbini dos Santos | |
Differences between protocol and review
The affiliation and contact information for the review contact person changed. We amended the study protocol to allow the inclusion of studies involving people with prehypertension. Due to lack of data, we were unable to perform sensitivity analyses in this update. Due to insufficient data, subgroup analysis with different UA‐lowering drugs vs. placebo was not performed. Data on clinic‐measured BP was only available for adolescents with prehypertension or newly diagnosed stage 1 hypertension. GRADE was incorporated in the review update to assess the certainty of evidence.
Keywords
MeSH
Medical Subject Headings (MeSH) Keywords
- Allopurinol [*therapeutic use];
- Blood Pressure [drug effects];
- Hypertension [complications, *drug therapy];
- Hyperuricemia [complications, *drug therapy];
- Patient Dropouts [statistics & numerical data];
- Placebos [therapeutic use];
- Prehypertension [drug therapy];
- Randomized Controlled Trials as Topic;
- Uricosuric Agents [*therapeutic use];
Medical Subject Headings Check Words
Adolescent; Adult; Child; Humans;
PICOs
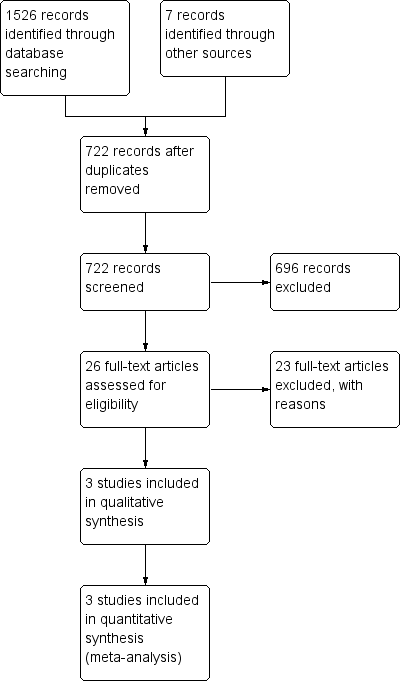
Flow diagram of the study selection

Risk of bias summary: review authors' judgements about each risk of bias item for each included study

Risk of bias graph: review authors' judgements about each risk of bias item presented as percentages across all included studies

Comparison 1: Uric acid (UA)‐lowering drug vs placebo, Outcome 1: 24‐h ambulatory systolic blood pressure

Comparison 1: Uric acid (UA)‐lowering drug vs placebo, Outcome 2: 24‐h ambulatory diastolic blood pressure

Comparison 1: Uric acid (UA)‐lowering drug vs placebo, Outcome 3: Clinic‐measured systolic blood pressure

Comparison 1: Uric acid (UA)‐lowering drug vs placebo, Outcome 4: Clinic‐measured diastolic blood pressure

Comparison 1: Uric acid (UA)‐lowering drug vs placebo, Outcome 5: Serum uric acid

Comparison 1: Uric acid (UA)‐lowering drug vs placebo, Outcome 6: Adverse events

Comparison 1: Uric acid (UA)‐lowering drug vs placebo, Outcome 7: 24‐h ambulatory systolic blood pressure in adolescents (subgroup analysis)

Comparison 1: Uric acid (UA)‐lowering drug vs placebo, Outcome 8: 24‐h ambulatory diastolic blood pressure in adolescents (subgroup analysis)
| Uric acid‐lowering drug compared to placebo for hyperuricaemia in people with hypertension | ||||||
|---|---|---|---|---|---|---|
| Patient or population: hyperuricaemia in people with hypertension | ||||||
| Outcomes | Anticipated absolute effects* (95% CI) | Relative effect | № of participants | Certainty of the evidence | Comments | |
| Matched placebo | Risk difference with UA‐lowering drug | |||||
| 24‐h ambulatory systolic BP | The mean change in BP across control groups ranged from: ‐3.4 to 1.9 mmHg | MD was 6.19 mmHg lower (12.82 lower to 0.45 higher) | ‐ | 229 participants' data | ⊕⊕⊝⊝ | |
| 24‐h ambulatory diastolic BP | The mean change in BP across control groups ranged from: ‐2.7 to 1.3 mmHg | MD was 3.92 mmHg lower (9.19 lower to 1.36 higher) | ‐ | 229 participants' data | ⊕⊕⊝⊝ | |
| Clinic‐measured systolic BP | The mean change in BP across control groups ranged from: ‐2 to 1.7 mmHg | MD was 8.43 mmHg lower (15.24 lower to 1.62 lower) | ‐ | 120 participants' data | ⊕⊕⊝⊝ | |
| Clinic‐measured diastolic BP | The mean change in BP across control groups ranged from: ‐2.4 to 1.6 mmHg | MD was 6.45 mmHg lower (13.6 lower to 0.7 higher) | ‐ | 120 participants' data | ⊕⊕⊝⊝ | |
| Serum UA | The mean change in serum UA across control groups ranged from: ‐0.3 to 0.2 mg/dL | MD was 3.09 mg/dL lower (3.76 lower to 2.43 lower) | ‐ | 223 participants' data | ⊕⊕⊕⊕ | |
| Adverse events (withdrawals due to side effects) | 18 per 1000 | 34 per 1000 | RR 1.86 | 241 participants' data | ⊕⊕⊝⊝ | |
| *The risk in the intervention group (and its 95% confidence interval) is based on the assumed risk in the comparison group and the relative effect of the intervention (and its 95% CI). | ||||||
| GRADE Working Group grades of evidence | ||||||
| aDowngraded for wide CIs | ||||||
| Outcome or subgroup title | No. of studies | No. of participants | Statistical method | Effect size |
| 1.1 24‐h ambulatory systolic blood pressure Show forest plot | 3 | Mean Difference (IV, Random, 95% CI) | ‐6.19 [‐12.82, 0.45] | |
| 1.2 24‐h ambulatory diastolic blood pressure Show forest plot | 3 | Mean Difference (IV, Random, 95% CI) | ‐3.92 [‐9.19, 1.36] | |
| 1.3 Clinic‐measured systolic blood pressure Show forest plot | 2 | Mean Difference (IV, Random, 95% CI) | ‐8.43 [‐15.24, ‐1.62] | |
| 1.4 Clinic‐measured diastolic blood pressure Show forest plot | 2 | Mean Difference (IV, Random, 95% CI) | ‐6.45 [‐13.60, 0.70] | |
| 1.5 Serum uric acid Show forest plot | 3 | Mean Difference (IV, Fixed, 95% CI) | ‐3.20 [‐3.60, ‐2.80] | |
| 1.6 Adverse events Show forest plot | 3 | Risk Ratio (IV, Fixed, 95% CI) | Subtotals only | |
| 1.7 24‐h ambulatory systolic blood pressure in adolescents (subgroup analysis) Show forest plot | 2 | Mean Difference (IV, Random, 95% CI) | ‐9.43 [‐13.12, ‐5.74] | |
| 1.8 24‐h ambulatory diastolic blood pressure in adolescents (subgroup analysis) Show forest plot | 2 | Mean Difference (IV, Random, 95% CI) | ‐6.30 [‐9.91, ‐2.69] | |