Farmacoterapia para la hiperuricemia en pacientes con hipertensión
Resumen
Antecedentes
La hipertensión arterial representa un problema importante de salud pública. A nivel mundial, cerca de un 25% de la población adulta presenta hipertensión. Los estudios epidemiológicos y experimentales indican una conexión entre la hiperuricemia y la hipertensión. La hiperuricemia afecta entre el 25% y el 40% de los pacientes con hipertensión sin tratar; se ha informado una prevalencia mucho menor en personas normotensas o en la población en general. Sin embargo, sigue sin responderse la pregunta de si la disminución del ácido úrico sérico (AUS) podría reducir la presión arterial (PA).
Objetivos
Determinar si los agentes hipouricemiantes reducen la PA en los pacientes con hipertensión primaria o prehipertensión en comparación con un placebo.
Métodos de búsqueda
El especialista en información del Grupo Cochrane de Hipertensión (Cochrane Hypertension Group) buscó ensayos controlados aleatorios en las siguientes bases de datos hasta febrero de 2016: Se hicieron búsquedas en el registro especializado del Grupo Cochrane de Hipertensión (Cochrane Hypertension Specialised Register), Registro Cochrane Central de Ensayos Controlados (Cochrane Central Register of Controlled Trials) (CENTRAL) (2016, número 2), MEDLINE (desde 1946), Embase (desde 1974), en la World Health Organization International Clinical Trials Registry Platform, y en ClinicalTrials.gov. También se realizaron búsquedas en LILACS hasta marzo de 2016 y se estableció contacto con autores de artículos relevantes sobre trabajos publicados y no publicados.
Criterios de selección
Para incluirlos en la revisión los estudios debían cumplir los siguientes criterios: 1) aleatorios o cuasialeatorios con un grupo asignado a un agentes hipouricemiante y otro grupo asignado a recibir placebo; 2) doble ciego, simple ciego o abierto; 3) ensayo paralelo o cruzado; 4) los ensayos cruzados debían tener un período de lavado de al menos dos semanas; 5) duración mínima del tratamiento de cuatro semanas; 6) los participantes debían tener un diagnóstico de hipertensión esencial o prehipertensión e hiperuricemia (AUS mayor que 6 mg/dl en mujeres, 7 mg/dl en hombres y 5,5 mg/dl en niños/adolescentes); 7) las medidas de resultado evaluadas incluían el cambio en la PA ambulatoria de 24 horas, diastólica o sistólica medida en el consultorio.
Obtención y análisis de los datos
Los dos autores de la revisión, de forma independiente, recopilaron los datos utilizando un formulario de extracción de datos, y se resolvió cualquier desacuerdo mediante discusión. Se evaluó el riesgo de sesgo mediante la herramienta Cochrane " Riesgo de sesgo".
Resultados principales
En esta actualización de la revisión, se examinaron los resúmenes de 349 trabajos identificados y se seleccionaron 21 para su evaluación. También se identificaron tres estudios en curso, cuyos resultados aún no están disponibles. Otros tres ensayos controlados aleatorios (ECA) (dos nuevos), que incorporaron pacientes con hipertensión o prehipertensión e hiperuricemia, cumplieron los criterios de inclusión para la revisión y se incluyeron en el metanálisis. La evidencia de baja calidad de tres ECA no indican ninguna reducción de la PA ambulatoria de 24 horas sistólica (DM ‐6,2 mmHg; IC del 95%: ‐12,8 a 0,5) o diastólica (‐3,9 mmHg; IC del 95%: ‐9,2 a 1,4) con los fármacos hipouricemiantes en comparación con placebo. La evidencia de baja calidad de dos ECA revelan una reducción de la PA sistólica medida en el consultorio (‐8,43 mmHg; IC del 95%: ‐15,24 a ‐1,62) pero no de la diastólica (‐6,45 mmHg; IC del 95%: ‐13,60 a 0,70). La evidencia de alta calidad de tres ECA indica que la uricemia se redujo en 3,1 mg/dl (IC del 95%: 2,4 a 3,8) en los pacientes que recibieron fármacos hipouricemiantes. La evidencia de muy baja calidad de tres ECA indica que los retiros debidos a los efectos adversos no aumentaron con el tratamiento hipouricemiante (CR 1,86; IC del 95%: 0,43 a 8,10).
Conclusiones de los autores
En esta revisión sistemática actualizada, los datos de ECA disponibles en la actualidad son insuficientes para determinar si el tratamiento hipouricemiante también reduce la PA. Se necesitan más estudios.
PICOs
Resumen en términos sencillos
Farmacoterapia para el tratamiento de la hiperuricemia en pacientes con hipertensión
Antecedentes
El ácido úrico es el producto final natural que resulta de la desintegración de los tejidos corporales y de los alimentos, particularmente las proteínas. Habitualmente, el ácido úrico es eliminado de la sangre por el riñón y excretado en la orina. Sin embargo, si se produce demasiado ácido úrico o el riñón no es capaz de eliminarlo como de costumbre, aumentan los niveles del ácido en sangre (hiperuricemia). Desde el siglo XIX se ha establecido una conexión entre la hiperuricemia y la hipertensión (un importante problema de salud a nivel mundial). En la actualidad, hay más evidencia de que esta asociación es importante. El objetivo de esta revisión fue evaluar si la reducción de los niveles de ácido úrico en sangre también podía disminuir la presión arterial. Este enfoque podría representar un nuevo objetivo y opción terapéutica para los pacientes con hipertensión.
Características de los estudios
En esta actualización de una revisión anterior, se examinaron los resúmenes de 349 referencias, y se seleccionaron 21 para su evaluación. Sólo tres estudios fueron adecuados para la inclusión, dos de los cuales no se habían identificado en una revisión anterior sobre este tema. Los estudios de esta revisión procedían de los Estados Unidos; y evaluaron adolescentes y adultos. El objetivo de estos estudios fue comparar la farmacoterapia para disminuir el ácido úrico con un control de placebo en pacientes con diagnóstico de hipertensión.
Lo que dice la investigación
Se halló que los fármacos hipouricemiantes no llevaron a una reducción significativa de la presión arterial en los pacientes con niveles altos de ácido úrico en sangre e hipertensión en comparación con un placebo. La farmacoterapia fue superior al placebo para reducir los niveles sanguíneos de ácido úrico. No aumentaron los retiros por los efectos secundarios con la farmacoterapia; sin embargo, en un estudio, un paciente se retiró debido a una reacción cutánea grave.
Por lo tanto, la evidencia no es suficiente para demostrar que la administración de fármacos hipouricemiantes reduce la presión arterial en los pacientes con hipertensión. Se necesita más investigación sobre este tema. Debido a que sólo tres estudios fueron apropiados para su inclusión, no es posible tener la seguridad de que los estudios futuros no cambiarán estas conclusiones.
Calidad de la evidencia
En términos generales, hubo evidencia de baja calidad que no pudo establecer si la farmacoterapia para tratar los niveles altos de ácido úrico reduce la presión arterial. Los estudios incluidos en esta revisión no presentaron resultados similares entre los estudios para este resultado. Además, se halló evidencia de alta calidad de que los fármacos hipouricemiantes reducen el ácido úrico. Finalmente, hubo evidencia de muy baja calidad que no pudo establecer si la farmacoterapia aumentó los retiros debidos a los efectos secundarios. Las razones principales de lo anterior fueron: problemas en el diseño del estudio, la falta de datos y los resultados no similares entre los estudios.
Authors' conclusions
Summary of findings
| Uric acid (UA)‐lowering drug compared to placebo for hyperuricemia in hypertensive patients | ||||||
| Patient or population: hyperuricemia in hypertensive patients | ||||||
| Outcomes | Anticipated absolute effects* (95% CI) | Relative effect | № of participants | Quality of the evidence | Comments | |
| Risk with placebo | Risk with Uric acid (UA) lowering drug | |||||
| 24h‐Systolic Blood Pressure | ‐ | MD 6.19 lower | MD ‐6.2 (‐12.8, 0.5) | 229 | ⊕⊕⊝⊝ | |
| 24h‐Diastolic Blood Pressure | ‐ | MD 3.92 lower | MD ‐3.9 (‐9.2, 1.4) | 229 | ⊕⊕⊝⊝ | |
| Clinic Systolic Blood Pressure | ‐ | MD 8.43 lower | MD ‐8.4 (‐15.2, ‐1.6) | 120 | ⊕⊕⊝⊝ | |
| Clinic Diastolic Blood Pressure | ‐ | MD 6.45 lower | MD ‐6.5 (‐13.6, 0.7) | 120 | ⊕⊕⊝⊝ | |
| Serum uric acid | ‐ | MD 3.09 lower | MD ‐3.1 (‐3.8, ‐2.4) | 223 | ⊕⊕⊕⊕ | |
| Withdrawals due to adverse effects | 18 per 1,000 | 34 per 1,000 | RR 1.86 | 241 | ⊕⊝⊝⊝ | NCT01496469 reported only one withdrawal due to adverse events. However, four adverse events were described in the febuxostat group, which might be drug‐related. Therefore, we decided to include all four cases in the assessment of RR for this study. |
| *The risk in the intervention group (and its 95% confidence interval) is based on the assumed risk in the comparison group and the relative effect of the intervention (and its 95% CI). | ||||||
| GRADE Working Group grades of evidence | ||||||
| 1 Downgraded for wide CIs 2 Downgraded for high unexplained heterogeneity 3 Downgraded for small number of events and incomplete reporting 4 Unclear randomisation processes in the largest trial (highest weight in meta‐analysis) | ||||||
Background
Uric acid (UA) is the final breakdown product derived from purine metabolism. Urate oxidase (uricase) is the enzyme responsible for converting UA into allantoin, which is soluble and can be easily excreted by the kidneys. During human evolution, several cumulative mutations on the uricase gene have resulted in a non‐functional gene. Thus, the lack of uricase in humans leads to the potential development of hyperuricemia and its complications (Kasper 2004; Poon 2009; Sachs 2009).
Hyperuricemia can be defined as a serum uric acid (UA) concentration greater than 6 mg/dL in women, 7 mg/dL in men, and 5.5 mg/dL in children/adolescents, and can result from increased UA production, reduced excretion or both (Kasper 2004).
The relationship between hyperuricemia and hypertension is not a recent observation. In fact, its first mention was in a paper published in 1879 by Frederick Akbar Mohamed, who noticed that some hypertensive individuals came from gouty families (Feig 2006). Since the Framingham Heart Study, numerous epidemiological studies have demonstrated an association between hyperuricemia and hypertension. Several of them, including large prospective studies, have found serum UA to independently predict the development of hypertension (Alper 2005; Hunt 1991; Ouppatham 2008; Perlstein 2006; Sundström 2005; Taniguchi 2001).
Therefore, a new question has emerged and remains unanswered: whether lowering serum UA might lower blood pressure (BP) or impact the natural history of essential hypertension (Feig 2006; Johnson 2005; Trachtman 2007).
Description of the condition
According to the Seventh Report of the Joint National Committee (JNC) on Prevention, Detection, Evaluation and Treatment of High Blood Pressure, hypertension is defined as systolic BP > 140 mmHg and/or diastolic BP ≥ 90 mmHg (Chobanian 2003). A diagnosis is made when the average of two or more measurements during at least two subsequent doctor visits reaches these values. The burden of hypertension‐related cardiovascular risk and mortality is well established. High BP increases the risk for a coronary heart attack, congestive heart failure, stroke and renal disease (Carretero 2000; Chobanian 2003).
Hypertension represents a major public health problem. Worldwide, approximately one‐fourth of the adult population has hypertension and the prevalence is expected to increase to 29% by 2025 (Kearney 2005). Furthermore, only a minority of hypertensive individuals achieves optimal BP control and 30% of these patients are unaware of their disease (Germino 2009; Mittal 2010; Williams 2010).
Hyperuricemia affects 25% to 40% of individuals with untreated hypertension; a much lower prevalence has been reported in normotensives or in the general population. Strikingly, essential hypertension was found in 89% of children with a serum UA level of 5.5 mg/dL or higher (Feig 2008; Cannon 1966; Kinsey 1961).
Description of the intervention
The agents to lower serum UA can be divided into two distinct categories of drugs:
-
xanthine‐oxidase inhibitors (allopurinol and febuxostat);
-
uricosuric agents (benzbromarone, benziodarone, probenecid, sulfinpyrazone, ethebencid, zoxazolamine and ticrynafen).
Treatment with one of these drugs is recommended for individuals with a history of recurring gouty attacks. Their use in asymptomatic hyperuricemia is controversial and non‐consensual.
How the intervention might work
Inquiry into the possible link between hyperuricemia and hypertension has led to experimental studies in laboratory animals. Raising serum UA in rats caused a reduction in endothelial nitric oxide levels and overactivation of the renin‐angiotensin system, which explained the UA‐mediated arteriolopathy and interstitial inflammation observed in the kidneys (Mazzali 2002). In humans, studies have postulated that high serum UA is related to impaired endothelial function (de A Coutinho 2007; Feig 2008). Thus far, evidence from animal studies suggested that the involvement of UA in the pathogenesis of hypertension could occur in two‐phases (Mazzali 2002). First, high UA leads to the activation of the renin‐angiotensin system, increased oxidative stress and endothelial dysfunction (with reduced levels of nitric oxide). These changes have been associated with increased systemic BP and vascular resistance. During this initial phase, it is proposed that BP rises independently of a low‐salt diet and could be treated by UA‐lowering agents. The second phase is marked by renal microvascular disease (mostly involving the afferent arterioles) associated with tubulointerstitial inflammation, resulting in salt‐sensitive hypertension, which is not responsive to UA‐lowering therapy (Mazzali 2002). If these experimental observations could be translated to humans, it is possible that pharmacotherapy for hyperuricemia could be effective especially in the early stages of hypertension.
If there is a causal link between UA and hypertension, UA‐lowering drugs might have antihypertensive properties. Whether hyperuricemia is a modifiable risk factor for the development and control of hypertension is a matter of debate. The JNC, a recognized authority in hypertension issues, does not recognize hyperuricemia as a risk factor. This might be due to the uncertainty as to whether hyperuricemia has a causal role in the development of hypertension or is secondary to a reduction in renal function.
Why it is important to do this review
The aim of this systematic review was to determine whether or not the treatment of hyperuricemia also lowers BP in individuals with hypertension or impacts the natural history of essential hypertension. The findings could support a novel indication for UA‐lowering agents, independent of issues directly relating to hyperuricemia or its complications.
Objectives
To determine whether UA‐lowering agents reduce BP in patients with primary hypertension or prehypertension compared with placebo.
Methods
Criteria for considering studies for this review
Types of studies
We included published and non‐published clinical trials involving randomized or quasi‐randomized (double‐blind, single‐blind or open‐label) allocation of a UA‐lowering agent or placebo, and parallel as well as cross‐over studies (with an adequate washout period of at least two weeks before cross‐over).
To be included in this review a minimum duration of four weeks of treatment with a UA‐lowering agent was necessary.
We did not include cluster randomised trials in this review.
Types of participants
Participants of any gender, age or ethnicity, with primary hypertension or prehypertension, plus hyperuricemia. We defined primary hypertension as a systolic BP ≥ 140 mmHg and/or diastolic BP ≥ 90 mmHg; prehypertension as systolic BP 120 to 139 mmHg or diastolic BP 80 to 89 mmHg, in adults, and as average systolic or diastolic BP levels ≥ 90th and < 95th percentile or odds ratio ≥ 120/80 mmHg, in children (PEDIATRICS 2004); and hyperuricemia as serum UA greater than 6 mg/dL in women, 7 mg/dL in men and 5.5 mg/dL in children/adolescents. In comparison to the previous version of this review (Gois 2013a), we expanded the inclusion criteria to cover studies enrolling individuals with prehypertension.
Types of interventions
UA‐lowering agents: either a xanthine‐oxidase inhibitor (allopurinol, febuxostat or a pharmaceutically acceptable salt thereof) or an uricosuric agent (benzbromarone, benziodarone, probenecid, sulfinpyrazone, ethebencid, zoxazolamine or a pharmaceutically acceptable salt thereof). We excluded ticrynafen, a uricosuric agent, because of its known direct effect on blood pressure.
Comparison: placebo.
Types of outcome measures
Primary outcomes
Change in clinic or 24‐hour ambulatory, systolic and/or diastolic BP.
Secondary outcomes
Change in UA levels.
Adverse effects: mortality, nonfatal serious adverse events, cardiovascular events (defined as stroke, myocardial infarction, heart failure) and withdrawals due to adverse events.
Search methods for identification of studies
Electronic searches
The Cochrane Hypertension Information Specialist conducted systematic searches in the following databases for randomised controlled trials without language, publication year or publication status restrictions:
-
the Cochrane Hypertension Specialised Register via the Cochrane Register of Studies (CRS‐Web) (searched 22 February 2016);
-
the Cochrane Central Register of Controlled Trials (CENTRAL; 2016, Issue 2) via the Cochrane Register of Studies (CRS‐Web) (searched 22 February 2016);
-
MEDLINE Ovid (from 1946 onwards) and MEDLINE Ovid In‐Process & Other Non‐Indexed Citations (searched 22 February 2016);
-
Embase Ovid (searched 22 February 2016);
-
ClinicalTrials.gov (www.clinicaltrials.gov) searched 22 February 2016).
To supplement the results provided by the information specialist, we searched LILACS on 14 March 2016.
The Hypertension Group Specialised Register includes controlled trials from searches of CAB Abstracts & Global Health, CINAHL, CENTRAL, Embase, LILACS, MEDLINE, ProQuest Dissertations & Theses, PsycINFO, Web of Science and the World Health Organization (WHO) International Clinical Trials Registry Platform.
The Information Specialist modelled subject strategies for databases on the search strategy designed for MEDLINE. Where appropriate, they were combined with subject strategy adaptations of the highly sensitive search strategy designed by Cochrane for identifying randomised controlled (as described in the Cochrane Handbook for Systematic Reviews of Interventions Version 5.1.0, Box 6.4.b. (Handbook 2011)). Search strategies for major databases are provided in Appendix 1.
Searching other resources
-
The Cochrane Hypertension Information Specialist searched the Hypertension Specialised Register segment (which includes searches of MEDLINE for systematic reviews) to retrieve existing systematic reviews relevant to this systematic review, so that we could scan their reference lists for additional trials.
-
We searched the Database of Abstracts of Reviews of Effects (DARE) for related reviews.
-
We checked the bibliographies of included studies and any relevant systematic reviews identified for further references to relevant trials.
-
Where necessary, we contacted authors of key papers and abstracts to request additional information about their trials.
-
We did not perform a separate search for adverse effects of interventions used for the treatment of hypertension. We considered adverse effects described in included studies only.
Data collection and analysis
Selection of studies
The two review authors independently selected the studies for evaluation by analysing titles and abstracts from the databases searched. We itemized selection criteria in a customized checklist, which was used by the reviewers to select the studies and exclude irrelevant reports. We retrieved the full text of potentially relevant reports selected for evaluation and linked multiple reports of the same study together.
Data extraction and management
We created a data collection and abstraction form, and trained ourselves to use it. We performed a pilot test using a representative sample of the review studies identified. If a study was reported in more than one publication, we used only one data collection form for that study.
We encountered no disagreements about the selection of studies to be included in the review.
Assessment of risk of bias in included studies
Both review authors used the Cochrane Collaboration's 'Risk of bias' tool to assess study quality and risk of bias (Higgins 2011). We evaluated the following items: randomization; allocation concealment; blinding; incomplete outcome data reporting; selective reporting; and other biases (e.g. industry sponsorship).
Measures of treatment effect
As continuous variables combined in the meta‐analysis, we present BP data (clinic and 24‐hour ambulatory systolic and diastolic) and serum UA as mean differences (MDs) with a 95% confidence intervals (CIs). For dichotomous variable ("withdrawal due to adverse events"), we present the data as risk ratio (RR) with a 95% CI.
Unit of analysis issues
All included trials used an intention‐to‐treat analysis for all randomized patients.
For cross‐over trials that met the inclusion criteria, we aimed to used the first parallel‐group period in the analysis whenever possible.
Dealing with missing data
We contacted Dr Daniel Feig (contact author of two included trials ‐ Feig 2008; Soletsky 2012) for additional data, requesting standard deviations for all the changes in BP (clinic and 24‐hour ambulatory) and data from the first parallel‐group period in the cross‐over trial (Feig 2008). As we did not obtain the requested data, we used the Cochrane Review Manager Software (RevMan 5.3) to calculate the standard deviations from the CIs in this review update. For the same reason, we combined the data from both periods of the Feig 2008 cross‐over trial in our analysis, using generic inverse variance.
Assessment of heterogeneity
We calculated the heterogeneity of treatment effects between the trials using a standard Chi2 test and the I2 statistic in RevMan 5.3. According to the Cochrane Handbook for Systematic Reviews of Interventions (Higgins 2011), the following thresholds for the interpretation of I2 were used: 0% to 40%: might not be important; 30% to 60%: may represent moderate heterogeneity; 50% to 90%: may represent substantial heterogeneity; 75% to 100%: considerable heterogeneity.
Assessment of reporting biases
We identified one unpublished trial with complete reporting, which we included in our analysis (NCT01496469). Although we did not have access to data from the study, the contact author provided the study conclusions.
Data synthesis
We carried out statistical analysis according to the guidelines referenced in the newest version of the Cochrane Handbook for Systematic Reviews of Interventions (Higgins 2011). We employed a random‐effects model to obtain summary statistics for estimates of effect. We conducted data synthesis and analysis using RevMan 5.3. We present data for changes in clinic BP (systolic and diastolic), 24‐hour BP (systolic and diastolic) and serum UA as MDs. For the outcome withdrawals due to adverse effects, we present data as RR.
Subgroup analysis and investigation of heterogeneity
We were unable to perform subgroup analyses in this review due to lack of data.
Sensitivity analysis
We were unable to perform sensitivity analysis in this review due to lack of data.
GRADE and Summary of findings table
Both reviewers assessed the overall quality of the evidence for each outcome using the GRADE approach, as recommended in the Cochrane Handbook for Systematic Reviews of Interventions (Higgins 2011).The quality of the evidence on a specific outcome is based on the performance of the studies against the following criteria: study design and limitations (risk of bias of a study); directness; consistency; precision of results; and publication bias. The overall GRADE quality rating starts at high when RCTs with a low risk of bias provide results for the outcome, and it is reduced by one level for each of the criteria not met as outlined below.
-
High‐quality evidence: at least 75% of RCTs present no limitations of study design, consistency, directness and precision of the result. Additionally, there are no known or suspected publication biases. Further research is unlikely to change the estimate or the confidence in the results.
-
Moderate‐quality evidence: One of the domains is not met. Further research is likely to have an important impact on the confidence in the estimate of effect and may change the estimate.
-
Low‐quality evidence: Two of the domains are not met. Further research is very likely to have an important impact on our confidence in the estimate of effect and is likely to change the estimate.
-
Very low‐quality evidence: Three of the domains are not met. We are very uncertain about the results.
-
No evidence: No RCTs were identified that addressed this outcome.
For assessments of the overall quality of evidence for each outcome that included pooled data from RCTs only, we downgraded the evidence from ’high quality’ by one level for serious (or by two for very serious) study limitations (risk of bias), indirectness of evidence, serious inconsistency, imprecision of effect estimates or potential publication bias. None were upgraded to moderate or high quality since no pooled estimates revealed a large magnitude of effect, negligible concerns about confounders or a strong dose‐response gradient.
We used the Gradepro software to import data from RevMan 5.3 and create a 'Summary of findings’ table. This table provides outcome‐specific information concerning the overall quality of evidence from studies included in the comparison, the magnitude of effect of the interventions examined, and the sum of available data on the outcomes evaluated. The following outcomes were included in the 'Summary of findings' table: 24‐hour systolic BP; 24‐hour diastolic BP; clinic systolic BP; clinic diastolic BP; serum UA; and withdrawals due to adverse effects.
Results
Description of studies
For details, please see: Characteristics of included studies, Characteristics of excluded studies and Characteristics of ongoing studies.
Results of the search
In this review update, we examined the abstracts of 349 identified papers and selected 21 for evaluation. We characterized the studied population as: hypertensive and hyperuricemic (10 studies: Assadi 2014; Feig 2004; Feig 2008; Jalalzadeh 2012; Peixoto 2001; Pour‐Pouneh 2015; Schakis 2004; NCT01496469; Tani 2015; Whelton 2011); hypertensive or normotensive and hyperuricemic (four studies: Hosoya 2014; Kanbay 2007; Sezai 2013; Siu 2006); hypertensive or normotensive and normouricemic (one study: Higgins 2014); hypertensive and hyperuricemic or normouricemic (two studies: Kostka‐Jeziorny 2011; Segal 2015); normotensive and hyperuricemic (two studies: Kanbay 2011; Kim 2014); prehypertensive and hyperuricemic (one study: Soletsky 2012); and prehypertensive and normouricemic (one study: Madero 2015). Three studies (enrolling hypertensive or prehypertensive and hyperuricemic patients: Feig 2008; Soletsky 2012; NCT01496469) met the inclusion criteria for the review and both review authors rated these independently. Compared with the previous version of this review (Gois 2013a), we included two new studies. One additional study with 'negative' results (not favouring UA‐lowering therapy) was identified in supplementary searches (O`Connor 2014); however, the author provided only the study conclusions. We encountered no disagreements in the study selection. We also identified three ongoing studies, the results of which are not yet available. (Characteristics of ongoing studies), and excluded 19 studies (Characteristics of excluded studies). We provide a flow diagram illustrating the study selection process in Figure 1.
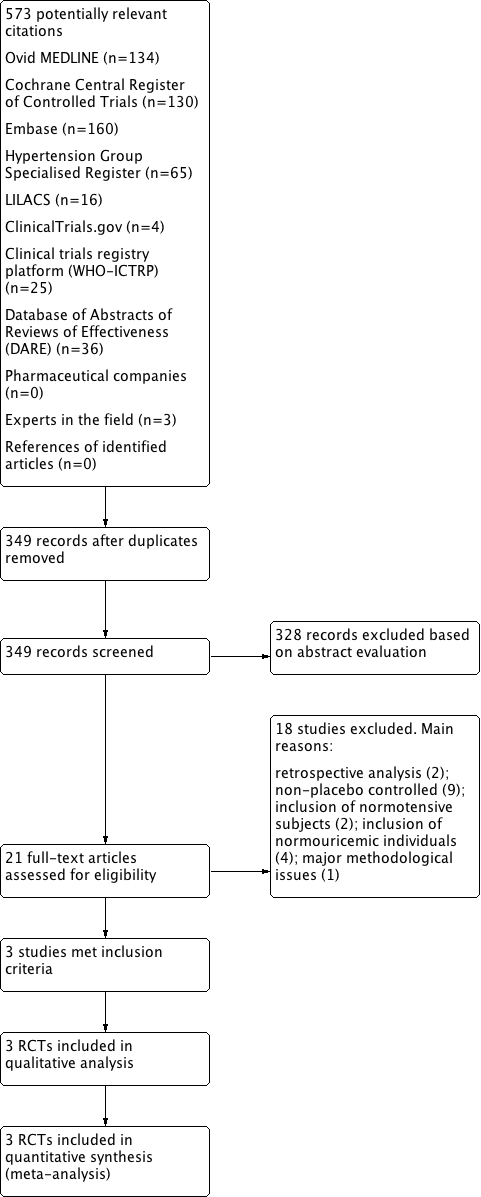
Flow diagram of the study selection
Included studies
See also Characteristics of included studies
This well‐designed double‐blind, placebo‐controlled, cross‐over trial randomized 30 adolescents (aged 11 to 17 years), newly diagnosed with stage I primary hypertension and with serum UA ≥ 6 mg/dL, to receive allopurinol 200 mg twice daily for four weeks and placebo for four weeks, with a two‐week washout period between treatments. No participants dropped out of the study. The exclusion criteria were: stage II hypertension or known renal, cardiovascular, gastrointestinal tract, hepatic or endocrine disease. Primary and secondary outcomes were, respectively, change in clinic and/or 24‐hour ambulatory BP (systolic or diastolic). BP was measured three to seven days before initiation of any medication and on the last day of each of the medication phases.
This double‐blind, placebo‐controlled, parallel trial randomized 60 adolescents (aged 11 to 17 years) with prehypertension and serum UA ≥ 5 mg/dL to receive either allopurinol, probenecid or placebo for eight weeks. In the first week, allopurinol was given as 100 mg twice daily, while probenecid was administered as 250 mg twice daily. In the following seven weeks the drug dose was doubled. Participants randomized to the placebo group received the same number of placebo capsules as those in the treatment groups. A four‐week washout period was included after the treatment phase. The exclusion criteria were: stage 1 or 2 hypertension, renal dysfunction, abnormal serum transaminases or alteration in the complete blood count. Fifty‐six participants completed the follow‐up phase. Primary outcome was change in clinic BP and the secondary outcomes included 24‐hour ambulatory BP monitoring. Clinic BP was measured on the day of treatment initiation and at four other time points until the end of the study. Twenty‐four hour ambulatory BP monitoring was performed before the end of the treatment phase. One participant withdrew during the treatment phase in the allopurinol group (severe hypersensitivity reaction).
This was a multicenter (29 sites in the USA), double‐blind, placebo‐controlled, parallel trial. One‐hundred and twenty‐one adults (aged ≥ 18 years) with hypertension and serum UA ≥ 7 mg/dL were randomized to receive either febuxostat (80 mg daily) or placebo for six weeks. The exclusion criteria included: secondary hypertension, severe hypertension (systolic BP > 165 mmHg or diastolic BP > 105 mmHg), heart failure, gout, secondary hyperuricemia, renal dysfunction (estimated glomerular filtration rate (GFR) < 30 mL/min/1.73 m2) and abnormal serum transaminases. One hundred and nine participants were include in the analysis. Data at baseline were well balanced between groups. Primary outcome was change in systolic 24‐hour ambulatory BP and the secondary outcomes were change in diastolic 24‐hour ambulatory BP and change from baseline serum UA. Twenty‐four hour ambulatory BP monitoring was performed at the end of the treatment phase and compared with baseline values.
Excluded studies
See also Characteristics of excluded studies.
This was a small, open‐label, non‐placebo controlled trial that aimed to evaluate the combination of allopurinol with enalapril, in comparison to enalapril alone, to treat hypertensive adolescents with hyperuricemia (UA ≥ 5.5 mg/dL). Fifty‐two adolescents (aged 12 to 19 years) with newly diagnosed and untreated stage 1 hypertension were randomised to receive either allopurinol 5 mg/kg/day divided in two doses (n = 24) or enalapril 0.15 mg/kg daily (n = 28) for eight weeks. Seven participants, including four from the allopurinol plus enalapril group, were excluded due to poor compliance. Clinic BP was measured weekly until week eight of the study. Adolescents treated with the combination of allopurinol and enalapril exhibited lower systolic and diastolic BP levels when compared to those receiving enalapril monotherapy. There were no adverse effects observed during the study, which might be explained by the small number of participants. Random sequence generation was not informed.
This small, open, non‐placebo controlled pilot study explored the hypothesis that UA is related to the pathogenesis of early‐onset essential hypertension. Five adolescents with newly diagnosed essential hypertension were enrolled to receive allopurinol 200 mg twice daily for four weeks followed by a washout period. Primary outcomes were change in clinic and 24‐hour ambulatory BP (systolic or diastolic).
In this double‐blind study, 80 adults with history of ischemic stroke or transient ischemic attack in the past year were randomly assigned to receive allopurinol (300 mg/day) or placebo for 12 months. The primary endpoint was change in carotid intima‐media thickness. BP measurement using a semi‐automated sphygmomanometer was a secondary outcome. Mean serum UA level among the participants was 5.2 mg/dL. Only 34 of 80 participants had hypertension, and the distribution of those with hypertension was not balanced between the two study groups. The classes of antihypertensive drugs differed among groups, and adherence to antihypertensive agents was not evaluated. Only individuals in the allopurinol group demonstrated a significant reduction in systolic BP.
This multicenter, randomized, placebo‐controlled trial evaluated the efficacy of topiroxostat (a xanthine‐oxidase inhibitor) in hyperuricemic individuals with stage 3 chronic kidney disease. Primary outcome was change in renal function and the secondary outcomes included change in BP. At baseline, mean systolic and diastolic BP were below 136 and 85 mmHg in both groups, respectively. After 22 weeks of treatment, serum UA levels were reduced in the topiroxostat group but there were no significant changes in renal function or BP between groups. We attempted to contact the authors with regard to the prevalence of individuals with a diagnosis of hypertension and for further detailed information about BP measurement but were unsuccessful.
A single‐blind, randomized, non‐placebo controlled, cross‐over trial enrolling 55 individuals undergoing hemodialysis who had hypertension and hyperuricemia. Participants received allopurinol 100 mg/day or continued the treatment prescribed prior to the study for three months. The two groups were then crossed over after a 3‐month washout period. Fifty‐three participants completed the study and were included in the primary analysis. BP (primary outcome) was measured by a nurse before and after hemodialysis using a mercury sphygmomanometer. The authors showed that treatment with allopurinol decreased systolic and diastolic BP before and after dialysis. The mean duration of dialysis was 36.21 ± 35.6 months (minimum 1 month). In individuals undergoing hemodialysis, a condition (termed 'lag phenomenon') has been described, whereby BP reduction lags behind a reduction in volume status for weeks to months. The presence of the 'lag phenomenon' may have biased the BP control in the study participants (Jindal 2006). Furthermore, mean KT/V (used to quantify dialysis adequacy, where K = dialyzer clearance of urea, T = dialysis time and V = volume of distribution of urea) was 0.98 ± 0.25, below the target recommended by the US National Kidney Foundation, which is ≥ 1.3 (KDOQI 2006).
This open, non‐randomised, non‐placebo controlled, parallel trial enrolled 48 individuals (of whom 36 were hypertensive) to receive allopurinol 300 mg daily for 12 weeks. Twenty‐one healthy individuals were used as a control group. Participants were adults with hyperuricemia (UA > 7 mg/dL) and GFR > 60 mL/min/1.73 m2. Clinic BP was measured at baseline and 16 weeks after intervention. Statistically significant decreases in systolic and diastolic BP were seen in the treatment group compared with the control group.
This open, non‐placebo controlled, parallel trial randomised 72 individuals to receive either allopurinol 300 mg daily (n = 32) for four months or no treatment (n = 40) (control group). Participants were adults with hyperuricemia (UA > 7 mg/dL) and normal BP levels. An additional control group of normouricemic and normotensive individuals was also followed. Exclusion criteria were the presence of diabetes, hypertension, heart failure, gout or overt cardiovascular disease. Primary outcomes included change in 24‐hour ambulatory BP measurement (systolic and diastolic). All participants underwent a 24‐hour ambulatory BP assessment at baseline and 16 weeks after intervention. Treatment with allopurinol for 16 weeks resulted in a significant reduction in serum UA and in systolic, but not in diastolic, BP.
This was a post‐hoc analysis of a phase III, randomized, double‐blind, placebo‐controlled trial designed to evaluate the safety and efficacy of febuxostat versus allopurinol. One hundred and seventy‐nine gouty men were randomized to receive allopurinol (300 mg/day), febuxostat (40, 80 or 120 mg/day) or placebo for four weeks. Study participants showed normal BP levels. After adjustments, a reduction in serum UA, independent of the medication used, was not associated with changes in BP.
The aim of this study was to explore the effects of allopurinol on BP and aortic compliance in individuals with mild/moderate arterial hypertension. Sixty‐six people with stage I and II arterial hypertension were randomly assigned to receive perindopril (n = 35) or hydrochlorothiazide (n = 35) for eight weeks, and allopurinol 150 mg daily for eight weeks thereafter. There was no control group in this open, randomized trial. Only 16.8% of the studied individuals were hyperuricemic. Primary outcomes included changes in clinic and 24‐hour ambulatory BP (systolic and diastolic). In this trial, allopurinol did not show any additional effect on reducing BP in hypertensive patients.
This was a randomized, placebo‐controlled, two‐stage pilot study. In the first phase (dietary counselling), adults were randomised to the following dietary regimens for four weeks: 1) low sodium diet; or 2) low sodium and low fructose diet. In the second phase, participants were further randomized to allopurinol (300 mg/day) or placebo for four weeks, maintaining the same diet allocations. Inclusion criteria included: overweight or obese patients with systolic BP between 120 and 140 mmHg and diastolic BP between 80 and 90 mmHg. Primary outcome was reduction in clinic BP (systolic and diastolic) and secondary outcomes included 24‐hour ambulatory BP monitoring. Thirty‐eight participants from the 'low sodium diet' group were randomized to receive either allopurinol (n = 22) or placebo (n = 16), whilst 34 from the 'low sodium and low fructose diet' group received either allopurinol (n = 14) or placebo (n = 20). At the end of the first phase of the study, both groups had similar reductions in clinic BP. Post‐hoc analysis, regardless of group allocation, revealed that individuals treated with allopurinol showed a lower clinic BP. One major confounding factor of this analysis was a potential carry‐over effect of the 'low fructose diet' in the second phase of the study. Since the paper reported only the combined results of treatment, we contacted the main author for further information. Dr Madero kindly provided the data for the groups separately, showing no difference in BP levels between groups. Study participants showed normal serum UA levels.
This was a single‐center, phase 4, double‐blind, placebo‐controlled trial that randomized prehypertensive adults with serum UA ≥5 mg/dL to receive febuxostat 80 mg/day orally or placebo for 8 weeks. Outcomes included change in 24‐hour BP and change in pulse wave velocity. The author responded to our contact, providing the following information: "In this study, we tested the hypothesis that lowering uric acid would also result in a fall in blood pressure. The hypothesis was tested in subjects with prehypertension. Subjects were randomised to either active drug (febuxostat) or placebo. The study was double‐blind. 47 subjects began treatment, and 37 completed treatment. 10 subjects decided not to complete the study because of inconvenience (they did not wish to drive back to the follow up visit). However, telephone calls to the 10 who did not complete all visits indicated no complaints about the study drug or procedures. Data analyses indicated that, contrary to expectation, febuxostat did not lower blood pressure. Measurements of plasma uric acid showed a fall in subjects taking febuxostat, indicating that the drug was achieving the expected biochemical and pharmacological action."
This open, non‐randomized, non‐placebo controlled, parallel trial assigned 60 individuals with hypertension and hyperuricemia to receive low purine diet recommendations (n = 18), low purine diet recommendations and allopurinol (n = 18) and allopurinol alone (n = 18) for 12 weeks. There was no control group for any of the interventions. Criteria used to define hypertension were not described. Participants showed serum UA levels ≥ 8.5 mg/dL (men) and ≥ 7.5 mg/dL (women). Clinic BP was measured at baseline and 6, 12, 24 and 36 weeks after intervention. The dose of allopurinol ranged from 150 to 300 mg daily, depending on UA levels after six weeks of follow‐up. In this study, a statistically significant decrease in clinic systolic BP was observed only in the group that received low purine diet recommendations only.
This randomized, double‐blind, placebo‐controlled study aimed to evaluate the effect of allopurinol (200 mg daily for two months) on BP in hypertensive and hyperuricemic patients. This study could not be included in our meta‐analysis due to several major methodological issues. First, the authors described that 50 participants were divided equally (n = 25 in each group) to receive either allopurinol or placebo; however, they did not report how many completed the study, or how many were included in the analysis (this can only be inferred). Second, the baseline characteristics of the study participants were limited to gender, sex and body mass index; important information such as comorbidities and antihypertensive drugs were not given. Imbalance between groups in baseline variables may have had a profound impact on outcomes. Third, the authors reported that there was a statistically significant difference in diastolic clinic BP between the groups at baseline. Other major sources of bias include: inclusion and exclusion criteria were not reported; randomization method and allocation concealment were not described; power and sample size estimation were not performed; and the analysis approach (i.e. intention‐to‐treat or per protocol) was unclear. Finally, the authors concluded that allopurinol had a positive effect on blood pressure in men older than 50 years, although the study was apparently underpowered for subgroup analysis.
This study consisted of a randomized, double‐blind, placebo‐controlled study of the effect of lowering serum UA with seven days of probenecid in pregnant women with pre‐eclampsia. Forty patients with pre‐eclampsia and a gestational age of 26 to 32 weeks received either probenecid 250 mg twice daily (n = 20) or placebo (n = 20) for seven days or less (if delivery occurred before). Serum UA levels were 6.3 mg/dL (3.19 to 7.33 mg/dL) in the intervention group and 6.04 mg/dL (5.04 to 10.41 mg/dL) in the control group. Although BP control was considered a primary outcome, BP values were not published. Furthermore, BP control was evaluated using the criterion 'reduction or increase in antihypertensive medication'.
This double‐blind, placebo‐controlled trial randomized African Americans (aged 18 to 65 years) with stage 1 hypertension to receive placebo or allopurinol (300 mg/day) after four weeks of run‐in treatment with chlorthalidone and potassium chloride. Exclusion criteria included any evidence of end‐organ damage. Baseline characteristics of the participants (n = 139) showed low levels of systolic BP (118.4 ± 12.4 mmHg), diastolic BP (74.7 ± 8 mmHg) and UA (6.70 ± 1.55 mg/dL). One hundred and ten participants completed all the study phases. There was no significant change in clinic BP after four weeks of therapy with allopurinol compared with placebo. However, participants already exhibited controlled BP levels before starting allopurinol or placebo.
In this singe‐blind, non‐placebo‐controlled study, 141 hyperuricemic and normotensive individuals who had undergone cardiac surgery at least one year prior to study recruitment were randomized to receive allopurinol or febuxostat for six months. Drug dose was titrated in order to achieve a serum UA level ≤ 6 mg/dL. BP measurement was considered a secondary endpoint. Participants in the febuxostat group only exhibited a slight reduction in BP levels after six months of treatment.
This open, non‐placebo controlled, parallel trial randomly assigned 54 individuals to receive allopurinol 100 to 300 mg daily (n = 25) or to continue usual therapy (n = 26) for 12 weeks. Depending on baseline renal function, a starting dose (allopurinol) of 100 mg/day (if serum creatinine < 1.7) or 200 mg/day (if serum creatinine > 1.7) was given to participants allocated to the treatment group. The dose of allopurinol was adjusted with the intention of achieving normal serum UA. The studied individuals were followed every four weeks for six months and every eight weeks thereafter for a total of 12 months. In terms of primary outcomes, although there were no changes in clinic or 24‐hour ambulatory BP, individuals in the two groups had their systolic and diastolic BP measured and compared baseline with values after 12 months. The treatment group included individuals with and without hypertension.
This open‐label, non‐placebo controlled, pilot study randomly assigned 60 hypertensive and hyperuricemic individuals to receive febuxostat (n = 30) or to continue usual therapy (n = 30) for six months. Febuxostat was started at 10 mg daily with dose adjustments in order to achieve serum UA < 6 mg/dL. This study aimed to evaluate the effects of febuxostat on the renin‐angiotensin system and renal function; however, primary and secondary outcomes were not well defined. BP was assessed monthly at the outpatient unit. It was not mentioned who performed the BP measurements. The authors published data from two time points (baseline and six months). Neither systolic nor diastolic BP showed a significant difference in either group at six months of follow‐up compared with baseline.
This was a retrospective analysis of hypertensive individuals (n = 54) enrolled in phase III randomized, double‐blind, controlled studies of febuxostat and allopurinol. Baseline clinic BP was compared with BP after 28 weeks of treatment. Participants receiving allopurinol showed significant reductions in diastolic BP whereas those treated with febuxostat exhibited lower levels of systolic and diastolic BP. This study was presented as a poster at the American Congress of Hypertension in 2011.
Risk of bias in included studies
Three studies met our inclusion criteria, two of which we assessed as at low risk of bias (Feig 2008; Soletsky 2012) and one mainly as at unclear risk of bias (NCT01496469). Takeda Pharmaceuticals, which was the sponsor of the unpublished study (NCT01496469), did not respond to our contact regarding information for the 'Risk of bias' assessments. See table Characteristics of included studies. See also Figure 2 and Figure 3, which provide review authors’ judgements about each risk of bias item presented as percentages across all included studies and about each risk of bias for each included study, respectively.

Risk of bias graph: review authors' judgements about each risk of bias item presented as percentages across all included studies.
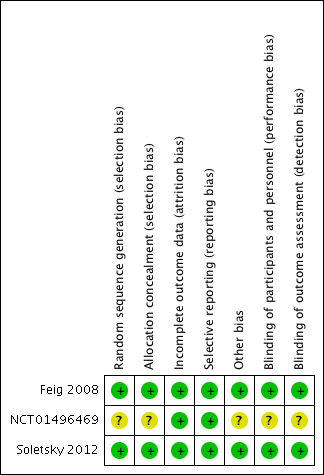
Risk of bias summary: review authors' judgements about each risk of bias item for each included study.
Allocation
Feig 2008 and Soletsky 2012 described the method of randomization using a random numbers table. Randomization was not reported by NCT01496469. Allocation concealment was assured by pharmacy‐controlled randomization in Feig 2008 and Soletsky 2012, whereas NCT01496469 provided insufficient information.
Blinding
In Feig 2008 and Soletsky 2012, the principal investigator and study staff were blinded to the interventions and to serum UA levels. Drugs were prepared in identical and unmarked capsules in a central pharmacy. In NCT01496469, insufficient information was provided.
Incomplete outcome data
Missing outcome data was balanced across intervention groups in all included studies. Similar reasons for missing data across groups were reported in all the included studies.
Selective reporting
Prespecified primary and secondary outcomes were described in the results of all included studies.
Other potential sources of bias
Although the NCT01496469 study was funded by the pharmaceutical industry, the results of this 'negative' trial were available on ClinicalTrials.gov.
Effects of interventions
See: summary of findings Table for the main comparison
All three included randomized controlled trials (RCTs) reported the primary (24‐hour systolic and diastolic BP) and the secondary outcomes (change in serum UA levels and withdrawals due to adverse events). In addition, two of the included studies reported the primary outcome of systolic and diastolic clinic BP. We also identified three ongoing studies, the results of which are not yet available.
Low quality of evidence from three RCTs indicates no reduction in systolic (MD ‐6.2 mmHg, 95% CI ‐12.8 to 0.5) or diastolic (‐3.9 mmHg, 95% CI ‐9.2 to 1.4) 24‐hour ambulatory BP with UA‐lowering drugs compared with placebo (Figure 4; Figure 5). Low quality of evidence from two RCTs reveals a reduction of systolic clinic BP (‐8.43 mmHg, 95% CI ‐15.24 to ‐1.62) but not diastolic clinic BP (‐6.45 mmHg, 95% CI ‐13.60 to 0.70) (Figure 6; Figure 7).
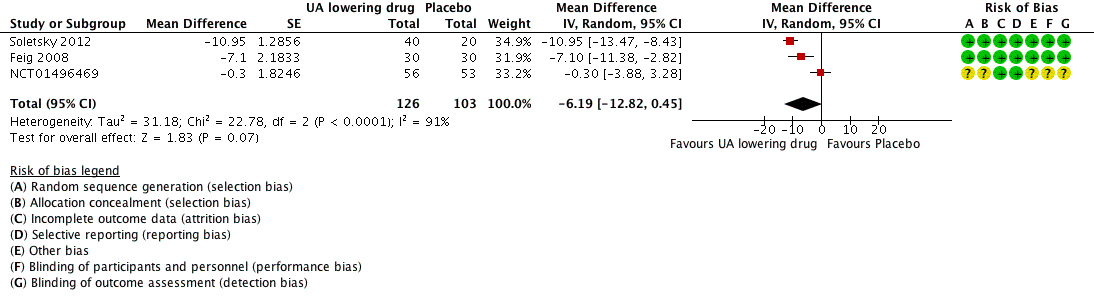
Forest plot of comparison: 1 Uric acid (UA)‐lowering drug vs. placebo, outcome: 1.1 systolic 24‐hour ambulatory blood pressure.

Forest plot of comparison: 1 Uric acid (UA)‐lowering drug vs. placebo, outcome: 1.2 diastolic 24‐hour ambulatory blood pressure.

Forest plot of comparison: 1 Uric acid (UA)‐lowering drug vs. placebo, outcome: 1.3 Clinic systolic blood pressure.

Forest plot of comparison: 1 Uric acid (UA)‐lowering drug vs. placebo, outcome: 1.4 clinic diastolic blood pressure.
If we consider only the population of adolescents with prehypertension or newly diagnosed stage 1 hypertension, low quality of evidence from two RCTs reveals a reduction of systolic clinic BP (‐8.43 mmHg, 95% CI ‐15.24 to ‐1.62), systolic (‐9.43 mmHg, 95% CI‐13.12 to ‐5.74) and diastolic (‐6.30 mmHg, 95% CI ‐9.91 to ‐2.69) 24‐hour ambulatory BP, but not of diastolic clinic BP (‐6.45 mmHg, 95% CI ‐13.60 to 0.70).
High quality of evidence from three RCTs indicates that serum UA levels were reduced by 3.1 mg/dL (95% CI 2.4 to 3.8) in the participants that received UA‐lowering drugs (Figure 8). Moreove, very low quality of evidence from three RCTs suggests that withdrawals due to adverse effects were not increased with UA‐lowering therapy (RR 1.86, 95% CI 0.43 to 8.10) (Figure 9).

Forest plot of comparison: 1 Uric acid (UA)‐lowering drug vs. placebo, outcome: 1.5 serum uric acid.

Forest plot of comparison: 1 Uric acid (UA)‐lowering drug vs placebo, outcome: 1.6 Withdrawals due to adverse effects.
Additionally, we found an I2 statistic above 90% (signifying high heterogeneity) for clinic and ambulatory BP, whereas the I2 statistic for change in serum UA levels was 45% (moderate heterogeneity).
Discussion
Summary of main results
We identified three completed RCTs including 211 participants and three ongoing trials. Two of the trials were parallel‐group trials and one study was a crossover trial. We aimed to assess whether UA‐lowering agents reduce BP in patients with primary hypertension or prehypertension compared with placebo. Pooled results indicate that UA‐lowering agents were not effective in reducing systolic and diastolic 24‐hour BP. Pooled results for clinic systolic and diastolic BP included only two trials conducted in the same institution, comprising a population of adolescents with prehypertension or newly diagnosed stage 1 hypertension, and indicate that UA‐lowering therapy significantly reduced only systolic clinic BP. If we pool the data on systolic and diastolic 24‐hour BP only for adolescents with prehypertension or newly diagnosed stage 1 hypertension, we find significant reduction in BP with drug therapy. However, these results should be interpreted cautiously because the quality of the evidence was low for all comparisons outlined above. With respect to changes in serum UA, drug therapy significantly reduced serum UA levels, and high‐quality evidence supports this. Withdrawals due to adverse effects were not increased with UA‐lowering therapy, albeit this was supported by very low quality of evidence.The main findings of this review are summarised in summary of findings Table for the main comparison.
Overall completeness and applicability of evidence
We found very limited data on pharmacotherapy for hyperuricemia in individuals with hypertension. Because we included only three trials, we were unable to assess publication bias. It is possible that small RCTs assessing the BP‐lowering effect of hyperuricemic drugs might have been performed and, because of negative results, not submitted or rejected for publication.
Soletsky 2012 addressed the question of whether UA could be a mediator of hypertension, rather than an associated marker, by including in the study a group of participants receiving probenecid (n = 19 adolescents). Probenecid is an UA‐lowering drug that acts by inhibiting the renal excretion of organic acids, consequently reducing UA tubular reabsorption and promoting uricosuria. It has no effect on the xanthine oxidase enzyme; hence, probenecid exerts no direct influence on oxidative stress. Since probenecid and allopurinol showed similar BP‐lowering effect in this study, the authors suggested that UA may be involved in the pathogenesis of hypertension as a biochemical mediator. However, further studies need to be carried out in order to validate this hypothesis.
Quality of the evidence
The included studies were well‐conducted RCTs but had a few limitations, as follows: small sample sizes; exclusion of more‐severely hypertensive individuals; short duration of treatment not sufficient to detect adverse events associated with allopurinol or to evaluate whether the effect on BP is sustained after long‐term therapy; and two studies, conducted in adolescents either with prehypertension (Soletsky 2012) or mild newly diagnosed hypertension (Feig 2008), lacked external validation.
We explored statistical heterogeneity using the I2 statistic. We found high heterogeneity for the primary outcomes and moderate heterogeneity for the secondary outcome change in serum UA. It means that in situations in which a non‐statistically significant result was shown, it could still have been influenced by heterogeneity.
Overall, there was low quality evidence that drug therapy for hyperuricemia reduces blood pressure. The main limiting factor was the inconsistency and imprecision of results across the small number of included studies. Moreover, there was a very low quality of evidence concerning the results from these studies for withdrawals due to side effects. The key reasons for this were issues with study design, small number of events, incomplete reporting and high heterogeneity. In summary, due to the low quality of the evidence for our main outcomes, the effect of UA‐lowering therapy in hyperuricemic subjects to reduce BP is uncertain.
Potential biases in the review process
We performed systematic review and meta‐analysis as recommended in the Cochrane Handbook for Systematic Reviews of Interventions (Higgins 2011). We followed our peer‐reviewed and prepublished protocol with predefined participants, interventions, comparisons, and outcomes to avoid biases in the review preparation (Gois 2013a). We amended the study protocol broadening the range of inclusion criteria. We performed a comprehensive and extensive literature search for both published and unpublished data from a variety of sources that met our predefined inclusion criteria. We extracted all available data and based our meta‐analysis on the intention‐to‐treat principle. Although we contacted several experts in the field and pharmaceutical companies, our search might have missed unpublished data including trials with negative results. This bias remains difficult to avoid. Our search was conducted in February 2016 and it is possible that more recent studies may have been published, which are not considered in our review.
Agreements and disagreements with other studies or reviews
Agarwal 2013 published a systematic review in which the meta‐analysis performed included heterogeneous studies as well as those with poor methodological quality (not included in the analysis in our previously published Cochrane Review) (Gois 2013a). They concluded that allopurinol and other xanthine oxidase inhibitors may be used as adjunctive therapy to antihypertensive agents. In a letter to the editor ("Allopurinol on hypertension: insufficient evidence to recommend"), we have communicated our concerns about how clinicians could misinterpret the conclusion of this meta‐analysis and the possible implications of incautious prescription of allopurinol (Gois 2013).
Flow diagram of the study selection
Risk of bias graph: review authors' judgements about each risk of bias item presented as percentages across all included studies.
Risk of bias summary: review authors' judgements about each risk of bias item for each included study.
Forest plot of comparison: 1 Uric acid (UA)‐lowering drug vs. placebo, outcome: 1.1 systolic 24‐hour ambulatory blood pressure.
Forest plot of comparison: 1 Uric acid (UA)‐lowering drug vs. placebo, outcome: 1.2 diastolic 24‐hour ambulatory blood pressure.
Forest plot of comparison: 1 Uric acid (UA)‐lowering drug vs. placebo, outcome: 1.3 Clinic systolic blood pressure.
Forest plot of comparison: 1 Uric acid (UA)‐lowering drug vs. placebo, outcome: 1.4 clinic diastolic blood pressure.
Forest plot of comparison: 1 Uric acid (UA)‐lowering drug vs. placebo, outcome: 1.5 serum uric acid.
Forest plot of comparison: 1 Uric acid (UA)‐lowering drug vs placebo, outcome: 1.6 Withdrawals due to adverse effects.
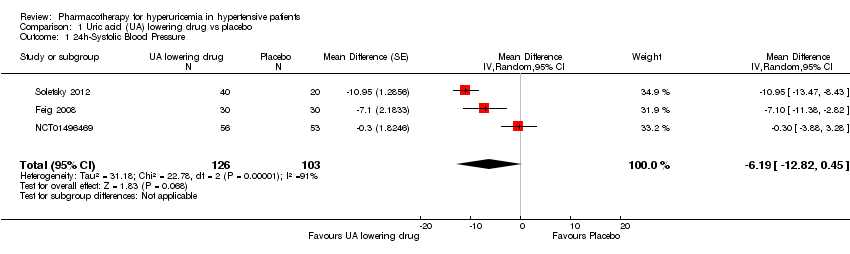
Comparison 1 Uric acid (UA) lowering drug vs placebo, Outcome 1 24h‐Systolic Blood Pressure.

Comparison 1 Uric acid (UA) lowering drug vs placebo, Outcome 2 24h‐Diastolic Blood Pressure.
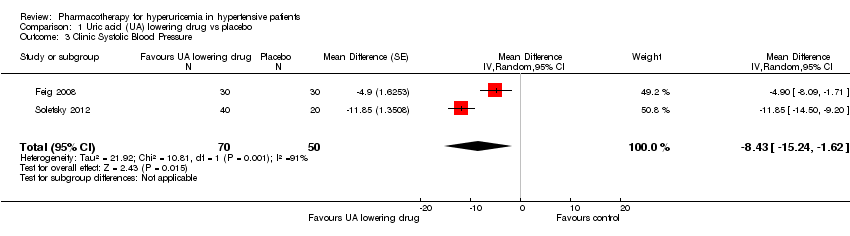
Comparison 1 Uric acid (UA) lowering drug vs placebo, Outcome 3 Clinic Systolic Blood Pressure.

Comparison 1 Uric acid (UA) lowering drug vs placebo, Outcome 4 Clinic Diastolic Blood Pressure.

Comparison 1 Uric acid (UA) lowering drug vs placebo, Outcome 5 Serum uric acid.

Comparison 1 Uric acid (UA) lowering drug vs placebo, Outcome 6 Withdrawals due to adverse effects.
| Uric acid (UA)‐lowering drug compared to placebo for hyperuricemia in hypertensive patients | ||||||
| Patient or population: hyperuricemia in hypertensive patients | ||||||
| Outcomes | Anticipated absolute effects* (95% CI) | Relative effect | № of participants | Quality of the evidence | Comments | |
| Risk with placebo | Risk with Uric acid (UA) lowering drug | |||||
| 24h‐Systolic Blood Pressure | ‐ | MD 6.19 lower | MD ‐6.2 (‐12.8, 0.5) | 229 | ⊕⊕⊝⊝ | |
| 24h‐Diastolic Blood Pressure | ‐ | MD 3.92 lower | MD ‐3.9 (‐9.2, 1.4) | 229 | ⊕⊕⊝⊝ | |
| Clinic Systolic Blood Pressure | ‐ | MD 8.43 lower | MD ‐8.4 (‐15.2, ‐1.6) | 120 | ⊕⊕⊝⊝ | |
| Clinic Diastolic Blood Pressure | ‐ | MD 6.45 lower | MD ‐6.5 (‐13.6, 0.7) | 120 | ⊕⊕⊝⊝ | |
| Serum uric acid | ‐ | MD 3.09 lower | MD ‐3.1 (‐3.8, ‐2.4) | 223 | ⊕⊕⊕⊕ | |
| Withdrawals due to adverse effects | 18 per 1,000 | 34 per 1,000 | RR 1.86 | 241 | ⊕⊝⊝⊝ | NCT01496469 reported only one withdrawal due to adverse events. However, four adverse events were described in the febuxostat group, which might be drug‐related. Therefore, we decided to include all four cases in the assessment of RR for this study. |
| *The risk in the intervention group (and its 95% confidence interval) is based on the assumed risk in the comparison group and the relative effect of the intervention (and its 95% CI). | ||||||
| GRADE Working Group grades of evidence | ||||||
| 1 Downgraded for wide CIs 2 Downgraded for high unexplained heterogeneity 3 Downgraded for small number of events and incomplete reporting 4 Unclear randomisation processes in the largest trial (highest weight in meta‐analysis) | ||||||
| Outcome or subgroup title | No. of studies | No. of participants | Statistical method | Effect size |
| 1 24h‐Systolic Blood Pressure Show forest plot | 3 | 229 | Mean Difference (Random, 95% CI) | ‐6.19 [‐12.82, 0.45] |
| 2 24h‐Diastolic Blood Pressure Show forest plot | 3 | 229 | Mean Difference (Random, 95% CI) | ‐3.92 [‐9.19, 1.36] |
| 3 Clinic Systolic Blood Pressure Show forest plot | 2 | 120 | Mean Difference (Random, 95% CI) | ‐8.43 [‐15.24, ‐1.62] |
| 4 Clinic Diastolic Blood Pressure Show forest plot | 2 | 120 | Mean Difference (Random, 95% CI) | ‐6.45 [‐13.60, 0.70] |
| 5 Serum uric acid Show forest plot | 3 | 223 | Mean Difference (Random, 95% CI) | ‐3.09 [‐3.76, ‐2.43] |
| 6 Withdrawals due to adverse effects Show forest plot | 3 | 241 | Risk Ratio (M‐H, Random, 95% CI) | 1.86 [0.43, 8.10] |