Antidepressants for the treatment of people with co‐occurring depression and alcohol dependence
Abstract
Background
Alcohol dependence is a major public health problem characterized by recidivism, and medical and psychosocial complications. The co‐occurrence of major depression in people entering treatment for alcohol dependence is common, and represents a risk factor for morbidity and mortality, which negatively influences treatment outcomes.
Objectives
To assess the benefits and risks of antidepressants for the treatment of people with co‐occurring depression and alcohol dependence.
Search methods
We searched the Cochrane Drugs and Alcohol Group Specialised Register (via CRSLive), Cochrane Central Register of Controlled Trials (CENTRAL), MEDLINE, and Embase from inception to July 2017. We also searched for ongoing and unpublished studies via ClinicalTrials.gov (www.clinicaltrials.gov) and the World Health Organization (WHO) International Clinical Trials Registry Platform (ICTRP) (apps.who.int/trialsearch/).
All searches included non‐English language literature. We handsearched references of topic‐related systematic reviews and the included studies.
Selection criteria
Randomized controlled trials and controlled clinical trials comparing antidepressants alone or in association with other drugs or psychosocial interventions (or both) versus placebo, no treatment, and other pharmacological or psychosocial interventions.
Data collection and analysis
We used standard methodological procedures as expected by Cochrane.
Main results
We included 33 studies in the review (2242 participants). Antidepressants were compared to placebo (22 studies), psychotherapy (two studies), other medications (four studies), or other antidepressants (five studies). The mean duration of the trials was 9.9 weeks (range 3 to 26 weeks). Eighteen studies took place in the USA, 12 in Europe, two in Turkey, and one in Australia. The antidepressant included in most of the trials was sertraline; other medications were amitriptyline, citalopram, desipramine, doxepin, escitalopram, fluoxetine, fluvoxamine, imipramine, mianserin, mirtazepine, nefazodone, paroxetine, tianeptine, venlafaxine, and viloxazine. Eighteen studies were conducted in an outpatient setting, nine in an inpatient setting, and six in both settings. Psychosocial treatment was provided in 18 studies. There was high heterogeneity in the selection of outcomes and the rating systems used for diagnosis and outcome assessment.
Comparing antidepressants to placebo, low‐quality evidence suggested that antidepressants reduced the severity of depression evaluated with interviewer‐rated scales at the end of trial (14 studies, 1074 participants, standardized mean difference (SMD) ‐0.27, 95% confidence interval (CI) ‐0.49 to ‐0.04). However, the difference became non‐significant after the exclusion of studies with a high risk of bias (SMD ‐0.17, 95% CI ‐0.39 to 0.04). In addition, very low‐quality evidence supported the efficacy of antidepressants in increasing the response to the treatment (10 studies, 805 participants, risk ratio (RR) 1.40, 95% Cl 1.08 to 1.82). This result became non‐significant after the exclusion of studies at high risk of bias (RR 1.27, 95% CI 0.96 to 1.68). There was no difference for other relevant outcomes such as the difference between baseline and final score, evaluated using interviewer‐rated scales (5 studies, 447 participants, SMD 0.15, 95% CI ‐0.12 to 0.42).
Moderate‐quality evidence found that antidepressants increased the number of participants abstinent from alcohol during the trial (7 studies, 424 participants, RR 1.71, 95% Cl 1.22 to 2.39) and reduced the number of drinks per drinking days (7 studies, 451 participants, mean difference (MD) ‐1.13 drinks per drinking days, 95% Cl ‐1.79 to ‐0.46). After the exclusion of studies with high risk of bias, the number of abstinent remained higher (RR 1.69, 95% CI 1.18 to 2.43) and the number of drinks per drinking days lower (MD ‐1.21 number of drinks per drinking days, 95% CI ‐1.91 to ‐0.51) among participants who received antidepressants compared to those who received placebo. However, other outcomes such as the rate of abstinent days did not differ between antidepressants and placebo (9 studies, 821 participants, MD 1.34, 95% Cl ‐1.66 to 4.34; low‐quality evidence).
Low‐quality evidence suggested no differences between antidepressants and placebo in the number of dropouts (17 studies, 1159 participants, RR 0.98, 95% Cl 0.79 to 1.22) and adverse events as withdrawal for medical reasons (10 studies, 947 participants, RR 1.15, 95% Cl 0.65 to 2.04).
There were few studies comparing one antidepressant versus another antidepressant or antidepressants versus other interventions, and these had a small sample size and were heterogeneous in terms of the types of interventions that were compared, yielding results that were not informative.
Authors' conclusions
We found low‐quality evidence supporting the clinical use of antidepressants in the treatment of people with co‐occurring depression and alcohol dependence. Antidepressants had positive effects on certain relevant outcomes related to depression and alcohol use but not on other relevant outcomes. Moreover, most of these positive effects were no longer significant when studies with high risk of bias were excluded. Results were limited by the large number of studies showing high or unclear risk of bias and the low number of studies comparing one antidepressant to another or antidepressants to other medication. In people with co‐occurring depression and alcohol dependence, the risk of developing adverse effects appeared to be minimal, especially for the newer classes of antidepressants (such as selective serotonin reuptake inhibitors). According to these results, in people with co‐occurring depression and alcohol dependence, antidepressants may be useful for the treatment of depression, alcohol dependence, or both, although the clinical relevance may be modest.
PICO
Plain language summary
Antidepressants for the treatment of people with co‐occurring depression and alcohol dependence
Review question
This review investigated whether antidepressants reduce the severity of depression or alcohol dependence (or both) in people with co‐occurring depression and alcohol dependence.
Background
The co‐occurrence of major depression in people entering treatment for alcohol dependence is common and increases the severity of the condition reducing the effectiveness of treatments. Treatment of these people with medicines is challenging. In this review, we compared the results obtained by people with co‐occurring depression and alcohol dependence treated with antidepressant medicines to those treated with placebo (a sham/pretend treatment) or other treatments.
Search date
The evidence is current up to July 2017.
Study characteristics
We identified 33 medical trials involving 2242 participants: 68% were male, and the mean age was 42 years.
Most studies compared antidepressants to placebo (22 studies), but some compared one antidepressant to antidepressant (five studies), to another type of medicine (four studies), or to psychotherapy (a talking treatment; two studies). The average duration of the trials was 10 weeks (range 3 to 26 weeks). A total of 18 trials took place in the USA, and the others were in Europe, Turkey, and Australia. The antidepressant used in most of the trials was sertraline; the others were: amitriptyline, citalopram, desipramine, doxepin, escitalopram, fluoxetine, fluvoxamine, imipramine, mianserin, mirtazepine, nefazodone, paroxetine, tianeptine, venlafaxine, and viloxazine. The studies used 49 different rating scales and varied in terms of design, quality, participant characteristics, tested medicines, services provided, and treatments administered.
A total of 19 studies reported the source of funding (public funds: six studies; pharmaceutical industry: two studies; both funds: 10 studies).
Only four trials reported a declaration of the authors reporting possible conflicts of interest.
Key results
In the 22 studies comparing antidepressants to placebo, antidepressants may have reduced the severity of depression but we are uncertain whether it increased the number of people with clinical beneficial effects from the reduction of depression severity (response to treatment, i.e. people who halved the severity of depression). However, we found no difference between antidepressants and placebo in other relevant outcomes related to the severity of depression, such as the number of people without depression at the end of the trial (remission).
In addition, we found that the administration of antidepressants probably reduced alcohol consumption evaluated as the number of participants abstinent during the treatment (higher among participants who received antidepressants compared to placebo) and the number of drinks consumed per drinking days (lower among participants who received antidepressants compared to placebo). However, similarly to what we found for the severity of depression, we also observed that the administration of antidepressants did not affect other relevant outcomes related to alcohol dependence, such as the rate of abstinent days, number of heavy drinkers, and time before first relapse.
In terms of safety issues, the rate of people withdrawing from treatment due to side effects (undesirable effects such as dry mouth) may not differ between antidepressants and placebo.
There were few studies comparing one antidepressant to another antidepressant or to other interventions, and these had a small number of participants and the same comparison was not made by more than one study, and were therefore not informative.
Quality of evidence
The quality of the included studies was low or moderate for depression severity, abstinence from alcohol, rate of people withdrawal for medical reasons, and dropouts. In subgroup analyses, in the case of single types of medicines, and comparisons with other medicines, the findings of the review were limited by the small number of available studies.
Authors' conclusions
There is low‐quality evidence supporting the use of antidepressants in the treatment of people with co‐occurring depression and alcohol dependence. Antidepressants have positive effects on certain relevant outcomes related to depression and alcohol use but not on equally relevant other outcomes. However, the risk of developing side effects appears to be minimal, especially for the newer classes of antidepressants.
Authors' conclusions
Summary of findings
| Antidepressants compared to placebo: all studies | ||||||
| Patient or population: people with co‐occurring depression and alcohol dependence Settings: unknown | ||||||
| Outcomes | Illustrative comparative risks* (95% CI) | Relative effect | No of Participants | Quality of the evidence | Comments | |
| Assumed risk | Corresponding risk | |||||
| Placebo | Antidepressants | |||||
| Depression severity: final score (interviewer‐rated scales) | ‐ | The mean depression: final score (interviewer‐rated scales) ‐ all studies in the intervention groups was 0.27 standard deviations lower (0.49 lower to 0.04 lower) | ‐ | 1074 | ⊕⊕⊝⊝ | ‐ |
| Response to antidepressive treatment | Study population | RR 1.40 | 805 | ⊕⊝⊝⊝ | ‐ | |
| 481 per 1000 | 674 per 1000 | |||||
| 392 per 1000 | 521 per 1000 | |||||
| Consumption of alcohol: abstinent days (%) | ‐ | The mean alcohol: abstinent days (%) ‐ all studies in the intervention groups was 1.34 higher (1.66 lower to 4.34 higher) | ‐ | 821 | ⊕⊕⊝⊝ | ‐ |
| Consumption of alcohol: abstinent participants (number) | Study population | RR 1.71 | 424 | ⊕⊕⊕⊝ | ‐ | |
| 199 per 1000 | 340 per 1000 | |||||
| 188 per 1000 | 321 per 1000 | |||||
| Consumption of alcohol: drinks (per drinking days) | ‐ | The mean alcohol: drinks (per drinking days) ‐ all studies in the intervention groups was | ‐ | 451 | ⊕⊕⊕⊝ | ‐ |
| Acceptability: dropouts | Study population | RR 0.98 | 1159 | ⊕⊕⊝⊝ | ‐ | |
| 334 per 1000 | 328 per 1000 | |||||
| 307 per 1000 | 301 per 1000 | |||||
| Tolerability of treatment: withdrawal for medical reasons | Study population | RR 1.15 | 947 | ⊕⊕⊝⊝ | ‐ | |
| 69 per 1000 | 80 per 1000 | |||||
| 32 per 1000 | 37 per 1000 | |||||
| *The basis for the assumed risk (e.g. the median control group risk across studies) is provided in footnotes. The corresponding risk (and its 95% confidence interval) is based on the assumed risk in the comparison group and the relative effect of the intervention (and its 95% CI). | ||||||
| GRADE Working Group grades of evidence | ||||||
| 1Nine studies at unclear risk for selection bias; two studies at high risk and six at unclear risk for performance bias; 13 studies at unclear risk for detection bias (subjective); one study at high risk and two at unclear risk for attrition bias; three studies at high risk and one at unclear risk for reporting bias. 6Seven studies with unclear risk of selection bias; one study at high risk and five studies at unclear risk for performance bias; all studies at unclear risk for detection bias (subjective); one study at high risk and two at unclear risk for reporting bias. | ||||||
Background
See Appendix 1 for a list of the abbreviations used in this review.
Description of the condition
Major depression disorder and alcohol dependence are among the most prevalent mental disorders worldwide, and their co‐occurrence is common (APA 2013; Grant 1995; Grant 2015; Pettinati 2013). Depression is characterized by a low mood or diminished interest in normal activities on most days, for at least two weeks, as well as other symptoms such as significant weight loss or gain, insomnia or hypersomnia, psychomotor agitation or retardation, fatigue, feelings of guilt or worthlessness, difficulty concentrating, and suicidal ideation (APA 2013). Diagnosis requires the presence of at least five of these symptoms (APA 2000; APA 2013). Alcohol dependence is characterized by bouts of excessive drinking, and inability to control alcohol consumption despite the awareness of its negative consequences (APA 2013). In the last edition of the Diagnostic and Statistical Manual of Mental Disorders (DSM‐5), diagnoses of alcohol dependence and alcohol abuse formerly classified as Alcohol Use Disorders have been replaced by a classification of Alcohol Use Disorder (AUD), which merges their criteria into a single set (APA 2000; APA 2013). AUD diagnosis requires repetitive alcohol‐related problems in at least two out of 11 areas of life as described by a set of criteria that includes 'craving,' which is defined as a strong, obsessive, and irresistible desire to consume alcohol (APA 2013).
Epidemiological studies found that the 12‐month prevalence of depression in the adult population was 5.3% and lifetime prevalence was 13.3% (Hasin 2005), and the 12‐month prevalence of alcohol dependence was 13.9% and lifetime prevalence was 29.1% (Grant 2015). The prevalence of depression has been reported to be higher in people with alcohol dependence than in the general population as well as the prevalence of alcohol dependence in people with depression than in the general population (Regier 1990; Schuckit 1997). Each of these disorders alone is associated with a significant risk of developing the other, and their coexistence is a risk factor for morbidity and mortality, including death from suicide (Schneider 2009; Sher 2005; Wilcox 2004).
The co‐occurrence of depression and alcohol dependence carries potential problems in the diagnostic process (Pettinati 2013; Schuckit 2006). Indeed, depression and alcohol dependence may represent two independent conditions, each requiring to be treated comprehensively (Schuckit 2006). Alternatively, one disorder may influence the development of the second condition. For instance, depression may be the first disorder and is a risk factor for the development of excessive alcohol consumption and the progression to alcohol dependence. In this case, depression is defined as the primary disorder and alcohol dependence is the secondary disorder (Schuckit 2006). However, when the two conditions are of significant duration or severity, both require treatment for as long as is necessary (Schuckit 2006). In contrast, temporary alcohol‐induced depressive symptoms, resulting from the acute alcohol effects of intoxication or withdrawal (APA 2013) tend to spontaneously disappear within approximately one month of alcohol abstinence, without requiring antidepressant therapy (Pettinati 2013; Schuckit 2006).
Description of the intervention
People with alcohol dependence and depression may require different medical treatments depending to the different typology of co‐occurrence. However, pharmacological treatment of people with alcohol dependence and depression constitutes a real challenge (Pettinati 2013).
Except in the case of temporary alcohol‐induced depressive symptoms, people with co‐occurrence of alcohol dependence and depression often receive a combination therapy consisting of medication for the treatment of depression and another for the treatment of alcohol dependence (Pettinati 2013). From a clinical standpoint, this practice is limited by two factors. The first is the extremely low use of medications approved for the treatment of alcohol dependence (Pettinati 2013). One epidemiological study found that less than 10% of people affected by alcohol dependence seek and receive a medical treatment other than 12‐step groups (Grant 2015). The second limitation is the lack of clear evidence of the efficacy of antidepressants in people with alcohol dependence (Pettinati 2013). Usually, depression is considered as a disorder that is amenable to antidepressant treatment (O'Donnell 2011). The most commonly used medications are selective serotonin reuptake inhibitors (SSRIs) and serotonin‐noradrenaline reuptake inhibitors (SNRIs) (O'Donnell 2011). SSRIs and SNRIs are often referred to as second‐generation antidepressants and are considered to be as effective and safer than the older first‐generation antidepressants, such as monoamine oxidase inhibitors (MAOIs), and tricyclic antidepressants (TCAs) (O'Donnell 2011). A common characteristic of antidepressants is that three to four weeks are required following initiation of treatment before a therapeutic response is observed (O'Donnell 2011). In addition, 20% of people with depression may be refractory to multiple antidepressants at adequate doses (O'Donnell 2011).
The efficacy of antidepressants in the treatment of people with alcohol dependence and depression has been investigated in four systematic reviews and meta‐analyses (Foulds 2015; Iovieno 2011; Nunes 2004; Torrens 2005). The first study analyzed 14 trials in which the efficacy of antidepressants was compared to that of placebo in people with dependence on alcohol or other substances of abuse (opioids or cocaine) (Nunes 2004). Among the selected trials, eight specifically investigated the efficacy of antidepressants in people with alcohol dependence and depression (Altamura 1990; Cornelius 1997; Mason 1996; McGrath 1996; Moak 2003; Pettinati 2001a; Roy 1998; Roy‐Byrne 2000). The results of the meta‐analysis revealed that antidepressants had a modest beneficial effect in people with depression who were dependent on alcohol or other substances. The second meta‐analysis compared the efficacy of antidepressants in people who were dependent on substances of abuse, with and without depression (Torrens 2005). Nine studies investigated the efficacy of antidepressants in people with alcohol dependence and depression (Altamura 1990; Cornelius 1997; Gual 2003; Mason 1996; McGrath 1996; Moak 2003; Pettinati 2001a; Roy 1998; Roy‐Byrne 2000). Two of these examined the efficacy of TCAs (Mason 1996; McGrath 1996), five of SSRIs (Cornelius 1997; Gual 2003; Moak 2003; Pettinati 2001a; Roy 1998), one of viloxazine (Altamura 1990), and one of nefazodone (Roy‐Byrne 2000). Although five trials investigated the efficacy of SSRIs, the meta‐analysis did not demonstrate a significant advantage associated with their use but found a significant effect of other antidepressants (Torrens 2005). The third meta‐analysis analyzed 11 trials (Altamura 1990; Cornelius 1997; Gual 2003; Hernandez‐Avila 2004; Kranzler 2006 arm A; Kranzler 2006 arm B; Mason 1996; McGrath 1996; Moak 2003; Pettinati 2010 arm A; Pettinati 2010 arm B; Roy 1998; Roy‐Byrne 2000), and compared the efficacy of antidepressants in people affected by depression or dysthymic disorder (or both) with and without alcohol dependence (Iovieno 2011). The results showed that antidepressants reduced the severity of depression, increasing the rate of responders in people with and without alcohol dependence, with no difference between these two groups; however, there was no effect on the rate of the responders with SSRIs alone. In addition, antidepressant treatment did not reduce alcohol consumption in people with depression and alcohol dependence (Iovieno 2011), which may be explained, at least in part, by the low number of trials reporting data on alcohol consumption. However, there have been conflicting reports on the effects of antidepressants on alcohol consumption in alcohol‐dependent people (Naranjo 2001; Pettinati 2013): while some studies found that antidepressants did not alter consumption (Kranzler 2000; Pettinati 2004), others found that it was significantly reduced (Naranjo 2001), or increased in certain typologies of alcohol‐dependent people (Kranzler 1996; Pettinati 2000). The last meta‐analysis investigated differences in the response to treatment for depression in alcohol‐dependent people according to depression type, independent or alcohol‐induced depression (Foulds 2015). This study analyzed 22 clinical trials of which 13 compared the efficacy of antidepressants to placebo in people with alcohol dependence and depression (Adamson 2015; Altintoprak 2008; Cornelius 1997; Gual 2003; Hernandez‐Avila 2004; Kranzler 2006 arm A; Kranzler 2006 arm B; Mason 1996; McGrath 1996; Moak 2003; Muhonen 2008; Pettinati 2001a; Pettinati 2010 arm A; Pettinati 2010 arm B; Roy‐Byrne 2000), while the other nine studies investigated the efficacy of other treatments (e.g. psychotherapy or medical management). Two of the 13 former studies were excluded from the meta‐analysis (Altintoprak 2008; Mason 1996); the remaining 11 were divided into two groups, the first comprising trials in which depression was considered to be independent (Cornelius 1997; McGrath 1996; Moak 2003; Pettinati 2010 arm A; Pettinati 2010 arm B; Roy‐Byrne 2000), and the second in which depression was considered to be alcohol‐induced or undifferentiated (Gual 2003; Hernandez‐Avila 2004; Kranzler 2006 arm A; Kranzler 2006 arm B; Mason 1996; Pettinati 2001a). The results showed that treatment of depression in alcohol‐dependent people was associated with a large early improvement in the severity of the depression, even when it was independent from drinking, and that the effect of antidepressants was modest but stronger in independent than in alcohol‐induced depression (Foulds 2015).
How the intervention might work
The effect of antidepressants on depression in alcohol‐dependent people could depend on their interference with neurobiological substrates underlying depression, including noradrenaline, dopamine, and serotonin brain circuits (Artigas 2002; Stahl 2003). However, it may also be related to interference with the neurobiological pathways that support alcohol dependence (Carboni 2004; LeMoal 2007; Shirayama 2006). In fact, antidepressants have been proposed for the treatment of alcohol dependence, although their efficacy in this regard remains controversial (Torrens 2005): while some SSRIs have shown positive results in cases of less severe drinking (Pettinati 2001b), others have reported that antidepressants achieved even worse results than placebo (Chick 2004a; Kranzler 1996), especially when treating early‐onset subtypes (Type B, Type II) of alcohol dependence (Babor 1992; Cloninger 1988). Consistent with the heterogeneous origin of depression in alcohol‐dependent people, there are reports of depression symptoms abating spontaneously after alcohol detoxification (Brown 1995; Nunes 2004), and the lack of effect of antidepressants in people who are actively drinking (Pettinati 2004).
Why it is important to do this review
Several Cochrane Reviews on the use of antidepressants for depression are available. However, the generalization of their results to the treatment of people whose depression is complicated by alcohol dependence is limited since it is unknown whether depressive symptoms result from the effects of alcohol or constitute a separate mood disorder (Pettinati 2004). There are no Cochrane Reviews or protocols available on the efficacy of antidepressants in the treatment of people with co‐occurring depression and alcohol dependence, and, although results from the few published reviews (including four meta‐analyses; Foulds 2015; Iovieno 2011; Nunes 2004; Torrens 2005) are suggestive of the efficacy of antidepressants, there are no conclusive results. Therefore, the treatment of a clinical condition associated with significant mortality and morbidity is not yet supported by systematic evaluations of efficacy using rigorous Cochrane methodology. Thus, the evaluation of the efficacy and safety of antidepressants for the treatment of people with co‐occurring depression and alcohol dependence represents a priority.
Objectives
To assess the benefits and risks of antidepressants for the treatment of people with co‐occurring depression and alcohol dependence.
Methods
Criteria for considering studies for this review
Types of studies
All randomized controlled trials (RCTs) and controlled clinical trials (CCTs) focused on the use of any antidepressant medication for the treatment of people with co‐occurring depression and alcohol dependence. For cross‐over studies, given possible carry‐over effects and expected dropout rates, we considered only the first period of the trial.
Types of participants
People with co‐occurring depression and alcohol dependence, irrespective of symptom severity. Alcohol dependence and depression were both diagnosed according to standardized criteria such as DSM or equivalent. However, we also accepted trials that did not use explicit diagnostic criteria.
We examined the effect of including people with uncertain diagnoses in the sensitivity analyses. Trials including people with additional diagnoses of dependence by other substances of abuse were also considered eligible. People under 18 years of age and pregnant women were excluded for the substantially different approach to clinical management of these people. People with other comorbid mental health conditions were included and considered in subgroup analysis.
Types of interventions
Experimental intervention
-
Monoamine oxidase inhibitors (MAOIs): minaprine, moclobemide, phenelzine, selegiline.
-
Tricyclic antidepressants (TCAs) and TCA‐related antidepressants: amitriptyline, amoxapine, clomipramine, desipramine, dothiepin (also known as dosulepin), doxepin, imipramine, maprotiline, nomifensine, nortriptyline, protriptyline, trimipramine.
-
Selective serotonin reuptake inhibitors (SSRIs): citalopram, escitalopram, fluoxetine, fluvoxamine, paroxetine, sertraline, zimelidine.
-
Serotonin‐noradrenaline reuptake inhibitors (SNRIs): desvenlafaxine, duloxetine, milnacipran, venlafaxine.
-
5‐HT2 antagonists: mianserin, mirtazepine, nefazodone, trazodone.
-
Other antidepressants: agomelatine, bupropion, reboxetine, tianeptine, viloxazine.
These antidepressants may have been administered alone or in combination with other medications for the treatment of alcohol dependence or with any psychosocial intervention.
Control intervention
-
Placebo.
-
No intervention.
-
Other pharmacological interventions.
-
Any psychosocial intervention.
Types of outcome measures
Primary outcomes
-
Depression severity measured as group mean scores in continuous: interviewer‐rated scales (e.g. Hamilton Rating Scale for Depression (HRSD)) and self‐administered scales (e.g. Beck Depression Inventory (BDI)).
-
Response to antidepressive treatment (defined using interviewer‐rated scales as the number of people showing greater than 50% reduction in depression severity from baseline, according to the definition of the study authors, or a 'very much improved' or 'much improved' on the Clinical Global Impression (CGI) improvement scale).
-
Full remission of depression (defined according to a prespecified score in interviewer‐rated continuous depression scales).
-
Consumption of alcohol as number of participants who reported use during treatment, or number of participants with positive breath alcohol analysis or urine analyses positive for alcohol, or both.
-
Liver enzyme levels (alanine aminotransferase (ALT), aspartate aminotransferase (AST), and γ‐glutamyltransferase (GGT)).
-
Acceptability indicated by all‐cause dropouts from the treatment as number of participants who did not complete treatment.
-
Tolerability of treatment as withdrawal for medical reasons, total number of adverse events, and type of adverse events experienced during treatment.
-
Suicide and suicide attempts.
Where possible, indices of effectiveness at different time points in the course of treatment were pooled.
Secondary outcomes
-
Use of other substances of abuse as number of participants who reported use during treatment, or number of participants with urine analyses positive for other substances of abuse, or both; self‐reported quantity and frequency of use of other substances of abuse.
-
Craving as measured by validated scales (e.g. Brief Substance Craving Scale (BSCS), Visual Analogue Scale (VAS), Obsessive Compulsive Drinking Scale (OCDS)).
-
Severity of dependence as measured by validated scales (e.g. Addiction Severity Index (ASI), CGI, Severity of Dependence Scale (SDS), Drinker Inventory of Consequences scale (DrInC)).
-
Psychiatric symptoms/psychological distress diagnosed using standard criteria (e.g. DSM) or measured by validated scales (e.g. Positive and Negative Syndrome Scale (PANSS); Symptoms Check List‐90 (SCL‐90)).
Search methods for identification of studies
Electronic searches
We searched the following electronic databases.
-
Cochrane Drugs and Alcohol Group (CDAG) Specialised Register (inception to 4 July 2017), using the search strategy outlined in Appendix 2.
-
Cochrane Central Register of Controlled Trials (CENTRAL) (2017, Issue 7), using the search strategy outlined in Appendix 3.
-
MEDLINE (via PubMed) (January 1966 to 4 July 2017), using the search strategy outlined in Appendix 4.
-
Embase (Elsevier, embase.com) (January 1974 to 4 July 2017), using the search strategy outlined in Appendix 5.
We searched for ongoing clinical trials and unpublished trials via Internet searches on the following websites.
-
ClinicalTrials.gov (www.clinicaltrials.gov) (4 July 2017).
-
World Health Organization (WHO) International Clinical Trials Registry Platform (ICTRP) (apps.who.int/trialsearch/) (4 July 2017).
All searches included non‐English language literature and studies with English abstracts were assessed for inclusion. When considered likely to meet inclusion criteria, studies were translated.
Searching other resources
We searched the reference lists of all relevant papers to identify additional studies, and conference proceedings that were likely to contain trials relevant to the review. We also contacted investigators to seek information about unpublished or incomplete trials.
Data collection and analysis
Selection of studies
Two authors (RA, ET) inspected the search hits by reading titles and abstracts. Two authors (RA, ET) obtained each potentially relevant study identified in the search in full text and independently assessed them for inclusion. We resolved disagreements by discussion or consultation with the third author (PP).
Data extraction and management
Two authors (RA, ET) independently extracted data and used a standardized checklist to collect information on methodology, participants (sociodemographic and clinical information relevant to the review aims), interventions (medications and non‐pharmacological interventions), and primary and secondary outcomes. We resolved disagreements by discussion and, for those that persisted, by consultation with the third author (PP).
Assessment of risk of bias in included studies
Two authors (RA, ET) assessed study quality according to the criteria listed in the Cochrane Handbook for Systematic Reviews of Interventions (Higgins 2011). We resolved disagreements by discussion or consultation with the third author (PP). We assessed the risk of bias for RCTs and CCTs according the five criteria recommended by the Cochrane Handbook for Systematic Reviews of Interventions (Higgins 2011). The approach recommended for assessing the risk of bias in studies included in a Cochrane Review involves a two‐part tool addressing seven specific domains, namely, sequence generation and allocation concealment (selection bias), blinding of participants and personnel (performance bias), blinding of outcome assessors (detection bias), incomplete outcome data (attrition bias), selective outcome reporting (reporting bias), and other sources of bias. The first part of the tool involves describing what was reported to have happened in the study. The second part involves assigning a judgement relating to the risk of bias for that entry in terms of low, high, or unclear risk. To make these judgements, we used the criteria listed in the Cochrane Handbook for Systematic Reviews of Interventions adapted to the addiction field (see Appendix 6).
The domains of sequence generation and allocation concealment (avoidance of selection bias) were addressed in the tool by a single entry for each study.
Blinding of participants and personnel (avoidance of performance bias) was judged to interfere with both subjective and objective outcomes pertaining to the behaviour of participants (such as retention in treatment) and was addressed by a single entry for each study.
Blinding of outcome assessor (avoidance of detection bias) was considered separately for objective outcomes (e.g. retention in treatment, use of substances of abuse measured by breath or urine analysis), and subjective outcomes (e.g. severity of depression, other psychiatric symptoms/psychological distress, severity of dependence).
Incomplete outcome data (avoidance of attrition bias) was considered for all outcomes except for the dropout from the treatment, which is often the primary outcome measure in addiction studies.
To incorporate assessment in the review process, we first plotted intervention effects estimates for different outcomes stratified for risk. If there were differences in results among studies with different risks of bias, we performed a sensitivity analysis excluding studies with high risk of bias in one or more domains.
We also performed subgroup analysis for studies with low and unclear risk of bias.
Measures of treatment effect
We analyzed dichotomous outcomes (e.g. number of participants showing improvement in depression at follow‐up) calculating the risk ratio (RR) for each trial, with the uncertainty of each result expressed as a 95% confidence interval (CI). Continuous outcomes (e.g. severity of depression according to final scores archived in continuous interviewer‐rated scales) were analyzed by calculating the mean difference (MD) with 95% CI, which were calculated by comparing and pooling mean score differences from the end of treatment to baseline for each group. In case of missing data on the standard deviation (SD) of the changes, we used the SD at the end of treatment for each group. We used the standardized mean difference (SMD) when the studies employed different instruments.
Unit of analysis issues
We did not use data presented as a number of positive urine or breath alcohol tests relative to the total number of tests in the experimental and control groups as a measure of substance use. This decision was made because using the number of tests instead of the number of participants as a unit of analysis violates the assumption of the independence of observations. In fact, the results of the tests performed for each participant were not independent.
If multi‐arm studies were included in the meta‐analyses and one arm was considered more than once in the same comparison, we combined groups according to the approaches suggested by the Cochrane Handbook for Systematic Reviews of Interventions (Higgins 2011). That is, if one arm (e.g. control group) was compared with different groups in which participants received different doses of the same antidepressant, we combined all the experimental groups (different doses of the same antidepressant) into a single group, which was then compared with the control group. If one arm (e.g. control group) was compared with different experimental groups in which participants received different antidepressants, we planned to split the 'shared' control group into two or more groups with smaller sample sizes, and compared these smaller control groups with the different experimental groups. While this last approach avoided the repeated use of participants in the pooled estimate of treatment effect while retaining information from each arm of the trial, it decreased the precision of the pooled estimate. Both approaches avoided the double counting of participants in the control groups.
Dealing with missing data
We contacted the original investigators to request information on data missing from the studies. In the absence of supplemental data from the study authors, we obtained missing data according to procedures suggested in the Cochrane Handbook for Systematic Reviews of Interventions (Higgins 2011). Whenever the assumption that random data were missing was supported by available information, we analyzed only available data; on the contrary case, other approaches, such as the last observation carried forward or the assumption that missing data corresponded to poor outcomes, were pursued. To assess the sensitivity of the results to changes made in the assumptions, we carried out a sensitivity analysis. The potential impact of missing data on the findings of the review is addressed in the Discussion.
Assessment of heterogeneity
We analyzed heterogeneity using the I² statistic and the Chi² test. As suggested by the Cochrane Handbook for Systematic Reviews of Interventions (Higgins 2011), according to I² values, evidence of heterogeneity may be classified into no important (0% to 40%), moderate (30% to 60%), substantial (50% to 90%), and considerable (75% to 100%). In the present meta‐analysis, we considered the following cut‐off values: I² value 50% or greater; P value for the Chi² test 0.1 or less for significant evidence of heterogeneity.
Assessment of reporting biases
We used a funnel plot (plot of the effect estimate from each study against sample size or effect standard error) to evaluate the potential for bias related to the size of the trials.
Data synthesis
Whenever possible, we combined the outcomes from individual trials in a meta‐analysis (comparing intervention and outcomes between trials) using a fixed‐effect model; when there was significant heterogeneity, we used a random‐effects model.
Subgroup analysis and investigation of heterogeneity
We performed subgroup analyses for studies with low and unclear risk of bias and for classes of antidepressants. Moreover, we performed subgroup analyses to take into account the following confounders/effect modifiers, when possible.
-
Setting (inpatient or outpatient treatment).
-
Starting dose/rate and pattern of dose reduction.
-
Scheduled duration of treatment.
-
Severity of depression.
-
Severity of alcohol dependence.
-
Being actively drinking.
-
Length of abstinence.
-
Other psychiatric comorbidity.
-
Other pharmacological treatment offered.
-
Other psychosocial treatment offered.
Sensitivity analysis
To incorporate assessment into the review process, we first plotted intervention effects estimates stratified for risk of bias for each relevant domain. If there were differences in the results among studies at different risks of bias, we performed a sensitivity analysis excluding the studies with a high risk of bias. The effect of including people with uncertain diagnoses was evaluated with the sensitivity analysis; other issues suitable for sensitivity analysis were identified during the review process based on idiosyncrasies of the examined studies.
'Summary of findings' table
We assessed the overall quality of the evidence for the primary outcomes using the GRADE system. The GRADE Working Group developed a system for grading the quality of evidence (GRADE 2004; Guyatt 2008; Guyatt 2011; Schünemann 2006), which takes into account issues related to internal validity and to external validity, such as directness of results. The 'Summary of findings' table presents the main findings of a review in a transparent and simple tabular format. In particular, it provides key information concerning the quality of evidence, the magnitude of effect of the interventions examined and the sum of available data on the main outcomes.
The GRADE system uses the following criteria for assigning grades of evidence.
-
High: we are very confident that the true effect lies close to that of the estimate of the effect.
-
Moderate: we are moderately confident in the effect estimate. The true effect is likely to be close to the estimate of the effect, but there is a possibility that it is substantially different.
-
Low: our confidence in the effect estimate is limited. The true effect may be substantially different from the estimate of the effect.
-
Very low: we have very little confidence in the effect estimate. The true effect is likely to be substantially different from the estimate of effect.
Grading is decreased for the following reasons.
-
Serious (‐1) or very serious (‐2) study limitation for risk of bias.
-
Serious (‐1) or very serious (‐2) inconsistency between study results.
-
Some (‐1) or major (‐2) uncertainty about directness (the correspondence between the population, the intervention, or the outcomes measured in the studies actually found and those under consideration in our systematic review).
-
Serious (‐1) or very serious (‐2) Imprecision of the pooled estimate.
-
Strong suspicion of publication bias (‐1).
Results
Description of studies
For substantive descriptions of studies see Characteristics of included studies; Characteristics of excluded studies; and Characteristics of ongoing studies tables.
Results of the search
The searches of the four databases (see Electronic searches) retrieved 8532 records (see Figure 1). Our searches of other resources identified three additional records that appeared to meet the inclusion criteria. Therefore, there was a total of 8535 records.
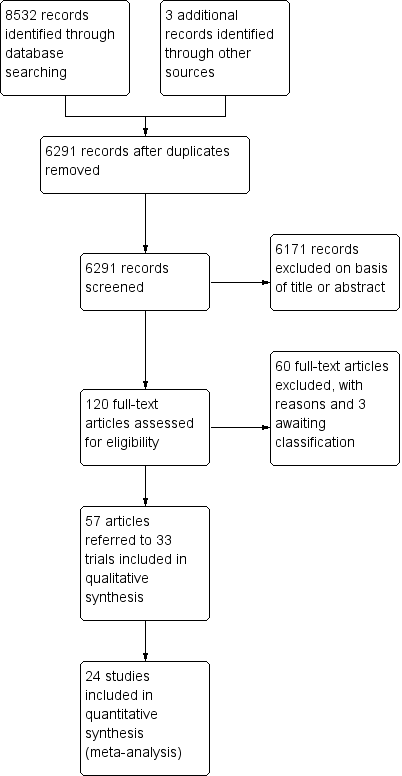
Study flow diagram.
Once duplicates had been removed, there were 6291 records. We excluded 6171 records based on titles and abstracts. We obtained the full text of the remaining 120 records. We excluded 60 records (see Characteristics of excluded studies table). We added three records to the Characteristics of studies awaiting classification table pending information from the authors.
We included 33 studies reported in 57 references. For a further description of our screening process, see the study flow diagram (Figure 1).
Included studies
Thirty‐three studies with 2242 participants met the inclusion criteria (see Characteristics of included studies table).
It was not possible to extract and combine the results of nine studies as their comparisons were not evaluated by more than one study. We extracted data from the other 24 studies (1498 participants) (see Figure 1).
Duration of trials
The mean duration of the trials was 9.9 weeks (range 3 to 26 weeks).
Treatment regimens and setting
Medications evaluated: sertraline (eight studies); amitriptyline (five studies); mirtazapine (four studies); doxepin (three studies); imipramine (three studies); nefazodone, tianeptine, and venlafaxine (two studies each); and citalopram, desimipramine, escitalopram, fluoxetine, fluvoxamine, mianserine, paroxetine, and viloxazine (one study each).
Twenty‐two studies (1438 participants) compared the efficacy of an antidepressant versus placebo, two (60 participants) compared the efficacy of an antidepressant versus psychotherapy, five compared the efficacy of one antidepressant versus another (mirtazapine versus amitriptyline; mirtazapine versus venlafaxine; paroxetine versus amitriptyline; tianeptine versus amitriptyline; tianeptine versus fluvoxamine), four compared the efficacy of antidepressants versus other medications (amitriptyline versus diazepam (one study); doxepin versus diazepam (two studies); escitalopram versus memantine (one study)).
In total, 18 trials were conducted in an outpatient setting, 12 in an inpatient setting, and three trials initially in an inpatient setting and then in an outpatient setting. Eighteen studies took place in the USA, 12 in Europe, two in Turkey, and one in Australia.
Eighteen trials administered psychosocial treatment in conjunction with antidepressants, including cognitive behavioural psychotherapy or relapse prevention therapy (14 trials) and manualized clinical case management or unspecified psychotherapy (four studies).
Studies assessed compliance as the return of unused medications (six studies), trough plasma concentrations (two studies), and use of an electronic monitoring device that recorded the date and time of bottle cap openings (two studies). The remaining 19 studies did not report this information. For more information see Appendix 7.
Rating instruments
The rating instruments used in the included studies are listed in Appendix 8.
Participants
The analysis included 2242 participants affected by alcohol dependence and depression according to DSM criteria (Diagnostic and Statistic Manual of Mental Disorders III ‐ Revised (DSM‐III‐R); Diagnostic and Statistic Manual of Mental Disorders IV ‐ Revised (DSM‐IV‐R)) or other criteria (see Appendix 8).
The sex of 156 participants was unknown; among the remaining 2086 participants, 1425 were men (68.3%), and 661 were women (31.7%). The mean age was 41.7 years (data from 28/33 studies).
Sources of funding
Only 19 trials reported the source of funding for their research. Six trials received funds only from public Institutes; 10 studies were partly supported by both a public institute and a private pharmaceutical company; and two were only partially supported by a private pharmaceutical company.
Declaration of interest
Four trials reported a possible conflict of interest.
Outcomes
For some reported outcomes, it was difficult to make comparisons and pool results due to the different modes of measurement, the selected cut‐off value, and the availability of data from the study or the primary investigator. This was particularly true for use of alcohol and alcohol abstinence, which were expressed in various ways (i.e. rate of drinking days, cumulative number of drinking days, number of drinks per drinking day, weekly number of heavy drinking days, rate of heavy drinkers, number of heavy drinkers, number of participants abstaining during the trial, rate of abstinence days, cumulative abstinence days). Appendix 9 shows the list of outcomes.
Primary outcomes
Depression severity
-
Twenty‐three studies reported the final score of an interviewer‐rated scale (see Primary outcomes) (Adamson 2015; Altamura 1990; Altintoprak 2008; Butterworth 1971a; Gual 2003; Habrat 2006; Hernandez‐Avila 2004; Kranzler 2006 arm A; Kranzler 2006 arm B; Krupitsky 2012; Liappas 2005 arm A; Liappas 2005 arm B; Liappas 2005 arm C; Lôo 1988; Mason 1996; McGrath 1996; Moak 2003; Muhonen 2008; Pettinati 2001a; Pettinati 2010 arm A; Pettinati 2010 arm B; Roy 1998; Roy‐Byrne 2000; 1796 participants) (see Appendix 8; Appendix 9). Nineteen studies used the HRSD (Altamura 1990; Altintoprak 2008; Gual 2003; Habrat 2006; Hernandez‐Avila 2004; Kranzler 2006 arm A; Kranzler 2006 arm B; Krupitsky 2012; Liappas 2005 arm A; Liappas 2005 arm B; Liappas 2005 arm C; Mason 1996; McGrath 1996; Moak 2003; Pettinati 2001a; Pettinati 2010 arm A; Pettinati 2010 arm B; Roy 1998; Roy‐Byrne 2000; 1410 participants); five studies used the Montgomery and Åsberg Depression Rating Scale (MADRS) (Adamson 2015; Gual 2003; Krupitsky 2012; Lôo 1988; Muhonen 2008; 490 participants), and one study used the Brief Psychiatric Rating Scale (BPRS) (Butterworth 1971a; 39 participants). Two studies reported data of two interviewer‐rated scales (MADRS and HRSD) and only included data obtained using the HRSD (Gual 2003; Krupitsky 2012; 143 participants). One study excluded data because they were expressed as medians and interquartile ranges (Mason 1996; 22 participants).
-
Thirteen studies reported the final score of a self‐administered scale (see Primary outcomes) (Adamson 2015; Butterworth 1971a; Cocchi 1997; Cornelius 2016; Krupitsky 1993 arm A; Krupitsky 1993 arm B; Krupitsky 2012; Lôo 1988; McLean 1986; Moak 2003; Muhonen 2008; Pettinati 2001a; Roy 1998; 825 participants) (see Appendix 8; Appendix 9). Among them, five studies used the BDI scale (Cornelius 2016; Moak 2003; Muhonen 2008; Pettinati 2001a; Roy 1998; 241 participants), one study used the HRSD scale (McLean 1986; 27 participants), two studies used the SCL‐90 scale (Adamson 2015; Lôo 1988; 267 participants), and five studies used the Zung Self‐Assessment Depression Scale (ZUNG) scale (Butterworth 1971a; Cocchi 1997; Krupitsky 1993 arm A; Krupitsky 1993 arm B; Krupitsky 2012; 282 participants). Two studies reported data obtained using the Minnesota Multiphasic Personality Inventory (MMPI) and ZUNG and only included data obtained with ZUNG (Krupitsky 1993 arm A; Krupitsky 1993 arm B; 41 participants).
-
Six studies reported the difference between the baseline and final score of an interviewer‐rated scale (see Primary outcomes) (Butterworth 1971b; Cornelius 1997; Kranzler 2006 arm A; Kranzler 2006 arm B; Mason 1996; Pettinati 2001a; 476 participants) (see Appendix 8; Appendix 9). Five studies used the HRSD (Cornelius 1997; Kranzler 2006 arm A; Kranzler 2006 arm B; Mason 1996; Pettinati 2001a; 436 participants), and one trial used the Lehmann Depression Rating Scale (LDRS) (Butterworth 1971b; 40 participants). We excluded data from one study because they were expressed as medians and interquartile ranges (Mason 1996; 28 participants).
-
Four studies reported the difference between the baseline and final score of a self‐administered scale (see Primary outcomes; Appendix 8; Appendix 9) (Cornelius 1997; Cornelius 2016; McLean 1986; Pettinati 2001a; 129 participants). Among them, three studies used the BDI (Cornelius 1997; Cornelius 2016; Pettinati 2001a; 94 participants), and one study used a self‐rating scale based on the HRSD (McLean 1986; 35 participants).
Response
Fourteen studies reported the response to antidepressive treatment (see Primary outcomes) (Butterworth 1971b; Butterworth 1971a; Gallant 1969 arm a; Gallant 1969 arm b; Gual 2003; Habrat 2006; Kranzler 2006 arm A; Kranzler 2006 arm B; Lôo 1988; Mason 1996; McGrath 1996; Moak 2003; Roy 1998; Roy‐Byrne 2000; 1284 participants) (see Appendix 8; Appendix 9). The studies used different interviewer‐rated scales: five studies used CGI (Butterworth 1971b; Gallant 1969 arm a; Gallant 1969 arm b; Roy 1998; Roy‐Byrne 2000; 240 participants); two studies used MADRS (Gual 2003; Lôo 1988; 212 participants); six studies used HRSD (Habrat 2006; Kranzler 2006 arm A; Kranzler 2006 arm B; Mason 1996; McGrath 1996; Moak 2003; 793 participants); and one study used BPRS (Butterworth 1971a; 39 participants). One study reported data obtained using both CGI and HRSD and we only used data obtained using CGI (Roy 1998; 36 participants). One study reported data for significant depression that were converted into response (Moak 2003; 82 participants). Two studies reported response criteria using self‐administered scales; these data were not included in the analyses (Cocchi 1997; Roy 1998).
Remission
Five studies reported remission (see Primary outcomes) (Adamson 2015; Gual 2003; Pettinati 2010 arm A; Pettinati 2010 arm B; Roy‐Byrne 2000; 455 participants) (see Appendix 8; Appendix 9). The studies used different interviewer‐rated scales or different cut‐off values of the same scale: one study used MADRS, final score less than 10 (Adamson 2015; 138 participants), one study used MADRS, final score less than 7 (Gual 2003; 83 participants), one study used HRSD, final score less than 8 (Roy‐Byrne 2000; 64 participants), and two studies used HRSD, final score 9 or less (Pettinati 2010 arm A; Pettinati 2010 arm B; 170 participants). Two studies reported remission criteria using self‐administered scales and we did not include these data in the analyses (Cocchi 1997; McLean 1986).
Alcohol consumption
The studies included in the present meta‐analysis did not report information on alcohol consumption as number of participants who reported use during treatment, or number of participants with positive breath alcohol analysis or urine analyses positive for alcohol (or alcohol consumption and positive breath alcohol analysis or urine analyses) (see Primary outcomes). Conversely, at least two studies reported the following information (see Characteristics of included studies table; Appendix 8; Appendix 9).
-
Nine studies reported the rate of abstinent days (Adamson 2015; Cornelius 1997; Gual 2003; Hernandez‐Avila 2004; Kranzler 2006 arm A; Kranzler 2006 arm B; McGrath 1996; Moak 2003; Pettinati 2001a; 821 participants).
-
Eight studies reported the number of abstinent participants during the trials (Cornelius 1997; Hernandez‐Avila 2004; McGrath 1996; Muhonen 2008; Pettinati 2001a; Pettinati 2010 arm A; Pettinati 2010 arm B; Roy‐Byrne 2000), 504 participants)
-
Two studies reported the number of drinking days per week (Cornelius 2016; Hernandez‐Avila 2004; 55 participants).
-
Seven studies reported the number of drinks per drinking days (Adamson 2015; Cornelius 1997; Cornelius 2016; Hernandez‐Avila 2004; McGrath 1996; Moak 2003; Roy‐Byrne 2000; 451 participants).
-
Two studies reported the number of drinks per week (Cornelius 2016; Hernandez‐Avila 2004; 55 participants).
-
Five studies reported the number of heavy drinking days per week (Adamson 2015; Cornelius 1997; Cornelius 2016; Hernandez‐Avila 2004; McGrath 1996; 513 participants) or it was calculated by other outcomes reported by the studies.
-
Seven studies reported the number of heavy drinkers (Gual 2003; Krupitsky 2012; Mason 1996; Moak 2003; Pettinati 2010 arm A; Pettinati 2010 arm B; Roy 1998; 459 participants).
-
Six studies reported the time to the first relapse in days (Cornelius 1997; Gual 2003; Krupitsky 2012; Pettinati 2001a; Pettinati 2010 arm A; Pettinati 2010 arm B; 393 participants) or it was calculated by other outcomes reported by the studies.
Liver enzyme levels
The studies included in the present meta‐analysis did not report information on ALT and AST (see Primary outcomes). Two studies reported the final levels of GGT (Hernandez‐Avila 2004; Krupitsky 2012; 101 participants) (see Appendix 8 and Appendix 9).
Three studies reported a global response both in depression and in alcohol consumption (Krupitsky 2012; McGrath 1996; Nunes 1993; 152 participants) (see Appendix 8 and Appendix 9).
Acceptability
Seventeen studies reported acceptability indicated by all‐cause dropouts (see Primary outcomes) (Altamura 1990; Butterworth 1971b; Cornelius 2016; Gallant 1969 arm a; Gual 2003; Hernandez‐Avila 2004; Kranzler 2006 arm A; Kranzler 2006 arm B; Krupitsky 2012; Mason 1996; McGrath 1996; McLean 1986; Moak 2003; Pettinati 2010 arm A; Pettinati 2010 arm B; Roy 1998; Roy‐Byrne 2000; 1156 participants) (see Appendix 8; Appendix 9).
Tolerability
Several studies evaluated tolerability of the treatment as number and type of adverse events experienced during the treatment (see Primary outcomes) (see Appendix 8; Appendix 9). Among the different adverse events, the following were reported by at least two studies:
-
Blurred vision evaluated by two studies (Butterworth 1971a; Roy‐Byrne 2000; 103 participants).
-
Constipation evaluated by four studies (Altintoprak 2008; Butterworth 1971a; Kranzler 2006 arm A; Roy‐Byrne 2000; 336 participants).
-
Depression evaluated by two studies (Kranzler 2006 arm A; Moak 2003; 413 participants).
-
Diarrhoea evaluated by two studies (Gual 2003; Roy‐Byrne 2000; 139 participants).
-
Dizziness evaluated by three studies (Altintoprak 2008; Gual 2003; Roy‐Byrne 2000; 183 participants).
-
Dry mouth evaluated by five studies (Altintoprak 2008; Butterworth 1971a; Gallant 1969 arm a; Gallant 1969 arm b; Roy‐Byrne 2000; 286 participants).
-
Headache evaluated by three studies (Gual 2003; Kranzler 2006 arm A; Roy‐Byrne 2000; 470 participants).
-
Increase in body weight reported by two studies (Altintoprak 2008; Cornelius 2016; 58 participants).
-
Insomnia evaluated by four studies (Adamson 2015; Butterworth 1971b; Kranzler 2006 arm A; Roy‐Byrne 2000; 564 participants).
-
Nausea evaluated by three studies (Adamson 2015; Gual 2003; Roy‐Byrne 2000; 277 participants).
-
Sedation evaluated by two studies (Altintoprak 2008; Roy‐Byrne 2000; 108 participants).
-
Total adverse effects evaluated by eight studies (Adamson 2015; Butterworth 1971b; Butterworth 1971a; Gallant 1969 arm a; Gallant 1969 arm b; Habrat 2006; Kranzler 2006 arm A; Krupitsky 2012; 1041 participants).
-
Total serious adverse events evaluated by seven studies (Adamson 2015; Butterworth 1971b; Cornelius 2016; Kranzler 2006 arm A; Moak 2003; Pettinati 2010 arm A; Pettinati 2010 arm B; 774 participants).
-
Withdrawal for medical reasons evaluated by ten studies (Adamson 2015; Cornelius 1997; Kranzler 2006 arm A; Krupitsky 2012; Mason 1996; McGrath 1996; Pettinati 2010 arm A; Pettinati 2010 arm B; Roy 1998; Roy‐Byrne 2000; 947 participants).
-
Worsening of clinical condition because of relapse evaluated by two studies (Kranzler 2006 arm A; Moak 2003; 413 participants).
Suicide and suicide attempts
Five studies evaluated suicide and suicidal attempts (see Primary outcomes) (Adamson 2015; Cornelius 1997; Habrat 2006; Kranzler 2006 arm A; Moak 2003; 888 participants) (see Appendix 8; Appendix 9).
Secondary outcomes
-
Participants with substance use disorders were excluded by most studies (see Characteristics of included studies table). Participants with substance use disorders were included by two studies (Adamson 2015; McGrath 1996; 83 participants). Two studies excluded participants with substance use disorders but included participants with abuse of other substances (Cornelius 1997; Roy‐Byrne 2000; 87 participants).
-
Four studies reported craving (see Secondary outcomes) (Altintoprak 2008; Cornelius 2016; Habrat 2006; Krupitsky 2012; 404 participants). They used different scales. One study used a questionnaire prepared by the authors (Altintoprak 2008; 44 participants). Three studies used the Obsessive‐Compulsive Drinking Scale (OCDS) (Cornelius 2016; Habrat 2006; Krupitsky 2012; 360 participants) (see Appendix 8; Appendix 9). One study used different scales but data obtained only with the OCDS were used (Krupitsky 2012; 60 participants).
-
Several studies reported severity of alcohol dependence (see Secondary outcomes) but asbaseline characteristics of recruited participants (see Characteristics of included studies table; Appendix 9). Three studies reported final data on the severity of alcohol dependence (see Appendix 8) (Adamson 2015; Hernandez‐Avila 2004; Muhonen 2008; 259 participants). Studies used different interviewer‐rated scales: Alcohol Use Disorders Identification Test (AUDIT) (Muhonen 2008; 80 participants), DrInC (Hernandez‐Avila 2004; 41 participants), and Leeds Dependence Questionnaire (LDQ) (Adamson 2015; 138 participants).
-
Studies reported baseline characteristics of recruited participants for psychiatric symptoms/psychological distress (see Secondary outcomes; Characteristics of included studies table). Eleven studies reported final score of anxiety severity (Altintoprak 2008; Habrat 2006; Hernandez‐Avila 2004; Krupitsky 1993 arm A; Krupitsky 1993 arm B; Krupitsky 2012; Liappas 2005 arm A; Liappas 2005 arm B; Liappas 2005 arm C; Lôo 1988; Muhonen 2008; 761 participants). Studies used several scales: an interviewer‐rated scale (see Appendix 8): Hamilton Anxiety Rating Scale (HRSA) (Habrat 2006; Krupitsky 2012; Liappas 2005 arm A; Liappas 2005 arm B; Liappas 2005 arm C; Lôo 1988; Muhonen 2008; 615 participants), and three self‐administered scales: Beck Anxiety Inventory (BAI) (Muhonen 2008; 80 participants), MMPI (Krupitsky 1993 arm A; Krupitsky 1993 arm B; 61 participants), and STAI (Altintoprak 2008; Hernandez‐Avila 2004; Krupitsky 1993 arm A; Krupitsky 1993 arm B; Krupitsky 2012; 206 participants).
Comparisons
-
Antidepressants versus placebo: 22 studies (Adamson 2015; Altamura 1990; Butterworth 1971b; Cornelius 1997; Cornelius 2016; Gallant 1969 arm a; Gual 2003; Hernandez‐Avila 2004; Kranzler 2006 arm A; Kranzler 2006 arm B; Krupitsky 1993 arm A; Krupitsky 2012; Mason 1996; McGrath 1996; McLean 1986; Moak 2003; Nunes 1993; Pettinati 2001a; Pettinati 2010 arm A; Pettinati 2010 arm B; Roy 1998; Roy‐Byrne 2000; 1438 participants).
-
Antidepressants versus psychotherapy: two studies (Liappas 2005 arm A; Liappas 2005 arm B; 60 participants) compared the efficacy of mirtazapine (Liappas 2005 arm A) or venlafaxine (Liappas 2005 arm B) versus psychotherapy for three weeks. Both studies had a high risk of bias.
-
Antidepressants versus other medications: four studies compared the efficacy of antidepressants to that of another medication (Butterworth 1971a; Gallant 1969 arm b; Krupitsky 1993 arm B; Muhonen 2008; 228 participants). Of these, one study compared amitriptyline to diazepam (Krupitsky 1993 arm B; 29 participants), two studies doxepin to diazepam (Butterworth 1971a; 39 participants; Gallant 1969 arm b; 71 participants), and one study escitalopram to memantine (Muhonen 2008; 80 participants). In this comparison, we included only the three studies comparing an antidepressant to diazepam (Butterworth 1971a; Gallant 1969 arm b; Krupitsky 1993 arm B; 148 participants). Only the final score of the severity of depression was reported by at least two of these studies.
-
An antidepressant versus another antidepressant: five studies compared the efficacy of an antidepressant versus another antidepressant (Altintoprak 2008; Cocchi 1997; Habrat 2006; Liappas 2005 arm A; Lôo 1988; 621 participants). Of these, one study compared mirtazapine (up to 60 mg/day) to amitriptyline (up to 150 mg/day) for eight weeks (Altintoprak 2008; 44 participants); one study mirtazapine (up to 60 mg/day) to venlafaxine (up to 300 mg/day) for three weeks (Liappas 2005 arm A; 40 participants); one study paroxetine (20 mg/day) to amitriptyline (25 mg/day) for three to four weeks (Cocchi 1997; 122 participants); one study tianeptine (37.5 mg/day) to amitriptyline (75 mg/day) for four to eight weeks (Lôo 1988; 129 participants); and one study tianeptine (37.5 mg/day) to fluvoxamine (100 mg/day) for six weeks (Habrat 2006; 286 participants). As the same comparison was not made by more than one study, it was not possible to conduct any analyses.
Subgroup analysis
We conducted subgroup analyses only for the comparison between antidepressants and placebo.
-
Twenty‐two studies reported the setting (see Subgroup analysis and investigation of heterogeneity): 15 studies were conducted in an outpatient setting (Adamson 2015; Cornelius 2016; Gual 2003; Hernandez‐Avila 2004; Kranzler 2006 arm A; Kranzler 2006 arm B; Krupitsky 2012; Mason 1996; McGrath 1996; Moak 2003; Nunes 1993; Pettinati 2001a; Pettinati 2010 arm A; Pettinati 2010 arm B; Roy‐Byrne 2000; 1129 participants), four studies in inpatient setting (Butterworth 1971b; Gallant 1969 arm a; Krupitsky 1993 arm A; McLean 1986; 192 participants), and three studies initially in an inpatient setting and then as outpatients (Altamura 1990; Cornelius 1997; Roy 1998; 117 participants). We investigated the possible role of this confounder factor for each analysis.
-
Sixteen studies reported the use of a lower starting dose (see Subgroup analysis and investigation of heterogeneity) (Adamson 2015; Butterworth 1971b; Cornelius 1997; Cornelius 2016; Gual 2003; Hernandez‐Avila 2004; Kranzler 2006 arm A; Kranzler 2006 arm B; Mason 1996; McGrath 1996; McLean 1986; Moak 2003; Pettinati 2001a; Pettinati 2010 arm A; Pettinati 2010 arm B; Roy‐Byrne 2000; 1172 participants). No study described a pattern of dose reduction. The possible protective role of a lower starting dose in reducing the risk of appearance of adverse events has not been investigated because there were no differences in number and types of adverse events between antidepressants and placebo.
-
All studies reported the duration of treatment (see Subgroup analysis and investigation of heterogeneity): 19 studies had a duration of four weeks or greater (Adamson 2015; Altamura 1990; Cornelius 1997; Cornelius 2016; Gual 2003; Hernandez‐Avila 2004; Kranzler 2006 arm A; Kranzler 2006 arm B; Krupitsky 2012; Mason 1996; McGrath 1996; McLean 1986; Moak 2003; Nunes 1993; Pettinati 2001aPettinati 2010 arm A; Pettinati 2010 arm B; Roy 1998; Roy‐Byrne 2000; 1281 participants), and three studies had a duration of less than four weeks (Butterworth 1971b; Gallant 1969 arm a; Krupitsky 1993 arm A; 157 participants). We investigated the possible role of this confounder factor for each analysis.
-
Fifteen studies evaluated the severity of depression at baseline using an interviewer‐rated scale (Adamson 2015; Altamura 1990; Cornelius 1997; Gual 2003; Hernandez‐Avila 2004; Kranzler 2006 arm A; Kranzler 2006 arm B; Krupitsky 2012; Mason 1996; McGrath 1996; Moak 2003; Pettinati 2010 arm A; Pettinati 2010 arm B; Roy 1998; Roy‐Byrne 2000; 1180 participants). One of these studies used the MADRS (Adamson 2015; 138 participants); the other 14 studies used the HRSD (Altamura 1990; Cornelius 1997; Gual 2003; Hernandez‐Avila 2004; Kranzler 2006 arm A; Kranzler 2006 arm B; Krupitsky 2012; Mason 1996; McGrath 1996; Moak 2003; Pettinati 2010 arm A; Pettinati 2010 arm B; Roy 1998; Roy‐Byrne 2000; 1042 participants) (see Characteristics of included studies table). According to these values, in five studies, the severity of depression ranged from the absence of depression or mild depression to severe or very severe (Cornelius 1997; Gual 2003; Krupitsky 2012; Mason 1996; McGrath 1996; 291 participants); in other eight studies, the severity of depression ranged from moderate to severe or very severe (Adamson 2015; Hernandez‐Avila 2004; Kranzler 2006 arm A; Moak 2003; Pettinati 2010 arm A; Pettinati 2010 arm B; Roy 1998; Roy‐Byrne 2000; 720 participants). Only one study included people with very severe depression (Altamura 1990; 30 participants), and another study with mild or moderate depression (Kranzler 2006 arm B; 139 participants). Accordingly, we did not evaluate this possible confounder factor.
-
Studies were divided according to the typology of depression, into studies with primary depression and with depression induced by alcohol consumption. Eleven studies recruited participants with primary depression (Adamson 2015; Cornelius 1997; Kranzler 2006 arm A; Krupitsky 1993 arm A; McGrath 1996; Moak 2003; Nunes 1993; Pettinati 2010 arm A; Pettinati 2010 arm B; Roy 1998 arm A; Roy‐Byrne 2000; 842 participants); three studies recruited participants with depression induced by alcohol consumption (Kranzler 2006 arm B; Mason 1996; Roy 1998 arm B; 188 participants). The other studies did not report typology of depression and we excluded them from these analyses).
-
Three studies evaluated the severity of alcohol dependence at baseline using the number of positive diagnostic criteria (Cornelius 1997; Kranzler 2006 arm A; Kranzler 2006 arm B; 379 participants) (see Characteristics of included studies). One study used the DSM‐III criteria and reported a baseline severity ranging from 3.9 to 7.7 positive criteria (Cornelius 1997; 51 participants); the other two studies used the DSM IV criteria and reported a baseline severity ranging from 3.4 to 6.4 (Kranzler 2006 arm A; Kranzler 2006 arm B; 328 participants). Accordingly, it was not feasible to evaluate this possible confounder factor.
-
Twenty studies reported if participants were actively drinking alcohol at the beginning of the trial (see Subgroup analysis and investigation of heterogeneity): in 12 studies, participants were actively drinking (Adamson 2015; Cornelius 1997; Cornelius 2016; Hernandez‐Avila 2004; Kranzler 2006 arm A; Kranzler 2006 arm B; McGrath 1996; Moak 2003; Pettinati 2001a; Pettinati 2010 arm A; Pettinati 2010 arm B; Roy‐Byrne 2000; 986 participants) and in eight studies, participants were not actively drinking (Butterworth 1971b; Gual 2003; Krupitsky 1993 arm A; Krupitsky 2012; Mason 1996; McLean 1986; Nunes 1993; Roy 1998; 346 participants). The other studies did not report this information. We investigated the possible role of this confounder factor for each analysis.
-
Nine studies reported the length of abstinence (see Subgroup analysis and investigation of heterogeneity) (Butterworth 1971b; Gual 2003; Kranzler 2006 arm A; Kranzler 2006 arm B; Krupitsky 1993 arm A; Krupitsky 2012; Mason 1996; Nunes 1993; Roy 1998; 639 participants). Its possible confounder role has not been evaluated because it ranged from a minimum of few days (Butterworth 1971b) to a maximum of 12 weeks (Nunes 1993), also within the same study (Mason 1996).
-
Fourteen studies used the presence of other psychiatric disorders, including bipolar disorder as an exclusion criterion (see Subgroup analysis and investigation of heterogeneity) (Adamson 2015; Butterworth 1971b; Cornelius 1997; Gual 2003; Hernandez‐Avila 2004; Kranzler 2006 arm A; Kranzler 2006 arm B; Krupitsky 2012; McGrath 1996; Moak 2003; Pettinati 2001a; Pettinati 2010 arm A; Pettinati 2010 arm B; Roy 1998). The majority of the other studies did not report information on possible comorbid psychiatric disorders. Accordingly, it was not feasible to evaluate this possible confounder factor.
-
Three studies allowed the use of other pharmacological treatments (see Subgroup analysis and investigation of heterogeneity) (Adamson 2015; Butterworth 1971b; McLean 1986). The low number of studies precluded the possibility to evaluate this possible confounder factor.
-
Fifteen studies offered apsychosocial treatment to participants (see Subgroup analysis and investigation of heterogeneity and Appendix 10) (Adamson 2015; Cornelius 1997; Cornelius 2016; Hernandez‐Avila 2004; Kranzler 2006 arm A; Kranzler 2006 arm B; Krupitsky 2012; Mason 1996; McGrath 1996; McLean 1986; Moak 2003; Pettinati 2001a; Pettinati 2010 arm A; Pettinati 2010 arm B; Roy‐Byrne 2000; 1109 participants). Two studies did not offer a psychosocial treatment to participants (Butterworth 1971b; Krupitsky 1993 arm A; 81 participants), whereas the other studies did not provide information on this issue. We investigated the possible role of this confounder factor for each analysis.
Excluded studies
We excluded 55 published articles for the following reasons: the study design did not meet the inclusion criteria (26 studies); the study relied on the same database as used in another (not included trial; one study); the study population did not meet the inclusion criteria (23 studies); and there was a lack of information (five studies). For details, see Characteristics of excluded studies table.
Risk of bias in included studies
All 33 studies were RCTs.
Allocation
We judged the random sequence generation adequately prevented (i.e. there was a low risk of bias) in 14 studies. For the remaining 19 studies, the risk of selection bias was unclear. There was no study in which the random sequence generation was inadequate (i.e. there was a high risk of bias).
Nine studies had adequately prevented (low risk) allocation concealment. In the other 24 studies, the details provided did not allow a specific evaluation of the procedures adopted to prevent participants and investigators from foreseeing the assignment.
Blinding
We judged the blinding of participants and personnel (performance bias) as low risk in 15 studies, as high risk in seven studies, and as unclear risk in the remaining 11 studies.
We judged the blinding of outcome assessment (detection bias; objective outcomes) as low risk in all 33 studies, whereas blinding of outcome assessment (detection bias; subjective outcomes) was at low risk in two studies, at high risk in six studies, and as unclear risk in the remaining 25 studies.
Incomplete outcome data
The risk of incomplete outcome data (attrition bias) was at low risk in 15 studies, at high risk in 13 studies, and at unclear risk in the remaining five studies.
Selective reporting
We judged missing data on at low risk in 13 studies, high risk in nine studies, and as having unclear risk in the other 11 studies.
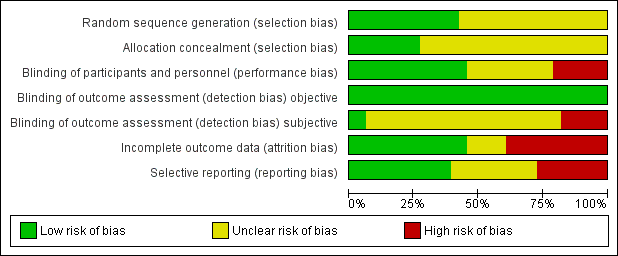
Risk of bias graph: review authors' judgements about each risk of bias item presented as percentages across all included studies.

Risk of bias summary: review authors' judgements about each risk of bias item for each included study.
Effects of interventions
We compared quantitative data where at least two of the included studies reported the same outcome measures (see Appendix 8; Appendix 9). For some outcomes, it was impossible to pool data due to variations in the reporting of results, for instance different rating methods and the fact that authors did not identify the data required to proceed with the meta‐analysis. If there was significant heterogeneity, the results of the comparisons were first reported by including all studies, and thereafter by excluding studies with high risk of bias in one or more domains.
Antidepressants versus placebo
Primary outcome: depression severity
Final score (interviewer‐rated scales)
The studies used different interviewer‐rated scales, therefore, we used SMDs (see Appendix 8; Appendix 9). Two studies reported data of two interviewer‐rated scales (MADRS and HRSD) and we included only data obtained using HRSD (Gual 2003; Krupitsky 2012).
All studies
The analysis found low‐quality evidence of a significantly lower final score among participants treated with antidepressants compared to placebo (P = 0.02), with substantial evidence of heterogeneity (14 studies; 1074 participants; SMD ‐0.27, 95% CI ‐0.49 to ‐0.04; Tau² = 0.11; Chi² = 39.01, degrees of freedom (df) = 13 (P = 0.0002); I² = 67%; Analysis 1.1; summary of findings Table for the main comparison; Figure 4) (Adamson 2015; Altamura 1990; Gual 2003; Hernandez‐Avila 2004; Kranzler 2006 arm A; Kranzler 2006 arm B; Krupitsky 2012; McGrath 1996; Moak 2003; Pettinati 2001a; Pettinati 2010 arm A; Pettinati 2010 arm B; Roy 1998; Roy‐Byrne 2000).

Funnel plot of comparison: 1 Antidepressants versus placebo: all studies, outcome: 1.1 Depression severity: final score (interviewer‐rated scales).
Different classes of antidepressants and single antidepressant
The subgroup analyses found no differences in final score between SSRIs and placebo (10 studies; 881 participants; Analysis 1.1; Figure 4) (Adamson 2015; Gual 2003; Kranzler 2006 arm A; Kranzler 2006 arm B; Krupitsky 2012; Moak 2003; Pettinati 2001a; Pettinati 2010 arm A; Pettinati 2010 arm B; Roy 1998), and 5‐HT2 antagonists and placebo (2 studies; 97 participants; Analysis 1.1; Figure 4) (Hernandez‐Avila 2004; Roy‐Byrne 2000).
There were no differences in final score between sertraline and placebo (8 studies; 728 participants; analysis not shown) (Gual 2003; Kranzler 2006 arm A; Kranzler 2006 arm B; Moak 2003; Pettinati 2001a; Pettinati 2010 arm A; Pettinati 2010 arm B; Roy 1998) and nefazodone and placebo (2 studies; 97 participants ; analysis not shown) (Hernandez‐Avila 2004; Roy‐Byrne 2000).
Confounder factors
The analyses found a significantly lower final score for antidepressants among the studies with a duration four weeks or greater (P = 0.02), with substantial evidence of heterogeneity (14 studies; 1074 participants; SMD ‐0.27, 95% CI ‐0.49 to ‐0.04; Tau² = 0.11; Chi² = 39.01, df = 13 (P = 0.0002); I² = 67%; Analysis 1.1) (Adamson 2015; Altamura 1990; Gual 2003; Hernandez‐Avila 2004; Kranzler 2006 arm A; Kranzler 2006 arm B; Krupitsky 2012; McGrath 1996; Moak 2003; Pettinati 2001a; Pettinati 2010 arm A; Pettinati 2010 arm B; Roy 1998; Roy‐Byrne 2000).
There was a significantly lower final score for antidepressants among the studies conducted in inpatient and outpatient settings (P < 0.00001) (2 studies; 63 participants; SMD ‐1.74, 95% CI ‐2.33 to ‐1.15) (Altamura 1990; Roy 1998). One of the studies had a high risk of bias (Altamura 1990).
There were no differences in final score between antidepressants and placebo among the studies:
-
without high risk of bias (11 studies; 963 participants) (Adamson 2015; Gual 2003; Hernandez‐Avila 2004; Kranzler 2006 arm A; Kranzler 2006 arm B; Moak 2003; Pettinati 2001a; Pettinati 2010 arm A; Pettinati 2010 arm B; Roy 1998; Roy‐Byrne 2000);
-
conducted in an outpatient setting (12 studies; 1011 participants; SMD ‐0.11, 95% CI ‐0.24 to 0.01), with no evidence of heterogeneity (Adamson 2015; Gual 2003; Hernandez‐Avila 2004; Kranzler 2006 arm A; Kranzler 2006 arm B; Krupitsky 2012; McGrath 1996; Moak 2003; Pettinati 2001a; Pettinati 2010 arm A; Pettinati 2010 arm B; Roy‐Byrne 2000);
-
with primary depression (8 studies; 719 participants; SMD ‐0.14, 95% CI ‐0.28 to 0.01), with no evidence of heterogeneity (Adamson 2015; Kranzler 2006 arm A; McGrath 1996; Moak 2003; Pettinati 2010 arm A; Pettinati 2010 arm B; Roy 1998 arm A; Roy‐Byrne 2000);
-
with secondary depression (2 studies; 160 participants) (Kranzler 2006 arm B; Roy 1998 arm B);
-
with participants who were actively drinking at the beginning of the trial (10 studies; 913 participants) (Adamson 2015; Hernandez‐Avila 2004; Kranzler 2006 arm A; Kranzler 2006 arm B; McGrath 1996; Moak 2003; Pettinati 2001a; Pettinati 2010 arm A; Pettinati 2010 arm B; Roy‐Byrne 2000);
-
with participants who were not actively drinking at the beginning of the trial, with substantial evidence of heterogeneity (3 studies; 134 participants; SMD ‐0.80, 95% CI ‐1.65 to 0.005; Tau² = 0.42; Chi² = 8.08, df = 2 (P = 0.02); I² = 75%) (Gual 2003; Krupitsky 2012; Roy 1998); and
-
with psychotherapy (11 studies; 928 participants) (Adamson 2015; Hernandez‐Avila 2004; Kranzler 2006 arm A; Kranzler 2006 arm B; Krupitsky 2012; McGrath 1996; Moak 2003; Pettinati 2001a; Pettinati 2010 arm A; Pettinati 2010 arm B; Roy‐Byrne 2000).
Final score (self‐administered scales)
The studies used different interviewer‐rated scales, therefore, we used SMDs. One study reported data obtained using the MMPI and ZUNG and we included only data obtained with ZUNG (Krupitsky 1993 arm A; 41 participants).
All studies
The analysis found no significant difference in final score between antidepressants and placebo with substantial evidence of heterogeneity (8 studies; 373 participants; SMD ‐0.29, 95% CI ‐0.64 to 0.07; Tau² = 0.13; Chi² = 15.94, df = 7 (P = 0.03); I² = 56%; Analysis 1.2) (Adamson 2015; Cornelius 2016; Krupitsky 1993 arm A; Krupitsky 2012; McLean 1986; Moak 2003; Pettinati 2001a; Roy 1998).
Different classes of antidepressants and single antidepressant
The subgroup analyses found no difference in final score between SSRIs and placebo (5 studies; 300 participants; Analysis 1.2) (Adamson 2015; Krupitsky 2012; Moak 2003; Pettinati 2001a; Roy 1998), and 5‐HT2 antagonists and placebo (2 studies; 41 participants; Analysis 1.2) (Cornelius 2016; McLean 1986). There were no other comparisons with at least two studies.
There were no differences in final score between sertraline and placebo (3 studies; 147 participants; analysis not shown) (Moak 2003; Pettinati 2001a; Roy 1998). There were no other comparisons with at least two studies.
Confounder factors
There were no differences in final score between antidepressants and placebo among the studies:
-
without high risk of bias (5 studies; 299 participants) (Adamson 2015; Cornelius 2016; Moak 2003; Pettinati 2001a; Roy 1998);
-
with a duration of four weeks or greater (6 studies; 259 participants) (Adamson 2015; Cornelius 2016; Krupitsky 2012; McLean 1986; Pettinati 2001a; Roy 1998);
-
conducted in an outpatient setting (5 studies; 278 participants) (Adamson 2015; Cornelius 2016; Krupitsky 2012; Moak 2003; Pettinati 2001a);
-
conducted in an inpatient setting (2 studies; 59 participants) (Krupitsky 1993 arm A; McLean 1986);
-
in which participants were actively drinking at the beginning of the trial (4 studies; 263 participants) (Adamson 2015; Cornelius 2016; Moak 2003; Pettinati 2001a);
-
with participants who were not actively drinking at the beginning of the trial (4 studies; 110 participants) (Krupitsky 1993 arm A; Krupitsky 2012; McLean 1986; Roy 1998);
-
with primary depression (4 studies; 267 participants) (Adamson 2015; Krupitsky 1993 arm A; Moak 2003; Roy 1998); and
-
with psychotherapy (6 studies; 305 participants) (Adamson 2015; Cornelius 2016; Krupitsky 2012; McLean 1986; Moak 2003; Pettinati 2001a). Analyses not shown.
Differences between baseline and final score (interviewer‐rated scales)
The studies used different interviewer‐rated scales, therefore, we used SMDs.
All studies
The analysis found no difference between antidepressants and placebo, with no evidence of heterogeneity (5 studies; 447 participants; SMD 0.15, 95% CI ‐0.12 to 0.42; Analysis 1.3) (Butterworth 1971b; Cornelius 1997; Kranzler 2006 arm A; Kranzler 2006 arm B; Pettinati 2001a).
Different classes of antidepressants and single antidepressant
There were no differences between SSRIs and placebo (4 studies; 408 participants; Analysis 1.3) (Cornelius 1997; Kranzler 2006 arm A; Kranzler 2006 arm B; Pettinati 2001a), and sertraline and placebo (3 studies; 357 participants; Analysis 1.3) (Kranzler 2006 arm A; Kranzler 2006 arm B; Pettinati 2001a).
Confounder factors
There were no differences between antidepressants and placebo when other possible confounder factors were examined (high risk of bias, duration of study, typology of depression, typology of setting, being actively drinking at the beginning of the study, and receiving psychotherapy) (analyses not shown).
Differences between baseline and final score (self‐administered scales)
The studies used different interviewer‐rated scales, therefore, we used SMDs.
All studies
The analysis found no difference between antidepressants and placebo, with no evidence of heterogeneity (4 studies; 121 participants; SMD 0.20, 95% CI ‐0.16 to 0.56; Analysis 1.4) (Cornelius 1997; Cornelius 2016; McLean 1986; Pettinati 2001a).
Different classes of antidepressants and single antidepressants
There was no difference between SSRIs and placebo (2 studies; 80 participants; Analysis 1.4) (Cornelius 1997; Pettinati 2001a), and 5‐HT2 antagonists and placebo (2 studies; 41 participants; Analysis 1.4) (Cornelius 2016; McLean 1986).
Confounder factors
The analyses found no differences between antidepressants and placebo when possible confounder factors were examined (high risk of bias, duration of study, typology of depression, typology of setting, being actively drinking at the beginning of the study, and receiving psychotherapy) (analyses not shown).
Primary outcome: response to antidepressive treatment
All studies
The analysis found very low‐quality evidence of a significantly higher number of responses among participants who received antidepressants than placebo (P = 0.01), with substantial evidence of heterogeneity (10 studies; 805 participants; RR 1.40, 95% CI 1.08 to 1.82; Tau² = 0.10; Chi² = 31.63, df = 9 (P = 0.0002); I² = 72%; Analysis 1.5; summary of findings Table for the main comparison; Figure 5) (Butterworth 1971b; Gallant 1969 arm a; Gual 2003; Kranzler 2006 arm A; Kranzler 2006 arm B; Mason 1996; McGrath 1996; Moak 2003; Roy 1998; Roy‐Byrne 2000).

Funnel plot of comparison: 1 Antidepressants versus placebo: all studies, outcome: 1.5 Response to antidepressive treatment.
Different classes of antidepressants and single antidepressant
For the subgroup analyses, the analysis found a significantly higher number of responses among participants who received TCAs compared to placebo (P = 0.02), with no evidence of heterogeneity (4 studies; 212 participants; RR 1.60, 95% CI 1.09 to 2.34; Analysis 1.5; Figure 5) (Butterworth 1971b; Gallant 1969 arm a; Mason 1996; McGrath 1996). However, three of these four studies had a high risk of bias. There were no differences in the number of responses between SSRIs and placebo, with substantial evidence of heterogeneity (5 studies; 529 participants; RR 1.19, 95% CI 0.87 to 1.63; Tau² = 0.09; Chi² = 17.60, df = 4 (P = 0.001); I² = 77%; Analysis 1.5; Figure 5) (Gual 2003; Kranzler 2006 arm A; Kranzler 2006 arm B; Moak 2003; Roy 1998).
There was a significantly higher number of responses among participants who received imipramine (P = 0.02), with no evidence of heterogeneity (2 studies; 108 participants; RR 1.68, 95% CI 1.07 to 2.63; analysis not shown) (Butterworth 1971b; McGrath 1996). Both these studies had a high risk of bias. There was no difference between sertraline and placebo in the number of responses, with substantial evidence of heterogeneity (5 studies; 529 participants; RR 1.19, 95% CI 0.87 to 1.63; Tau² = 0.09; Chi² = 17.60, df = 4 (P = 0.001); I² = 77%; Analysis 1.5) (Gual 2003; Kranzler 2006 arm A; Kranzler 2006 arm B; Moak 2003; Roy 1998).
Confounder factors
The analysis found a significantly higher number of responses among participants who received antidepressants among the studies: with a duration of four weeks or greater (P = 0.04), with significant evidence of heterogeneity (8 studies; 690 participants; RR 1.40, 95% CI 1.02 to 1.91; Tau² = 0.12; Chi² = 28.51, df = 7 (P = 0.0002); I² = 75%) (Gual 2003; Kranzler 2006 arm A; Kranzler 2006 arm B; Mason 1996; McGrath 1996; Moak 2003; Roy 1998; Roy‐Byrne 2000); and with primary depression (P = 0.007), with no evidence of heterogeneity (4 studies; 404 participants; RR 1.36, 95% CI 1.09 to 1.70) (Kranzler 2006 arm A; McGrath 1996; Moak 2003; Roy‐Byrne 2000). One of these studies had a high risk of bias (McGrath 1996). However, the analysis found a significantly higher number of responses among participants who received antidepressants also after the exclusion of this study (P = 0.02), with no evidence of heterogeneity (3 studies; 335 participants; RR 1.40, 95% CI 1.05 to 1.87) (Kranzler 2006 arm A; Moak 2003; Roy‐Byrne 2000).
There were no differences between antidepressants and placebo in the number of responses among the studies:
-
without high risk of bias, with substantial evidence of heterogeneity (7 studies; 669 participants; RR 1.27, 95% CI 0.96 to 1.68; Tau² = 0.09; Chi² = 23.20, df = 6 (P = 0.0007); I² = 74%) (Gallant 1969 arm a; Gual 2003; Kranzler 2006 arm A; Kranzler 2006 arm B; Moak 2003; Roy 1998; Roy‐Byrne 2000);
-
conducted in an outpatient setting, with substantial evidence of heterogeneity (7 studies; 654 participants; RR 1.30, 95% CI 0.96 to 1.76; Tau² = 0.10; Chi² = 23.69, df = 6 (P = 0.0006); I² = 75%) (Gual 2003; Kranzler 2006 arm A; Kranzler 2006 arm B; Mason 1996; McGrath 1996; Moak 2003; Roy‐Byrne 2000);
-
conducted an inpatient setting (2 studies; 115 participants; RR 1.48, 95% CI 0.94 to 2.32), with no evidence of heterogeneity (Butterworth 1971b; Gallant 1969 arm a);
-
with a duration less than four weeks (P = 0.09), with no evidence of heterogeneity (2 studies; 115 participants; RR 1.48, 95% CI 0.94 to 2.32) (Butterworth 1971b; Gallant 1969 arm a); and
-
in which participants received psychotherapy, with substantial evidence of heterogeneity (6 studies; 571 participants; RR 1.35, 95% CI 0.95 to 1.92; Tau² = 0.12; Chi² = 23.85, df = 5 (P = 0.0002); I² = 79%) (Kranzler 2006 arm A; Kranzler 2006 arm B; Mason 1996; McGrath 1996; Moak 2003; Roy‐Byrne 2000);
-
in which participants were actively drinking at the beginning of the trial (5 studies; 543 participants; RR 1.23, 95% CI 0.88 to 1.72) (Kranzler 2006 arm A; Kranzler 2006 arm B; McGrath 1996; Moak 2003; Roy‐Byrne 2000); and
-
in which participants were not actively drinking at the beginning of the trial (2 studies; 111 participants; RR 1.81, 95% CI 0.60 to 5.45) (Gual 2003; Mason 1996). Analyses not shown.
Primary outcome: full remission of depression
All studies
The analysis found no significant difference in the number of remissions between antidepressants and placebo, with a substantial evidence of heterogeneity (4 studies; 372 participants; RR 1.19, 95% CI 0.77 to 1.83; Tau² = 0.12; Chi² = 8.82, df = 3 (P = 0.03); I² = 66%; Analysis 1.6) (Adamson 2015; Pettinati 2010 arm A; Pettinati 2010 arm B; Roy‐Byrne 2000).
Different classes of antidepressants and single antidepressant
There was no difference in the number of remissions between SSRIs and placebo, with no evidence of heterogeneity (3 studies; 308 participants; RR 1.00, 95% CI 0.74 to 1.36; Tau² = 0.03; Chi² = 3.10, df = 2 (P = 0.21); I² = 35%; Analysis 1.6) (Adamson 2015; Pettinati 2010 arm A; Pettinati 2010 arm B).
There was no difference in the number of remissions between sertraline and placebo, with no evidence of heterogeneity (2 studies; 170 participants; RR 1.18, 95% CI 0.83 to 1.67; Tau² = 0.00; Chi² = 1.07, df = 1 (P = 0.30); I² = 7%; analysis not shown) (Pettinati 2010 arm A; Pettinati 2010 arm B).
Confounder factors
All the studies (4 studies; 372 participants; RR 1.19, 95% CI 0.77 to 1.83; Tau² = 0.12; Chi² = 8.82, df = 3 (P = 0.03); I² = 66%; Analysis 1.6) were without high risk of bias, with a duration of four weeks or greater, conducted in an outpatient setting, with primary depression, with participants who were not actively drinking at the beginning of the trial, and with psychotherapy (Adamson 2015; Pettinati 2010 arm A; Pettinati 2010 arm B; Roy‐Byrne 2000).
Primary outcome: consumption of alcohol
Abstinent days (%)
All studies
There was low‐quality evidence that the rate of abstinent days did not differ between antidepressants and placebo (9 studies; 821 participants; MD 1.34%, 95% CI ‐1.66% to 4.34%; Analysis 1.7; summary of findings Table for the main comparison) (Adamson 2015; Cornelius 1997; Gual 2003; Hernandez‐Avila 2004; Kranzler 2006 arm A; Kranzler 2006 arm B; McGrath 1996; Moak 2003; Pettinati 2001a).
For the five studies where the SDs were not available (Cornelius 1997; Gual 2003; Hernandez‐Avila 2004; McGrath 1996; Pettinati 2001a), we imputed SDs using the mean value of SD calculated from the other four studies (Adamson 2015; Kranzler 2006 arm A; Kranzler 2006 arm B; Moak 2003). Sensitivity analysis, excluding studies without SDs, showed no evidence of difference between antidepressants and placebo (MD ‐1.37 abstinent days, 95% CI ‐3.96 to 1.21).
Different classes of antidepressants and single antidepressant
There were no differences in the rate of abstinent days between SSRIs and placebo (7 studies; 711 participants; analysis not shown) (Adamson 2015; Cornelius 1997; Gual 2003; Kranzler 2006 arm A; Kranzler 2006 arm B; Moak 2003; Pettinati 2001a), and sertraline and placebo (5 studies; 522 participants; analysis not shown) (Gual 2003; Kranzler 2006 arm A; Kranzler 2006 arm B; Moak 2003; Pettinati 2001a).
Confounder factors
The rate of abstinent days did not differ between antidepressants and placebo when possible confounder factors were examined. Analysis not shown.
Abstinent participants
All studies
The analysis found moderate‐quality evidence of a higher number of abstinents among participants who received antidepressants than placebo (P = 0.002), with no evidence of heterogeneity (7 studies; 424 participants; RR 1.71, 95% CI 1.22 to 2.39; Analysis 1.8; summary of findings Table for the main comparison) (Cornelius 1997; Hernandez‐Avila 2004; McGrath 1996; Pettinati 2001a; Pettinati 2010 arm A; Pettinati 2010 arm B; Roy‐Byrne 2000).
Different classes of antidepressants and single antidepressant
The analyses found a higher number of abstinents among participants who received SSRIs (P = 0.04), with no evidence of heterogeneity (4 studies; 250 participants; RR 1.66, 95% CI 1.02 to 2.68; Analysis 1.8) (Cornelius 1997; Pettinati 2001a; Pettinati 2010 arm A; Pettinati 2010 arm B). There were no differences in the number of abstinents between 5‐HT2 antagonists and placebo (2 studies; 105 participants; Analysis 1.8) (Hernandez‐Avila 2004; Roy‐Byrne 2000).
There were no differences in the number of abstinents between sertraline and placebo (3 studies; 199 participants; analysis not shown) (Pettinati 2001a; Pettinati 2010 arm A; Pettinati 2010 arm B), and nefazodone and placebo (2 studies; 105 participants; analysis not shown) (Hernandez‐Avila 2004; Roy‐Byrne 2000).
Confounder factors
The analyses found a higher number of abstinents among participants treated with antidepressants among the studies:
-
without high risk of bias (P = 0.005), with no evidence of heterogeneity (6 studies; 355 participants; RR 1.69, 95% CI 1.18 to 2.43) (Cornelius 1997; Hernandez‐Avila 2004; Pettinati 2001a; Pettinati 2010 arm A; Pettinati 2010 arm B; Roy‐Byrne 2000);
-
with a duration of four weeks or greater (P = 0.002), with no evidence of heterogeneity (7 studies; 424 participants; RR 1.71, 95% CI 1.22 to 2.39) (Cornelius 1997; Hernandez‐Avila 2004; McGrath 1996; Pettinati 2001a; Pettinati 2010 arm A; Pettinati 2010 arm B; Roy‐Byrne 2000);
-
with primary depression (P = 0.002), with no evidence of heterogeneity (5 studies; 354 participants; RR 1.78, 95% CI 1.24 to 2.55) (Cornelius 1997; McGrath 1996; Pettinati 2010 arm A; Pettinati 2010 arm B; Roy‐Byrne 2000);
-
conducted in an outpatient setting (P = 0.003), with no evidence of heterogeneity (6 studies; 373 participants; RR 1.70, 95% CI 1.20 to 2.41) (Hernandez‐Avila 2004; McGrath 1996; Pettinati 2001a; Pettinati 2010 arm A; Pettinati 2010 arm B; Roy‐Byrne 2000);
-
with participants who were actively drinking at the beginning of the trial (P = 0.002), with no evidence of heterogeneity (7 studies; 424 participants; RR 1.71, 95% CI 1.22 to 2.39) (Cornelius 1997; Hernandez‐Avila 2004; McGrath 1996; Pettinati 2001a; Pettinati 2010 arm A; Pettinati 2010 arm B; Roy‐Byrne 2000); and
-
with psychotherapy (P = 0.002), with no evidence of heterogeneity (7 studies; 424 participants; RR 1.71, 95% CI 1.22 to 2.39) (Cornelius 1997; Hernandez‐Avila 2004; McGrath 1996; Pettinati 2001a; Pettinati 2010 arm A; Pettinati 2010 arm B; Roy‐Byrne 2000). Analyses not shown.
Drinking days (per week)
All studies
The analysis found no difference between antidepressants and placebo, with no evidence of heterogeneity (2 studies; 55 participants; MD ‐1.15 days/week, 95% CI ‐2.35 to 0.05; Analysis 1.9) (Cornelius 2016; Hernandez‐Avila 2004).
Different classes of antidepressants and single antidepressant
The analysis found no difference between 5‐HT2 antagonists and placebo, with no evidence of heterogeneity (2 studies; 55 participants; MD ‐1.15 days/week, 95% CI ‐2.35 to 0.05) (Cornelius 2016; Hernandez‐Avila 2004).
Confounder factors
There were no differences between antidepressants and placebo in the number of drinking days per week when possible confounder factors were examined (analyses not shown).
Drinks (per drinking day)
All studies
The analysis found moderate‐quality evidence of a significantly lower number of drinks per drinking days among participants who received antidepressants compared to placebo (P = 0.0009), with no evidence of heterogeneity (7 studies; 451 participants; MD ‐1.13 drinks/drinking day, 95% CI ‐1.79 to ‐0.46; Analysis 1.10; summary of findings Table for the main comparison) (Adamson 2015; Cornelius 1997; Cornelius 2016; Hernandez‐Avila 2004; McGrath 1996; Moak 2003; Roy‐Byrne 2000).
Different classes of antidepressants and single antidepressant
The analysis found a significantly lower number of drinks per drinking days among participants who received SSRIs (P = 0.02) (3 studies; 271 participants; MD ‐1.42 drinks/drinking day, 95% CI ‐2.58 to ‐0.26; Analysis 1.10) (Adamson 2015; Cornelius 1997; Moak 2003), and 5‐HT2 antagonists (P = 0.03) (3 studies; 111 participants; MD ‐1.06 drinks/drinking day, 95% CI ‐2.00 to ‐0.11; Analysis 1.10) (Cornelius 2016; Hernandez‐Avila 2004; Roy‐Byrne 2000). The number of drinks per drinking days did not differ between nefazodone and placebo, with no evidence of heterogeneity (2 studies; 97 participants; MD ‐1.14 drinks/drinking day, 95% CI ‐2.30 to 0.03; analysis not shown) (Hernandez‐Avila 2004; Roy‐Byrne 2000).
Confounder factors
The analysis found a significantly lower number of drinks per drinking days among participants treated with antidepressants among the studies:
-
without high risk of bias (P = 0.0007), with no evidence of heterogeneity (6 studies; 382 participants; MD ‐1.21 drinks/drinking day, 95% CI ‐1.91 to ‐0.51) (Adamson 2015; Cornelius 1997; Cornelius 2016; Hernandez‐Avila 2004; Moak 2003; Roy‐Byrne 2000);
-
with a duration of four weeks or longer (P = 0.006), with no evidence of heterogeneity (6 studies; 400 participants; MD ‐0.97 drinks/drinking day, 95% CI ‐1.66 to ‐0.28) (Adamson 2015; Cornelius 2016; Hernandez‐Avila 2004; McGrath 1996; Moak 2003; Roy‐Byrne 2000);
-
with primary depression (P = 0.005), with no evidence of heterogeneity (5 studies; 396 participants; MD ‐1.20 drinks/drinking day, 95% CI ‐2.03 to ‐0.36) (Adamson 2015; Cornelius 1997; McGrath 1996; Moak 2003; Roy‐Byrne 2000);
-
conducted in an outpatient setting (P = 0.006), with no evidence of heterogeneity (6 studies; 400 participants; MD ‐0.97 drinks/drinking day, 95% CI ‐1.66 to ‐0.28) (Adamson 2015; Cornelius 2016; Hernandez‐Avila 2004; McGrath 1996; Moak 2003; Roy‐Byrne 2000);
-
with participants who were actively drinking at the beginning of the trial (P = 0.009), with no evidence of heterogeneity (7 studies; 451 participants; MD ‐1.13 drinks/drinking day, 95% CI ‐1.79 to ‐0.46) (Adamson 2015; Cornelius 1997; Cornelius 2016; Hernandez‐Avila 2004; McGrath 1996; Moak 2003; Roy‐Byrne 2000); and
-
with psychotherapy (P = 0.002), with no evidence of heterogeneity (6 studies; 395 participants; MD ‐1.12 drinks/drinking day, 95% CI ‐1.83 to ‐0.41) (Adamson 2015; Cornelius 1997; Cornelius 2016; Hernandez‐Avila 2004; McGrath 1996; Moak 2003). Analyses not shown.
Drinks (per week)
All studies
The analysis found no difference between antidepressants and placebo, with no evidence of heterogeneity (2 studies; 55 participants; MD ‐5.06 drinks/week, 95% CI ‐12.30 to 2.18; Analysis 1.11) (Cornelius 2016; Hernandez‐Avila 2004).
Different classes of antidepressants and single antidepressant
The analysis found no difference between 5‐HT2 antagonists and placebo, with no evidence of heterogeneity (2 studies; 55 participants; Analysis 1.11) (Cornelius 2016; Hernandez‐Avila 2004).
Confounder factors
There were no differences between antidepressants and placebo in the number of drinks per week when possible confounder factors were examined (analyses not shown).
Heavy drinking days (per week)
All studies
The analysis found no difference between antidepressants and placebo, with substantial evidence of heterogeneity (5 studies; 313 participants; MD ‐0.33 heavy drinking days/week, 95% CI ‐0.85 to 0.20; Tau² = 0.25; Chi² = 15.22, df = 4 (P = 0.004); I² = 74%; Analysis 1.12) (Adamson 2015; Cornelius 1997; Cornelius 2016; Hernandez‐Avila 2004; McGrath 1996). Because the SDs were not available for three studies, we used the mean of the SDs of the other studies.
Different classes of antidepressants and single antidepressant
The analysis found no difference between SSRIs and placebo (2 studies; 189 participants; MD ‐0.41 heavy drinking days/week, 95% CI ‐1.09 to 0.27; Analysis 1.12) (Adamson 2015; Cornelius 1997), and 5‐HT2 antagonists and placebo (2 studies; 55 participants; MD ‐0.43 heavy drinking days/week, 95% CI ‐2.09 to 1.22; Analysis 1.12) (Cornelius 2016; Hernandez‐Avila 2004).
Confounder factors
There were no differences between antidepressants and placebo when possible confounder factors were examined (analyses not shown).
Heavy drinkers
All studies
The analysis found no difference between antidepressants and placebo in the number of heavy drinkers, with substantial evidence of heterogeneity (7 studies; 459 participants; RR 0.78, 95% CI 0.57 to 1.07; Tau² = 0.09; Chi² = 15.49, df = 6 (P = 0.02); I² = 61%; Analysis 1.13) (Gual 2003; Krupitsky 2012; Mason 1996; Moak 2003; Pettinati 2010 arm A; Pettinati 2010 arm B; Roy 1998).
Different classes of antidepressants and single antidepressant
The analysis found no difference in the number of heavy drinkers between SSRIs and placebo (6 studies; 431 participants; RR 0.87, 95% CI 0.69 to 1.11; Analysis 1.13) (Gual 2003; Krupitsky 2012; Moak 2003; Pettinati 2010 arm A; Pettinati 2010 arm B; Roy 1998), and sertraline and placebo (5 studies; 371 participants; RR 0.94, 95% CI 0.78 to 1.13; analysis not shown) (Gual 2003; Moak 2003; Pettinati 2010 arm A; Pettinati 2010 arm B; Roy 1998).
Confounder factors
There were no differences between antidepressants and placebo when possible confounder factors were examined (analyses not shown).
Time to first relapse (days)
All studies
The analysis found no difference between antidepressants and placebo in the time to the first relapse, with substantial evidence of heterogeneity (6 studies; 348 participants; MD 2.54 days, 95% CI ‐8.79 to 13.87; Tau² = 102.26; Chi² = 13.58, df = 5 (P = 0.02); I² = 63%; Analysis 1.14) (Cornelius 1997; Gual 2003; Krupitsky 2012; Pettinati 2001a; Pettinati 2010 arm A; Pettinati 2010 arm B).
Different classes of antidepressants and single antidepressant
The analysis found no difference between SSRIs and placebo (6 studies; 348 participants; MD 2.54 days, 95% CI ‐8.79 to 13.87; Analysis 1.14) (Cornelius 1997; Gual 2003; Krupitsky 2012; Pettinati 2001a; Pettinati 2010 arm A; Pettinati 2010 arm B), and sertraline and placebo (4 studies; 282 participants; MD 0.70, 95% CI ‐12.67 to 14.08; analysis not shown) (Gual 2003; Pettinati 2001a; Pettinati 2010 arm A; Pettinati 2010 arm B).
Confounder factors
There were no differences between antidepressants and placebo when the possible confounder factors were examined (analyses not shown).
Primary outcome: liver enzyme levels
GGT
All studies
There was no evidence of a difference between antidepressants and placebo (2 studies; 56 participants; MD ‐8.39 U/L, 95% CI ‐26.47 to 9.68; Analysis 1.15) (Hernandez‐Avila 2004; Krupitsky 2012).
Different classes of antidepressants and single antidepressant
Final levels of GGT were not available for more than one study for any analysis.
Confounder factors
There were no differences between antidepressants and placebo in the final levels of GGT when the possible confounder factors were examined (analyses not shown).
Global response (depression and alcohol consumption)
All studies
The analysis found a higher number of global responses among participants treated with antidepressants than placebo (P = 0.003), with no evidence of heterogeneity (3 studies; 152 participants; RR 2.37, 95% CI 1.34 to 4.19; Analysis 1.16) (Krupitsky 2012; McGrath 1996; Nunes 1993). However, all the three studies had a high risk of bias.
Different classes of antidepressants and single antidepressant
There was a higher number of global responses among participants treated with TCAs compared to placebo (P = 0.03) (2 studies; 92 participants; RR 2.09, 95% CI 1.09 to 4.02; Analysis 1.16) (McGrath 1996; Nunes 1993), and imipramine compared to placebo (P = 0.03) (2 studies; 92 participants; RR 2.09, 95% CI 1.09 to 4.02; analysis not shown) (McGrath 1996; Nunes 1993). However, both these studies had a high risk of bias.
Confounder factors
The analyses found a higher number of global responses among participants treated with antidepressants compared to placebo among the studies:
-
with a duration of four weeks or greater (P = 0.003), with no evidence of heterogeneity (3 studies; 152 participants; RR 2.37, 95% CI 1.34 to 4.19) (Krupitsky 2012; McGrath 1996; Nunes 1993);
-
with primary depression (P = 0.03), with no evidence of heterogeneity (2 studies; 92 participants; RR 2.09, 95% CI 1.09 to 4.02) (McGrath 1996; Nunes 1993);
-
conducted in an outpatient setting (P = 0.003), with no evidence of heterogeneity (3 studies; 152 participants; RR 2.37, 95% CI 1.34 to 4.19) (Krupitsky 2012; McGrath 1996; Nunes 1993);
-
with participants who were not actively drinking at the beginning of the trial (P = 0.003), with no evidence of heterogeneity (3 studies; 152 participants; RR 2.37, 95% CI 1.34 to 4.19) (Krupitsky 2012; McGrath 1996; Nunes 1993);
-
with psychotherapy (P = 0.003), with no evidence of heterogeneity (3 studies; 152 participants; RR 2.37, 95% CI 1.34 to 4.19) (Krupitsky 2012; McGrath 1996; Nunes 1993). Analyses not shown. However, all the three studies had a high risk of bias.
Primary outcome: acceptability (all‐cause dropouts)
All studies
The analysis found low‐quality of evidence of no difference in all‐cause dropouts between antidepressants and placebo, with no evidence of heterogeneity (17 studies; 1159 participants; RR 0.98, 95% CI 0.79 to 1.22; Tau² = 0.07; Chi² = 23.80, df = 14 (P = 0.05); I² = 41%; Analysis 1.17; summary of findings Table for the main comparison; Figure 6) (Altamura 1990; Butterworth 1971b; Cornelius 2016; Gallant 1969 arm a; Gual 2003; Hernandez‐Avila 2004; Kranzler 2006 arm A; Kranzler 2006 arm B; Krupitsky 2012; Mason 1996; McGrath 1996; McLean 1986; Moak 2003; Pettinati 2010 arm A; Pettinati 2010 arm B; Roy 1998; Roy‐Byrne 2000).

Funnel plot of comparison: 1 Antidepressants versus placebo: all studies, outcome: 1.17 Acceptability: dropouts.
Different classes of antidepressants and single antidepressant
There were no differences in the number of dropouts between:
-
TCAs and placebo (4 studies; 216 participants; RR 1.21, 95% CI 0.48 to 3.06) (Butterworth 1971b; Gallant 1969 arm a; Mason 1996; McGrath 1996);
-
SSRIs and placebo (8 studies; 759 participants; RR 1.04, 95% CI 0.79 to 1.36) (Gual 2003; Kranzler 2006 arm A; Kranzler 2006 arm B; Krupitsky 2012; Moak 2003; Pettinati 2010 arm A; Pettinati 2010 arm B; Roy 1998);
-
5‐HT2 antagonists and placebo (4 studies; 154 participants; RR 0.79, 95% CI 0.38 to 1.64; Analysis 1.17; Figure 6) (Cornelius 2016; Hernandez‐Avila 2004; McLean 1986; Roy‐Byrne 2000);
-
imipramine and placebo (2 studies; 112 participants; RR 2.03, 95% CI 0.76 to 5.41) (Butterworth 1971b; McGrath 1996);
-
sertraline and placebo (7 studies; 699 participants; RR 1.00, 95% CI 0.76 to 1.33) (Gual 2003; Kranzler 2006 arm A; Kranzler 2006 arm B; Moak 2003; Pettinati 2010 arm A; Pettinati 2010 arm B; Roy 1998); and
-
nefazodone and placebo (2 studies; 105 participants; RR 0.86, 95% CI 0.33 to 2.24) (Hernandez‐Avila 2004; Roy‐Byrne 2000) (not all analyses shown).
Confounder factors
There were no differences between antidepressants and placebo when possible confounder factors were examined (high risk of bias, setting, duration of study, typology of depression, and use of psychotherapy; analyses not shown).
Primary outcome: tolerability of treatment
Withdrawal for medical reasons
All studies
The analysis found low‐quality of evidence of no difference in the number of withdrawals for medical reasons between antidepressants and placebo (10 studies; 947 participants; RR 1.15, 95% CI 0.65 to 2.04; Analysis 1.18; summary of findings Table for the main comparison) (Adamson 2015; Cornelius 1997; Kranzler 2006 arm A; Krupitsky 2012; Mason 1996; McGrath 1996; Pettinati 2010 arm A; Pettinati 2010 arm B; Roy 1998; Roy‐Byrne 2000).
Different classes of antidepressants and single antidepressant
There were no differences in the number of withdrawals for medical reasons between SSRIs and placebo (7 studies; 786 participants; RR 1.10, 95% CI 0.52 to 2.32; Analysis 1.18) (Adamson 2015; Cornelius 1997; Kranzler 2006 arm A; Krupitsky 2012; Pettinati 2010 arm A; Pettinati 2010 arm B; Roy 1998), TCAs and placebo (2 studies; 97 participants; RR 0.91, 95% CI 0.10 to 8.41; Analysis 1.18) (Mason 1996; McGrath 1996), and sertraline and placebo (4 studies; 537 participants; RR 0.90, 95% CI 0.35 to 2.34; analysis not shown) (Kranzler 2006 arm A; Pettinati 2010 arm A; Pettinati 2010 arm B; Roy 1998).
Confounder factors
There were no differences between antidepressants and placebo when possible confounder factors were examined. Analyses not shown.
Total adverse events
All studies
The analysis found no difference in the total number of adverse events between antidepressants and placebo, with substantial evidence of heterogeneity (5 studies; 644 participants; RR 1.18, 95% CI 0.97 to 1.44; Tau² = 0.02; Chi² = 13.57, df = 4 (P = 0.009); I² = 71%; Analysis 1.18) (Adamson 2015; Butterworth 1971b; Gallant 1969 arm a; Kranzler 2006 arm A; Krupitsky 2012).
Different classes of antidepressants and single antidepressant
There were no differences between SSRIs and placebo (3 studies; 529 participants; RR 1.06, 95% CI 0.92 to 1.23; Analysis 1.18) (Adamson 2015; Kranzler 2006 arm A; Krupitsky 2012), whereas there was a higher number of total adverse events (P = 0.009) among the studies in which participants received TCAs, with no evidence of heterogeneity (2 studies; 115 participants; RR 1.66, 95% CI 1.13 to 2.42; Analysis 1.18) (Butterworth 1971b; Gallant 1969 arm a). However, one of these studies had a high risk of bias (Butterworth 1971b).
Confounder factors
There was a higher number of total adverse events among participants treated with antidepressants for studies with a duration less than four weeks (P = 0.009) (2 studies; 115 participants; RR 1.66, 95% CI 1.13 to 2.42; analysis not shown) (Butterworth 1971b; Gallant 1969 arm a), and conducted in an inpatient setting (P = 0.009) (2 studies; 115 participants; RR 1.66, 95% CI 1.13 to 2.42; analysis not shown) (Butterworth 1971b; Gallant 1969 arm a). However, one of these studies had a high risk of bias (Butterworth 1971b). There were no differences between antidepressants and placebo when the other possible confounder factors were examined.
Other observations
All studies
Seven single adverse events were investigated by more than one study: dry mouth, insomnia, headache, dizziness, diarrhoea, nausea, and constipation. There was a higher number of episodes of insomnia among participants who received antidepressants compared to those who received placebo (P = 0.04) (4 studies; 564 participants; RR 1.69, 95% CI 1.02 to 2.77; Analysis 1.18) (Adamson 2015; Butterworth 1971b; Kranzler 2006 arm A; Roy‐Byrne 2000). There was no difference between antidepressants and placebo for the other adverse events.
Different classes of antidepressants and single antidepressant
The analyses found a higher number of episodes of insomnia among participants treated with SSRIs (P = 0.04) (2 studies; 469 participants; RR 1.75, 95% CI 1.04 to 2.96; Analysis 1.18) (Adamson 2015; Kranzler 2006 arm A). Neither study had a high risk of bias.
There was no difference between antidepressants and placebo in the occurrence of headache for SSRIs (2 studies; 414 participants; Analysis 1.18) (Gual 2003; Kranzler 2006 arm A), or sertraline (2 studies; 414 participants; analysis not shown) (Gual 2003; Kranzler 2006 arm A).
The analyses found no differences between SSRIs and placebo in the occurrence of nausea (2 studies; 221 participants; Analysis 1.18) (Adamson 2015; Gual 2003). The other adverse events were not reported by more than one study of each class of antidepressants.
Confounder factors
The numbers of episodes of insomnia and dry mouth did not differ between antidepressants and placebo when possible confounder factors were examined (analysis not shown).
Total serious adverse events
All studies
The analysis found no difference in the number of total serious adverse events between antidepressants and placebo, with no evidence of heterogeneity (7 studies; 774 participants; RR 1.22, 95% CI 0.80 to 1.86; Analysis 1.18) (Adamson 2015; Butterworth 1971b; Cornelius 2016; Kranzler 2006 arm A; Moak 2003; Pettinati 2010 arm A; Pettinati 2010 arm B).
Different classes of antidepressants and single antidepressant
The analyses found no differences between antidepressants and placebo in total serious adverse events for SSRIs (5 studies; 721 participants; Analysis 1.18) (Adamson 2015; Kranzler 2006 arm A; Moak 2003; Pettinati 2010 arm A; Pettinati 2010 arm B), or sertraline (4 studies; 583 participants; analysis not shown) (Kranzler 2006 arm A; Moak 2003; Pettinati 2010 arm A; Pettinati 2010 arm B).
Confounder factors
There were no differences between antidepressants and placebo when the role of all the possible confounder factors was investigated (analyses not shown).
Single serious adverse event
All studies
The analysis found no difference between antidepressants and placebo regarding the two single serious adverse events investigated by more than one study: worsening of clinical condition because of relapse and depression (Analysis 1.18).
Different classes of antidepressants and single antidepressant
The analysis found no difference when the studies were analyzed according to the different classes of antidepressants and when the role of all the possible confounder factors was investigated (analyses not shown).
Primary outcome: suicide and suicidal attempts
All studies
The analysis found no difference between antidepressants and placebo, with no evidence of heterogeneity (4 studies; 602 participants; RR 1.33, 95% CI 0.23 to 7.61; Analysis 1.19) (Adamson 2015; Cornelius 1997; Kranzler 2006 arm A; Moak 2003). None of these studies had a high risk of bias.
Different classes of antidepressants and single antidepressant
The analyses found no difference in the number of suicide attempts between antidepressants and placebo for SSRIs (4 studies; 602 participants; Analysis 1.19) (Adamson 2015; Cornelius 1997; Kranzler 2006 arm A; Moak 2003), or sertraline (2 studies; 413 participants; analysis not shown) (Kranzler 2006 arm A; Moak 2003).
Confounder factors
There were no differences between antidepressants and placebo when confounder factors were examined (analyses not shown).
Secondary outcome: craving
All studies
The analysis found no significant difference between antidepressants and placebo (2 studies; 29 participants; MD 1.00 cravings for alcohol, 95% CI ‐3.27 to 5.27; Analysis 1.20) (Cornelius 2016; Krupitsky 2012).
Different classes of antidepressants and single antidepressant
Measures on craving for alcohol were not available for more than one study for any analysis.
Confounder factors
The analyses found no significant differences between antidepressants and placebo among the studies conducted in an outpatient setting and with psychotherapy (2 studies; 29 participants; analysis not shown) (Cornelius 2016; Krupitsky 2012).
Secondary outcome: severity of alcohol dependence
Because different scales were used, we used SMDs (see Appendix 8; Appendix 9).
All studies
The analysis found no significant difference between antidepressants and placebo (2 studies; 168 participants; SMD ‐0.14, 95% CI ‐0.44 to 0.17; Analysis 1.21) (Adamson 2015; Hernandez‐Avila 2004).
Different classes of antidepressants and single antidepressant
Measures on severity of alcohol dependence were not available for more than one study for any analysis.
Confounder factors
Both the two studies (168 participants; Adamson 2015; Hernandez‐Avila 2004) were without high risk of bias, conducted in an outpatient setting, with a duration of four weeks or greater, in which participants were actively drinking at the beginning of the trial, and with psychotherapy.
Secondary outcome: psychiatric symptoms/psychological distress
All studies
Final score of anxiety severity using an interviewer‐rated scale was not available for more than one study. The analysis found a significantly lower value among participants using a self‐administered scale (P = 0.002), with no evidence of heterogeneity (3 studies; 97 participants; MD ‐6.31 points, 95% CI ‐10.33 to ‐2.28; Chi² = 0.18, df = 2 (P = 0.91); I² = 0%; Analysis 1.22) (Hernandez‐Avila 2004; Krupitsky 1993 arm A; Krupitsky 2012). However, two of these studies had a high risk of bias (Krupitsky 1993 arm A; Krupitsky 2012).
Different classes of antidepressants and single antidepressant
Data were not available for more than one study for any analysis.
Confounder factors
The analyses found a significantly lower value among participants who received antidepressants than placebo (P = 0.02) among the studies conducted in an outpatient setting, with psychotherapy, with a duration of four weeks or greater, with no evidence of heterogeneity (2 studies; 56 participants; MD ‐5.78, 95% CI ‐10.50 to ‐1.06; Chi² = 0.01, df = 1 (P = 0.94); I² = 0%; analysis not shown) (Hernandez‐Avila 2004; Krupitsky 2012), and in which participants were not actively drinking at the beginning of the trial, with no evidence of heterogeneity (2 studies; 56 participants; MD ‐6.73, 95% CI ‐12.48 to ‐0.98; Chi² = 0.14, df = 1 (P = 0.71); I² = 0%; analysis not shown) (Krupitsky 1993 arm A; Krupitsky 2012).
Antidepressants versus other medications
Data were not available for more than one study for any analysis.
Antidepressants versus psychotherapy
Depression severity: final score
The analysis found no difference between antidepressants and psychotherapy, with no evidence of heterogeneity (2 studies; 60 participants; MD ‐2.61 points, 95% CI ‐6.92 to 1.70; Analysis 2.1) (Liappas 2005 arm A; Liappas 2005 arm B).
Global assessment: final score
Participants who received antidepressants achieved lower final scores (P = 0.01) than participants who received psychotherapy, with no evidence of heterogeneity (2 studies; 60 participants; MD 5.92 points, 95% CI 1.30 to 10.54; Analysis 2.2) (Liappas 2005 arm A; Liappas 2005 arm B). Both studies had a high risk of bias.
Acceptability: all‐causes dropouts
The analysis found no difference between antidepressants and psychotherapy, with no evidence of heterogeneity (2 studies; 68 participants; RR 1.43, 95% CI 0.31 to 6.54; Analysis 2.3) (Liappas 2005 arm A; Liappas 2005 arm B).
Discussion
Summary of main results
A total of 33 trials (2242 participants) met the inclusion criteria: among them, 22 studies (1438 participants) compared an antidepressant to placebo; five (621 participants) compared one antidepressant to another; and four (228 participants) compared the efficacy of an antidepressant to another medication. Two studies (60 participants) compared the efficacy of an antidepressant to psychotherapy.
The antidepressants considered in the studies were: amitriptyline (five studies); citalopram (one study); desimipramine (one study); doxepin (three studies); escitalopram (one study), fluoxetine (one study); fluvoxamine (one study); imipramine (three studies); mianserine (one study); mirtazapine (four studies); nefazodone (two studies); paroxetine (one study); sertraline (eight studies); tianeptine (two studies); venlafaxine (two studies); and vilofaxine (one study).
Comparing antidepressants to placebo, we found low‐quality evidence that antidepressants reduced the severity of depression evaluated using a continuous outcome (i.e. final score in interviewer‐rated scales) and very low‐evidence using a dichotomous outcome (i.e. response). We found no difference between antidepressants and placebo excluding studies with high risk of bias. In addition, we found no difference for other relevant outcomes such as the difference between baseline and final score.
Regarding alcohol consumption, we found moderate‐quality evidence that antidepressants increased with respect to placebo, the number of participants abstaining during the trial and reduced the number of drinks per drinking day. However, we found no differences between antidepressants and placebo for other relevant outcomes such as the rate of abstinent days (low‐quality evidence).
With regards to acceptability and tolerability, we found low‐quality evidence that antidepressants did not increase the rate of dropouts or withdrawals for medical reasons when compared with placebo.
Considering confounders/moderators, trials lasting more than four weeks or including only people with primary major depression showed no impact on the efficacy of antidepressants in reducing the severity of depression at the end of treatment and rate of response. The other confounders/moderators (typology of depression, setting, and psychotherapy) did not have a substantial impact on these results, which were often limited by the small number of included studies in the subgroup and confounders/moderators analyses.
There were few studies comparing one antidepressant versus another or antidepressants versus other interventions, and these had a small sample size and were heterogeneous in terms of the types of interventions that were compared, yielding results that were not informative.
Overall completeness and applicability of evidence
Besides the limits in external validity due to the general requirements of RCTs (strict inclusion criteria, highly homogeneous study groups, limitations in dose adjustment, etc.), the types of participants (adults with co‐occurring depression and alcohol dependence) are quite representative of the general target population. Moreover, interventions (antidepressant dosages), settings, and outcomes investigated (dropouts, alcohol use, adverse events, depression severity changes) are important to patients, practitioners, and decision makers and are relevant to the context of current practice.
In contrast to other reviews in the field of addiction, for which a large majority of studies were conducted in the USA, more than one third of the studies included in this review were conducted in other countries. This is an important issue in terms of generalizability of the evidence, because different social contexts can influence depression severity and alcohol dependence and availability to enter a clinical trial; also, different clinical contexts can influence the selection of participants and the results of the treatment, acting as an effect modifier in the estimation of efficacy of treatment.
Quality of the evidence
For the evaluation of the quality of the evidence, we collected supplementary information from the authors of the primary studies, mainly because some features of the study design were omitted from trial reports or data on outcomes were lacking. Some outcome measures were obtained according to the Cochrane Handbook for Systematic Reviews of Interventions suggested procedures from available values (Higgins 2011). In one case (Analysis 1.7), missing SDs were imputed as the mean of SDs of the other studies included in the comparison. In this case, a sensitivity analysis was carried out to assess how the results were sensitive to changes.
Moreover, the assumption that missing data correspond to poor outcome was made choosing dropout as a primary outcome. Another approach, as the last observation carried forward was not followed since included studies with missing data did not provide multiple point data. In the end, availability of data on primary outcomes varied from 72.7% (16 of 22 RCTs) for dropouts to 9.5% (2 of 22 RCTs) for the GGT values.
The poor reporting of study design was mainly for the methods used for generating random sequences and allocation concealment, with more than two‐thirds of trials at unclear risk for selection bias. Moreover, 25% of the studies had a high risk of attrition and reporting bias. Finally, about half of the studies were at high or unclear risk of performance bias and almost all at unclear risk of detection bias.
Overall, the quality of evidence was moderate for people abstinent during the trial and for the number of drinks per drinking day; low for the severity of depression measured at the end of the trial, for the rate of abstinent days, dropouts, and adverse events; and very low for the ascertainment of the response to the treatment.
Potential biases in the review process
We did not find any unpublished studies despite a significant effort in contacting all the first authors of the included studies and the search of conference proceedings.
The possibility of publication bias was inspected by funnel plot only for the comparison 'Antidepressants versus placebo' and for the outcomes, severity of depression at the end of treatment (Figure 4), rate of responses (Figure 5), and dropouts (Figure 6), because in the other comparisons and for the other outcomes there were too few studies to make the funnel plot informative. One of the three funnel plots (dropouts) showed asymmetry suggesting publication bias in favour of studies with positive results (Figure 6).
We acknowledge that the funnel plot should be seen as a generic mean of displaying small‐study effects, so that asymmetry could be due to publication bias, but also to other reasons such as greater risk of bias of smaller studies, inclusion of a more restrictive and thus responsive population, or merely by the play of chance. The majority of the studies included in this review had a small sample size (fewer than 100 participants). GRADE guidelines suggest that authors of systematic reviews should suspect publication bias when studies are uniformly small (Guyatt 2011).
Agreements and disagreements with other studies or reviews
Four previous non‐Cochrane systematic reviews evaluating pooled data with meta‐analyses have been identified (Foulds 2015; Iovieno 2011; Nunes 2004; Torrens 2005). These reviews were carried out on the basis of pre‐established criteria for searching literature, selecting studies, and assessing their risk of bias. The first review evaluated the efficacy of depression treatment in people with substance‐use disorders, but eight studies specifically investigated the efficacy of antidepressants in people with co‐occurring alcohol dependence and depression (Nunes 2004). This review concluded that antidepressants exert a modest beneficial effect for people with co‐occurring depression and substance‐use disorders, including a positive impact on alcohol consumption.
The second meta‐analysis investigated the efficacy of antidepressants in people with substance‐use disorder with and without depression (Torrens 2005). Among the selected trials, nine studies specifically investigated the efficacy of antidepressants in people with co‐occurring alcohol dependence and depression. The results of the meta‐analysis failed to demonstrate any impact of antidepressants on alcohol consumption or a significant advantage for the use of SSRIs for the treatment of depression while giving indication for a possible effect of other antidepressants (Torrens 2005).
The third meta‐analysis evaluated the efficacy of antidepressants in participants with substance‐use disorder with depression or dysthymic disorder (Iovieno 2011). The results of the meta‐analysis (11 trials) showed that antidepressants are more efficacious than placebo in this population. This review did not consider the impact of antidepressants on alcohol consumption.
The fourth meta‐analysis investigated possible differences in response to a treatment for depression in alcohol‐dependent participants according to the different typology of depression, divided into independent and alcohol‐induced depression (Foulds 2015). This study selected 22 clinical trials of which 13 evaluated the efficacy of antidepressants compared to placebo in people with alcohol dependence and depression. The meta‐analysis was conducted on 11 trials. The results showed that, globally, treatment of depression in alcohol‐dependent people is associated with a large early improvement in depression severity, even when depression is independent from drinking, with a stronger effect in independent depression than in alcohol‐induced depression (Foulds 2015). In this review, the effect of antidepressants on alcohol consumption was not considered.
The first three reviews were not specifically designed for evaluating the efficacy and safety of antidepressants for alcohol‐dependent people. The fourth review adopted very selective inclusion criteria (studies reporting data over at least eight weeks; studies reporting a change in depression scales). All the reviews did not apply stringent Cochrane criteria for systematic reviews and did not consider dropouts and adverse effects as a primary outcome.
Compared to the previous reviews, our review adopted Cochrane criteria, included relevant variables among the primary outcomes such as severity depression, alcohol consumption, dropout rate, and adverse events. Unfortunately, the results obtained, despite based on more than 30 RCTs and 2000 participants, did not resolve the uncertainty coming from the previous reviews. According to our results, compared to placebo, antidepressants exert some positive effects both on depression and alcohol dependence. However, these effects may only have modest impact on both depression and alcohol‐related outcomes. Considering depression severity, the positive effects were limited to only some outcomes (i.e. depression severity evaluated with interviewer‐rated scales at the end of trial and response to treatment) and were no longer significant when studies at high risk of bias were excluded. Similarly, the positive effects observed considering potential confounders (i.e. for depression severity, duration of treatment and setting; for response to treatment, classes of antidepressants, and duration of treatment) were no longer significant when studies at high risk of bias were excluded. Only for primary depression, the positive effects were still present after the exclusion of studies at high risk of bias.
The positive effects also had a modest impact on alcohol consumption. Indeed, antidepressants improve only some outcomes (i.e. the number of abstinent participants and the number of drinks per drinking days) and not others (e.g. the rate of abstinent days). However, the positive effects shown by antidepressants were still evident when studies at high risk of bias are excluded both in the entire sample of participants and when they are divided into subgroups according potential confounders (outpatient setting, duration of treatment greater than four weeks, primary depression, receiving psychotherapy, and being actively drinking at the begging of treatment) and different classes of antidepressants (i.e. SSRIs).

Study flow diagram.

Risk of bias graph: review authors' judgements about each risk of bias item presented as percentages across all included studies.
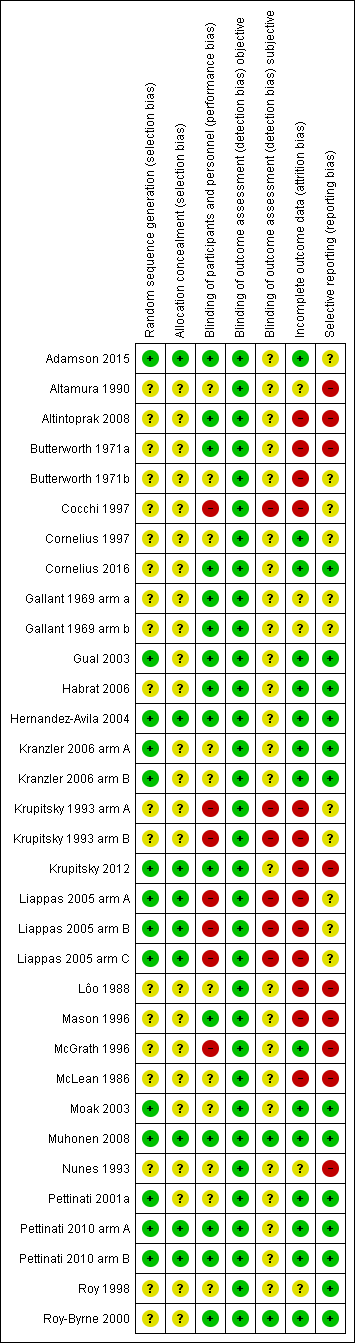
Risk of bias summary: review authors' judgements about each risk of bias item for each included study.
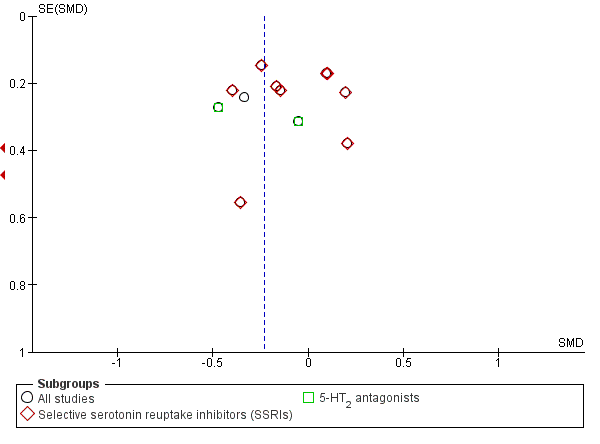
Funnel plot of comparison: 1 Antidepressants versus placebo: all studies, outcome: 1.1 Depression severity: final score (interviewer‐rated scales).
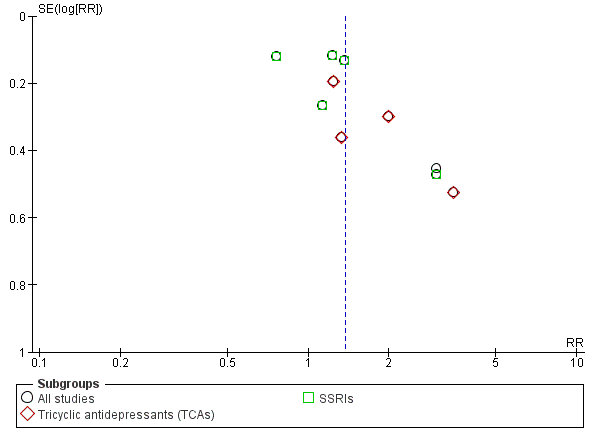
Funnel plot of comparison: 1 Antidepressants versus placebo: all studies, outcome: 1.5 Response to antidepressive treatment.
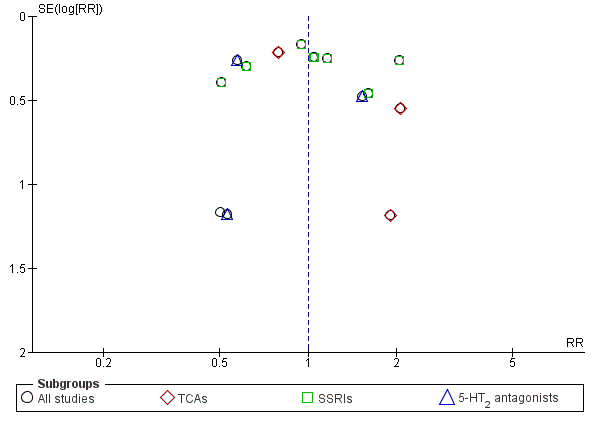
Funnel plot of comparison: 1 Antidepressants versus placebo: all studies, outcome: 1.17 Acceptability: dropouts.
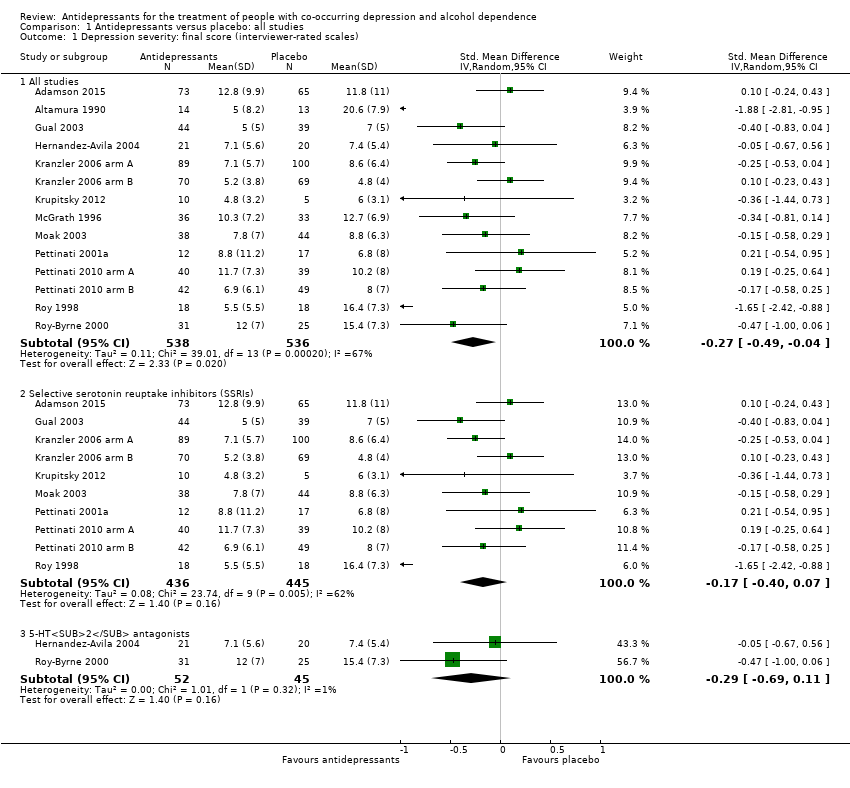
Comparison 1 Antidepressants versus placebo: all studies, Outcome 1 Depression severity: final score (interviewer‐rated scales).
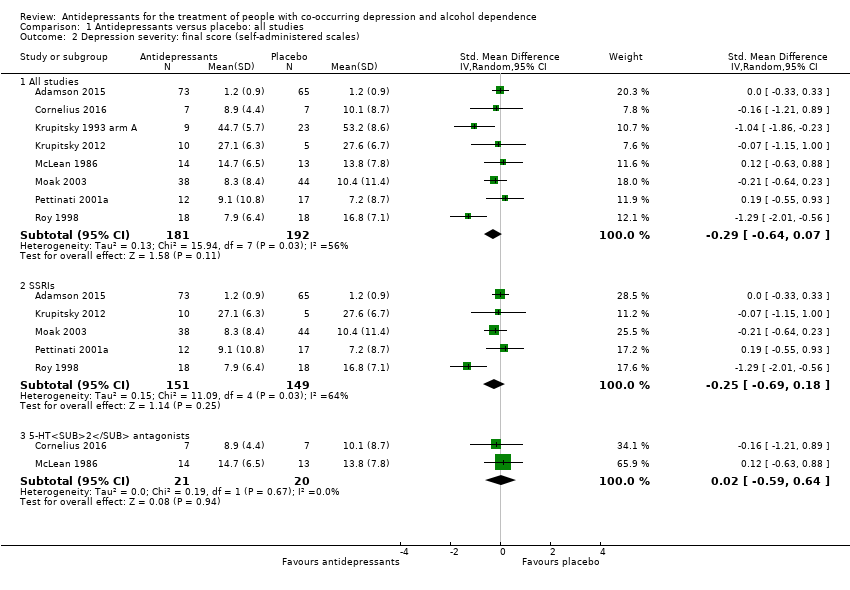
Comparison 1 Antidepressants versus placebo: all studies, Outcome 2 Depression severity: final score (self‐administered scales).
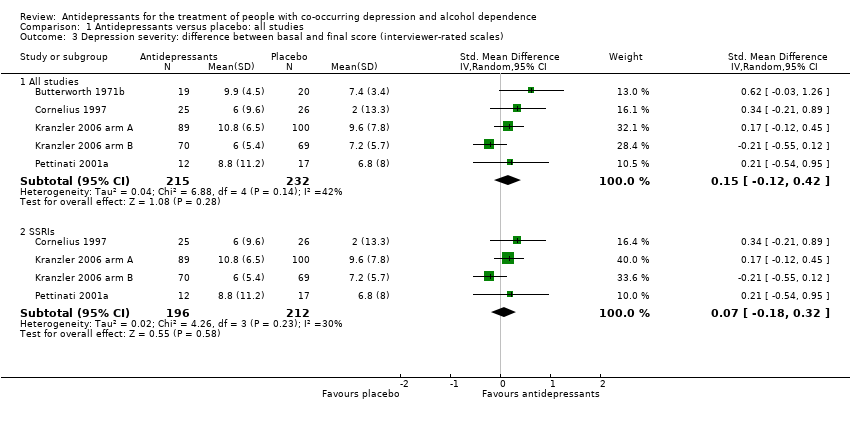
Comparison 1 Antidepressants versus placebo: all studies, Outcome 3 Depression severity: difference between basal and final score (interviewer‐rated scales).
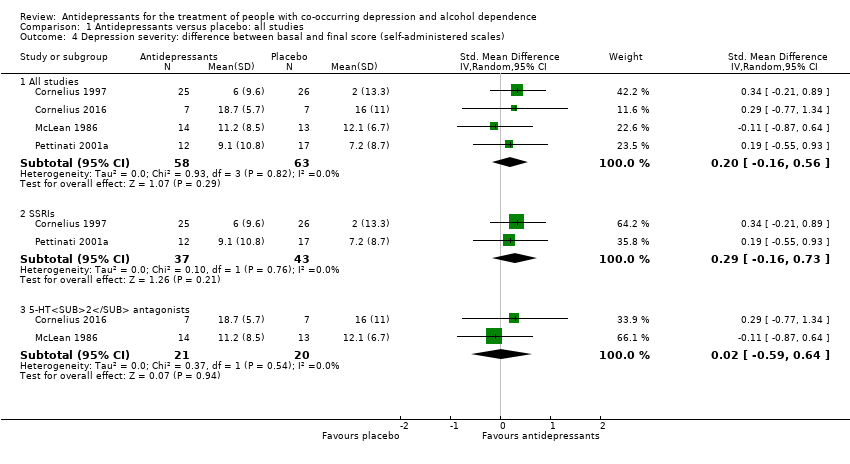
Comparison 1 Antidepressants versus placebo: all studies, Outcome 4 Depression severity: difference between basal and final score (self‐administered scales).
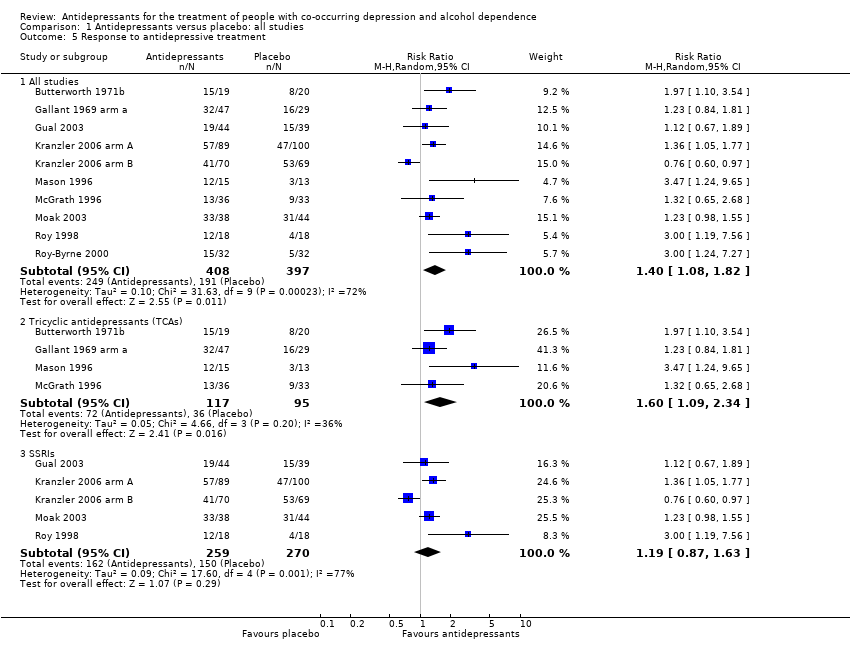
Comparison 1 Antidepressants versus placebo: all studies, Outcome 5 Response to antidepressive treatment.
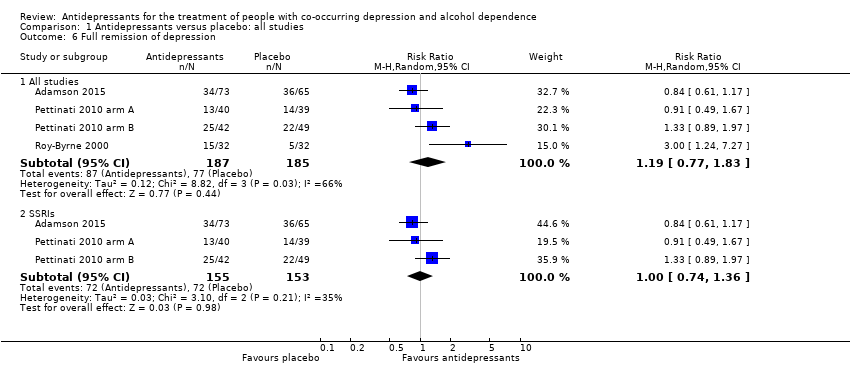
Comparison 1 Antidepressants versus placebo: all studies, Outcome 6 Full remission of depression.
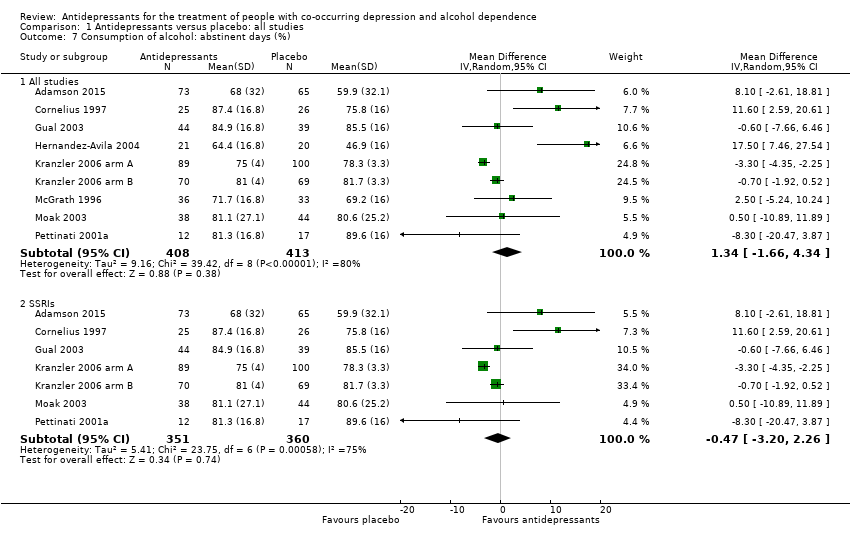
Comparison 1 Antidepressants versus placebo: all studies, Outcome 7 Consumption of alcohol: abstinent days (%).
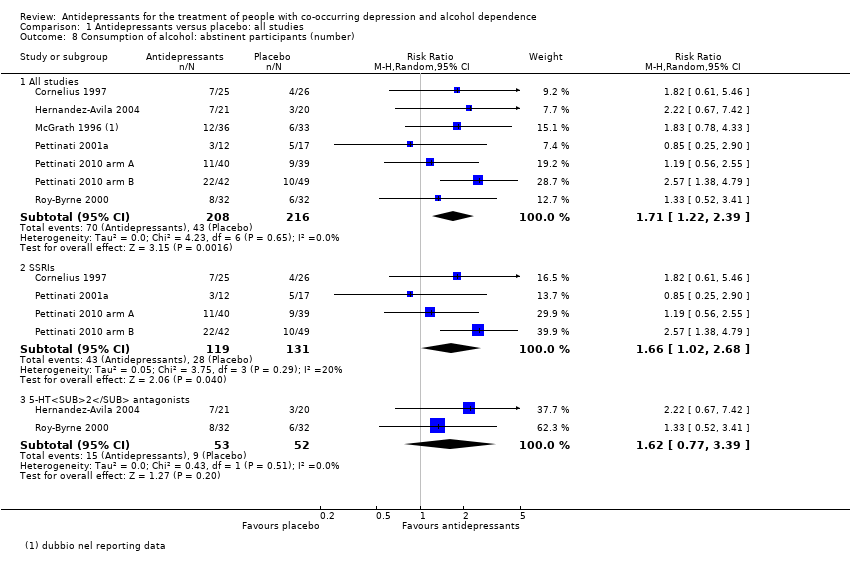
Comparison 1 Antidepressants versus placebo: all studies, Outcome 8 Consumption of alcohol: abstinent participants (number).
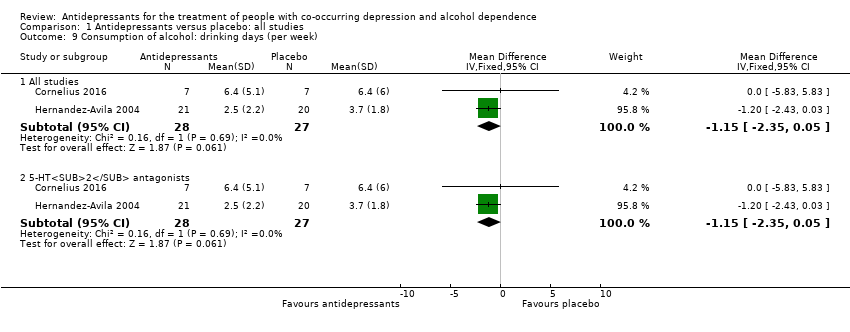
Comparison 1 Antidepressants versus placebo: all studies, Outcome 9 Consumption of alcohol: drinking days (per week).
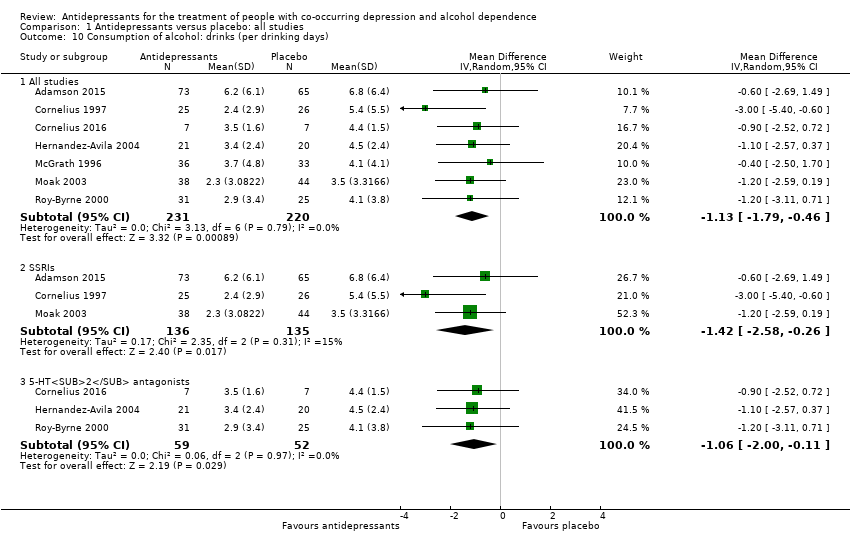
Comparison 1 Antidepressants versus placebo: all studies, Outcome 10 Consumption of alcohol: drinks (per drinking days).
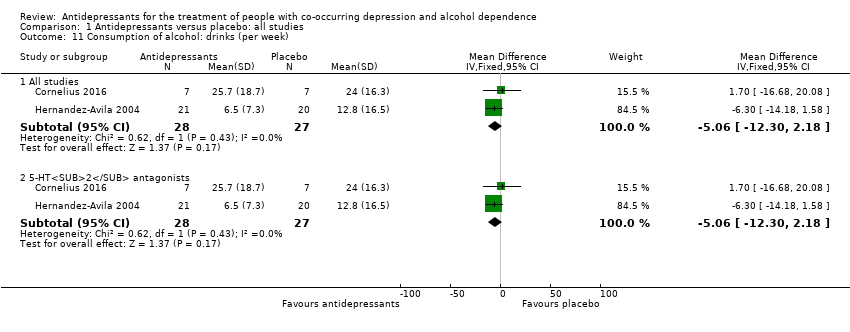
Comparison 1 Antidepressants versus placebo: all studies, Outcome 11 Consumption of alcohol: drinks (per week).
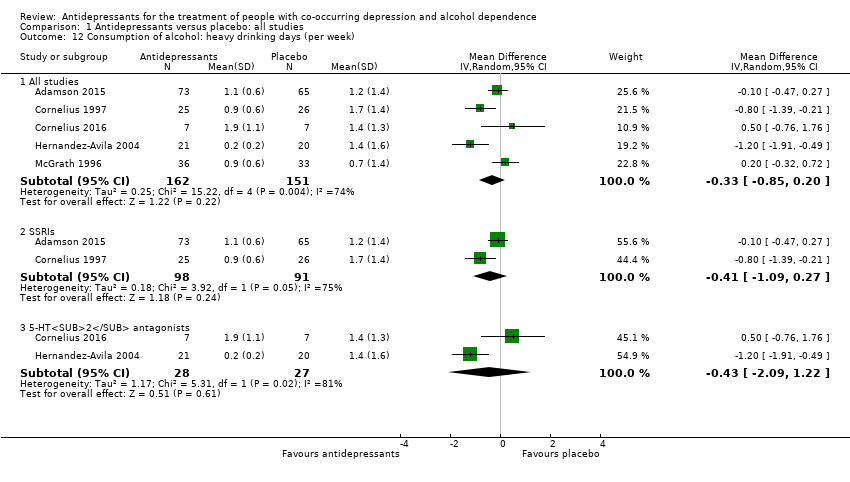
Comparison 1 Antidepressants versus placebo: all studies, Outcome 12 Consumption of alcohol: heavy drinking days (per week).
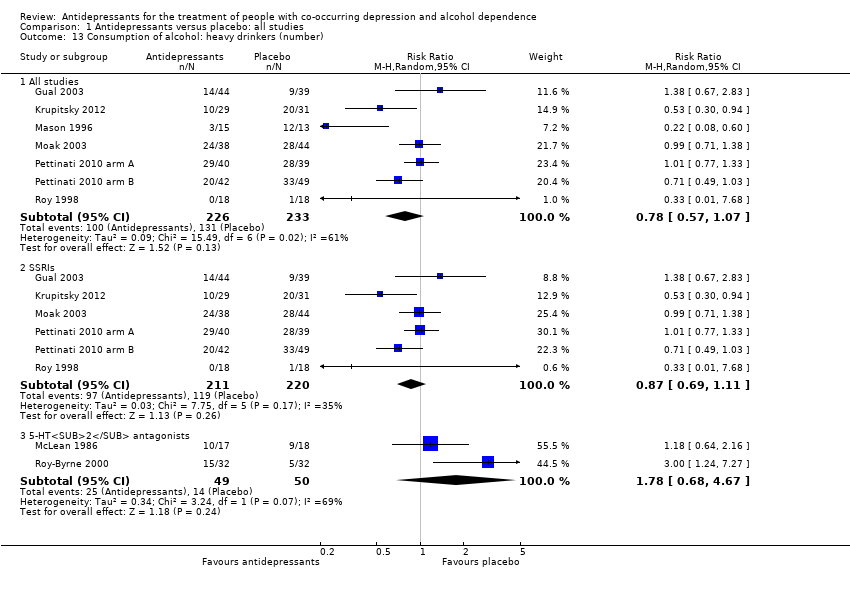
Comparison 1 Antidepressants versus placebo: all studies, Outcome 13 Consumption of alcohol: heavy drinkers (number).
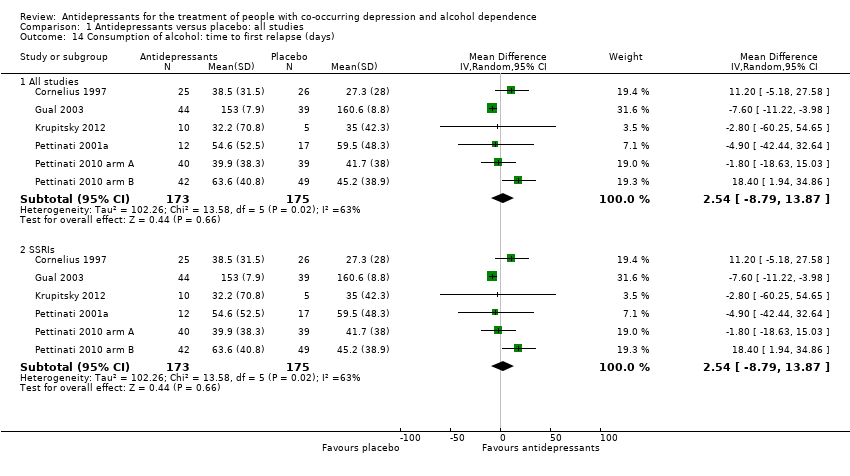
Comparison 1 Antidepressants versus placebo: all studies, Outcome 14 Consumption of alcohol: time to first relapse (days).
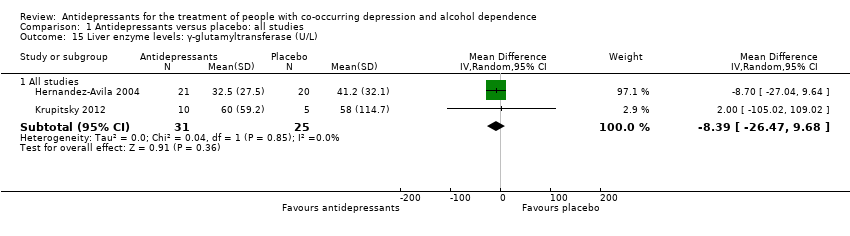
Comparison 1 Antidepressants versus placebo: all studies, Outcome 15 Liver enzyme levels: γ‐glutamyltransferase (U/L).
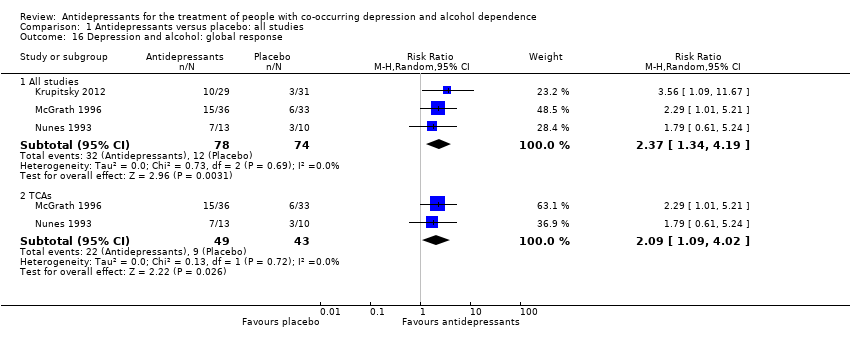
Comparison 1 Antidepressants versus placebo: all studies, Outcome 16 Depression and alcohol: global response.
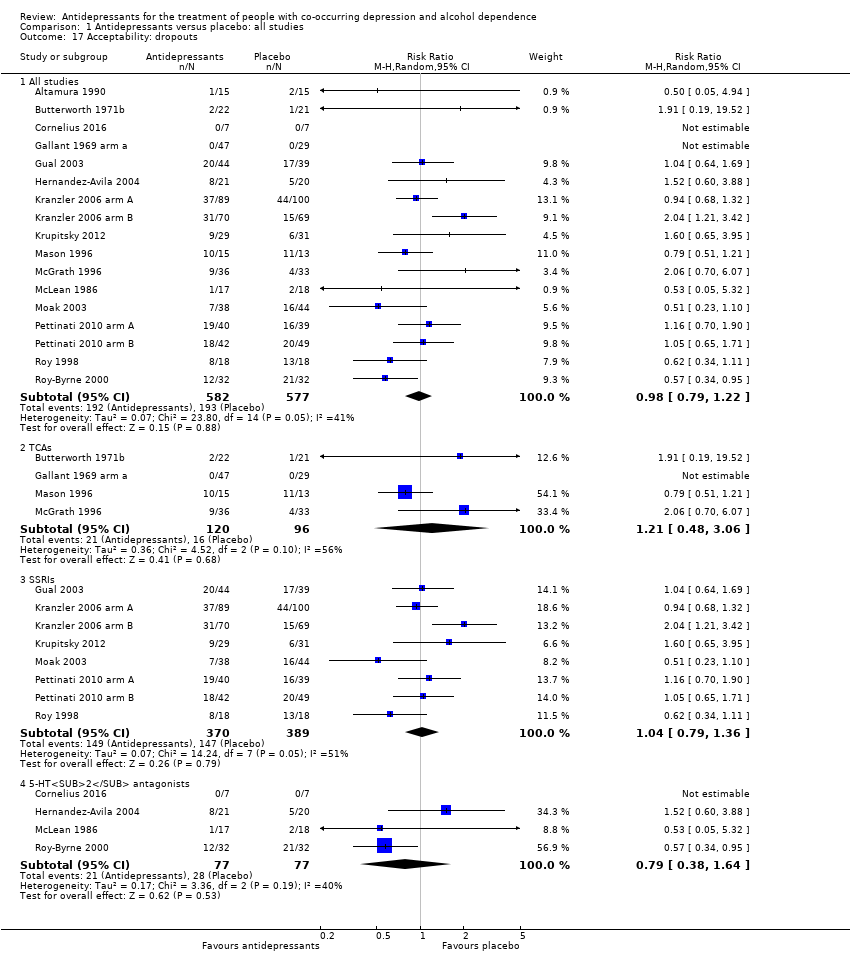
Comparison 1 Antidepressants versus placebo: all studies, Outcome 17 Acceptability: dropouts.
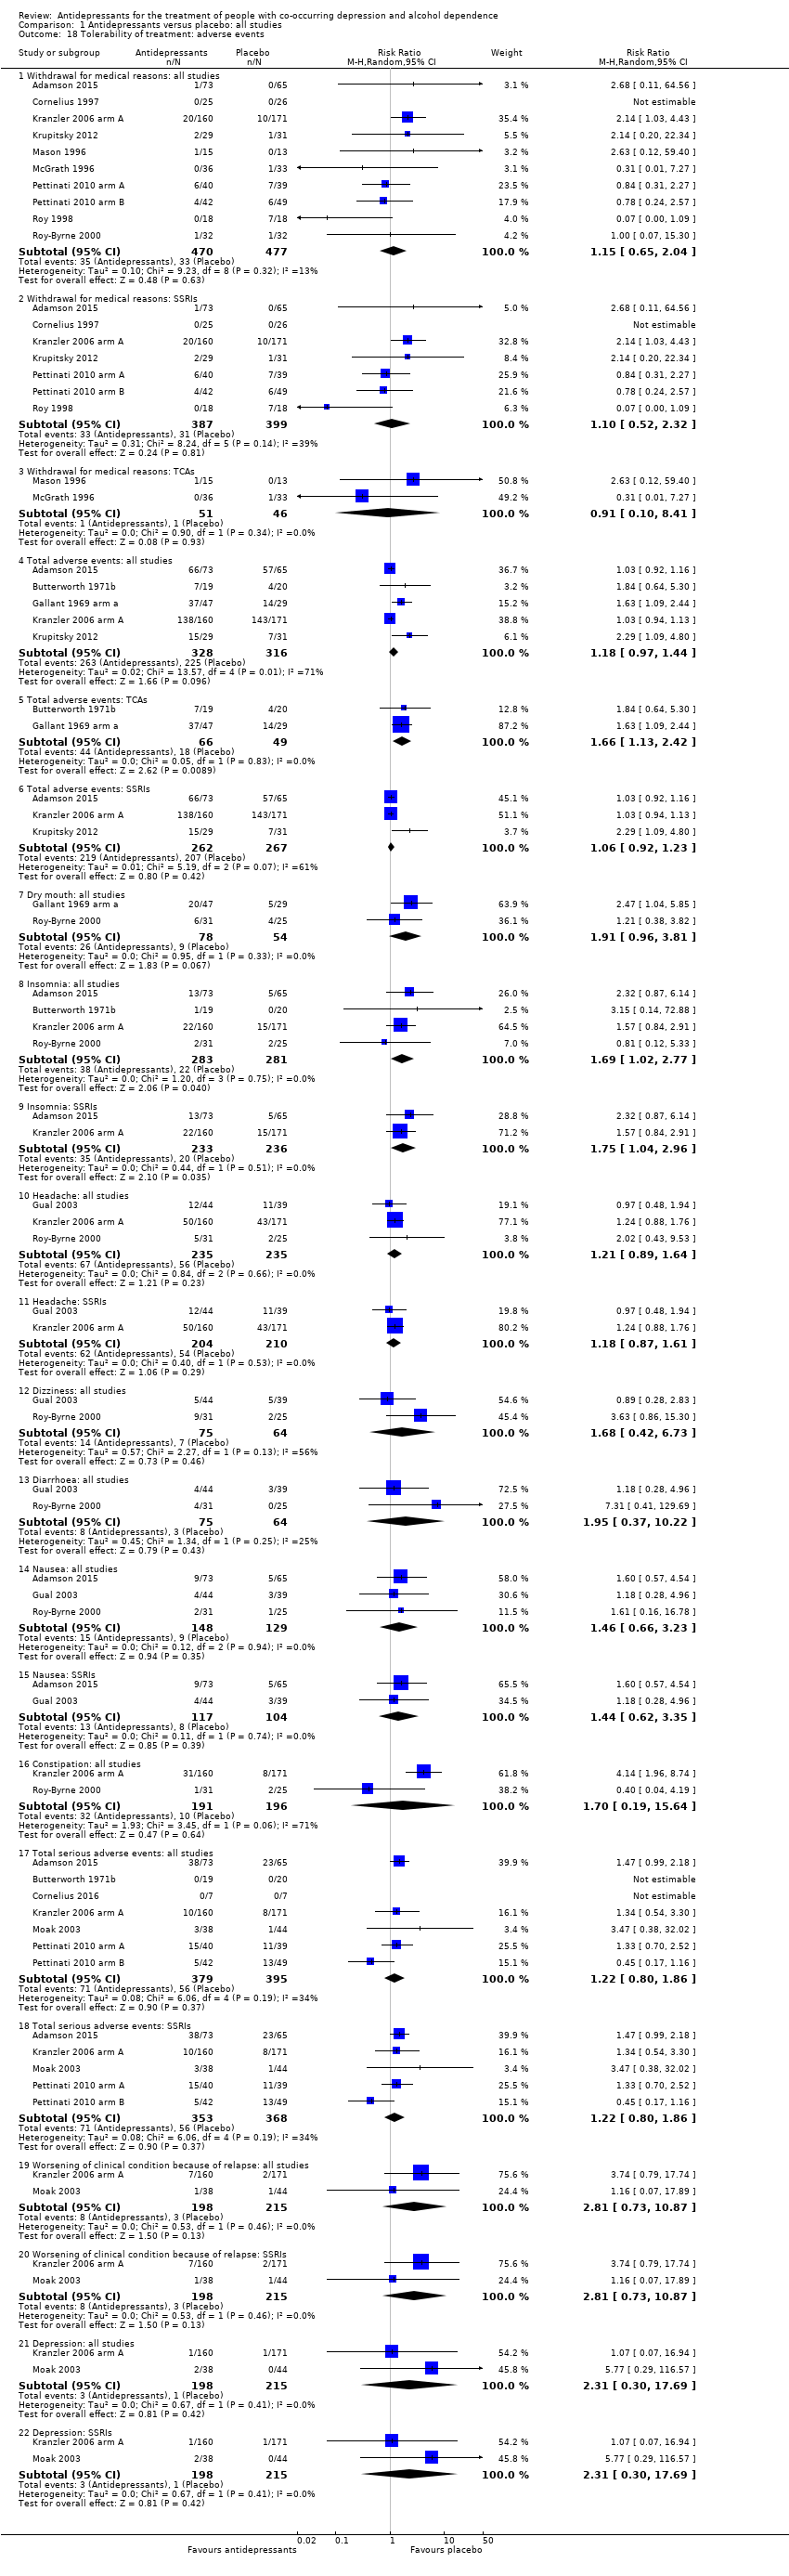
Comparison 1 Antidepressants versus placebo: all studies, Outcome 18 Tolerability of treatment: adverse events.
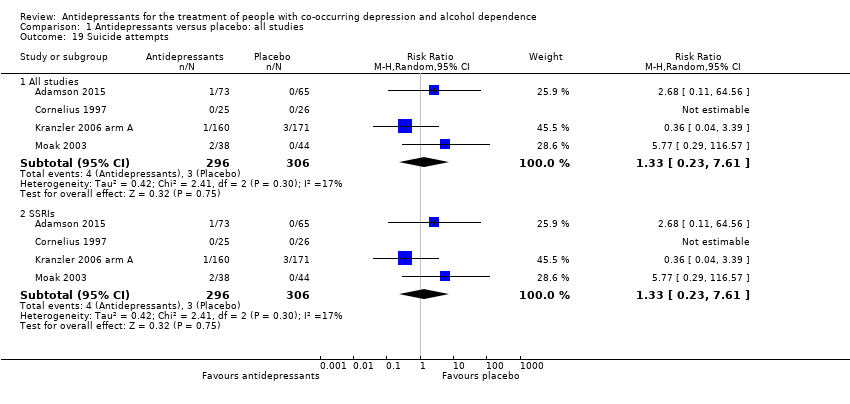
Comparison 1 Antidepressants versus placebo: all studies, Outcome 19 Suicide attempts.
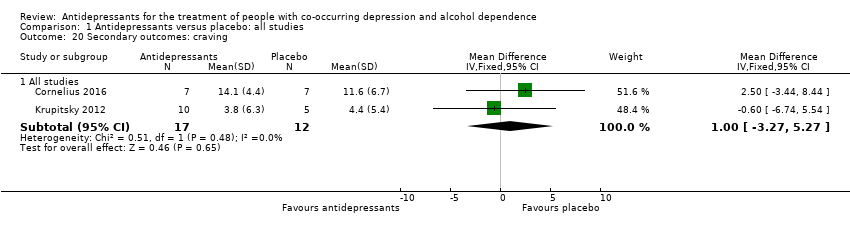
Comparison 1 Antidepressants versus placebo: all studies, Outcome 20 Secondary outcomes: craving.
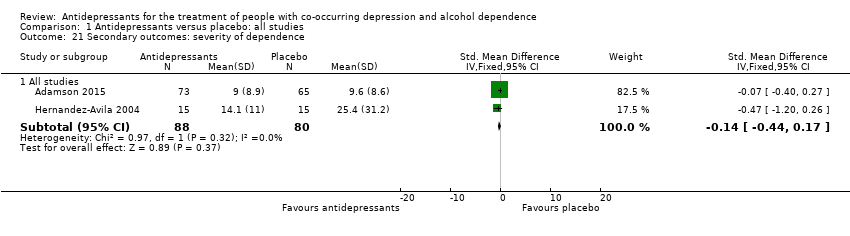
Comparison 1 Antidepressants versus placebo: all studies, Outcome 21 Secondary outcomes: severity of dependence.
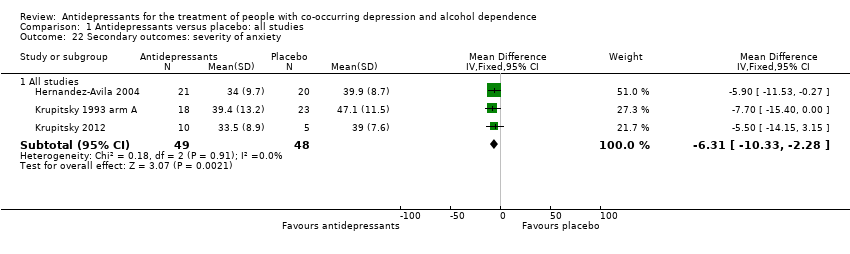
Comparison 1 Antidepressants versus placebo: all studies, Outcome 22 Secondary outcomes: severity of anxiety.
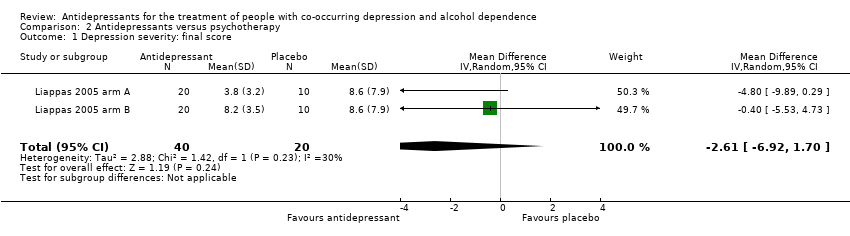
Comparison 2 Antidepressants versus psychotherapy, Outcome 1 Depression severity: final score.
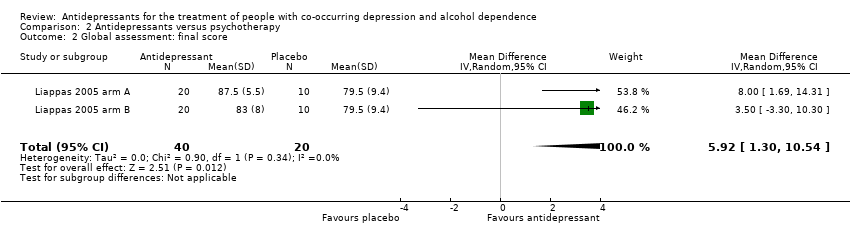
Comparison 2 Antidepressants versus psychotherapy, Outcome 2 Global assessment: final score.
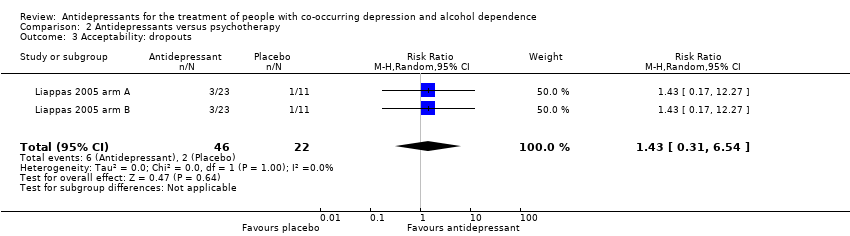
Comparison 2 Antidepressants versus psychotherapy, Outcome 3 Acceptability: dropouts.
| Antidepressants compared to placebo: all studies | ||||||
| Patient or population: people with co‐occurring depression and alcohol dependence Settings: unknown | ||||||
| Outcomes | Illustrative comparative risks* (95% CI) | Relative effect | No of Participants | Quality of the evidence | Comments | |
| Assumed risk | Corresponding risk | |||||
| Placebo | Antidepressants | |||||
| Depression severity: final score (interviewer‐rated scales) | ‐ | The mean depression: final score (interviewer‐rated scales) ‐ all studies in the intervention groups was 0.27 standard deviations lower (0.49 lower to 0.04 lower) | ‐ | 1074 | ⊕⊕⊝⊝ | ‐ |
| Response to antidepressive treatment | Study population | RR 1.40 | 805 | ⊕⊝⊝⊝ | ‐ | |
| 481 per 1000 | 674 per 1000 | |||||
| 392 per 1000 | 521 per 1000 | |||||
| Consumption of alcohol: abstinent days (%) | ‐ | The mean alcohol: abstinent days (%) ‐ all studies in the intervention groups was 1.34 higher (1.66 lower to 4.34 higher) | ‐ | 821 | ⊕⊕⊝⊝ | ‐ |
| Consumption of alcohol: abstinent participants (number) | Study population | RR 1.71 | 424 | ⊕⊕⊕⊝ | ‐ | |
| 199 per 1000 | 340 per 1000 | |||||
| 188 per 1000 | 321 per 1000 | |||||
| Consumption of alcohol: drinks (per drinking days) | ‐ | The mean alcohol: drinks (per drinking days) ‐ all studies in the intervention groups was | ‐ | 451 | ⊕⊕⊕⊝ | ‐ |
| Acceptability: dropouts | Study population | RR 0.98 | 1159 | ⊕⊕⊝⊝ | ‐ | |
| 334 per 1000 | 328 per 1000 | |||||
| 307 per 1000 | 301 per 1000 | |||||
| Tolerability of treatment: withdrawal for medical reasons | Study population | RR 1.15 | 947 | ⊕⊕⊝⊝ | ‐ | |
| 69 per 1000 | 80 per 1000 | |||||
| 32 per 1000 | 37 per 1000 | |||||
| *The basis for the assumed risk (e.g. the median control group risk across studies) is provided in footnotes. The corresponding risk (and its 95% confidence interval) is based on the assumed risk in the comparison group and the relative effect of the intervention (and its 95% CI). | ||||||
| GRADE Working Group grades of evidence | ||||||
| 1Nine studies at unclear risk for selection bias; two studies at high risk and six at unclear risk for performance bias; 13 studies at unclear risk for detection bias (subjective); one study at high risk and two at unclear risk for attrition bias; three studies at high risk and one at unclear risk for reporting bias. 6Seven studies with unclear risk of selection bias; one study at high risk and five studies at unclear risk for performance bias; all studies at unclear risk for detection bias (subjective); one study at high risk and two at unclear risk for reporting bias. | ||||||
| Outcome or subgroup title | No. of studies | No. of participants | Statistical method | Effect size |
| 1 Depression severity: final score (interviewer‐rated scales) Show forest plot | 14 | Std. Mean Difference (IV, Random, 95% CI) | Subtotals only | |
| 1.1 All studies | 14 | 1074 | Std. Mean Difference (IV, Random, 95% CI) | ‐0.27 [‐0.49, ‐0.04] |
| 1.2 Selective serotonin reuptake inhibitors (SSRIs) | 10 | 881 | Std. Mean Difference (IV, Random, 95% CI) | ‐0.17 [‐0.40, 0.07] |
| 1.3 5‐HT2 antagonists | 2 | 97 | Std. Mean Difference (IV, Random, 95% CI) | ‐0.29 [‐0.69, 0.11] |
| 2 Depression severity: final score (self‐administered scales) Show forest plot | 8 | Std. Mean Difference (IV, Random, 95% CI) | Subtotals only | |
| 2.1 All studies | 8 | 373 | Std. Mean Difference (IV, Random, 95% CI) | ‐0.29 [‐0.64, 0.07] |
| 2.2 SSRIs | 5 | 300 | Std. Mean Difference (IV, Random, 95% CI) | ‐0.25 [‐0.69, 0.18] |
| 2.3 5‐HT2 antagonists | 2 | 41 | Std. Mean Difference (IV, Random, 95% CI) | 0.02 [‐0.59, 0.64] |
| 3 Depression severity: difference between basal and final score (interviewer‐rated scales) Show forest plot | 5 | Std. Mean Difference (IV, Random, 95% CI) | Subtotals only | |
| 3.1 All studies | 5 | 447 | Std. Mean Difference (IV, Random, 95% CI) | 0.15 [‐0.12, 0.42] |
| 3.2 SSRIs | 4 | 408 | Std. Mean Difference (IV, Random, 95% CI) | 0.07 [‐0.18, 0.32] |
| 4 Depression severity: difference between basal and final score (self‐administered scales) Show forest plot | 4 | Std. Mean Difference (IV, Random, 95% CI) | Subtotals only | |
| 4.1 All studies | 4 | 121 | Std. Mean Difference (IV, Random, 95% CI) | 0.20 [‐0.16, 0.56] |
| 4.2 SSRIs | 2 | 80 | Std. Mean Difference (IV, Random, 95% CI) | 0.29 [‐0.16, 0.73] |
| 4.3 5‐HT2 antagonists | 2 | 41 | Std. Mean Difference (IV, Random, 95% CI) | 0.02 [‐0.59, 0.64] |
| 5 Response to antidepressive treatment Show forest plot | 10 | Risk Ratio (M‐H, Random, 95% CI) | Subtotals only | |
| 5.1 All studies | 10 | 805 | Risk Ratio (M‐H, Random, 95% CI) | 1.40 [1.08, 1.82] |
| 5.2 Tricyclic antidepressants (TCAs) | 4 | 212 | Risk Ratio (M‐H, Random, 95% CI) | 1.60 [1.09, 2.34] |
| 5.3 SSRIs | 5 | 529 | Risk Ratio (M‐H, Random, 95% CI) | 1.19 [0.87, 1.63] |
| 6 Full remission of depression Show forest plot | 4 | Risk Ratio (M‐H, Random, 95% CI) | Subtotals only | |
| 6.1 All studies | 4 | 372 | Risk Ratio (M‐H, Random, 95% CI) | 1.19 [0.77, 1.83] |
| 6.2 SSRIs | 3 | 308 | Risk Ratio (M‐H, Random, 95% CI) | 1.00 [0.74, 1.36] |
| 7 Consumption of alcohol: abstinent days (%) Show forest plot | 9 | Mean Difference (IV, Random, 95% CI) | Subtotals only | |
| 7.1 All studies | 9 | 821 | Mean Difference (IV, Random, 95% CI) | 1.34 [‐1.66, 4.34] |
| 7.2 SSRIs | 7 | 711 | Mean Difference (IV, Random, 95% CI) | ‐0.47 [‐3.20, 2.26] |
| 8 Consumption of alcohol: abstinent participants (number) Show forest plot | 7 | Risk Ratio (M‐H, Random, 95% CI) | Subtotals only | |
| 8.1 All studies | 7 | 424 | Risk Ratio (M‐H, Random, 95% CI) | 1.71 [1.22, 2.39] |
| 8.2 SSRIs | 4 | 250 | Risk Ratio (M‐H, Random, 95% CI) | 1.66 [1.02, 2.68] |
| 8.3 5‐HT2 antagonists | 2 | 105 | Risk Ratio (M‐H, Random, 95% CI) | 1.62 [0.77, 3.39] |
| 9 Consumption of alcohol: drinking days (per week) Show forest plot | 2 | Mean Difference (IV, Fixed, 95% CI) | Subtotals only | |
| 9.1 All studies | 2 | 55 | Mean Difference (IV, Fixed, 95% CI) | ‐1.15 [‐2.35, 0.05] |
| 9.2 5‐HT2 antagonists | 2 | 55 | Mean Difference (IV, Fixed, 95% CI) | ‐1.15 [‐2.35, 0.05] |
| 10 Consumption of alcohol: drinks (per drinking days) Show forest plot | 7 | Mean Difference (IV, Random, 95% CI) | Subtotals only | |
| 10.1 All studies | 7 | 451 | Mean Difference (IV, Random, 95% CI) | ‐1.13 [‐1.79, ‐0.46] |
| 10.2 SSRIs | 3 | 271 | Mean Difference (IV, Random, 95% CI) | ‐1.42 [‐2.58, ‐0.26] |
| 10.3 5‐HT2 antagonists | 3 | 111 | Mean Difference (IV, Random, 95% CI) | ‐1.06 [‐2.00, ‐0.11] |
| 11 Consumption of alcohol: drinks (per week) Show forest plot | 2 | Mean Difference (IV, Fixed, 95% CI) | Subtotals only | |
| 11.1 All studies | 2 | 55 | Mean Difference (IV, Fixed, 95% CI) | ‐5.06 [‐12.30, 2.18] |
| 11.2 5‐HT2 antagonists | 2 | 55 | Mean Difference (IV, Fixed, 95% CI) | ‐5.06 [‐12.30, 2.18] |
| 12 Consumption of alcohol: heavy drinking days (per week) Show forest plot | 5 | Mean Difference (IV, Random, 95% CI) | Subtotals only | |
| 12.1 All studies | 5 | 313 | Mean Difference (IV, Random, 95% CI) | ‐0.33 [‐0.85, 0.20] |
| 12.2 SSRIs | 2 | 189 | Mean Difference (IV, Random, 95% CI) | ‐0.41 [‐1.09, 0.27] |
| 12.3 5‐HT2 antagonists | 2 | 55 | Mean Difference (IV, Random, 95% CI) | ‐0.43 [‐2.09, 1.22] |
| 13 Consumption of alcohol: heavy drinkers (number) Show forest plot | 9 | Risk Ratio (M‐H, Random, 95% CI) | Subtotals only | |
| 13.1 All studies | 7 | 459 | Risk Ratio (M‐H, Random, 95% CI) | 0.78 [0.57, 1.07] |
| 13.2 SSRIs | 6 | 431 | Risk Ratio (M‐H, Random, 95% CI) | 0.87 [0.69, 1.11] |
| 13.3 5‐HT2 antagonists | 2 | 99 | Risk Ratio (M‐H, Random, 95% CI) | 1.78 [0.68, 4.67] |
| 14 Consumption of alcohol: time to first relapse (days) Show forest plot | 6 | Mean Difference (IV, Random, 95% CI) | Subtotals only | |
| 14.1 All studies | 6 | 348 | Mean Difference (IV, Random, 95% CI) | 2.54 [‐8.79, 13.87] |
| 14.2 SSRIs | 6 | 348 | Mean Difference (IV, Random, 95% CI) | 2.54 [‐8.79, 13.87] |
| 15 Liver enzyme levels: γ‐glutamyltransferase (U/L) Show forest plot | 2 | Mean Difference (IV, Random, 95% CI) | Subtotals only | |
| 15.1 All studies | 2 | 56 | Mean Difference (IV, Random, 95% CI) | ‐8.39 [‐26.47, 9.68] |
| 16 Depression and alcohol: global response Show forest plot | 3 | Risk Ratio (M‐H, Random, 95% CI) | Subtotals only | |
| 16.1 All studies | 3 | 152 | Risk Ratio (M‐H, Random, 95% CI) | 2.37 [1.34, 4.19] |
| 16.2 TCAs | 2 | 92 | Risk Ratio (M‐H, Random, 95% CI) | 2.09 [1.09, 4.02] |
| 17 Acceptability: dropouts Show forest plot | 17 | Risk Ratio (M‐H, Random, 95% CI) | Subtotals only | |
| 17.1 All studies | 17 | 1159 | Risk Ratio (M‐H, Random, 95% CI) | 0.98 [0.79, 1.22] |
| 17.2 TCAs | 4 | 216 | Risk Ratio (M‐H, Random, 95% CI) | 1.21 [0.48, 3.06] |
| 17.3 SSRIs | 8 | 759 | Risk Ratio (M‐H, Random, 95% CI) | 1.04 [0.79, 1.36] |
| 17.4 5‐HT2 antagonists | 4 | 154 | Risk Ratio (M‐H, Random, 95% CI) | 0.79 [0.38, 1.64] |
| 18 Tolerability of treatment: adverse events Show forest plot | 15 | Risk Ratio (M‐H, Random, 95% CI) | Subtotals only | |
| 18.1 Withdrawal for medical reasons: all studies | 10 | 947 | Risk Ratio (M‐H, Random, 95% CI) | 1.15 [0.65, 2.04] |
| 18.2 Withdrawal for medical reasons: SSRIs | 7 | 786 | Risk Ratio (M‐H, Random, 95% CI) | 1.10 [0.52, 2.32] |
| 18.3 Withdrawal for medical reasons: TCAs | 2 | 97 | Risk Ratio (M‐H, Random, 95% CI) | 0.91 [0.10, 8.41] |
| 18.4 Total adverse events: all studies | 5 | 644 | Risk Ratio (M‐H, Random, 95% CI) | 1.18 [0.97, 1.44] |
| 18.5 Total adverse events: TCAs | 2 | 115 | Risk Ratio (M‐H, Random, 95% CI) | 1.66 [1.13, 2.42] |
| 18.6 Total adverse events: SSRIs | 3 | 529 | Risk Ratio (M‐H, Random, 95% CI) | 1.06 [0.92, 1.23] |
| 18.7 Dry mouth: all studies | 2 | 132 | Risk Ratio (M‐H, Random, 95% CI) | 1.91 [0.96, 3.81] |
| 18.8 Insomnia: all studies | 4 | 564 | Risk Ratio (M‐H, Random, 95% CI) | 1.69 [1.02, 2.77] |
| 18.9 Insomnia: SSRIs | 2 | 469 | Risk Ratio (M‐H, Random, 95% CI) | 1.75 [1.04, 2.96] |
| 18.10 Headache: all studies | 3 | 470 | Risk Ratio (M‐H, Random, 95% CI) | 1.21 [0.89, 1.64] |
| 18.11 Headache: SSRIs | 2 | 414 | Risk Ratio (M‐H, Random, 95% CI) | 1.18 [0.87, 1.61] |
| 18.12 Dizziness: all studies | 2 | 139 | Risk Ratio (M‐H, Random, 95% CI) | 1.68 [0.42, 6.73] |
| 18.13 Diarrhoea: all studies | 2 | 139 | Risk Ratio (M‐H, Random, 95% CI) | 1.95 [0.37, 10.22] |
| 18.14 Nausea: all studies | 3 | 277 | Risk Ratio (M‐H, Random, 95% CI) | 1.46 [0.66, 3.23] |
| 18.15 Nausea: SSRIs | 2 | 221 | Risk Ratio (M‐H, Random, 95% CI) | 1.44 [0.62, 3.35] |
| 18.16 Constipation: all studies | 2 | 387 | Risk Ratio (M‐H, Random, 95% CI) | 1.70 [0.19, 15.64] |
| 18.17 Total serious adverse events: all studies | 7 | 774 | Risk Ratio (M‐H, Random, 95% CI) | 1.22 [0.80, 1.86] |
| 18.18 Total serious adverse events: SSRIs | 5 | 721 | Risk Ratio (M‐H, Random, 95% CI) | 1.22 [0.80, 1.86] |
| 18.19 Worsening of clinical condition because of relapse: all studies | 2 | 413 | Risk Ratio (M‐H, Random, 95% CI) | 2.81 [0.73, 10.87] |
| 18.20 Worsening of clinical condition because of relapse: SSRIs | 2 | 413 | Risk Ratio (M‐H, Random, 95% CI) | 2.81 [0.73, 10.87] |
| 18.21 Depression: all studies | 2 | 413 | Risk Ratio (M‐H, Random, 95% CI) | 2.31 [0.30, 17.69] |
| 18.22 Depression: SSRIs | 2 | 413 | Risk Ratio (M‐H, Random, 95% CI) | 2.31 [0.30, 17.69] |
| 19 Suicide attempts Show forest plot | 4 | Risk Ratio (M‐H, Random, 95% CI) | Subtotals only | |
| 19.1 All studies | 4 | 602 | Risk Ratio (M‐H, Random, 95% CI) | 1.33 [0.23, 7.61] |
| 19.2 SSRIs | 4 | 602 | Risk Ratio (M‐H, Random, 95% CI) | 1.33 [0.23, 7.61] |
| 20 Secondary outcomes: craving Show forest plot | 2 | Mean Difference (IV, Fixed, 95% CI) | Subtotals only | |
| 20.1 All studies | 2 | 29 | Mean Difference (IV, Fixed, 95% CI) | 1.00 [‐3.27, 5.27] |
| 21 Secondary outcomes: severity of dependence Show forest plot | 2 | Std. Mean Difference (IV, Fixed, 95% CI) | Subtotals only | |
| 21.1 All studies | 2 | 168 | Std. Mean Difference (IV, Fixed, 95% CI) | ‐0.14 [‐0.44, 0.17] |
| 22 Secondary outcomes: severity of anxiety Show forest plot | 3 | Mean Difference (IV, Fixed, 95% CI) | Subtotals only | |
| 22.1 All studies | 3 | 97 | Mean Difference (IV, Fixed, 95% CI) | ‐6.31 [‐10.33, ‐2.28] |
| Outcome or subgroup title | No. of studies | No. of participants | Statistical method | Effect size |
| 1 Depression severity: final score Show forest plot | 2 | 60 | Mean Difference (IV, Random, 95% CI) | ‐2.61 [‐6.92, 1.70] |
| 2 Global assessment: final score Show forest plot | 2 | 60 | Mean Difference (IV, Random, 95% CI) | 5.92 [1.30, 10.54] |
| 3 Acceptability: dropouts Show forest plot | 2 | 68 | Risk Ratio (M‐H, Random, 95% CI) | 1.43 [0.31, 6.54] |