نقش داروهای ضد‐افسردگی برای درمان افرادی که به طور همزمان مبتلا به افسردگی و وابستگی به الکل هستند
Appendices
Appendix 1. Abbreviations
-
ADS: Alcohol Dependence Scale
-
ALT: alanine aminotransferase
-
ASI: Addiction Severity Index
-
AST: aspartate aminotransferase
-
AUD: Alcohol Use Disorder
-
AUDIT: Alcohol Use Disorders Identification Test
-
BAI: Beck Anxiety Inventory
-
BDI: Beck Depression Inventory
-
BPRS: Brief Psychiatric Rating Scale
-
BSCS: Brief Substance Craving Scale
-
CBT: cognitive behavioural therapy
-
CCT: controlled clinical trial
-
CDAG: Cochrane Drugs and Alcohol Group
-
CDT: carbohydrate deficient transferrin
-
CGI: Clinical Global Impression scale
-
CI: confidence intervals
-
CIWA‐Ar: Clinical Institute Withdrawal Assessment for Alcohol scale, Revised
-
DBI: Drinking Behaviour Interview
-
DOTES: Dosage Record and Treatment Emergent Symptoms Scale
-
DrInC: Drinker Inventory of Consequences scale
-
DSM: Diagnostic and Statistic Manual of Mental Disorders
-
ECT: electroconvulsive therapy
-
GAD: generalized anxiety disorder
-
GAF: General Assessment of Functioning scale
-
GAS: Global Assessment Scale
-
GGT: γ‐glutamyltransferase
-
HRSA: Hamilton Anxiety Rating Scale
-
HRSD: Hamilton Depression Rating Scale
-
HSCL: Hopkins Symptom Checklist
-
ICD: International Classification of Diseases
-
LDQ: Leeds Dependence Questionnaire
-
LDRS: Lehmann Depression Rating Scale
-
MADRS: Montgomery and Åsberg Depression Rating Scale
-
MAOI: monoamine oxidase inhibitor
-
MAST: Michigan Alcoholism Screening Test
-
MD: mean difference
-
MET: motivational enhancement therapy
-
MINI: Mini International Neuropsychiatric Interview
-
MMPI: Minnesota Multiphasic Personality Inventory
-
MMSE: Mini‐Mental State Examination
-
OCDS: Obsessive‐Compulsive Drinking Scale
-
PACS: Penn Alcohol Craving scale
-
PANSS: Positive and Negative Syndrome Scale
-
PRISM: Psychiatric Rating Instrument for Mental Disorders and Substance Abuse
-
PSQI: Pittsburgh Sleep Quality Index
-
RCT: randomized controlled trial
-
RR: risk ratio
-
STAI: State Trait Anxiety Inventory
-
SAFTEE: Systematic Assessment for Treatment of Emergent Events
-
SCID: Structured Clinical Interview for DSM
-
SCL‐90: Symptom Check List‐90
-
SD: standard deviation
-
SDS: Severity of Dependence Scale
-
SF‐36: 36‐item Short Form (health‐related quality of life questionnaire)
-
SMD: standardized mean difference
-
SNRI: serotonin‐noradrenaline reuptake inhibitor
-
SOFAS: Social and Occupational Functioning Assessment Scale
-
SSRI: selective serotonin reuptake inhibitor
-
SUD: substance‐use disorder
-
TCA: tricyclic antidepressant
-
TLFB: timeline follow‐back
-
UKU: Udvalg for Kliniske Undersogelser Side Effect Rating Scale
-
VAS: Visual Analogue Scale
-
WHO: World Health Organization
-
ZUNG: Zung Self‐Assessment Depression Scale
Appendix 2. Cochrane Drug and Alcohol Group Specialised Register search strategy
CDAG Specialised register (via CRSLive)
4 July 2017 (197 hits)
1. (antidepressant*) AND (INREGISTER)
2. (citalopram OR escitalopram OR paroxetine OR fluoxetine OR fluvoxamine OR sertraline OR trazodone OR nefazodone OR venlafaxine OR desvenlafaxine OR duloxetine OR reboxetine OR bupropion OR amoxapine OR amitriptyline OR maprotiline OR nortriptyline OR desipramine OR trimipramine OR imipramine OR protriptyline OR doxepin OR clomipramine OR mirtazapine OR mianserin OR moclobemide OR phenelzine OR tranylcypromine OR agomelatine OR Acetylcarnitine OR Alaproclate OR Amersergide OR Amiflamine OR Amineptine OR Amisulpride OR Befloxatone OR Benactyzine OR Brofaromine OR Butriptyline OR Caroxazone OR Chlorpoxiten OR Cilosamine OR Cimoxatone OR Clorgyline OR Clorimipramine OR Clovoxamine OR Deanol OR Demexiptiline OR Deprenyl OR Dibenzipin OR Diclofensine OR Dothiepin OR Etoperidone OR Femoxetine OR Fluotracen OR Fluparoxan OR Idazoxan OR Iprindole OR Iproniazid OR isocarboxazid OR Litoxetine OR Lofepramine OR Medifoxamine OR Melitracen OR Metapramine OR Milnacipran OR Minaprine OR Nialamide OR Nomifensine OR Noxiptiline OR Opipramol OR Oxaflozane OR Oxaprotiline OR Pargyline OR Piribedil OR Pirlindole OR Pivagabine OR Prosulpride OR Protriptyline OR Quinupramine OR Rolipram OR SSRI OR Setiptiline OR Sulpiride OR Teniloxine OR Tetrindole OR Thiazesim OR Thozalinone OR Tianeptine OR Toloxatone OR Tomoxetine OR Viloxazine OR Viqualine OR Zimeldine) AND (INREGISTER)
3. #1 OR #2
4. (alcohol:TI) AND (INREGISTER)
5. (alcohol:AB) AND (INREGISTER)
6. (alcohol*:XDI) AND (INREGISTER)
7. #4 OR #5 OR #6
8. #3 AND #7
Appendix 3. CENTRAL search strategy
CENTRAL (via onlinelibrary.wiley.com)
2017, Issue 7 (695 hits)
1. MeSH descriptor: (Alcohol‐Related Disorders) explode all trees
2. ((alcohol) near (dependen* or disorder* or drink* or misuse or abuse* or consumption)):ti,ab,kw
3. alcohol*:ti,ab,kw
4. MeSH descriptor: (Drinking Behavior) explode all trees
5. #1 or #2 or #3 or #4
6. MeSH descriptor: (Antidepressive Agents) explode all trees
7. anti next depres*:ti,ab,kw
8. Antidepress* or "Monoamine Oxidase Inhibitors" or "Selective Serotonin Reuptake Inhibitors" or "Tricyclic Drugs" or acetylcarnitine or agomelatine or alaproclate or amesergide or amiflamine or amineptine or amitriptyline or amoxapine or befloxatone or benactyzine or brofaromine or bupropion or butriptyline or caroxazone or chlorproxithene or cilobamine or cimoxatone or citalopram or clomipramine or clorgyline or chlorimipramine or clovoxamine or deanol or demexiptiline or deprenyl or desipramine or dibenzepin or diclofensine or dothiepin or doxepin or duloxetine or escitalopram or etoperidone or femoxetine or fluotracen or fluoxetine or fluparoxan or fluvoxamine or idazoxan or imipramine or Iprindol* or iproniazid or isocarboxazid or Litoxetin* or Lofepramin* or Maprotilin* or Medifoxamin* or melitracene or Metapramin* or mianserin or milnacipran or Minaprin* or Mirtazapin* or Moclobemid* or Nefazodon* or Nialamid* or Nomifensin* or Nortriptylin* or Noxiptilin* or opipramol or Oxaflozan* or Oxaprotilin* or Pargylin* or Paroxetin* or Phenelzin* or piribedil or Pirlindol* or Pivagabin* or Prosulprid* or Protriptylin* or Quinupramin* or Reboxetin* or rolipram or selegiline or Sertralin* or Setiptilin* or teniloxazine or Tetrindol* or thiazesim or Thozalinon* or Tianeptin* or Toloxaton* or Tomoxetin* or Tranylcypromin* or Trazodon* or Trimipramin* or Venlafaxin* or Viloxazin* or Viqualin* or Zimeldin*:ti,ab,kw
9. #6 or #7 or #8
10. #5 and #9
Appendix 4. MEDLINE search strategy
MEDLINE (via PubMed)
4 July 2017 (4174 hits)
1. Alcohol‐Related Disorders(MeSH)
2. ((alcohol) AND (dependen* OR disorder* OR drink* OR misuse OR abuse* OR consumption))
3. alcohol* (tiab)
4. Drinking behaviour(MeSH)
5. #1 OR #2 OR #3 OR #4
6. Antidepressive Agents(MeSH)
7. anti‐depres*(tiab)
8. Antidepress* OR "Monoamine Oxidase Inhibitors" OR "Selective Serotonin Reuptake Inhibitors" OR "Tricyclic Drugs" OR acetylcarnitine OR agomelatine OR alaproclate OR amesergide OR amiflamine OR amineptine OR amitriptyline OR amoxapine OR befloxatone OR benactyzine OR brofaromine OR bupropion OR butriptyline OR caroxazone OR chlorproxithene OR cilobamine OR cimoxatone OR citalopram OR clomipramine OR clorgyline OR chlorimipramine OR clovoxamine OR deanol OR demexiptiline OR deprenyl OR desipramine OR dibenzepin OR diclofensine OR dothiepin OR doxepin OR duloxetine OR escitalopram OR etoperidone OR femoxetine OR fluotracen OR fluoxetine OR fluparoxan OR fluvoxamine OR idazoxan OR imipramine OR Iprindol* OR iproniazid OR isocarboxazid OR Litoxetin* OR Lofepramin* OR Maprotilin* OR Medifoxamin* OR melitracene OR Metapramin* OR mianserin OR milnacipran OR Minaprin* OR Mirtazapin* OR Moclobemid* OR Nefazodon* OR Nialamid* OR Nomifensin* OR Nortriptylin* OR Noxiptilin* OR opipramol OR Oxaflozan* OR Oxaprotilin* OR Pargylin* OR Paroxetin* OR Phenelzin* OR piribedil OR Pirlindol* OR Pivagabin* OR Prosulprid* OR Protriptylin* OR Quinupramin* OR Reboxetin* OR rolipram OR selegiline OR Sertralin* OR Setiptilin* OR teniloxazine OR Tetrindol* OR thiazesim OR Thozalinon* OR Tianeptin* OR Toloxaton* OR Tomoxetin* OR Tranylcypromin* OR Trazodon* OR Trimipramin* OR Venlafaxin* OR Viloxazin* OR Viqualin* OR Zimeldin*
9. #6 OR #7 OR #8
10. randomized controlled trial(pt)
11. controlled clinical trial(pt)
12. randomized(tiab)
13. placebo(tiab)
14. drug therapy(sh)
15. randomly(tiab)
16. trial(tiab)
17. groups(tiab)
18. #10 OR #11 OR #12 OR #13 OR #14 OR #15 OR #16 OR #17
19. animals(mh) NOT humans(mh)
20. #18 NOT #19
21. #5 AND #9 AND #20
Appendix 5. Embase search strategy
Embase (via embase.com)
4 July 2017 (3466 hits)
exp alcoholism'/exp OR alcohol NEAR/6 (dependen* OR disorder* OR drink* OR misuse OR abuse* OR consumption) OR alcohol*:ab,ti OR 'drinking behavior'/exp AND ('clinical trial'/exp OR 'controlled clinical trial'/exp OR 'crossover procedure'/exp OR 'single blind procedure'/exp OR 'double blind procedure'/exp OR 'randomized controlled trial'/exp OR placebo:ab,ti OR 'double blind':ab,ti OR 'single blind':ab,ti OR assign*:ab,ti OR allocat*:ab,ti OR volunteer*:ab,ti OR random*:ab,ti OR factorial*:ab,ti OR crossover:ab,ti OR (cross:ab,ti AND over:ab,ti)) AND ('antidepressant agent'/exp OR antidepress*:ab,ti OR antidepress* OR 'monoamine oxidase inhibitors'/exp OR 'selective serotonin reuptake inhibitors' OR 'tricyclic drugs' OR 'acetylcarnitine'/exp OR 'agomelatine'/exp OR 'alaproclate'/exp OR amersergide OR 'amiflamine'/exp OR 'amineptine'/exp OR 'amitriptyline'/exp OR 'amoxapine'/exp OR 'befloxatone'/exp OR 'benactyzine'/exp OR 'brofaromine'/exp OR 'bupropion'/exp OR 'butriptyline'/exp OR caroxazone OR chlorpoxiten OR cilosamine OR 'cimoxatone'/exp OR 'citalopram'/exp OR 'clomipramine'/exp OR 'clorgyline'/exp OR clorimipramine OR 'clovoxamine'/exp OR 'deanol'/exp OR 'demexiptiline'/exp OR 'deprenyl'/exp OR 'desipramine'/exp OR dibenzipin OR 'diclofensine'/exp OR 'dothiepin'/exp OR 'doxepin'/exp OR 'duloxetine'/exp OR 'escitalopram'/exp OR 'etoperidone'/exp OR 'femoxetine'/exp OR fluotracen OR 'fluoxetine'/exp OR 'fluparoxan'/exp OR 'fluvoxamine'/exp OR 'idazoxan'/exp OR 'imipramine'/exp OR iprindol* OR 'iproniazid'/exp OR 'isocarboxazid'/exp OR litoxetin* OR lofepramin* OR maprotilin* OR medifoxamin* OR 'melitracen'/exp OR metapramin* OR 'mianserin'/exp OR 'milnacipran'/exp OR minaprin* OR mirtazapin* OR moclobemid* OR nefazodon* OR nialamid* OR nomifensin* OR nortriptylin* OR noxiptilin* OR 'opipramol'/exp OR oxaflozan* OR oxaprotilin* OR pargylin* OR paroxetin* OR phenelzin* OR 'piribedil'/exp OR pirlindol* OR pivagabin* OR prosulprid* OR protriptylin* OR quinupramin* OR reboxetin* OR 'rolipram'/exp OR seleginine OR sertralin* OR setiptilin* OR teniloxine OR tetrindol* OR thiazesim OR thozalinon* OR tianeptin* OR toloxaton* OR tomoxetin* OR tranylcypromin* OR trazodon* OR viqualin* OR zimeldin*)
Appendix 6. Criteria for risk of bias assessment
| Item | Judgement | Description |
| 1. Random sequence generation (selection bias) | Low risk | The investigators describe a random component in the sequence generation process such as: random number table; computer random number generator; coin tossing; shuffling cards or envelopes; throwing dice; drawing of lots; minimization. |
| High risk | The investigators describe a non‐random component in the sequence generation process such as: odd or even date of birth; date (or day) of admission; hospital or clinic record number; alternation; judgement of the clinician; results of a laboratory test or a series of tests; availability of the intervention. | |
| Unclear risk | Insufficient information about the sequence generation process to permit judgement of low or high risk. | |
| 2. Allocation concealment (selection bias) | Low risk | Investigators enrolling participants could not foresee assignment because 1 of the following, or an equivalent method, was used to conceal allocation: central allocation (including telephone, web‐based, and pharmacy‐controlled, randomization); sequentially numbered drug containers of identical appearance; sequentially numbered, opaque, sealed envelopes. |
| High risk | Investigators enrolling participants could possibly foresee assignments because 1 of the following methods was used: open random allocation schedule (e.g. a list of random numbers); assignment envelopes without appropriate safeguards (e.g. if envelopes were unsealed or nonopaque or not sequentially numbered); alternation or rotation; date of birth; case record number; any other explicitly unconcealed procedure. | |
| Unclear risk | Insufficient information to permit judgement of low or high risk. This is usually the case if the method of concealment is not described or not described in sufficient detail to allow a definite judgement. | |
| 3. Blinding of participants and providers (performance bias) | Low risk | No blinding or incomplete blinding, but the review authors judge that the outcome is not likely to be influenced by lack of blinding. Blinding of participants and key study personnel ensured, and unlikely that the blinding could have been broken. |
| High risk | No blinding or incomplete blinding, and the outcome is likely to be influenced by lack of blinding. Blinding of key study participants and personnel attempted, but likely that the blinding could have been broken, and the outcome is likely to be influenced by lack of blinding. | |
| Unclear risk | Insufficient information to permit judgement of low or high risk. | |
| 4. Blinding of outcome assessor (detection bias) Objective outcomes | Low risk | No blinding of outcome assessment, but the review authors judge that the outcome measurement is not likely to be influenced by lack of blinding. Blinding of outcome assessment ensured, and unlikely that the blinding could have been broken. |
| High risk | No blinding of outcome assessment, and the outcome measurement is likely to be influenced by lack of blinding. Blinding of outcome assessment, but likely that the blinding could have been broken, and the outcome measurement is likely to be influenced by lack of blinding. | |
| Unclear risk | Insufficient information to permit judgement of low or high risk. | |
| 5. Blinding of outcome assessor (detection bias) Subjective outcomes | Low risk | Blinding of outcome assessment ensured, and unlikely that the blinding could have been broken. |
| High risk | No blinding of outcome assessment, and the outcome measurement is likely to be influenced by lack of blinding. Blinding of outcome assessment, but likely that the blinding could have been broken, and the outcome measurement is likely to be influenced by lack of blinding. | |
| Unclear risk | Insufficient information to permit judgement of low or high risk. | |
| 6. Incomplete outcome data (attrition bias) For all outcomes except retention in treatment or dropout | Low risk | No missing outcome data. Reasons for missing outcome data unlikely to be related to true outcome (for survival data, censoring unlikely to be introducing bias). Missing outcome data balanced in numbers across intervention groups, with similar reasons for missing data across groups. For dichotomous outcome data, the proportion of missing outcomes compared with observed event risk not enough to have a clinically relevant impact on the intervention effect estimate. For continuous outcome data, plausible effect size (difference in means or standardized difference in means) among missing outcomes not enough to have a clinically relevant impact on observed effect size. Missing data have been imputed using appropriate methods. All randomized participants are reported/analyzed in the group they were allocated to by randomization irrespective of non‐compliance and cointerventions (intention to treat). |
| High risk | Reason for missing outcome data likely to be related to true outcome, with either imbalance in numbers or reasons for missing data across intervention groups. For dichotomous outcome data, the proportion of missing outcomes compared with observed event risk enough to induce clinically relevant bias in intervention effect estimate. For continuous outcome data, plausible effect size (difference in means or standardized difference in means) among missing outcomes enough to induce clinically relevant bias in observed effect size. 'As‐treated' analysis done with substantial departure of the intervention received from that assigned at randomization. | |
| Unclear risk | Insufficient information to permit judgement of low or high risk (e.g. number randomized not stated, no reasons for missing data provided; number of dropouts not reported for each group). | |
| 7. Selective reporting (reporting bias) | Low risk | Study protocol is available and all of study's prespecified (primary and secondary) outcomes that are of interest in the review have been reported in the prespecified way. Study protocol is not available but it is clear that the published reports include all expected outcomes, including those that were prespecified (convincing text of this nature may be uncommon). |
| High risk | Not all of study's prespecified primary outcomes have been reported. One or more primary outcomes is reported using measurements, analysis methods or subsets of the data (e.g. subscales) that were not prespecified. One or more reported primary outcomes were not prespecified (unless clear justification for their reporting is provided, such as an unexpected adverse effect). One or more outcomes of interest in the review are reported incompletely so that they cannot be entered in a meta‐analysis. Study report fails to include results for a key outcome that would be expected to have been reported for such a study. | |
| Unclear risk | Insufficient information to permit judgement of low or high risk. |
Appendix 7. Treatment regimens in included studies
Antidepressants versus placebo
22 studies compared the efficacy of an antidepressant versus placebo (Adamson 2015; Altamura 1990; Butterworth 1971b; Cornelius 1997; Cornelius 2016; Gallant 1969 arm a; Gual 2003; Hernandez‐Avila 2004; Kranzler 2006 arm A; Kranzler 2006 arm B; Krupitsky 1993 arm A; Krupitsky 2012; Mason 1996; McGrath 1996; McLean 1986; Moak 2003; Nunes 1993; Pettinati 2001a; Pettinati 2010 arm A; Pettinati 2010 arm B; Roy 1998; Roy‐Byrne 2000; 1438 participants).
-
Amitriptyline (75 mg/day) or placebo for 3 weeks (Krupitsky 1993 arm A; 41 participants)
-
Citalopram (up to 60 mg/day) plus naltrexone (up to 100 mg/day) or placebo plus naltrexone (up to 100 mg/day) for 12 weeks (Adamson 2015; 138 participants)
-
Desipramine (200 mg/day) or placebo for 6 months (Mason 1996; 28 participants)
-
Doxepin (75 mg/day or 150 mg/day) or placebo for 3 weeks (Gallant 1969 arm a; 76 participants)
-
Escitalopram (10 mg/day) or placebo for 13 weeks (Krupitsky 2012; 60 participants)
-
Fluoxetine (20 mg/day) or placebo for 12 weeks (Cornelius 1997; 51 participants)
-
Imipramine (25 mg/day) or placebo for 3 weeks (Butterworth 1971b; 40 participants)
-
Imipramine (up to 300 mg/day) or placebo for 12 weeks (McGrath 1996; 69 participants)
-
Imipramine (dose not available) or placebo for 24 weeks (Nunes 1993; 23 participants)
-
Mianserin (60 mg/day) or placebo for 4 weeks (McLean 1986; 35 participants)
-
Mirtazapine (30 mg/day) or placebo for 12 weeks (Cornelius 2016; 14 participants)
-
Nefazodone (up to 600 mg/day) or placebo for 10 weeks (Hernandez‐Avila 2004; 41 participants)
-
Nefazodone (up to 500 mg/day) or placebo for 12 weeks (Roy‐Byrne 20000; 64 participants)
-
Sertraline (up to 150 mg/day) or placebo for 24 weeks (Gual 2003; 83 participants)
-
Sertraline (200 mg/day) or placebo for 10 weeks (Kranzler 2006 arm A; score HRSD ≥ 17; 189 participants)
-
Sertraline (200 mg/day) or placebo for 10 weeks (Kranzler 2006 arm B; score HRSD ≤ 16; 139 participants)
-
Sertraline (200 mg/day) or placebo for 12 weeks (Moak 2003; 82 participants)
-
Sertraline (up to 200 mg/day) or placebo for 14 weeks (Pettinati 2001a; 29 participants)
-
Sertraline (200 mg/day) or placebo for 14 weeks (Pettinati 2010 arm A; 79 participants)
-
Sertraline (200 mg/day) plus naltrexone (100 mg/day) or placebo plus naltrexone for 14 weeks (Pettinati 2010 arm B; 91 participants)
-
Sertraline (100 mg/day) or placebo for 6 weeks (Roy 1998; 36 participants)
-
Vilofaxine (400 mg/day) or placebo for 12 weeks (Altamura 1990; 30 participants)
Antidepressants versus psychotherapy
Two studies compared the efficacy of an antidepressant versus psychotherapy (Liappas 2005 arm A; Liappas 2005 arm B; 60 participants).
-
Mirtazapine (up to 60 mg/day) or psychotherapy for 3 weeks (Liappas 2005 arm A; 30 participants)
-
Venlafaxine (up to 300 mg/day) or psychotherapy for 3 weeks (Liappas 2005 arm B; 30 participants)
Antidepressants versus other medications
Four studies compared the efficacy of antidepressants to that of other medications (Butterworth 1971a; Gallant 1969 arm b; Krupitsky 1993 arm B; Muhonen 2008; 228 participants).
-
Amitriptyline (75 mg/day) or diazepam (15 mg/day) for 3 weeks (Krupitsky 1993 arm B; 29 participants)
-
Doxepin (25 mg/day) or diazepam (5 mg/day) for 3 weeks (Butterworth 1971a; 39 participants)
-
Doxepin (75 mg/day or 150 mg/day) or diazepam (15 mg/day) for 3 weeks (Gallant 1969 arm b; 71 participants)
-
Escitalopram (20 mg/day) or memantine (20 mg/day) for 26 weeks (Muhonen 2008; 80 participants)
One antidepressant versus another antidepressant
Five studies compared the efficacy of an antidepressant versus another (Altintoprak 2008; Cocchi 1997; Habrat 2006; Liappas 2005 arm C; Lôo 1988; 621 participants).
-
Mirtazapine (up to 60 mg/day) or amitriptyline (up to 150 mg/day) for 8 weeks (Altintoprak 2008; 44 participants)
-
Mirtazapine (up to 60 mg/day) or venlafaxine (up to 300 mg/day) for 3 weeks (Liappas 2005 arm C; 40 participants)
-
Paroxetine (20 mg/day) or amitriptyline (25 mg/day) for 3‐4 weeks (Cocchi 1997; 122 participants)
-
Tianeptine (37.5 mg/day) or amitriptyline (75 mg/day) for 4‐8 weeks (Lôo 1988; 129 participants)
-
Tianeptine (37.5 mg/day) versus fluvoxamine (100 mg/day) for 6 weeks (Habrat 2006; 286 participants)
Appendix 8. Rating instruments utilized
Depression
Diagnostic criteria and interviews
-
DSM III‐R (APA 1987) utilized in Altamura 1990; Cornelius 1997; Mason 1996; McGrath 1996; Moak 2003; Nunes 1993; Pettinati 2001a; Roy 1998; Roy‐Byrne 2000.
-
DSM‐IV (APA 1994) utilized in Adamson 2015; Altintoprak 2008; Cocchi 1997; Cornelius 1997; Cornelius 2016; Gual 2003; Hernandez‐Avila 2004; Kranzler 2006 arm A; Kranzler 2006 arm B; Pettinati 2010 arm A; Pettinati 2010 arm B.
-
DSM‐IV‐TR (APA 2000) utilized in Muhonen 2008.
-
ICD‐10 (WHO 1993) utilized in Gual 2003; Habrat 2006; Krupitsky 2012.
-
MINI (Sheehan 1998) utilized in Cornelius 2016; Mason 1996.
-
SCID (Spitzer 1992) utilized in Adamson 2015; Altintoprak 2008; Cornelius 1997; Hernandez‐Avila 2004; Moak 2003; Pettinati 2001a; Roy‐Byrne 2000.
-
SCID‐P (First 1995) utilized in Muhonen 2008; Pettinati 2010 arm A; Pettinati 2010 arm B.
Severity
Observer‐rated scales
-
BPRS utilized in Butterworth 1971a; Krupitsky 2012.
-
CGI (Guy 1975) utilized in Butterworth 1971b; Gallant 1969 arm a; Gallant 1969 arm b; Habrat 2006; Kranzler 2006 arm A; Kranzler 2006 arm B; Krupitsky 2012; McGrath 1996; Roy 1998; Roy‐Byrne 2000.
-
HRSD (Hamilton 1960; Hamilton 1967; 17 items utilized in Altintoprak 2008; Gual 2003; Hernandez‐Avila 2004; Kranzler 2006 arm A; Kranzler 2006 arm B.
-
HRSD (Hamilton 1960; 21 items utilized in Altamura 1990; Krupitsky 2012; McGrath 1996; Moak 2003; Nunes 1993; Roy 1998;
-
HRSD (Hamilton 1960; 24 items utilized in Cornelius 1997; Liappas 2005 arm A; Liappas 2005 arm B; Liappas 2005 arm C; Mason 1996; Pettinati 2001a; Pettinati 2010 arm A; Pettinati 2010 arm B.
-
HRSD (Hamilton 1960; number of items unknown in Habrat 2006; Lôo 1988; Roy‐Byrne 2000.
-
LDRS (Rockliff 1971) utilized in Butterworth 1971b.
-
MADRS (Montgomery 1979) utilized in Adamson 2015; Gual 2003; Krupitsky 2012; Lôo 1988; Muhonen 2008.
-
PRISM (Hasin 1996) utilized in Moak 2003.
Self‐administered scales
-
BDI (Beck 1961) utilized in Cornelius 1997; Cornelius 2016; Kranzler 2006 arm A; Kranzler 2006 arm B; Moak 2003; Pettinati 2001a; Roy 1998.
-
BDI‐II (Beck 1996) utilized in Muhonen 2008.
-
HRSD as described by Carr 1981 utilized in McLean 1986.
-
MMPI utilized in Krupitsky 1993 arm A; Krupitsky 1993 arm B.
-
SCL‐90 (Derogatis 1974) utilized in Adamson 2015; Lôo 1988.
-
Zung (Zung 1965) utilized in Butterworth 1971a; Cocchi 1997; Krupitsky 1993 arm A; Krupitsky 1993 arm B; Krupitsky 2012.
Remission
Observer‐rated scales and cut‐off values
-
HRSD (Hamilton 1960); final score < 8 utilized in Roy‐Byrne 2000.
-
HRSD (Hamilton 1960); final score ≤ 9 utilized in 3 final weeks of treatment in Pettinati 2010 arm A; Pettinati 2010 arm B.
-
MADRS (Montgomery 1979); final score < 10 utilized in Adamson 2015.
-
MADRS (Montgomery 1979); final score < 7 utilized in Gual 2003.
Self‐administered scales and cut‐off values
-
HRSD (Hamilton 1960); final score < 17 utilized in McLean 1986.
-
Zung (Zung 1965); participants no longer depressed utilized in Cocchi 1997.
These studies were not included in the analysis as they used self‐administered scales.
Response
Observer‐rated scales and cut‐off values
-
BPRS, marked improvement or moderate improvement in final score utilized in Butterworth 1971a.
-
CGI (Guy 1975); final score equal to 'Excellent' (very much improved) + 'Good' (improved) utilized in Butterworth 1971b; Gallant 1969 arm a; Gallant 1969 arm b; Roy 1998; Roy‐Byrne 2000.
-
HRSD (Hamilton 1960; reduction in final score > 50% utilized in Habrat 2006; Kranzler 2006 arm A; Kranzler 2006 arm B; Mason 1996; McGrath 1996; Roy 1998.
-
MADRS (Montgomery 1979); reduction in final score > 50% utilized in Gual 2003; Lôo 1988.
Self‐administered scales and cut‐off values
-
DBI, Reduction in final score > 50% utilized in Roy 1998.
-
Zung, participants improved but depressed utilized in Cocchi 1997.
These data were not included in the analysis as a self‐reported scale was used.
Significant depression
Observer‐rated scales and cut‐off values
-
HRSD (Hamilton 1960); final score ≥ 50% utilized in Moak 2003.
Alcohol dependence and consumption of alcohol
Diagnostic criteria
-
DSM‐III‐R (APA 1987) utilized in Altamura 1990; Cornelius 1997; Mason 1996; McGrath 1996; Moak 2003; Nunes 1993; Pettinati 2001a; Roy 1998; Roy‐Byrne 2000.
-
DSM‐IV (APA 1994) utilized in Adamson 2015; Altintoprak 2008; Cocchi 1997; Cornelius 2016; Gual 2003; Hernandez‐Avila 2004; Kranzler 2006 arm A; Kranzler 2006 arm B; Liappas 2005 arm A; Liappas 2005 arm B; Liappas 2005 arm C; Moak 2003; Pettinati 2010 arm A; Pettinati 2010 arm B.
-
DSM‐IV‐TR (APA 2000) utilized in Muhonen 2008.
-
ICD‐10 (WHO 1993) utilized in Gual 2003; Habrat 2006; Krupitsky 2012.
-
MINI (Sheehan 1998) utilized in Cornelius 2016.
-
SCID (Spitzer 1992) utilized in Adamson 2015; Altintoprak 2008; Cornelius 1997; Hernandez‐Avila 2004; Moak 2003; Pettinati 2001a; Roy 1998; Roy‐Byrne 2000.
-
SCID‐P (First 1995) utilized in Muhonen 2008; Pettinati 2010 arm A; Pettinati 2010 arm B.
Observer‐rated scales
-
ASI (McLellan 1992) utilized in Cornelius 1997; Krupitsky 2012; Pettinati 2010 arm A; Pettinati 2010 arm B.
-
CGI (Guy 1975) utilized in Kranzler 2006 arm A; Kranzler 2006 arm B; Krupitsky 2012; Roy 1998.
-
TLFB (Sobell 1992) utilized in Adamson 2015; Cornelius 1997; Cornelius 2016; Hernandez‐Avila 2004; Kranzler 2006 arm A; Kranzler 2006 arm B; Krupitsky 2012; Mason 1996; McGrath 1996; Moak 2003; Nunes 1993; Pettinati 2001a; Pettinati 2010 arm A; Pettinati 2010 arm B; Roy 1998; Roy‐Byrne 2000.
Self‐administered scales
-
ADS (Skinner 1982; Skinner 1984) utilized in Kranzler 2006 arm A; Kranzler 2006 arm B; Mason 1996; McGrath 1996; Moak 2003.
-
AUDIT (Saunders 1993) utilized in Muhonen 2008; Roy‐Byrne 2000.
-
DBI (Shelton 1969) utilized in Altamura 1990.
-
DrInC (Miller 1995) utilized in Hernandez‐Avila 2004.
-
LDQ (Raistrick 1994) utilized in Adamson 2015.
-
MAST (Selzer 1971) utilized in Altintoprak 2008; Nunes 1993.
Alcohol outcomes
-
Abstinent days per week utilized by Muhonen 2008.
-
Abstinent patients: percentage of participants abstinent for the treatment period utilized by Muhonen 2008; Pettinati 2010 arm A; Pettinati 2010 arm B.
-
CDT values utilized in Moak 2003.
-
Cumulative abstinence duration defined as the number of days of abstinence recorded during the study utilized in Gual 2003.
-
Heavy drinking days 1 = ≥ 4 drinks per day (women) and ≥ 5 drinks per day (men) utilized by Hernandez‐Avila 2004; Kranzler 2006 arm A; Kranzler 2006 arm B; Krupitsky 2012; Pettinati 2010 arm A; Pettinati 2010 arm B.
-
Heavy drinking days 2 = ≥ 5 drinks per day utilized by Cornelius 1997; Cornelius 2016.
-
Heavy drinking days 3 = > 6 drinks per day utilized by Mason 1996.
-
Heavy drinking days 4 = ≥ 6 oz per day utilized by McGrath 1996.
-
Heavy drinking days 5 = ≥ 80 g/day (men) and 60 g/day (women) utilized by Adamson 2015.
-
Heavy drinking days 6 = According to AUDIT‐3 utilized by Muhonen 2008
-
Relapse 1 = 50 g alcohol per day for at least 3 days per week or 100 g alcohol in a single dose utilized by Gual 2003.
-
Relapse 2 = ≥ 5 drinks per day utilized by Pettinati 2001a.
-
Relapse 3 = > 2 heavy‐drinking days (> 6 drinks per day) per week for 2 consecutive weeks or if collateral report of heavy drinking coincided with participant refusal to continue in the trial utilized by Mason 1996.
-
Relapse 4 = 3 or 4 consecutives heavy drinking days utilized by Krupitsky 2012.
-
Relapse 5 = A heavy drinking day utilized by Pettinati 2010 arm A; Pettinati 2010 arm B.
-
Relapse 6 = Failure to meet the response criteria for 2 consecutive weeks utilized by Nunes 1993.
-
Treatment failure = Occurrence of at least 3 relapses utilized by Gual 2003; Mason 1996.
Liver enzyme levels
-
γ‐Glutamyltransferase (GGT) levels utilized in Hernandez‐Avila 2004; Krupitsky 2012.
Craving
-
A 24‐item questionnaire prepared by authors (Altintoprak 2008) utilized in Altintoprak 2008.
-
OCDS (Anton 1996) utilized in Cornelius 2016; Habrat 2006; Krupitsky 2012; Muhonen 2008.
-
PACS (Flannery 1999) utilized in Krupitsky 2012.
-
VAS utilized in Krupitsky 2012.
Global response (depression and alcohol use)
-
CGI, much improved or very much improved on both depression and on alcohol utilized in McGrath 1996.
-
Participants rating of much improved in depression and either abstinence or a marked reduction in drinking with minimal functional impairment utilized in Nunes 1993.
Psychiatric symptoms/psychological distress
Anxiety
Observer‐rated scales
-
HRSA (Hamilton 1959; Hamilton 1969) utilized in Habrat 2006; Krupitsky 2012; Liappas 2005 arm A; Liappas 2005 arm B; Liappas 2005 arm C; Lôo 1988; Muhonen 2008; Roy‐Byrne 2000.
Self‐administered scales
-
BAI (Beck 1988) utilized in Muhonen 2008.
-
MMPI utilized in Krupitsky 1993 arm A; Krupitsky 1993 arm B.
-
STAI (Spielberger 1970; Spielberger 1983) utilized in Altintoprak 2008; Hernandez‐Avila 2004; Krupitsky 1993 arm A; Krupitsky 1993 arm B; Krupitsky 2012.
Cognitive functioning
-
MMSE (Fillenbaum 1997) utilized in Mason 1996; Muhonen 2008.
Quality of life
-
SOFAS (Goldman 1992) utilized in Muhonen 2008.
-
VAS (Scott 1976) utilized in Muhonen 2008.
Quality of sleep
-
PSQI (Buysse 1989) utilized in Hernandez‐Avila 2004.
Global assessment
-
BPRS (Overall 1962) utilized in Butterworth 1971a; Krupitsky 2012.
-
CGI (Busner 2009) utilized in Nunes 1993.
-
GAF (APA 1994) utilized in Krupitsky 2012.
-
GAS (Endicott 1976) utilized in Liappas 2005 arm A; Liappas 2005 arm B; Liappas 2005 arm C.
Tolerability and suicide and suicide attempts
-
DOTES (Guy 1976) utilized in Altamura 1990.
-
SAFTEE (Levine 1986) utilized in Altintoprak 2008; Cornelius 2016; Hernandez‐Avila 2004.
-
UKU (Lingjaerde 1987) utilized in Altintoprak 2008; Habrat 2006.
Appendix 9. Outcomes
Primary outcomes
Depression
-
Final score in interviewer‐rated scales (see Appendix 8) reported by Adamson 2015; Altamura 1990; Altintoprak 2008; Butterworth 1971a; Gual 2003; Hernandez‐Avila 2004; Kranzler 2006 arm A; Kranzler 2006 arm B; Krupitsky 2012; Lôo 1988; Mason 1996; McGrath 1996; Moak 2003; Muhonen 2008; Pettinati 2001a; Pettinati 2010 arm A; Pettinati 2010 arm B; Roy 1998; Roy‐Byrne 2000. Three studies reported data obtained using two interviewer‐rated scales (MADRS and HRSD) and only data obtained using HRSD were included (Gual 2003; Krupitsky 2012; Lôo 1988). Data from one study were excluded because they were expressed as medians and interquartile ranges (Mason 1996).
-
Final score in self‐administered scales (see Appendix 8) reported by Adamson 2015; Butterworth 1971a; Cocchi 1997; Cornelius 2016; Krupitsky 1993 arm A; Krupitsky 1993 arm B; Krupitsky 2012; Lôo 1988; McLean 1986; Moak 2003; Pettinati 2001a; Roy 1998. Two studies reported data obtained using the MMPI and ZUNG and only data obtained with ZUNG were included (Krupitsky 1993 arm A; Krupitsky 1993 arm B).
-
Differences between baseline and final score in interviewer‐rated scales (see Appendix 8) reported by Butterworth 1971b; Cornelius 1997; Kranzler 2006 arm A; Kranzler 2006 arm B; Mason 1996; Pettinati 2001a. Data from one study were excluded because they were expressed as medians and interquartile ranges (Mason 1996).
-
Differences between baseline and final score in self‐administered scales (see Appendix 8) reported by Cornelius 1997; Cornelius 2016; McLean 1986; Pettinati 2001a.
-
Response criteria (see Appendix 8) were reported by Butterworth 1971b; Butterworth 1971a; Gallant 1969 arm a; Gallant 1969 arm b; Gual 2003; Habrat 2006; Kranzler 2006 arm A; Kranzler 2006 arm B; Mason 1996; McGrath 1996; Moak 2003; Roy‐Byrne 2000.
-
Remission criteria (see Appendix 8) were reported by Adamson 2015; Gual 2003; Pettinati 2010 arm A; Pettinati 2010 arm B; Roy‐Byrne 2000.
Consumption of alcohol
-
Abstinent participants (number) during the trial evaluated by Cornelius 1997; Hernandez‐Avila 2004; McGrath 1996; Pettinati 2001a; Pettinati 2010 arm A; Pettinati 2010 arm B; Roy‐Byrne 2000.
-
Abstinent days (%) evaluated by Adamson 2015; Cornelius 1997; Gual 2003; Hernandez‐Avila 2004; Kranzler 2006 arm A; Kranzler 2006 arm B; McGrath 1996; Moak 2003; Pettinati 2001a.
-
Abstinent days (cumulative number) evaluated by Gual 2003.
-
Carbohydrate deficient transferrin (CDT) utilized in Moak 2003.
-
DrInC score (% of mean reduction) evaluated by Hernandez‐Avila 2004.
-
Drinking days (cumulative number) during the trial evaluated by Cornelius 1997; Krupitsky 2012.
-
Drinking days (number per week) evaluated by Cornelius 2016; Hernandez‐Avila 2004.
-
Drinking days (%) evaluated by Hernandez‐Avila 2004; Krupitsky 2012; McGrath 1996; Pettinati 2001a.
-
Drinks during the trial (cumulative number) evaluated by Cornelius 1997.
-
Drinks per drinking day evaluated by Adamson 2015; Cornelius 1997; Cornelius 2016; Hernandez‐Avila 2004; McGrath 1996; Moak 2003; Roy‐Byrne 2000.
-
Drinks (number per week) evaluated by Cornelius 2016; Hernandez‐Avila 2004.
-
Global response in depression and in alcohol consumption reported by Krupitsky 2012; McGrath 1996; Nunes 1993.
-
Heavy drinkers (number) evaluated by Gual 2003; Krupitsky 2012; Mason 1996; Moak 2003; Pettinati 2010 arm A; Pettinati 2010 arm B; Roy 1998.
-
Heavy drinking days (number per week) evaluated by Adamson 2015; Cornelius 1997; Cornelius 2016; Hernandez‐Avila 2004; McGrath 1996.
-
Heavy drinking days (%) evaluated by Adamson 2015; McGrath 1996.
-
Time to first heavy drinking (number of weeks) evaluated by Cornelius 1997.
-
Time to first relapse (in number of days) evaluated by Cornelius 1997; Gual 2003; Krupitsky 2012; Pettinati 2001a; Pettinati 2010 arm A; Pettinati 2010 arm B.
-
Treatment failure (%) evaluated by Mason 1996.
Liver enzyme levels
-
Final levels of GGT reported by Hernandez‐Avila 2004; Krupitsky 2012.
Acceptability
-
Number of dropouts reported by Altamura 1990; Butterworth 1971b; Butterworth 1971a; Cornelius 2016; Gallant 1969 arm a; Gallant 1969 arm b; Gual 2003; Hernandez‐Avila 2004; Kranzler 2006 arm A; Kranzler 2006 arm B; Krupitsky 2012; Liappas 2005 arm A; Liappas 2005 arm B; Liappas 2005 arm C; Mason 1996; McGrath 1996; McLean 1986; Moak 2003; Pettinati 2010 arm A; Roy 1998; Roy‐Byrne 2000.
Tolerability
-
Abdominal cramps reported by Adamson 2015.
-
Anxiety evaluated by Roy‐Byrne 2000.
-
Back pain evaluated by Gual 2003.
-
Blood in the stool evaluated by Kranzler 2006 arm A.
-
Blurred vision evaluated by Butterworth 1971a; Roy‐Byrne 2000.
-
Bodyweight (final values) reported by Altintoprak 2008.
-
Constipation evaluated by Altintoprak 2008; Butterworth 1971a; Kranzler 2006 arm A; Roy‐Byrne 2000.
-
Coughing evaluated by Gual 2003.
-
Depression evaluated by Kranzler 2006 arm A; Moak 2003.
-
Diarrhoea evaluated by Gual 2003; Roy‐Byrne 2000.
-
Difficulty sleeping evaluated by Adamson 2015.
-
Dizziness evaluated by Altintoprak 2008; Gual 2003; Roy‐Byrne 2000.
-
Drowsiness evaluated by Butterworth 1971a.
-
Dry mouth evaluated by Altintoprak 2008; Butterworth 1971a; Gallant 1969 arm a; Gallant 1969 arm b; Roy‐Byrne 2000.
-
Dyspepsia evaluated by Gual 2003.
-
Fatigue/weakness evaluated by Roy‐Byrne 2000.
-
Headache evaluated by Gual 2003; Kranzler 2006 arm A; Roy‐Byrne 2000.
-
Heart palpitations evaluated by Roy‐Byrne 2000.
-
Increase in bodyweight reported by Altintoprak 2008; Cornelius 2016.
-
Influenza‐like symptoms evaluated by Gual 2003.
-
Insomnia evaluated by Adamson 2015; Butterworth 1971b; Kranzler 2006 arm A; Roy‐Byrne 2000.
-
Low energy evaluated by Adamson 2015.
-
Nausea evaluated by Adamson 2015; Gual 2003; Roy‐Byrne 2000.
-
Other adverse effects evaluated by Roy‐Byrne 2000.
-
Paraesthesia evaluated by Gual 2003.
-
Poor memory evaluated by Roy‐Byrne 2000.
-
Procedure (medical/surgical/health service) evaluated by Gual 2003.
-
Sedation evaluated by Altintoprak 2008; Roy‐Byrne 2000.
-
Sexual dysfunction evaluated by Roy‐Byrne 2000.
-
Skin rash evaluated by Roy‐Byrne 2000.
-
Syncope evaluated by Kranzler 2006 arm A.
-
Total adverse effects evaluated by Adamson 2015; Butterworth 1971b; Butterworth 1971a; Gallant 1969 arm a; Gallant 1969 arm b; Habrat 2006; Kranzler 2006 arm A; Krupitsky 2012.
-
Total serious adverse events evaluated by Adamson 2015; Butterworth 1971b; Cornelius 2016; Kranzler 2006 arm A; Moak 2003; Pettinati 2010 arm A; Pettinati 2010 arm B.
-
Visual trails evaluated by Roy‐Byrne 2000.
-
Weight gain reported by Cornelius 2016.
-
Withdrawal for medical reasons evaluated by Adamson 2015; Cornelius 1997; Kranzler 2006 arm A; Krupitsky 2012; Mason 1996; McGrath 1996; Pettinati 2010 arm A; Pettinati 2010 arm B; Roy 1998; Roy‐Byrne 2000.
-
Worsening of clinical condition because of relapse evaluated by Kranzler 2006 arm A; Moak 2003.
Suicide and suicide attempts
-
Suicidal ideation or attempts evaluated by Adamson 2015; Cornelius 1997; Habrat 2006; Kranzler 2006 arm A; Moak 2003.
Secondary outcomes
Use of other substances
-
Participants with substance use disorders were included by Adamson 2015; McGrath 1996.
-
Participants with abuse of other substances were included by Cornelius 1997; Roy‐Byrne 2000.
Craving for alcohol
-
Final score in a self‐administered scale (see Appendix 8) reported by Altintoprak 2008; Cornelius 2016; Habrat 2006; Krupitsky 2012.
Severity of alcohol dependence
-
Final score in a self‐administered scale a (see Appendix 8) reported by Adamson 2015; Hernandez‐Avila 2004; Muhonen 2008; Roy‐Byrne 2000.
Psychiatric symptoms/psychological distress
Anxiety severity
-
Final score in an interviewer‐rated scale reported by Habrat 2006; Krupitsky 2012; Liappas 2005 arm A; Liappas 2005 arm B; Liappas 2005 arm C; Lôo 1988; Muhonen 2008.
-
Final score in a self‐administered scale reported by Altintoprak 2008; Hernandez‐Avila 2004; Krupitsky 1993 arm A; Krupitsky 1993 arm B; Krupitsky 2012; Muhonen 2008.
Sleep quality
-
Difference between baseline and final score reported by Hernandez‐Avila 2004.
Global assessment
-
Difference between basal and final score reported by Cornelius 1997.
-
Final score in a rating scale reported by Krupitsky 2012; Liappas 2005 arm A; Liappas 2005 arm B; Liappas 2005 arm C.
Quality of life
-
Final score in a rating scale evaluated by Muhonen 2008.
Appendix 10. Psychosocial therapy
-
CBT (Kadden 1992) utilized by Moak 2003; Pettinati 2010 arm A; Pettinati 2010 arm B.
-
MET (Miller 1992) utilized by Cornelius 2016.
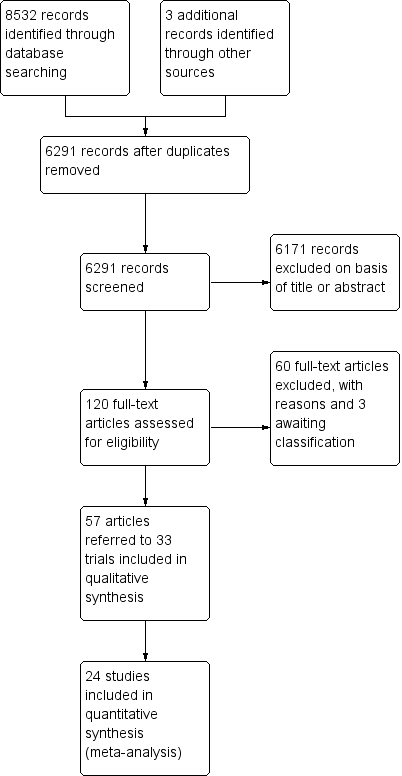
Study flow diagram.
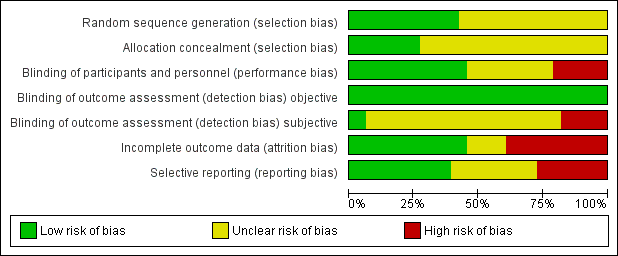
Risk of bias graph: review authors' judgements about each risk of bias item presented as percentages across all included studies.
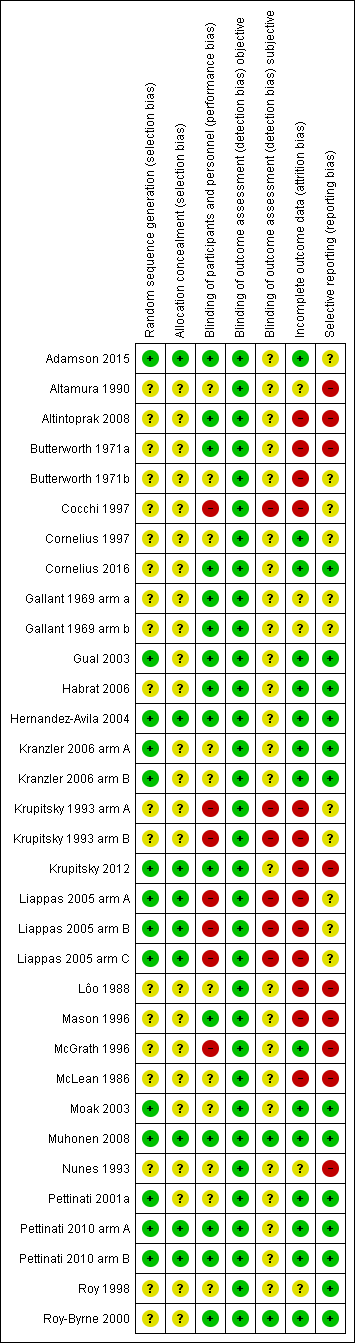
Risk of bias summary: review authors' judgements about each risk of bias item for each included study.
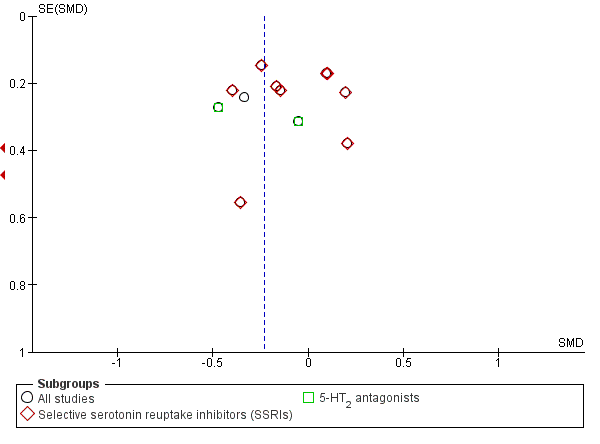
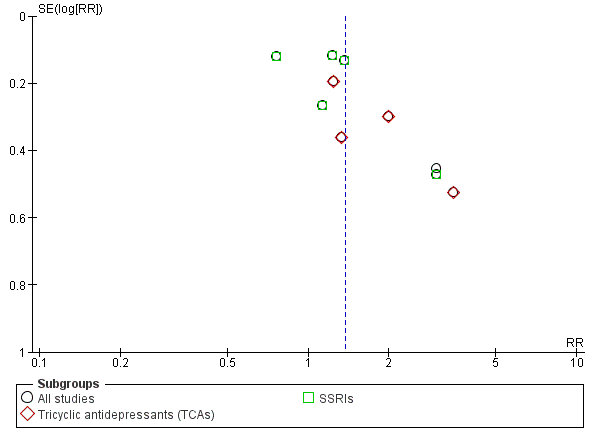
Funnel plot of comparison: 1 Antidepressants versus placebo: all studies, outcome: 1.1 Depression severity: final score (interviewer‐rated scales).
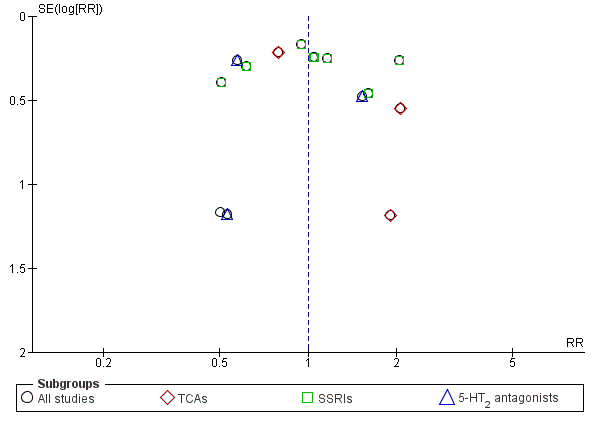
Funnel plot of comparison: 1 Antidepressants versus placebo: all studies, outcome: 1.5 Response to antidepressive treatment.
Funnel plot of comparison: 1 Antidepressants versus placebo: all studies, outcome: 1.17 Acceptability: dropouts.
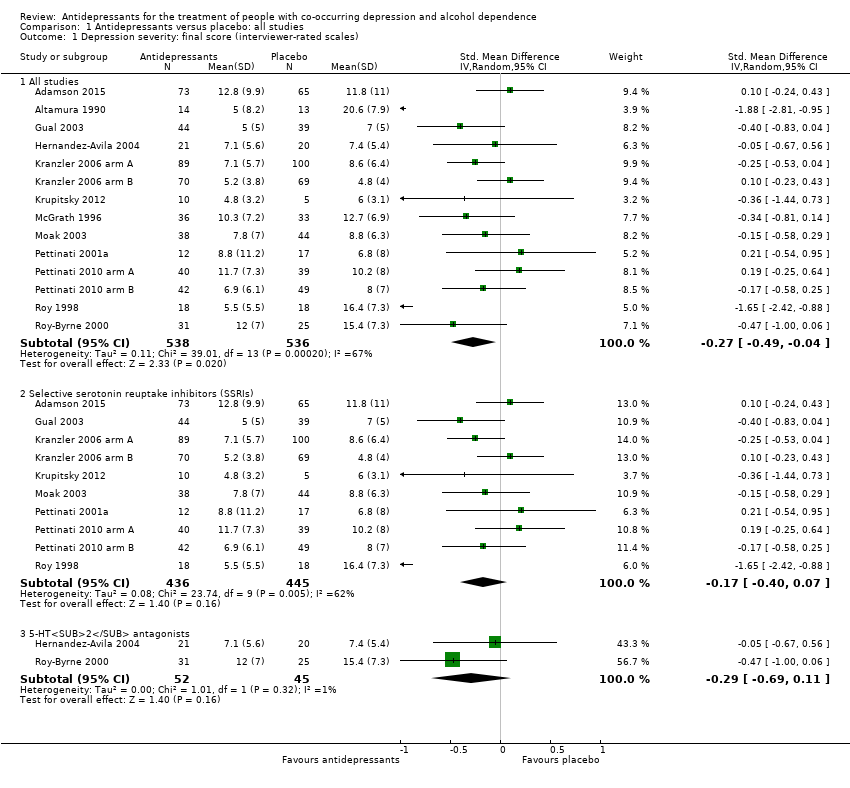
Comparison 1 Antidepressants versus placebo: all studies, Outcome 1 Depression severity: final score (interviewer‐rated scales).
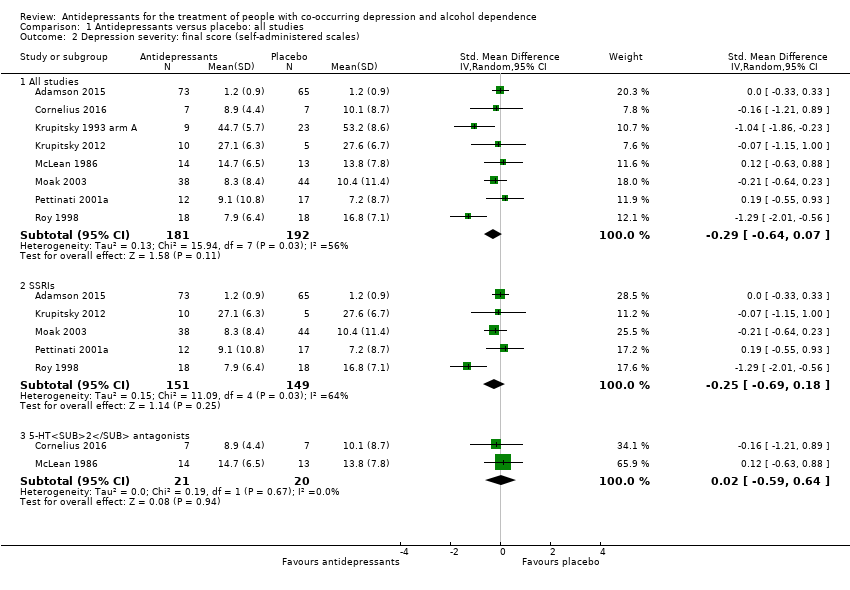
Comparison 1 Antidepressants versus placebo: all studies, Outcome 2 Depression severity: final score (self‐administered scales).
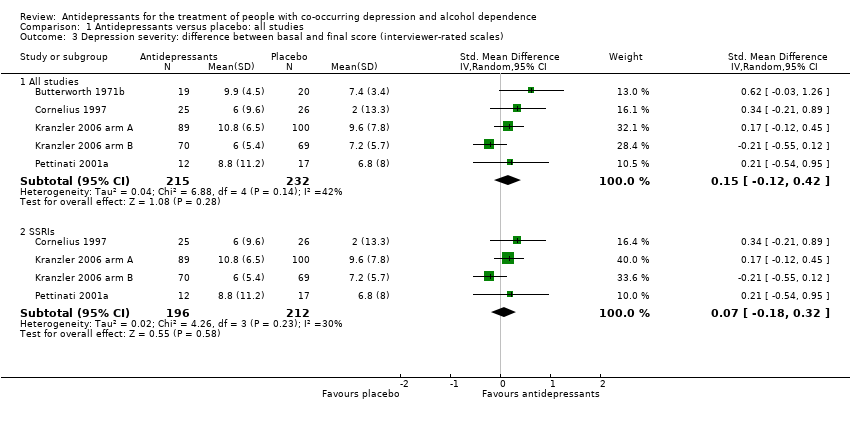
Comparison 1 Antidepressants versus placebo: all studies, Outcome 3 Depression severity: difference between basal and final score (interviewer‐rated scales).
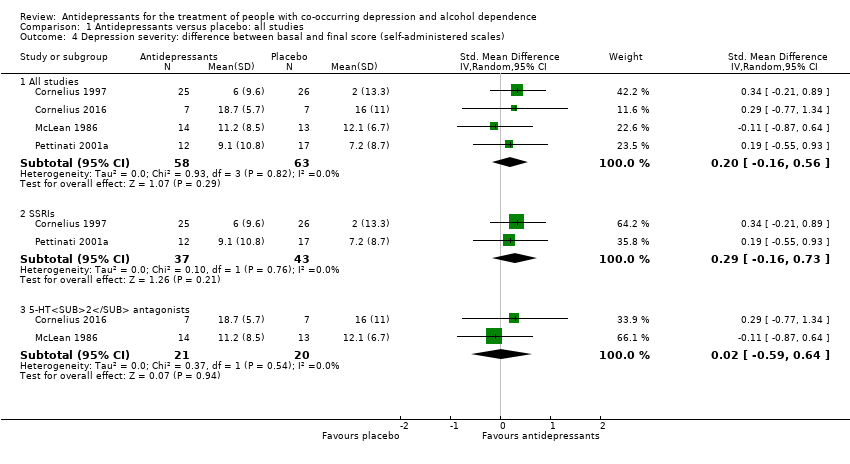
Comparison 1 Antidepressants versus placebo: all studies, Outcome 4 Depression severity: difference between basal and final score (self‐administered scales).
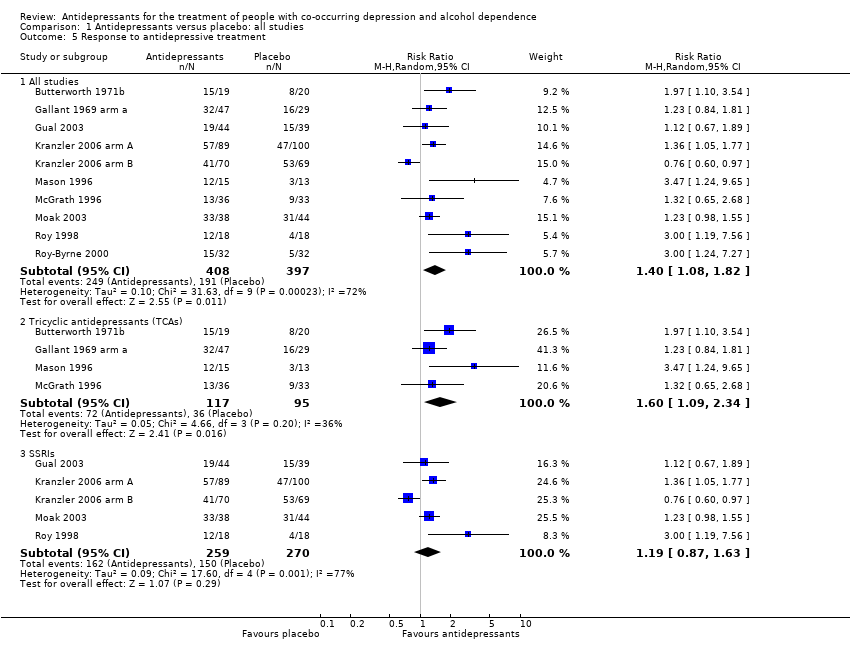
Comparison 1 Antidepressants versus placebo: all studies, Outcome 5 Response to antidepressive treatment.
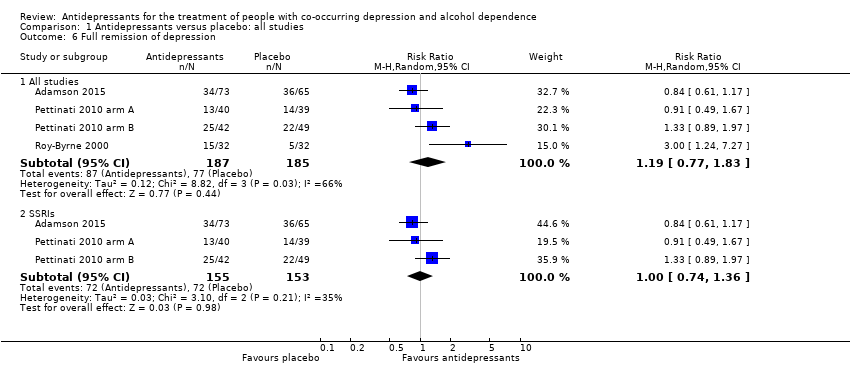
Comparison 1 Antidepressants versus placebo: all studies, Outcome 6 Full remission of depression.
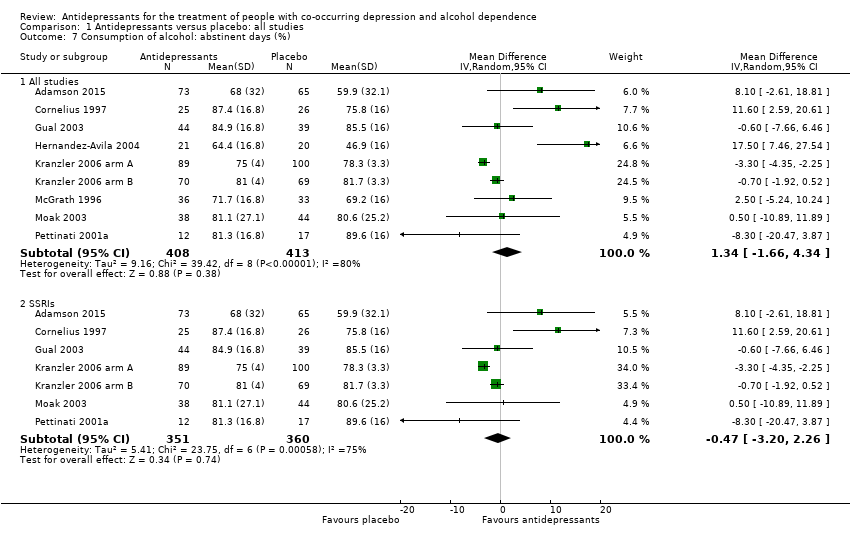
Comparison 1 Antidepressants versus placebo: all studies, Outcome 7 Consumption of alcohol: abstinent days (%).
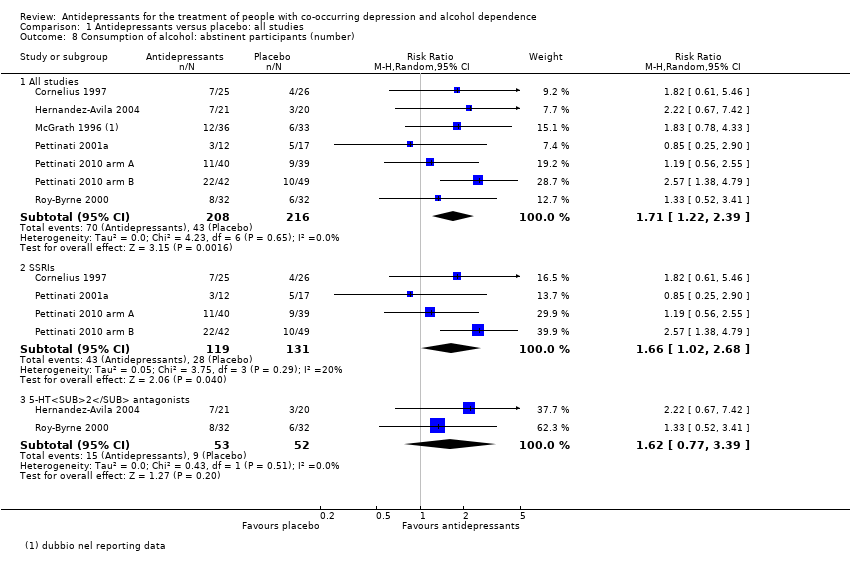
Comparison 1 Antidepressants versus placebo: all studies, Outcome 8 Consumption of alcohol: abstinent participants (number).
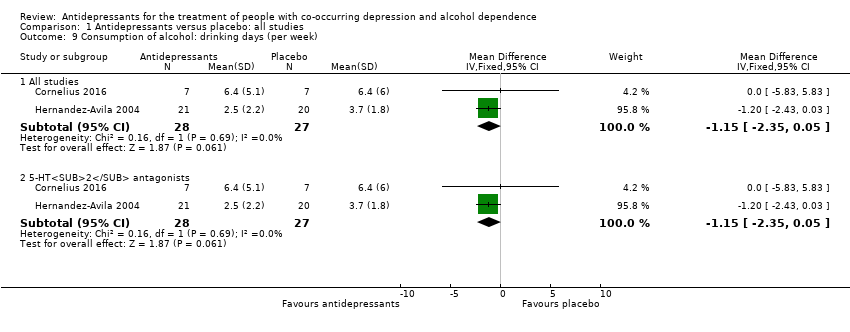
Comparison 1 Antidepressants versus placebo: all studies, Outcome 9 Consumption of alcohol: drinking days (per week).
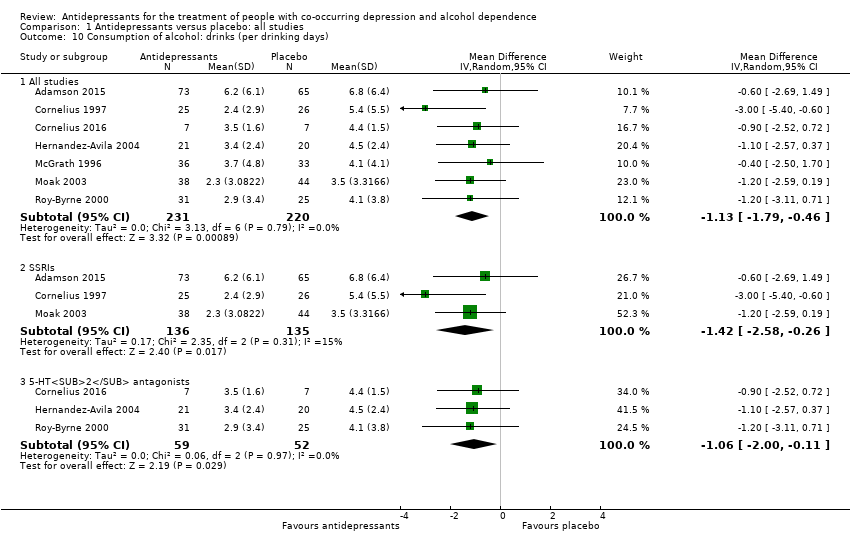
Comparison 1 Antidepressants versus placebo: all studies, Outcome 10 Consumption of alcohol: drinks (per drinking days).
Comparison 1 Antidepressants versus placebo: all studies, Outcome 11 Consumption of alcohol: drinks (per week).
Comparison 1 Antidepressants versus placebo: all studies, Outcome 12 Consumption of alcohol: heavy drinking days (per week).
Comparison 1 Antidepressants versus placebo: all studies, Outcome 13 Consumption of alcohol: heavy drinkers (number).
Comparison 1 Antidepressants versus placebo: all studies, Outcome 14 Consumption of alcohol: time to first relapse (days).
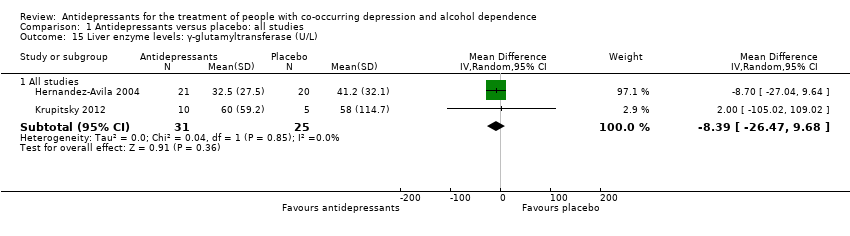
Comparison 1 Antidepressants versus placebo: all studies, Outcome 15 Liver enzyme levels: γ‐glutamyltransferase (U/L).
Comparison 1 Antidepressants versus placebo: all studies, Outcome 16 Depression and alcohol: global response.
Comparison 1 Antidepressants versus placebo: all studies, Outcome 17 Acceptability: dropouts.
Comparison 1 Antidepressants versus placebo: all studies, Outcome 18 Tolerability of treatment: adverse events.
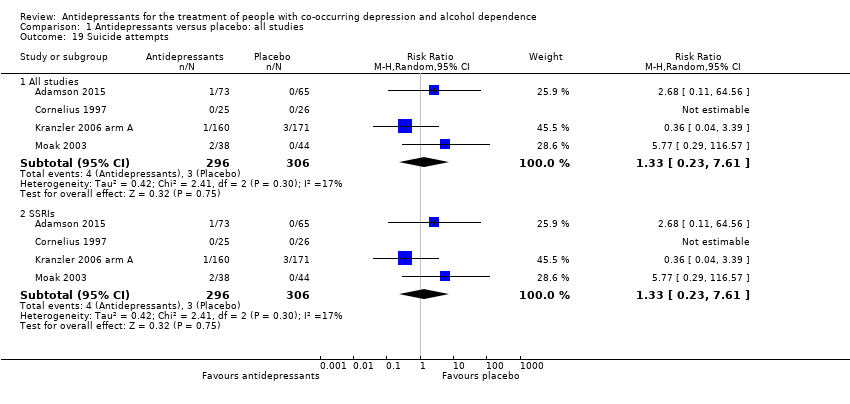
Comparison 1 Antidepressants versus placebo: all studies, Outcome 19 Suicide attempts.
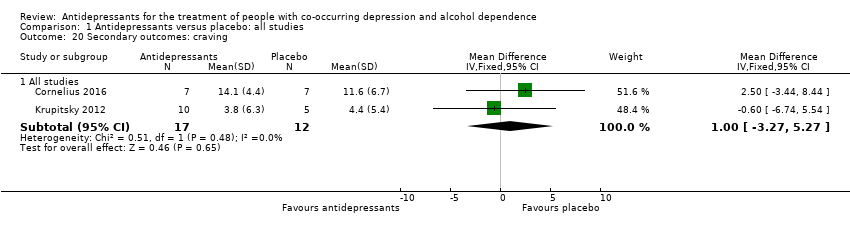
Comparison 1 Antidepressants versus placebo: all studies, Outcome 20 Secondary outcomes: craving.
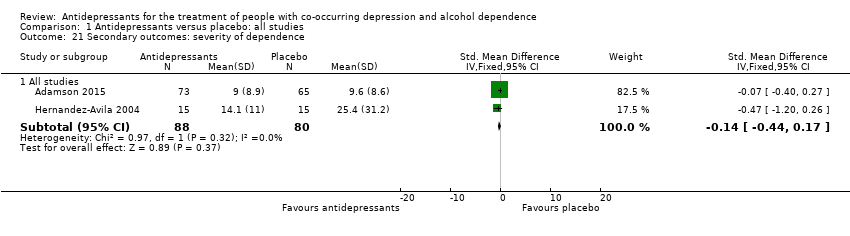
Comparison 1 Antidepressants versus placebo: all studies, Outcome 21 Secondary outcomes: severity of dependence.
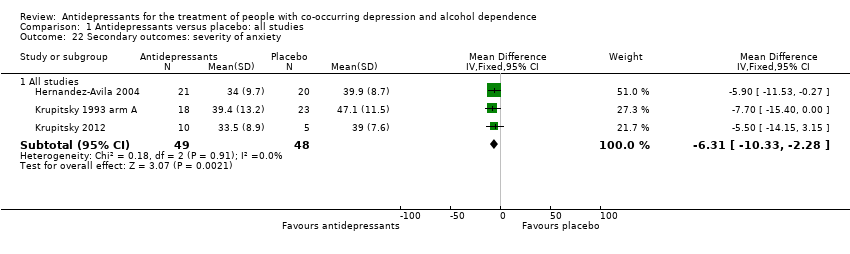
Comparison 1 Antidepressants versus placebo: all studies, Outcome 22 Secondary outcomes: severity of anxiety.
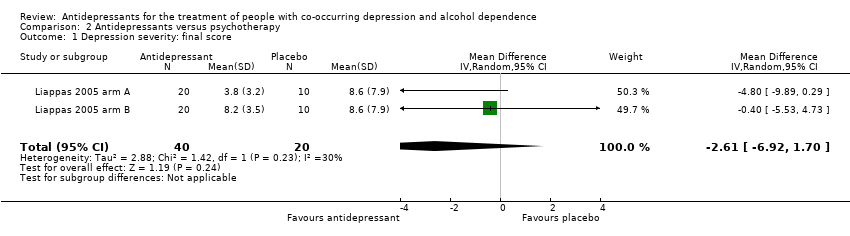
Comparison 2 Antidepressants versus psychotherapy, Outcome 1 Depression severity: final score.
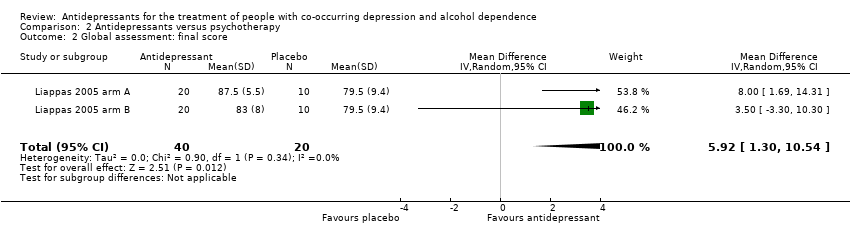
Comparison 2 Antidepressants versus psychotherapy, Outcome 2 Global assessment: final score.
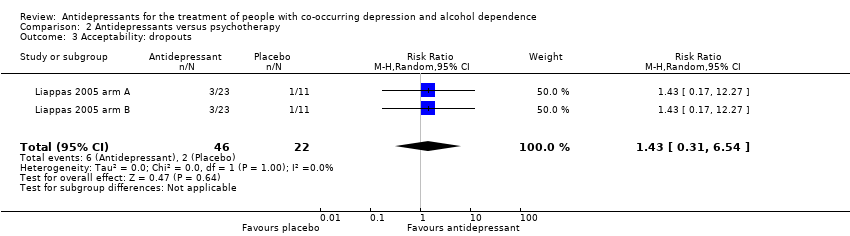
Comparison 2 Antidepressants versus psychotherapy, Outcome 3 Acceptability: dropouts.
| Antidepressants compared to placebo: all studies | ||||||
| Patient or population: people with co‐occurring depression and alcohol dependence Settings: unknown | ||||||
| Outcomes | Illustrative comparative risks* (95% CI) | Relative effect | No of Participants | Quality of the evidence | Comments | |
| Assumed risk | Corresponding risk | |||||
| Placebo | Antidepressants | |||||
| Depression severity: final score (interviewer‐rated scales) | ‐ | The mean depression: final score (interviewer‐rated scales) ‐ all studies in the intervention groups was 0.27 standard deviations lower (0.49 lower to 0.04 lower) | ‐ | 1074 | ⊕⊕⊝⊝ | ‐ |
| Response to antidepressive treatment | Study population | RR 1.40 | 805 | ⊕⊝⊝⊝ | ‐ | |
| 481 per 1000 | 674 per 1000 | |||||
| 392 per 1000 | 521 per 1000 | |||||
| Consumption of alcohol: abstinent days (%) | ‐ | The mean alcohol: abstinent days (%) ‐ all studies in the intervention groups was 1.34 higher (1.66 lower to 4.34 higher) | ‐ | 821 | ⊕⊕⊝⊝ | ‐ |
| Consumption of alcohol: abstinent participants (number) | Study population | RR 1.71 | 424 | ⊕⊕⊕⊝ | ‐ | |
| 199 per 1000 | 340 per 1000 | |||||
| 188 per 1000 | 321 per 1000 | |||||
| Consumption of alcohol: drinks (per drinking days) | ‐ | The mean alcohol: drinks (per drinking days) ‐ all studies in the intervention groups was | ‐ | 451 | ⊕⊕⊕⊝ | ‐ |
| Acceptability: dropouts | Study population | RR 0.98 | 1159 | ⊕⊕⊝⊝ | ‐ | |
| 334 per 1000 | 328 per 1000 | |||||
| 307 per 1000 | 301 per 1000 | |||||
| Tolerability of treatment: withdrawal for medical reasons | Study population | RR 1.15 | 947 | ⊕⊕⊝⊝ | ‐ | |
| 69 per 1000 | 80 per 1000 | |||||
| 32 per 1000 | 37 per 1000 | |||||
| *The basis for the assumed risk (e.g. the median control group risk across studies) is provided in footnotes. The corresponding risk (and its 95% confidence interval) is based on the assumed risk in the comparison group and the relative effect of the intervention (and its 95% CI). | ||||||
| GRADE Working Group grades of evidence | ||||||
| 1Nine studies at unclear risk for selection bias; two studies at high risk and six at unclear risk for performance bias; 13 studies at unclear risk for detection bias (subjective); one study at high risk and two at unclear risk for attrition bias; three studies at high risk and one at unclear risk for reporting bias. 6Seven studies with unclear risk of selection bias; one study at high risk and five studies at unclear risk for performance bias; all studies at unclear risk for detection bias (subjective); one study at high risk and two at unclear risk for reporting bias. | ||||||
| Outcome or subgroup title | No. of studies | No. of participants | Statistical method | Effect size |
| 1 Depression severity: final score (interviewer‐rated scales) Show forest plot | 14 | Std. Mean Difference (IV, Random, 95% CI) | Subtotals only | |
| 1.1 All studies | 14 | 1074 | Std. Mean Difference (IV, Random, 95% CI) | ‐0.27 [‐0.49, ‐0.04] |
| 1.2 Selective serotonin reuptake inhibitors (SSRIs) | 10 | 881 | Std. Mean Difference (IV, Random, 95% CI) | ‐0.17 [‐0.40, 0.07] |
| 1.3 5‐HT2 antagonists | 2 | 97 | Std. Mean Difference (IV, Random, 95% CI) | ‐0.29 [‐0.69, 0.11] |
| 2 Depression severity: final score (self‐administered scales) Show forest plot | 8 | Std. Mean Difference (IV, Random, 95% CI) | Subtotals only | |
| 2.1 All studies | 8 | 373 | Std. Mean Difference (IV, Random, 95% CI) | ‐0.29 [‐0.64, 0.07] |
| 2.2 SSRIs | 5 | 300 | Std. Mean Difference (IV, Random, 95% CI) | ‐0.25 [‐0.69, 0.18] |
| 2.3 5‐HT2 antagonists | 2 | 41 | Std. Mean Difference (IV, Random, 95% CI) | 0.02 [‐0.59, 0.64] |
| 3 Depression severity: difference between basal and final score (interviewer‐rated scales) Show forest plot | 5 | Std. Mean Difference (IV, Random, 95% CI) | Subtotals only | |
| 3.1 All studies | 5 | 447 | Std. Mean Difference (IV, Random, 95% CI) | 0.15 [‐0.12, 0.42] |
| 3.2 SSRIs | 4 | 408 | Std. Mean Difference (IV, Random, 95% CI) | 0.07 [‐0.18, 0.32] |
| 4 Depression severity: difference between basal and final score (self‐administered scales) Show forest plot | 4 | Std. Mean Difference (IV, Random, 95% CI) | Subtotals only | |
| 4.1 All studies | 4 | 121 | Std. Mean Difference (IV, Random, 95% CI) | 0.20 [‐0.16, 0.56] |
| 4.2 SSRIs | 2 | 80 | Std. Mean Difference (IV, Random, 95% CI) | 0.29 [‐0.16, 0.73] |
| 4.3 5‐HT2 antagonists | 2 | 41 | Std. Mean Difference (IV, Random, 95% CI) | 0.02 [‐0.59, 0.64] |
| 5 Response to antidepressive treatment Show forest plot | 10 | Risk Ratio (M‐H, Random, 95% CI) | Subtotals only | |
| 5.1 All studies | 10 | 805 | Risk Ratio (M‐H, Random, 95% CI) | 1.40 [1.08, 1.82] |
| 5.2 Tricyclic antidepressants (TCAs) | 4 | 212 | Risk Ratio (M‐H, Random, 95% CI) | 1.60 [1.09, 2.34] |
| 5.3 SSRIs | 5 | 529 | Risk Ratio (M‐H, Random, 95% CI) | 1.19 [0.87, 1.63] |
| 6 Full remission of depression Show forest plot | 4 | Risk Ratio (M‐H, Random, 95% CI) | Subtotals only | |
| 6.1 All studies | 4 | 372 | Risk Ratio (M‐H, Random, 95% CI) | 1.19 [0.77, 1.83] |
| 6.2 SSRIs | 3 | 308 | Risk Ratio (M‐H, Random, 95% CI) | 1.00 [0.74, 1.36] |
| 7 Consumption of alcohol: abstinent days (%) Show forest plot | 9 | Mean Difference (IV, Random, 95% CI) | Subtotals only | |
| 7.1 All studies | 9 | 821 | Mean Difference (IV, Random, 95% CI) | 1.34 [‐1.66, 4.34] |
| 7.2 SSRIs | 7 | 711 | Mean Difference (IV, Random, 95% CI) | ‐0.47 [‐3.20, 2.26] |
| 8 Consumption of alcohol: abstinent participants (number) Show forest plot | 7 | Risk Ratio (M‐H, Random, 95% CI) | Subtotals only | |
| 8.1 All studies | 7 | 424 | Risk Ratio (M‐H, Random, 95% CI) | 1.71 [1.22, 2.39] |
| 8.2 SSRIs | 4 | 250 | Risk Ratio (M‐H, Random, 95% CI) | 1.66 [1.02, 2.68] |
| 8.3 5‐HT2 antagonists | 2 | 105 | Risk Ratio (M‐H, Random, 95% CI) | 1.62 [0.77, 3.39] |
| 9 Consumption of alcohol: drinking days (per week) Show forest plot | 2 | Mean Difference (IV, Fixed, 95% CI) | Subtotals only | |
| 9.1 All studies | 2 | 55 | Mean Difference (IV, Fixed, 95% CI) | ‐1.15 [‐2.35, 0.05] |
| 9.2 5‐HT2 antagonists | 2 | 55 | Mean Difference (IV, Fixed, 95% CI) | ‐1.15 [‐2.35, 0.05] |
| 10 Consumption of alcohol: drinks (per drinking days) Show forest plot | 7 | Mean Difference (IV, Random, 95% CI) | Subtotals only | |
| 10.1 All studies | 7 | 451 | Mean Difference (IV, Random, 95% CI) | ‐1.13 [‐1.79, ‐0.46] |
| 10.2 SSRIs | 3 | 271 | Mean Difference (IV, Random, 95% CI) | ‐1.42 [‐2.58, ‐0.26] |
| 10.3 5‐HT2 antagonists | 3 | 111 | Mean Difference (IV, Random, 95% CI) | ‐1.06 [‐2.00, ‐0.11] |
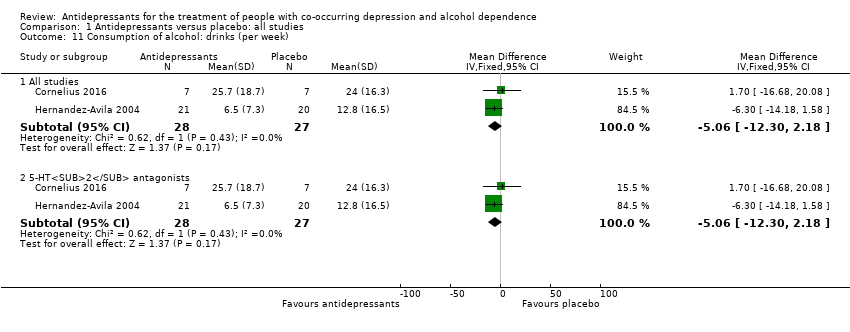
| 11 Consumption of alcohol: drinks (per week) Show forest plot | 2 | Mean Difference (IV, Fixed, 95% CI) | Subtotals only | |
| 11.1 All studies | 2 | 55 | Mean Difference (IV, Fixed, 95% CI) | ‐5.06 [‐12.30, 2.18] |
| 11.2 5‐HT2 antagonists | 2 | 55 | Mean Difference (IV, Fixed, 95% CI) | ‐5.06 [‐12.30, 2.18] |
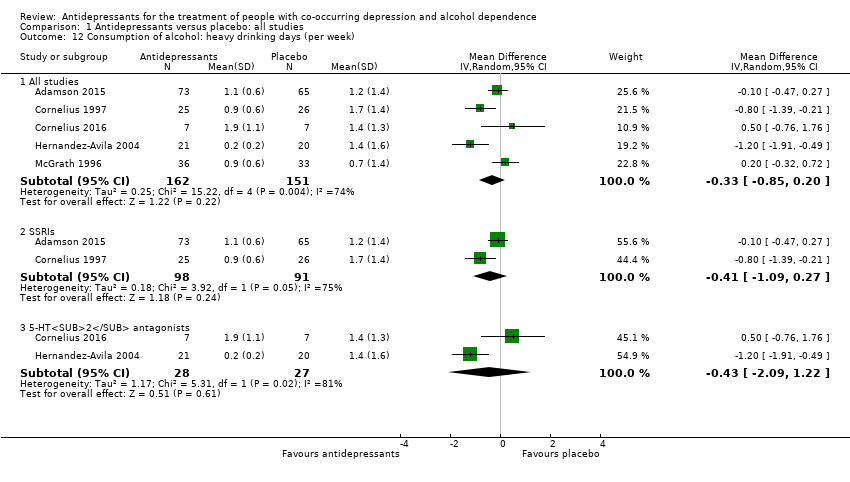
| 12 Consumption of alcohol: heavy drinking days (per week) Show forest plot | 5 | Mean Difference (IV, Random, 95% CI) | Subtotals only | |
| 12.1 All studies | 5 | 313 | Mean Difference (IV, Random, 95% CI) | ‐0.33 [‐0.85, 0.20] |
| 12.2 SSRIs | 2 | 189 | Mean Difference (IV, Random, 95% CI) | ‐0.41 [‐1.09, 0.27] |
| 12.3 5‐HT2 antagonists | 2 | 55 | Mean Difference (IV, Random, 95% CI) | ‐0.43 [‐2.09, 1.22] |
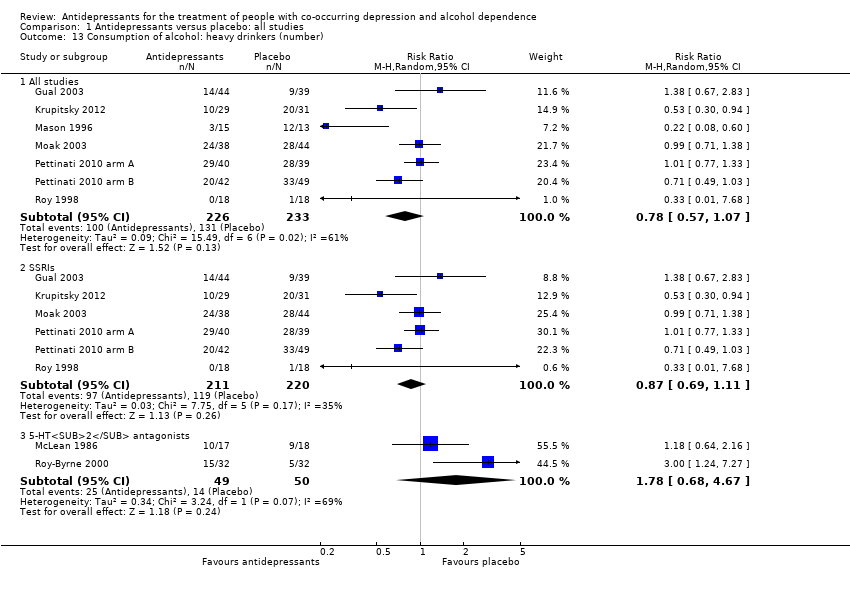
| 13 Consumption of alcohol: heavy drinkers (number) Show forest plot | 9 | Risk Ratio (M‐H, Random, 95% CI) | Subtotals only | |
| 13.1 All studies | 7 | 459 | Risk Ratio (M‐H, Random, 95% CI) | 0.78 [0.57, 1.07] |
| 13.2 SSRIs | 6 | 431 | Risk Ratio (M‐H, Random, 95% CI) | 0.87 [0.69, 1.11] |
| 13.3 5‐HT2 antagonists | 2 | 99 | Risk Ratio (M‐H, Random, 95% CI) | 1.78 [0.68, 4.67] |
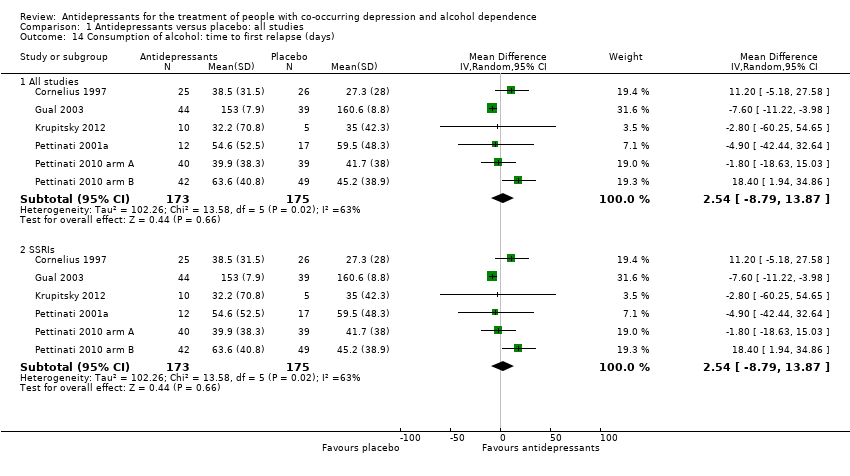
| 14 Consumption of alcohol: time to first relapse (days) Show forest plot | 6 | Mean Difference (IV, Random, 95% CI) | Subtotals only | |
| 14.1 All studies | 6 | 348 | Mean Difference (IV, Random, 95% CI) | 2.54 [‐8.79, 13.87] |
| 14.2 SSRIs | 6 | 348 | Mean Difference (IV, Random, 95% CI) | 2.54 [‐8.79, 13.87] |
| 15 Liver enzyme levels: γ‐glutamyltransferase (U/L) Show forest plot | 2 | Mean Difference (IV, Random, 95% CI) | Subtotals only | |
| 15.1 All studies | 2 | 56 | Mean Difference (IV, Random, 95% CI) | ‐8.39 [‐26.47, 9.68] |
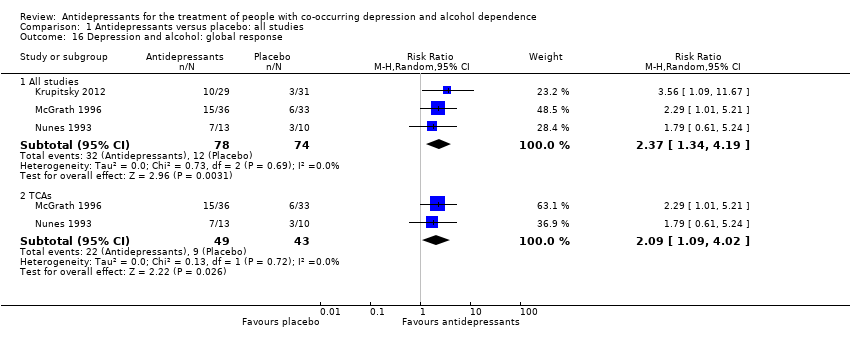
| 16 Depression and alcohol: global response Show forest plot | 3 | Risk Ratio (M‐H, Random, 95% CI) | Subtotals only | |
| 16.1 All studies | 3 | 152 | Risk Ratio (M‐H, Random, 95% CI) | 2.37 [1.34, 4.19] |
| 16.2 TCAs | 2 | 92 | Risk Ratio (M‐H, Random, 95% CI) | 2.09 [1.09, 4.02] |
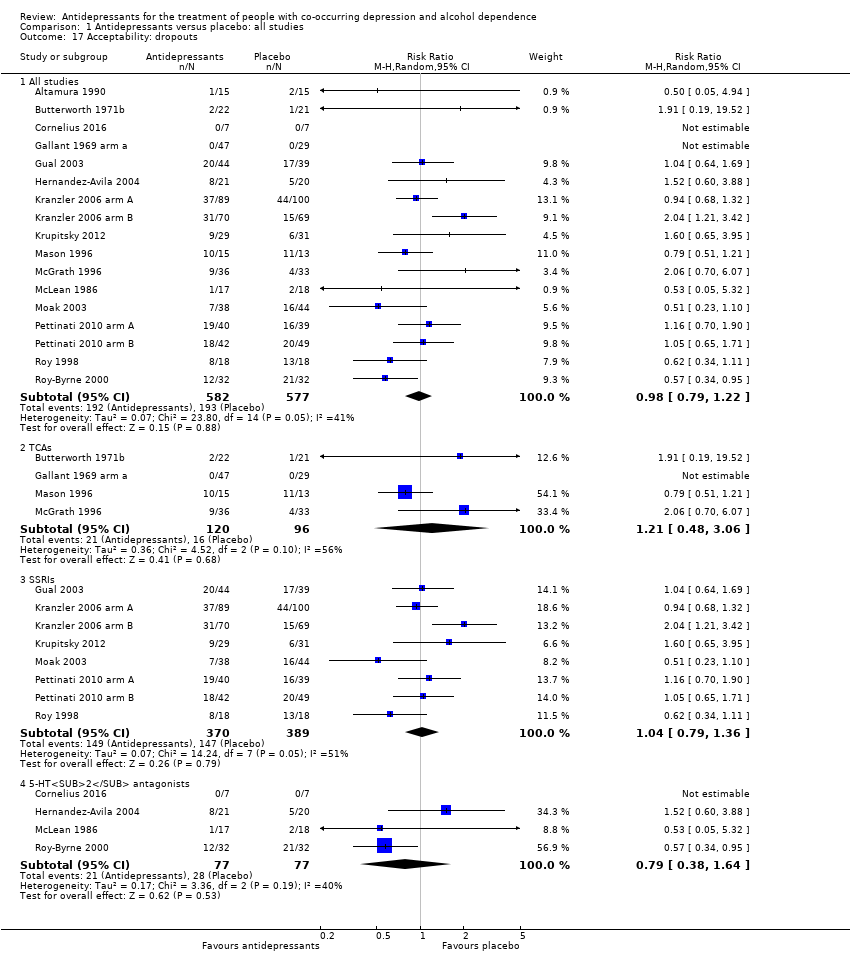
| 17 Acceptability: dropouts Show forest plot | 17 | Risk Ratio (M‐H, Random, 95% CI) | Subtotals only | |
| 17.1 All studies | 17 | 1159 | Risk Ratio (M‐H, Random, 95% CI) | 0.98 [0.79, 1.22] |
| 17.2 TCAs | 4 | 216 | Risk Ratio (M‐H, Random, 95% CI) | 1.21 [0.48, 3.06] |
| 17.3 SSRIs | 8 | 759 | Risk Ratio (M‐H, Random, 95% CI) | 1.04 [0.79, 1.36] |
| 17.4 5‐HT2 antagonists | 4 | 154 | Risk Ratio (M‐H, Random, 95% CI) | 0.79 [0.38, 1.64] |
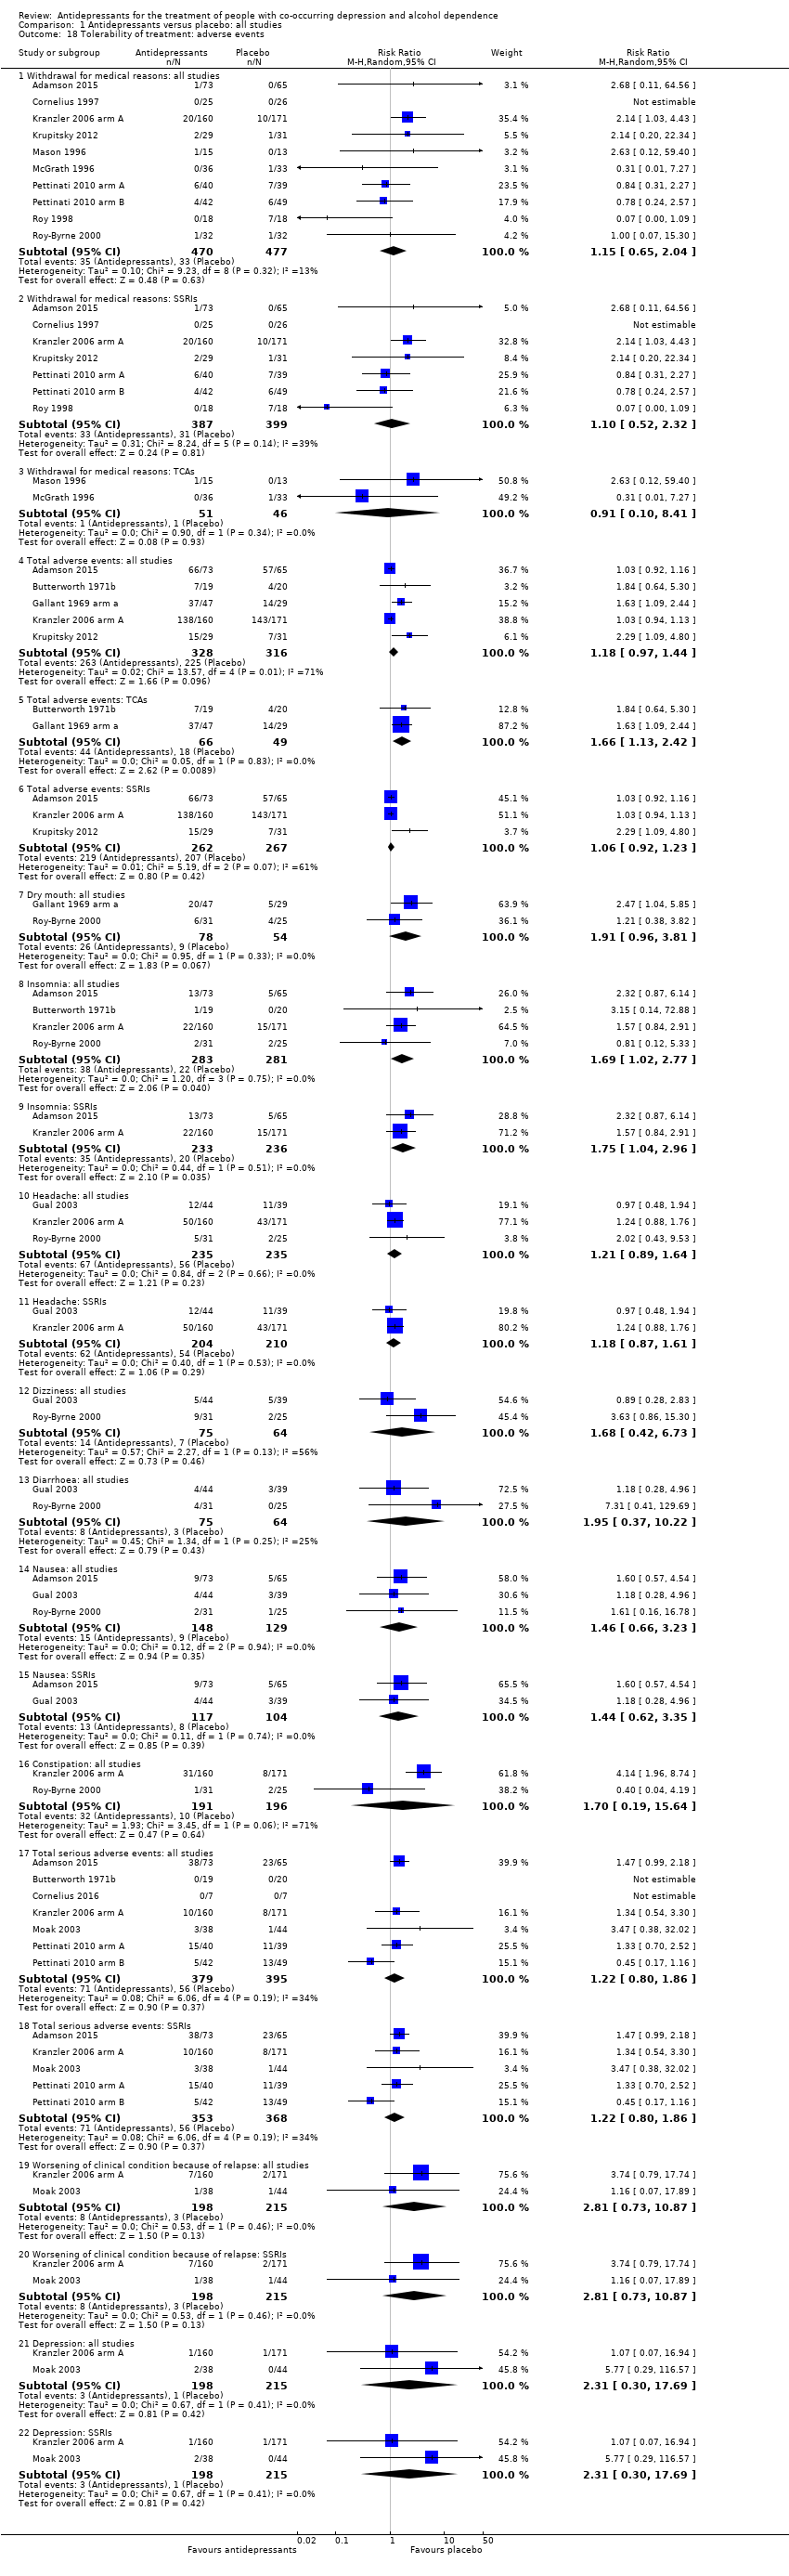
| 18 Tolerability of treatment: adverse events Show forest plot | 15 | Risk Ratio (M‐H, Random, 95% CI) | Subtotals only | |
| 18.1 Withdrawal for medical reasons: all studies | 10 | 947 | Risk Ratio (M‐H, Random, 95% CI) | 1.15 [0.65, 2.04] |
| 18.2 Withdrawal for medical reasons: SSRIs | 7 | 786 | Risk Ratio (M‐H, Random, 95% CI) | 1.10 [0.52, 2.32] |
| 18.3 Withdrawal for medical reasons: TCAs | 2 | 97 | Risk Ratio (M‐H, Random, 95% CI) | 0.91 [0.10, 8.41] |
| 18.4 Total adverse events: all studies | 5 | 644 | Risk Ratio (M‐H, Random, 95% CI) | 1.18 [0.97, 1.44] |
| 18.5 Total adverse events: TCAs | 2 | 115 | Risk Ratio (M‐H, Random, 95% CI) | 1.66 [1.13, 2.42] |
| 18.6 Total adverse events: SSRIs | 3 | 529 | Risk Ratio (M‐H, Random, 95% CI) | 1.06 [0.92, 1.23] |
| 18.7 Dry mouth: all studies | 2 | 132 | Risk Ratio (M‐H, Random, 95% CI) | 1.91 [0.96, 3.81] |
| 18.8 Insomnia: all studies | 4 | 564 | Risk Ratio (M‐H, Random, 95% CI) | 1.69 [1.02, 2.77] |
| 18.9 Insomnia: SSRIs | 2 | 469 | Risk Ratio (M‐H, Random, 95% CI) | 1.75 [1.04, 2.96] |
| 18.10 Headache: all studies | 3 | 470 | Risk Ratio (M‐H, Random, 95% CI) | 1.21 [0.89, 1.64] |
| 18.11 Headache: SSRIs | 2 | 414 | Risk Ratio (M‐H, Random, 95% CI) | 1.18 [0.87, 1.61] |
| 18.12 Dizziness: all studies | 2 | 139 | Risk Ratio (M‐H, Random, 95% CI) | 1.68 [0.42, 6.73] |
| 18.13 Diarrhoea: all studies | 2 | 139 | Risk Ratio (M‐H, Random, 95% CI) | 1.95 [0.37, 10.22] |
| 18.14 Nausea: all studies | 3 | 277 | Risk Ratio (M‐H, Random, 95% CI) | 1.46 [0.66, 3.23] |
| 18.15 Nausea: SSRIs | 2 | 221 | Risk Ratio (M‐H, Random, 95% CI) | 1.44 [0.62, 3.35] |
| 18.16 Constipation: all studies | 2 | 387 | Risk Ratio (M‐H, Random, 95% CI) | 1.70 [0.19, 15.64] |
| 18.17 Total serious adverse events: all studies | 7 | 774 | Risk Ratio (M‐H, Random, 95% CI) | 1.22 [0.80, 1.86] |
| 18.18 Total serious adverse events: SSRIs | 5 | 721 | Risk Ratio (M‐H, Random, 95% CI) | 1.22 [0.80, 1.86] |
| 18.19 Worsening of clinical condition because of relapse: all studies | 2 | 413 | Risk Ratio (M‐H, Random, 95% CI) | 2.81 [0.73, 10.87] |
| 18.20 Worsening of clinical condition because of relapse: SSRIs | 2 | 413 | Risk Ratio (M‐H, Random, 95% CI) | 2.81 [0.73, 10.87] |
| 18.21 Depression: all studies | 2 | 413 | Risk Ratio (M‐H, Random, 95% CI) | 2.31 [0.30, 17.69] |
| 18.22 Depression: SSRIs | 2 | 413 | Risk Ratio (M‐H, Random, 95% CI) | 2.31 [0.30, 17.69] |
| 19 Suicide attempts Show forest plot | 4 | Risk Ratio (M‐H, Random, 95% CI) | Subtotals only | |
| 19.1 All studies | 4 | 602 | Risk Ratio (M‐H, Random, 95% CI) | 1.33 [0.23, 7.61] |
| 19.2 SSRIs | 4 | 602 | Risk Ratio (M‐H, Random, 95% CI) | 1.33 [0.23, 7.61] |
| 20 Secondary outcomes: craving Show forest plot | 2 | Mean Difference (IV, Fixed, 95% CI) | Subtotals only | |
| 20.1 All studies | 2 | 29 | Mean Difference (IV, Fixed, 95% CI) | 1.00 [‐3.27, 5.27] |
| 21 Secondary outcomes: severity of dependence Show forest plot | 2 | Std. Mean Difference (IV, Fixed, 95% CI) | Subtotals only | |
| 21.1 All studies | 2 | 168 | Std. Mean Difference (IV, Fixed, 95% CI) | ‐0.14 [‐0.44, 0.17] |
| 22 Secondary outcomes: severity of anxiety Show forest plot | 3 | Mean Difference (IV, Fixed, 95% CI) | Subtotals only | |
| 22.1 All studies | 3 | 97 | Mean Difference (IV, Fixed, 95% CI) | ‐6.31 [‐10.33, ‐2.28] |
| Outcome or subgroup title | No. of studies | No. of participants | Statistical method | Effect size |
| 1 Depression severity: final score Show forest plot | 2 | 60 | Mean Difference (IV, Random, 95% CI) | ‐2.61 [‐6.92, 1.70] |
| 2 Global assessment: final score Show forest plot | 2 | 60 | Mean Difference (IV, Random, 95% CI) | 5.92 [1.30, 10.54] |
| 3 Acceptability: dropouts Show forest plot | 2 | 68 | Risk Ratio (M‐H, Random, 95% CI) | 1.43 [0.31, 6.54] |