Co‐bedding in neonatal nursery for promoting growth and neurodevelopment in stable preterm twins
Abstract
Background
The increased birth rate of twins during recent decades and the improved prognosis of preterm infants have resulted in the need to explore measures that could optimize their growth and neurodevelopmental outcomes. It has been postulated that co‐bedding simulates twins' intrauterine experiences in which co‐regulatory behaviors between them are observed. These behaviors are proposed to benefit twins by reducing their stress, which may promote growth and development. However, in practice, uncertainty surrounds the benefit‐risk profile of co‐bedding.
Objectives
We aimed to assess the effectiveness of co‐bedding compared with separate (individual) care for stable preterm twins in the neonatal nursery in promoting growth and neurodevelopment and reducing short‐ and long‐term morbidities, and to determine whether co‐bedding is associated with significant adverse effects.
As secondary objectives, we sought to evaluate effects of co‐bedding via the following subgroup analyses: twin pairs with different weight ranges (very low birth weight [VLBW] < 1500 grams vs non‐VLBW), twins with versus without significant growth discordance at birth, preterm versus borderline preterm twins, twins co‐bedded in incubator versus cot at study entry, and twins randomized by twin pair versus neonatal unit.
Search methods
We used the standard search strategy of the Cochrane Neonatal Review Group (CNRG). We used keywords and medical subject headings (MeSH) to search the Cochrane Central Register of Controlled Trials (CENTRAL; 2016, Issue 2), MEDLINE (via PubMed), EMBASE (hosted by EBSCOHOST), the Cumulative Index to Nursing and Allied Health Literature (CINAHL), and references cited in our short‐listed articles, up to February 29, 2016.
Selection criteria
We included randomized controlled trials with randomization by twin pair and/or by neonatal unit. We excluded cross‐over studies.
Data collection and analysis
We extracted data using standard methods of the CNRG. Two review authors independently assessed the relevance and risk of bias of retrieved records. We contacted the authors of included studies to request important information missing from their published papers. We expressed our results using risk ratios (RRs) and mean differences (MDs) when appropriate, along with 95% confidence intervals (95% CIs). We adjusted the unit of analysis from individual infants to twin pairs by averaging measurements for each twin pair (continuous outcomes) or by counting outcomes as positive if developed by either twin (dichotomous outcomes).
Main results
Six studies met the inclusion criteria; however, only five studies provided data for analysis. Four of the six included studies were small and had significant limitations in design. As each study reported outcomes differently, data for most outcomes were effectively contributed by a single study. Study authors reported no differences between co‐bedded twins and twins receiving separate care in terms of rate of weight gain (MD 0.20 grams/kg/d, 95% CI ‐1.60 to 2.00; one study; 18 pairs of twins; evidence of low quality); apnea, bradycardia, and desaturation (A/B/D) episodes (RR 0.85, 95% CI 0.18 to 4.05; one study; 62 pairs of twins; evidence of low quality); episodes in co‐regulated states (MD 0.96, 95% CI ‐3.44 to 5.36; one study; three pairs of twins; evidence of very low quality); suspected or proven infection (RR 0.84, 95% CI 0.30 to 2.31; three studies; 65 pairs of twins; evidence of very low quality); length of hospital stay (MD ‐4.90 days, 95% CI ‐35.23 to 25.43; one study; three pairs of twins; evidence of very low quality); and parental satisfaction measured on a scale of 0 to 55 (MD ‐0.38, 95% CI ‐4.49 to 3.73; one study; nine pairs of twins; evidence of moderate quality). Although co‐bedded twins appeared to have lower pain scores 30 seconds after heel lance on a scale of 0 to 21 (MD ‐0.96, 95% CI ‐1.68 to ‐0.23; two studies; 117 pairs of twins; I2 = 75%; evidence of low quality), they had higher pain scores 90 seconds after the procedure (MD 1.00, 95% CI 0.14 to 1.86; one study; 62 pairs of twins). Substantial heterogeneity in the outcome of infant pain response after heel prick at 30 seconds post procedure and conflicting results at 30 and 90 seconds post procedure precluded clear conclusions.
Authors' conclusions
Evidence on the benefits and harms of co‐bedding for stable preterm twins was insufficient to permit recommendations for practice. Future studies must be adequately powered to detect clinically important differences in growth and neurodevelopment. Researchers should assess harms such as infection, along with medication errors and caregiver satisfaction.
PICO
Plain language summary
Co‐bedding of preterm twins to optimize growth and brain development
Review question
We reviewed evidence on the benefits and harms of co‐bedding stable preterm twins and found six relevant studies.
Background
Preterm twins are at high risk for problems in growth and development. Co‐bedding (placement of twins in the same cot or incubator) has been proposed to benefit twins because it simulates the environment that they shared before birth, in which twins have been seen to support each other through a series of observed activities, termed "co‐regulation." These activities have been proposed to promote growth and brain development when they are allowed to continue after birth. Risks of placing twins in the same incubator or cot include caregiver error and infection.
Study characteristics
This review found six mostly small studies with some limitations in their methods. All six studies were conducted in the neonatal nursery of a major tertiary hospital. In all studies, researchers enrolled preterm infants of average postmenstrual age of 29 weeks (nearly two and a half months preterm). Some studies enrolled twins only; others enrolled twins and triplets and quadruplets and chose to co‐bed two of the higher‐order multiples considered most stable at the time of enrollment.
Key results
Overall, researchers reported no differences between the co‐bedded group and the group receiving care separately in terms of weight gain, episodes of major disturbances in their breathing, heart rate or oxygenation level (apnea, bradycardia, or desaturation episodes), length of hospital stay, and occurrence of infection. Conflicting results were noted in the two included studies that assessed infants' pain response after heel prick.
Quality of evidence
Overall quality of evidence was low because of limitations in study methods, small sample sizes giving rise to imprecise results, and inconsistency in study results. We can make no recommendations for or against co‐bedding for stable preterm twins in the neonatal nursery on the basis of evidence gathered in this review. Further research on this topic is needed.
Authors' conclusions
Summary of findings
| Co‐bedding versus separate care for promoting growth and neurodevelopment in stable preterm twins | ||||||
| Patient or population: stable preterm twins with growth and neurodevelopment promoted | ||||||
| Outcomes | Illustrative comparative risks* (95% CI) | Relative effect | Number of participants | Quality of the evidence | Comments | |
| Assumed risk | Corresponding risk | |||||
| Separate care | Co‐bedding | |||||
| Rate of weight gain (in grams/kg of baseline weight/d) ‐ average from study entry to week 3 | Mean rate of weight gain (in grams/kg of baseline weight/d) ‐ average from study entry to week 3 in control groups was | Mean rate of weight gain (in grams/kg of baseline weight/d) ‐ average from study entry to week 3 in intervention groups was | 18 | ⊕⊕⊝⊝ | ||
| Apnea, bradycardia, or desaturation | Study population | RR 0.85 | 124 | ⊕⊕⊝⊝ | ||
| 53 per 1000 | 45 per 1000 | |||||
| Moderate | ||||||
| 53 per 1000 | 45 per 1000 | |||||
| Episodes in co‐regulated state (out of 20 observations) Scale from 0 to 20 | Mean number of episodes in co‐regulated state (out of 20 observations) in control groups was | Mean number of episodes in co‐regulated state (out of 20 observations) in intervention groups was | 6 | ⊕⊝⊝⊝ | ||
| Infections ‐ suspected or proven infections (any) | Study population | RR 0.84 | 65 | ⊕⊝⊝⊝ | ||
| 182 per 1000 | 153 per 1000 | |||||
| Moderate | ||||||
| 100 per 1000 | 84 per 1000 | |||||
| Length of hospital stay (days) | Mean length of hospital stay (days) in control groups was | Mean length of hospital stay (days) in intervention groups was | 6 | ⊕⊝⊝⊝ | ||
| Parental satisfaction Scale from 0 to 55 | Mean parental satisfaction in control groups was | Mean parental satisfaction in intervention groups was | 18 | ⊕⊕⊕⊝ | ||
| Neurobehavior: infant pain score following painful procedure ‐ at 30 seconds post heel lance Scale from 0 to 21 | Mean neurobehavior: infant pain score after painful procedure ‐ at 30 seconds post heel lance in control groups was | Mean neurobehavior: infant pain score after painful procedure ‐ at 30 seconds post heel lance in intervention groups was | 224 | ⊕⊕⊝⊝ | ||
| *The basis for the assumed risk (e.g. median control group risk across studies) is provided in footnotes. The corresponding risk (and its 95% confidence interval) is based on the assumed risk in the comparison group and the relative effect of the intervention (and its 95% CI) | ||||||
| GRADE Working Group grades of evidence | ||||||
| aDowngraded 1 level for study limitations (owing to unclear method of sequence generation, non‐blinding, and presence of selective outcome reporting) fDowngraded 1 level for study limitations (owing to non‐blinding of care personnel and outcome assessors) | ||||||
Background
Description of the condition
Advances in antenatal care and use of assisted fertilization techniques (Blondel 2002) over the past three decades have led to an increase in the rate of birth of twins and higher‐order multiples (Imaizumi 1998; Hur 2005; Eriksson 2007), many of whom are preterm infants (Buscher 2000; Blondel 2002a). Compared with singletons of the same postmenstrual age (PMA), twins are at higher risk for intrauterine growth restriction (Liu 2002; Jacquemyn 2003) and developmental disabilities (Topp 2004; Bonellie 2005; Glinianaia 2006). Advances in neonatal intensive care and nutrition have played a major role in improving the prognosis of these infants; however, other measures that may optimize their growth and neurodevelopment should be rigorously assessed.
It is postulated that twins interact with each other while in utero via a series of activities collectively termed "co‐regulation," conferring mutual support that might benefit their growth and development (Nyqvist 1998). Co‐regulatory activities observed include touching, holding, rooting, and hugging, among others (Nyqvist 1998). Co‐regulation might be due in part to the physical proximity of these fetuses in utero, which is lost when infants are nursed separately after birth. For preterm twins, the stress of coping with the extrauterine environment alone may compound the problems faced by preterm infants, leading to even greater deficits in growth and neurodevelopment (Hayward 2003). Some evidence suggests that measures taken to reduce stress for a newborn may improve neurodevelopment and parental satisfaction (Feldman 2002).
Description of the intervention
Co‐bedding is defined as care of two or more hospitalized infants in the same cot or incubator. Co‐bedded infants may be nursed clothed or naked, and periodic care procedures, such as feeding, cleaning, and changing, may be performed simultaneously on all infants by multiple nurses or sequentially by the same nurse, as dictated by the practice protocol of the unit. Nursing environments when co‐bedding is initiated, including incubator temperature and humidity and ongoing monitoring of co‐bedded infants, should be the same as when infants are cared for separately. Co‐bedding is currently practiced only with stable infants because of the difficulties and risks associated with caring for two sick infants in the same incubator. Co‐bedding may have to be suspended when any or all of the co‐bedded infants develop a medical complication, such as infection or the need for phototherapy. When the problem is resolved, co‐bedding may be re‐instituted.
How the intervention might work
Co‐bedding of twins has been introduced in an attempt to maintain their in utero proximity, allowing continuation of fetal co‐regulation, thus easing the transition from intrauterine to extrauterine life. Based on the belief that twins may have a special capacity for supporting each other because of their common intrauterine experiences, this series of activities is believed to promote growth and neurodevelopment (Nyqvist 1998; Hayward 2003), which are chief measures of well‐being for stable infants. Exactly how these activities lead to improved growth and neurodevelopment is unknown.
Other proposed advantages of co‐bedding include heat conservation, apnea reduction, improved bonding between infants, improved parental and staff satisfaction (Nyqvist 1998), and saving of cot space. Preterm twins are likely to be the predominant participants in studies on co‐bedding because of their relative prevalence and cot capacity and longer hospital stay compared with full‐term twins. Among them, twins with significant growth discordance (> 30% difference in birth weight) represent a subgroup of interest for this intervention, as they have been shown consistently to have greater mortality and increased growth and developmental morbidities at various stages of life compared with twins with less growth discordance (Cheung 1995; Scher 2002; Goyen 2003; Adegbite 2004; Yinon 2005).
Why it is important to do this review
Traditionally practiced in many European countries, co‐bedding has been seen increasingly in American neonatal units since the 1990s (Hayward 2003; Tomashek 2007). Reports of co‐bedding for hospitalized neonates in other areas of the world have been scarce.
Concerns on co‐bedding include risk of infection, possible medication error, difficulties involving the routine care of individual infants, less reliable incubator temperature control, mutual disturbance leading to reduced sleep quality, and possible physical injury (Hayward 2003).
The magnitude of the benefits and risks of co‐bedding is currently unclear, and benefits and risks should be evaluated in a variety of clinical situations. Subgroup analyses should be undertaken to evaluate whether effects of co‐bedding are different between groups of infants with different key prognostic characteristics, for example, birth weight (very low birth weight [VLBW] vs non‐VLBW) and postmenstrual age (PMA) (Gutbrod 2000; Hack 2003), growth discordance (Bagchi 2006), and nursed in incubator or cot (Gray 2003), and between twins in a unit where co‐bedding is a standard practice as opposed to a unit where co‐bedding and separate care are practiced in the same setting.
Although infant sleep habits are difficult to monitor beyond the time of discharge, long‐term effects of hospital intervention, even for short periods, cannot be excluded. Co‐bedding of twins, if practiced in the hospital nursery, may influence parental practices at home. This necessitates assessment of long‐term growth, neurodevelopment, and infant mortality, especially in view of general concerns surrounding reports linking infant sleeping practices as well as twinning with sudden infant death syndrome (SIDS) (American Academy of Pediatrics 2005; Gilbert 2005; Adler 2006; Pharoah 2007).
Co‐bedding is considered part of an infant's developmental care (Byers 2003b), especially for a specific and growing target population, namely, twins. Symington and colleagues (Symington 2006) have reviewed various aspects of individualized developmental care of the neonate, but continued research is needed to assess the benefits and risks of co‐bedding for stable preterm twins in terms of growth, neurodevelopment, and other clinically relevant outcomes. If found beneficial and safe, co‐bedding will prove to be a valuable recommendation, particularly for neonatal units with a shortage of infant cot space.
Objectives
We aimed to assess the effectiveness of co‐bedding compared with separate (individual) care for stable preterm twins in the neonatal nursery in promoting growth and neurodevelopment and reducing short‐ and long‐term morbidities, and to determine whether co‐bedding is associated with significant adverse effects.
As secondary objectives, we sought to evaluate effects of co‐bedding via the following subgroup analyses: twin pairs with different weight ranges (very low birth weight [VLBW] < 1500 grams vs non‐VLBW), twins with versus without significant growth discordance at birth, preterm versus borderline preterm twins, twins co‐bedded in incubator versus cot at study entry, and twins randomized by twin pair versus neonatal unit.
Methods
Criteria for considering studies for this review
Types of studies
We included randomized controlled trials and quasi‐randomized trials at the level of each twin pair or at the level of each neonatal unit (neonatal intensive care unit [NICU]‐cluster trials). We excluded cross‐over trials, as we considered it highly likely that the major outcomes examined, such as weight gain and neurobehavior, would be significantly "contaminated" by the cross‐over.
Types of participants
We included studies that enrolled pairs of twins of less than 37 weeks' gestation who were considered clinically stable at study entry. We excluded studies that exclusively enrolled infants under intensive care (including those needing any type of respiratory support apart from nasal prong, low‐flow oxygen supplement, and/or any type of circulatory support) or those clinically considered septic at study entry or with congenital anomaly or open skin wounds. For studies with a mixture of stable and less stable infants, we planned to retrieve and analyze only data from stable infants; we planned to contact the primary study authors if necessary.
We placed no limit on weight and did not restrict the lower limit of PMA.
We included both growth‐concordant and growth‐discordant twins in the overall analysis and separated significantly growth‐discordant twins from others in subgroup analyses. We defined significant growth discordance in this review as an intra‐pair difference in birth weight greater than 30%, with the weight of the larger twin taken as the denominator, as weight discordance beyond this level has been consistently associated with worsening of clinically important outcomes (Cheung 1995; Yalcin 1998; Branum 2003; Bagchi 2006).
Participants were eligible regardless of their postnatal age as soon as they were considered clinically stable by the attending physicians.
Types of interventions
Intervention
Co‐bedding was defined as placement of twins in the same cot or incubator for nursery care. Co‐bedded twins might be nursed clothed or naked, and periodic care procedures, such as feeding, cleaning, and changing, might be performed simultaneously on both twins by two nurses or sequentially by the same nurse, as dictated by the practice protocol of the unit. If any twin required separate care as the result of a problem such as infection or the need for phototherapy, co‐bedding might be re‐instituted when the problem was resolved, as long as the twins were co‐bedded for a total duration of at least one week, as specified under the subheading "Length of intervention."
Time of initiation
We included twin pairs of any postnatal age if they were considered clinically stable as defined by study authors.
Length of intervention
We did not set a minimum duration of intervention because it is unknown how long twins need to be in close contact with each other to show meaningful effects on physiological parameters, growth, and neurodevelopmental outcomes, and studies that have assessed skin‐to‐skin contact between newborn infants and their mothers show that beneficial effects can be demonstrated after as little as 15 minutes of such contact (Moore 2012). We accepted any timing for commencement of the intervention, as long as infants were considered clinically stable when the intervention was started. Once the intervention was instituted, twins had to be co‐bedded the whole time, except during nursing care or contact with family members, such as during breast‐feeding and parental cuddling.
Comparison
Each twin was placed in a separate cot or incubator for nursery care.
Adjustments to the nursing environment involving incubator temperature and humidity and ongoing monitoring should be guided by the same protocol for co‐bedded twins as for twins nursed separately on the same unit. The sleeping position of each infant participant (supine, prone, or lateral), regardless of assigned group, was standardized.
We excluded trials that examined co‐bedding with concurrent developmental care interventions, such as nesting, swaddling, kangaroo care, and the Neonatal Individualized Developmental Care Program (NIDCAP) regimen (Symington 2006), because use of these measures likely limits the freedom of co‐bedded twins in undertaking co‐regulatory activities, thereby weakening the credibility of the claim of association between any observed effect and mechanisms through which co‐bedding was postulated to work.
Types of outcome measures
We have listed units of analysis for the following outcomes for studies in which randomization occurred at the level of each twin pair. We have provided additional details on how we handled units of analysis under the heading Unit of analysis issues.
Primary outcomes
-
Growth: average rate of weight gain between twin pairs for the whole period of the study, expressed in grams/kg/d. We used a standard formula to derive the rate of weight gain (Patel 2005).
-
Apnea: average number of episodes between twin pairs. Apnea was defined as cessation of breathing for at least 20 seconds, or for a shorter period if accompanied by bradycardia or cyanosis (American Academy of Pediatrics 2003).
-
Bradycardia: average number of episodes between twin pairs. Bradycardia was defined as a fall in heart rate of greater than 30% to below baseline (Henderson‐Smart 1986) or to less than 100 beats per minute for at least 10 seconds (Bredemeyer 2012).
-
Neurobehavior in the nursery measured by validated scales such as the Brazelton Neonatal Behavior Assessment Scale (NBAS) and the Neonatal Intensive Care Unit Network Neurobehavioral Scale (NNNS) (Lester 2004), including infant co‐regulation, stress response, and sleep/wake state, as defined by the proportion of time in quiet sleep.
Secondary outcomes
-
*Number of twin pairs with sepsis (clinically diagnosed and/or microbiologically proven).
-
Average number of days between twin pairs to reach full enteral feed by gavage or by mouth at a volume of at least 150 mL/kg/d.
-
*Number of twin pairs with feed intolerance (defined as a need to stop enteral feeds).
-
*Number of twin pairs requiring intensive care, including the need for any type of respiratory and/or circulatory support.
-
*Number of twin pairs for whom cessation of co‐bedding is required for other clinical reasons, such as infection or the need for phototherapy.
-
All‐cause neonatal mortality (mortality in the period up to 28 days after birth) in one or both twins, before or after discharge.
-
Average length of hospital stay between twin pairs (days).
-
Average cost of care between twin pairs.
-
Long‐term growth, as indicated by average weight gain between twin pairs measured at intervals as specified by the authors of individual studies, for example, at three, six, 12 and 18 months.
-
Long‐term neurodevelopment, measured by validated scales such as Bayley Scales of Infant Development (Washington 1998), whereby average scores between twin pairs would be taken if data were available. Clinically diagnosed non‐ambulatory cerebral palsy or significant auditory and visual impairment would be accepted if data were available.
-
All‐cause infant mortality in one or both twins.
-
SIDS in one or both twins.
-
Parental and staff satisfaction measured by validated scales, such as a health‐related quality of life tool (HRQoL) or a health outcome rating scale, or self reported parental or staff dissatisfaction. One overall measure would be taken for the parents of each twin pair if data were available.
-
Adverse effects (number of twin pairs in whom these occur), such as medication errors, hypothermia (core body temperature < 36.5°C or skin temperature < 36°C), or hyperthermia (core temperature > 38°C or skin temperature > 37.5°C) (WHO 1997), physical injury, and other patient safety‐related outcomes as defined by individual studies.
-
Incidence of co‐bedding post discharge.
-
Other clinically relevant outcomes, as specified by the authors of individual studies.
*For these secondary outcomes, we would count as one positive outcome incidents when one or both twins developed the stated outcome.
Outcomes were measured at the following points in time.
-
During hospital stay (weight gain, neurobehavioral status, clinically important outcomes such as sepsis and feed intolerance, parental and staff satisfaction).
-
At discharge (weight, parental and staff satisfaction).
-
At defined points beyond discharge, as variously set by the authors of included studies when assessment of growth and neurodevelopment becomes feasible.
Search methods for identification of studies
We used the criteria and standard methods of The Cochrane Collaboration and the Cochrane Neonatal Review Group (see the Cochrane Neonatal search strategy for specialized register).
Electronic searches
We conducted a comprehensive search of the Cochrane Central Register of Controlled Trials (CENTRAL; 2016, Issue 2); MEDLINE via PubMed (1966 to February 29, 2016); EMBASE (1980 to February 29, 2016); and the Cumulative Index to Nursing and Allied Health Literature (CINAHL) (1982 to February 29, 2016) using the following search terms: (Nurseries OR Neonatal nursing OR NICU) AND (cobed* OR (co bed*) OR (bed shar*) OR (co sleep*), plus database‐specific limiters for randomized controlled trials (RCTs) and neonates (see Appendix 1 for the full search strategy for each database). We applied no language restrictions.
We searched clinical trials registries for ongoing or recently completed trials (clinicaltrials.gov, the World Health Organization International Trials Registry and Platform [www.whoint/ictrp/search/en/], and the International Standard Registered Clinical Trial Number [ISRCTN] Registry [ISRCTN Registry]).
We accepted studies whether published or unpublished, in full article or abstract form, as long as assessment of study quality was possible and other inclusion criteria had been fulfilled.
Searching other resources
We contacted the authors of all selected studies about ongoing trials and unpublished data. We searched the references cited in previous relevant Cochrane reviews and in other relevant papers, review articles, and Internet documents. We assessed the results of handsearching by the Cochrane Neonatal Review Group. We searched the proceedings of relevant pediatric and perinatal conferences (specifically, those of the American Academy of Pediatrics, the European Academy of Pediatrics, the European Society of Paediatric Research (ESPR), the United Kingdom Perinatal Society, and the Perinatal Society of Australia and New Zealand) to identify relevant published abstracts.
Data collection and analysis
We followed the standards of the Cochrane Neonatal Review Group.
Quality of evidence
We assessed the quality of evidence for the main comparison at the outcome level using the Grading of Recommendations Assessment, Development, and Evaluation (GRADE) approach (Guyatt 2011a). This methodological approach considers evidence from randomized controlled trials to be of high quality that may be downgraded on the basis of consideration of any of five areas: design (risk of bias), consistency across studies, directness of evidence, precision of estimates, and presence of publication bias (Guyatt 2011a). The GRADE approach assigns the quality of a body of evidence to one of the following grades: High quality: We are very confident that the true effect lies close to that of the estimate of the effect; Moderate quality: We are moderately confident in the effect estimate: The true effect is likely to be close to the estimate of the effect, but it may be substantially different; Low quality: Our confidence in the effect estimate is limited: The true effect may be substantially different from the estimate of the effect; and Very low quality: We have very little confidence in the effect estimate: The true effect is likely to be substantially different from the estimate of effect (Schünemann 2013).
Review authors independently assessed the quality of the evidence for outcomes identified as critical or important for clinical decision making. These outcomes include rate of weight gain (in gram/kg of baseline weight/d), average from study entry to week three; apnea, bradycardia, or desaturation; episodes in the co‐regulated state (out of 20 observations); infections (any suspected or proven infection); length of hospital stay (in days); parental satisfaction; and infant pain score following a painful procedure (at 30 seconds post heel lance).
In cases in which we considered that the risk of bias resulted from inadequacies in concealment of allocation, randomized assignment, complete follow‐up, or blinded outcome assessment, our confidence in effect estimates was reduced, and we downgraded the quality of evidence accordingly (Guyatt 2011b). We evaluated consistency by noting similarity of point estimates, extent of overlap of confidence intervals, and statistical criteria, such as measurement of heterogeneity (I2). We downgraded the quality of evidence when large and unexplained inconsistency was observed across studies (i.e. some studies suggest important benefit, and others no effect or harm without a clinical explanation) (Guyatt 2011d). We assessed precision on the basis of width of the 95% confidence interval (CI) and the calculated optimal information size (OIS). If the total number of participants included in the pooled effect estimation was less than the number of participants generated by a conventional sample size calculation for a single adequately powered trial, we considered rating the quality of evidence down for imprecision (Guyatt 2011c). When trials were conducted in populations other than the target population, we downgraded the quality of evidence because of indirectness (Guyatt 2011e).
We entered data (i.e. pooled estimates of effects and corresponding 95% CIs) and explicit judgments for each of the above assessed aspects into the Guideline Development Tool ‐ the software used to create "Summary of findings" tables (GRADEpro). We explained all judgments involving assessment of the study characteristics described above in footnotes or comments provided in the "Summary of findings" tables.
Selection of studies
We used standard methods of The Cochrane Collaboration and its Neonatal Review Group. All review authors independently assessed studies and determined their eligibility by using a form with predefined inclusion criteria. We excluded any study that did not fit the criteria and resolved disagreements by discussion.
Data extraction and management
Three review authors (NML, SCF, and WCF) independently entered individual data from each included trial onto a standardized data collection form. Data entered were compared, and differences were resolved by consensus.
Assessment of risk of bias in included studies
Two review authors (NML and SCF) independently assessed risks of bias of included trials, using standard methods of The Cochrane Collaboration as presented in the Cochrane Handbook for Systematic Reviews of Interventions Version 5.1 (Higgins 2011).
Specifically, we assessed trials on the basis of the following: adequacy of sequence generation, allocation concealment, blinding to the intervention, completeness of follow‐up, and blinding to outcome measurement.
Had data been available from cluster‐randomized trials, we planned to assess the following specific additional biases when applicable: recruitment bias, baseline imbalance, loss of clusters or individuals within clusters, incorrect unit of analysis (as elaborated in the corresponding section), and compatibility with individually randomized trials.
Information on risks of bias was included in the Characteristics of included studies table.
In addition, we evaluated the following issues and made a judgment regarding high, unclear, or low risk of bias.
-
Sequence generation: Was the allocation sequence adequately generated?
-
Allocation concealment: Was allocation adequately concealed?
-
Blinding of participants, personnel, and outcome assessors: Was knowledge of the allocated intervention adequately prevented during the study? At study entry? At the time of outcome assessment?
-
Incomplete outcome data: Were incomplete outcome data adequately addressed?
-
Selective outcome reporting: Were reports of the study free of the suggestion of selective outcome reporting?
-
Other sources of bias: Was the study apparently free of other problems that could put it at high risk of bias?
Measures of treatment effect
We followed the procedures of the Cochrane Neonatal Review Group. For categorical data, when applicable, we used risk ratios (RRs), risk differences (RDs), and numbers needed to treat for an additional beneficial outcome (NNTBs) along with their respective 95% confidence intervals (CIs). For continuous data, such as length of hospital stay, we used mean differences (MDs) with 95% CIs.
Unit of analysis issues
We identified the unit of analysis for each individual trial to determine whether appropriate adjustments had been made to account for non‐independence between twin pairs via use of appropriate analysis methods, such as generalized estimating equation (GEE) modeling. Had an NICU‐cluster trial been included, we would have looked for evidence of adjustments at the level of the NICU, in addition to adjustments at the level of each twin pair. If the unit of analysis was not stated in the study, we planned to inspect the width of the standard error (SE) or the 95% CI of estimated treatment effects. If we found an inappropriately small SE or a narrow 95% CI, we would have asked the authors of the study to provide information on the unit of analysis.
In this review, we considered each twin pair as representing one unit when we analyzed data from trials in which randomization occurred at the level of each twin pair. For continuous outcomes, we reported the average figure for each twin pair, for example, the average rate of weight gain of the twin pairs. For dichotomous outcomes with low event rates, we counted the event as positive if either of the twins developed the outcome (e.g. in this review, we counted the outcome of sepsis as positive if one or both twins developed sepsis). For dichotomous outcomes with high event rates, had data been available, we would have assigned a score of zero, one, or two, which would correspond to the number of twins in a twin pair with the outcome of interest.
When we found a unit of analysis error, for example, when the included study analyzed outcome data for individual infants instead of for each twin pair, we re‐analysed data derived from the studies and adjusted for the effect of clustering by using different strategies for two main types of studies, as follows.
-
For studies in which randomization occurred at the level of each twin pair, as in the included studies, we adjusted individual data, counting each twin dyad as an individual. For continuous data, we recorded the average reading of the twin pair. For dichotomous data, we recorded the number of twin pairs with the outcome (positive if any or both of the twins developed the outcome).
-
Had we included studies in which randomization occurred at the level of the neonatal unit (i.e. NICU‐cluster trials), we would have dealt with two levels of clustering: (a) clustering at the level of the twin pair, and (b) clustering at the level of the neonatal unit.
-
-
To address (a), we would have adjusted the individual data, counting each twin dyad as an individual. For continuous data, we would have recorded the average reading of the twin pair. For dichotomous data, we would have recorded the number of twin pairs with the outcome (positive if any of the twins developed the outcome).
-
To address (b), we would have adjusted the final estimates of each study obtained by analyzing each twin dyad, as stated. We would have done so by multiplying the SEs of the final effect estimates by the square root of the "design effect": (1 + (M ‐ 1) × ICC), where M was the average cluster size (number of twin pairs per cluster) and ICC was the intra‐cluster correlation among twin pairs within each NICU. We would have determined the average cluster size (M) from each trial by dividing the total number of twin pairs by the total number of clusters. We would have sought the best estimate of the ICC from reliable resources such as landmark studies involving twins and NICU clustering.
-
We would have combined adjusted final effect estimates from each trial with their SEs in the meta‐analysis using generic inverse variance methods.
-
Should we fail to identify a reliable ICC for NICU‐cluster trials for twins after searching through relevant resources, we planned to use partially adjusted estimates (adjusted only at the level of each twin dyad) for our meta‐analysis. We planned to include studies for which determination of the unit of analysis was not possible in the overall meta‐analysis on the basis of effect estimates given by study authors. We would have then performed a sensitivity analysis to assess how the overall results were affected with and without inclusion of these studies.
Dealing with missing data
We obtained a drop‐out rate from each included study. A drop‐out rate equal to or greater than the control group event rate would be considered significant. If a significant drop‐out rate had been found, we would have contacted the authors of the individual studies to ask that they provide additional data when possible.
Had a sufficient quantity of data been available, we would have performed a sensitivity analysis to assess how the overall results were affected with and without inclusion of studies with significant drop‐out rates.
Assessment of heterogeneity
Had we included more than one study that reported the same outcome measure, we would have assessed the treatment effects of individual trials and heterogeneity between trial results by first inspecting the forest plots.
We then would have evaluated the I2 statistics to look for an indication of the degree of heterogeneity in study results, with a value greater than 50% indicating moderate or high heterogeneity. If moderate or high heterogeneity was found, we would have explored the causes (e.g. differences in study quality, participants, interventions, or outcome assessments) via post hoc subgroup analyses. We then would have made a decision about whether a meta‐analysis would be appropriate and, if so, whether we should exclude some studies.
Assessment of reporting biases
We constructed a matrix consisting of all outcomes assessed in each included study, as stated in the methods and reported in the results. We compared reported outcomes against outcomes listed in the methods section. In addition, when we found in a study some key outcomes that we considered assessable but were not included, we contacted the study authors to ask for clarification. We sought the study protocol, when possible, from PubMed, a relevant trial registry, or a Web link provided by the study, or we directly contacted study authors. We performed cross‐examination against the conference presentation of the same work, when possible. We planned that if all of the above measures failed to provide further useful information, we would perform a sensitivity analysis by taking an outcome that was reported by all studies and comparing overall results with and without inclusion of studies in which key outcomes were missing.
We planned to screen for publication bias by using a funnel plot if we included a sufficient number of studies (≥ 10) in the analysis. If we suspected publication bias (i.e. significant asymmetry upon visual inspection of the funnel plot), we would have included a statement in our results and a corresponding note of caution in our discussion.
Data synthesis
Had data from more than one study been available for each outcome, we would have used a fixed‐effect model to combine the final effect estimates from each trial with their SEs in the meta‐analysis using generic inverse variance methods in RevMan.
Subgroup analysis and investigation of heterogeneity
Had relevant data been available, we would have performed subgroup analyses for the following.
-
Twins with different weight range: VLBW (birth weight of the smaller twin < 1500 g) vs non‐VLBW.
-
Twins with and without significant weight discordance at birth.
-
Preterm twins (< 34 completed weeks of PMA at commencement of co‐bedding) and twins of borderline maturity (35 and 36 weeks' completed PMA).
-
Twins co‐bedded in an incubator and a cot at study entry.
-
Studies in which randomization occurred at the level of each twin pair and each neonatal unit.
Sensitivity analysis
We would have performed sensitivity analyses based on the following, if applicable.
-
Adequacy of sequence generation and allocation concealment, as detailed under the heading Assessment of risk of bias in included studies.
-
Adequacy in handling missing data, as detailed under the heading Dealing with missing data.
-
Availability and adequacy of adjustments of units of analysis, as detailed under the heading Unit of analysis issues.
Results
Description of studies
Results of the search
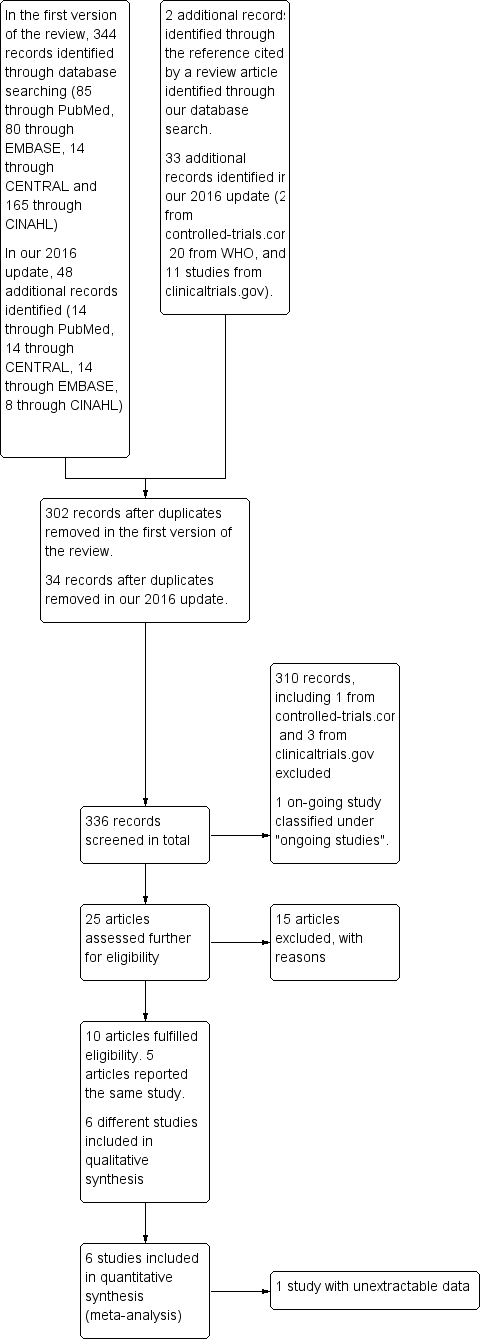
In the original search, we identified a total of 344 records, including 85 records from PubMed, 80 from EMBASE, 14 from CENTRAL, and 165 from CINAHL. A search of CINAHL based on the equivalent search strategy yielded only eight records. Without publication type filters (item #11 in our search strategy [see Electronic searches]), the CINAHL search yielded 165 records. We decided to screen those 165 records alongside records identified through the other databases. We found two additional relevant articles by reviewing the reference list of a review article (Tomashek 2007) and noted that both publications (Lutes 2000a; Longobucco 2002) were not indexed in any of the databases that we had searched. After removal of duplicates, we retained 302 records for further inspection. For our 2016 update, we identified 47 additional records, including 41 from the databases and six from the trial registries. After removal of duplicates, 34 records were available for further inspection.
After inspecting the titles, we short‐listed 25 articles, including four from our 2016 update. These included 14 articles from PubMed, six from CINAHL, three from EMBASE, and both additional references as stated above (Lutes 2000a; Longobucco 2002). We found no additional relevant records in CENTRAL. One article that we identified through PubMed included a protocol of a study, which was subsequently published in abstract form and in full text (Campbell‐Yeo 2012b), along with three other reports of the same study with outcomes that were not pre‐specified as relevant in our review; these were included as additional references for Campbell‐Yeo 2012b. We also identified an article that was published in French (Mazeiras 2010) ‐ the only non‐English article in our short list.
Two articles in our short list (Lutes 2000; Lutes 2001) appeared to describe the same study, but we could not confirm this, as we were unable to acquire the full text of Lutes 2000, and we have not heard from the study authors despite multiple emails sent since the initial review was drafted to request further information. We have excluded Lutes 2000 from our 2016 update for lack of information.
After we had assessed the abstracts or full‐text writings of these short‐listed articles, we included five articles (Lutes 2001; Byers 2003a; Chin 2006; Hayward 2007; Campbell‐Yeo 2012b) in our original analysis along with one additional article (Badiee 2014) from our 2016 update. We have provided in Figure 1 a flow diagram of the review process from initial search to final inclusion of studies.

Flow diagram of the review process from initial search to final inclusion of studies.
Included studies
All six included studies were randomized controlled trials conducted in level three NICUs, with co‐bedding instituted according to standard protocols. Byers 2003a enrolled eight pairs of co‐bedded infants and 21 infants cared for by separate nursing, as well as 19 parents. All infants were preterm (average 29 weeks' PMA). A mixture of twins and triplets were enrolled, and two triplets who were considered most stable at the time of enrollment were chosen for co‐bedding. Campbell‐Yeo 2012b enrolled 67 sets of twins at between 28 and 36 weeks' PMA. In Chin 2006, participants consisted of 39 pairs of twins at less than 34 weeks' PMA. Hayward 2007 was a pilot study in which investigators assessed six pairs of twins weighing less than 2000 grams. Lutes 2001 recruited 38 sets of twins, 11 sets of triplets and three sets of quadruplets. Badiee 2014 recruited 50 pairs of twins of 26 to 34 weeks' PMA whose postnatal age was less than 20 days.
In Byers 2003a, major outcomes were infants' physiological parameters, sleep‐wake synchrony, and parental perception of care. Campbell‐Yeo 2012b and Badiee 2014 assessed specifically the response of infants to heel lance by using the Premature Infant Pain Profile (PIPP), which could be classified under infant neurobehavior. Chin 2006 included weight and combined episodes of apnea/bradycardia and desaturation (A/B/D) as the primary outcomes. Infection and medication error were the secondary outcomes in this study. Hayward 2007 reported amount of quiet sleep, crying, and time spent co‐regulated as major outcomes. Study authors employed a rating scale (0 to 20) for these outcomes that was based on the number of episodes in which outcomes of interest were present during the designated 20 periods of observation (see Characteristics of included studies: Hayward 2007, "Outcomes," for a more detailed description of the unit of measurement). Lutes 2001 reported weight gain, growth of head circumference, and length as primary outcomes. Secondary outcomes were medication error, nosocomial infection, sepsis workup initiated, and thermal insult. However, study authors did not report outcomes separately for twins, triplets, and quadruplets. We have provided a detailed description of all studies in the Characteristics of included studies table.
In all six studies, the unit of analysis was the individual infant rather than the twin pair, and two studies (Campbell‐Yeo 2012b; Badiee 2014) performed statistical adjustments to account for the effects of twin clustering by using GEE. We adjusted the unit of analysis for Chin 2006 after re‐analysing the raw data that we obtained from the lead study author. We accounted for the unit of analysis in Hayward 2007 by adjusting the number of participants from the total number of individual infants to the total number of twin pairs. We are still waiting for the authors of Byers 2003a and Lutes 2001 to provide us with their raw data so we can make adjustments for the unit of analysis.
Excluded studies
Among the 15 excluded studies, four (DellaPorta 1998; Anon 2002; Wahl 2006; Mazeiras 2010) were commentaries or review articles, four (Fischer 1991; Nyqvist 2002; Matthews 2004; Jahanfar 2012) were original studies that did not address our research question on co‐bedding of preterm infants, and six assessed co‐bedding of preterm infants, but all were prospective single‐group studies (Nyqvist 1998; Touch 2002), a prospective cross‐over study (Stainton 2005), a prospective study with historical controls (Longobucco 2002), or retrospective cohort studies (Polizzi 2003; LaMar 2006). We excluded one study (Lutes 2000) from our 2014 update when we were unable to obtain further information; we could not obtain the full text nor a reply from study authors after multiple attempts. We have provided a detailed description of these studies in the Characteristics of excluded studies table.
Risk of bias in included studies
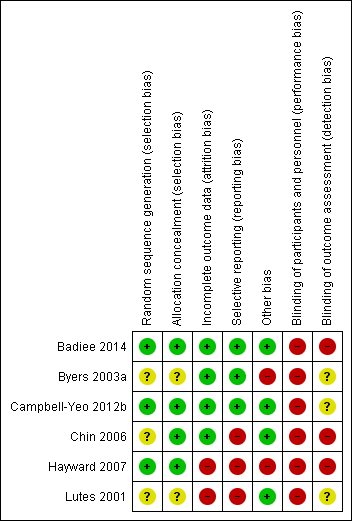
We have provided a graphical summary of the overall risk of bias in Figure 2 and Figure 3.

Methodological quality summary: review authors' judgements about each methodological quality item for each included study.
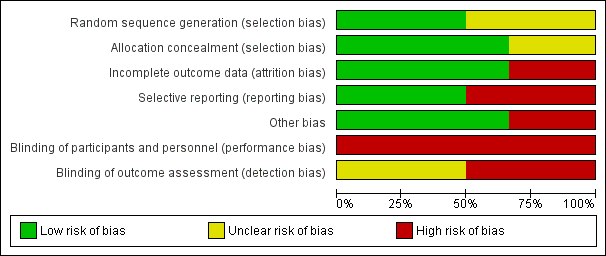
Methodological quality graph: review authors' judgements about each methodological quality item presented as percentages across all included studies.
Allocation
Two articles (Campbell‐Yeo 2012b; Badiee 2014) provided sufficient details of random sequence generation and allocation. Chin 2006 achieved randomisation by using randomly permuted blocks of two, four, and six via a computerized off‐site Website accessed only by the principal investigator or a research nurse. Badiee 2014 performed randomization by using computer‐generated random number tables and carried out allocation by using sealed and opaque envelopes. The authors of both Chin 2006 and Hayward 2007 provided further details in correspondence describing how allocations were carried out. Chin 2006 used sealed and opaque envelopes for allocation, and Hayward 2007 placed the assignment in folded cards that were taped shut and placed into sealed envelopes. Byers 2003a and Lutes 2001 provided no details on how randomization was achieved. Overall, two studies had low risk and three studies had unclear risk of bias on sequence generation, and three studies had low risk of bias on allocation concealment.
Byers 2003a, Chin 2006, and Hayward 2007 provided evidence indicating that allocated groups were unequal in some major characteristics. In Byers 2003a, co‐bedded infants had higher PMA at study enrollment compared with infants in the control group (average 33 weeks' PMA in co‐bedding group and 30.6 weeks' PMA in control group) and higher proportions of male infants (68.3% in the co‐bedded group and 22.7% in the control group). In Campbell‐Yeo 2012b, participants appeared well matched in their baseline characteristics. The authors of Chin 2006 stated that "the two groups were well balanced for PMA, gender, and race, although not for baseline weight" (Results, paragraph 4, lines 1 to 3), and in Hayward 2007, study authors stated, "There was a difference in the distribution by age, education, and employment status" (Sample characteristics, paragraph 1, lines 4 to 6). Lutes 2001 did not comment on the degree of similarity in baseline characteristics of their sample. Table 4 in the article shows that the two groups appeared well balanced in baseline characteristics, except in mean birth weight (co‐bedded group 1459.3 grams, control group 1262.6 grams).
Blinding
Although it was not clearly stated in most studies, blinding of caregivers as well as outcome assessors appeared very unlikely across all studies in view of the nature of the intervention assessed. Further correspondence with the lead authors of Chin 2006 and Hayward 2007 revealed that data collectors were not blinded to the allocation status of infants. We are still awaiting response from the authors of Byers 2003a and Lutes 2001 to clarify whether data collectors were blinded.
Incomplete outcome data
Four studies (Byers 2003a; Chin 2006; Campbell‐Yeo 2012b; Badiee 2014) had low risk of bias, and two studies (Lutes 2001; Hayward 2007) had high risk of bias. In Badiee 2014, 100 out of 105 recruited infants (95.2%) completed the study, although the five infants who did not receive the allocated intervention were dropped from the analysis with no reasons stated. In Byers 2003a, all except one infant, who was diagnosed with sepsis, completed the study. Campbell‐Yeo 2012b reported a 7.4% non‐completion rate and a balanced number of non‐completers between the two groups. Chin 2006 started with 41 pairs of twins and ended with 22 pairs of twins at last measurements. Study authors accounted for the progressive loss of data by stating that some infants had been discharged home over the study period. Hayward 2007 started with six pairs of twins and ended with two pairs of twins at last measurements. The study author stated upon further contact that loss of data was due to early discharge and unplanned transfer to other hospitals. Lutes 2001 included all participants, with no loss of data for the outcomes of medication error, nosocomial infection, sepsis workups initiated, and thermal insults. However, for growth outcomes, study authors did not state the total number of participants analyzed nor reasons for loss of data.
Selective reporting
As illustrated in Table 1, Chin 2006 and Hayward 2007 provided evidence of selective outcome reporting.
| Study ID | Outcomes listed in the methods | Additional key outcomes relevant to the study | Actual outcomes reported |
|
| This study assessed specifically physiological measures in the short term. Growth parameters were reported, but as "mean daily weight," which was not suitable for meta‐analysis. Additionally, physiological measures were reported in the form of average figures, such as average "highest activity heart rate," not as episodes of apnea, bradycardia, or desaturation, which are more clinically relevant |
| |
|
| This study assessed specifically infants' response to pain; growth‐related outcomes such as weight gain and length of hospital stay were not included in the outcomes. The only outcome that was relevant to this review was the pain response, which we considered as a form of neurobehavior |
| |
|
|
|
| |
|
|
|
(Study authors stated, "Data were insufficient to analyse parental self‐efficacy and parental stress" ‐ Results, paragraph 1, lines 1 to 3) | |
| No outcome was listed in the methods. However, the following 3 major outcomes were stated in the purpose and hypothesis section
|
|
| |
|
| Like Campbell‐Yeo 2012b, this study assessed specifically infant response to pain; growth‐related outcomes were not assessed | The only outcome included in this review is PIPP score |
Chin 2006 did not report the primary outcome of weight gain, as stated in the study title. Instead, study authors reported adjusted mean weight. From the study authors' primary data, we derived the rate of weight gain from data on weight, and we included this as the primary outcome in our analysis. Investigators did not assess length of hospital stay ‐ a key outcome relevant to this study.
Hayward 2007 did not report the major pre‐specified outcome of parental self efficacy and anxiety, nor the key outcomes of infant growth and apnea, bradycardia, and desaturation episodes. Study authors stated that "data were insufficient to analyse parental self‐efficacy and anxiety."
Authors in Lutes 2001, Byers 2003a, Campbell‐Yeo 2012b, and Badiee 2014 reported all pre‐specified outcomes. However, Lutes 2001 did not provide the number of participants analyzed in any of their outcomes, nor standard deviations for continuous outcomes (mean weight gain, length, and head circumference growth).
Effects of interventions
Difficulties in combining data for meta‐analysis
The six included studies presented their outcomes differently (Table 1). For instance, Campbell‐Yeo 2012b reported A/B/D as a dichotomous outcome in the form of the number of infants in either group who had these episodes, but Chin 2006 reported this outcome as a continuous outcome in the form of the mean (and median) number of combined episodes in either group. Consequently, we could not combine data from these two studies. We included only data from Campbell‐Yeo 2012b in RevMan (RevMan 2011) and analyzed the data of Chin 2006 separately (Stata 2007), as the data were skewed and were unsuitable for analysis in RevMan. Next, Byers 2003a reported only average figures for physiological measures such as heart rate, respiratory rate, and oxygen saturation ‐ not the episodes of A/B/D specified a priori as our primary outcomes. Although Lutes 2001 reported outcomes reported in the other two studies, they provided combined data from twins and higher‐order multiples and presented no separate report for twins only. Therefore, we could not extract appropriate data to be combined with data from the other studies. Furthermore, study authors did not report the standard deviation for continuous outcomes (weekly weight gain, gain in length, and head circumference). Among three studies that assessed caregiver errors, two documented no events (Byers 2003a; Hayward 2007), and Lutes 2001 documented one event in an infant in the co‐bedding group. However, it remains unclear whether this infant was one of the twins or higher‐order multiples ‐ a population group that would have been excluded in this review. Therefore, we have not included the data for this outcome in our meta‐analysis.
Overall, we were able to pool only two outcomes: PIPP in response to heel prick from Badiee 2014 and Campbell‐Yeo 2012b, and infection from Byers 2003a, Chin 2006, and Hayward 2007. We combined all specific outcomes related to infection from each of the three studies above to form a composite outcome of "Suspected or proven infection (any)." For all other outcomes, a single study effectively contributed the data: Chin 2006 provided data on weight; Hayward 2007 data on length of hospital stay, time in quiet sleep, crying, and co‐regulation; Byers 2003a data on physiological measures such as heart rate, respiratory rate, oxygen saturation, and parental measures; and Campbell‐Yeo 2012b infant pain measures and time to recovery of physiological parameters following painful procedures.
Adjustment of the unit of analysis
We obtained primary study data from the authors of Chin 2006 and adjusted the analysis by taking average measures of twin pairs for all outcomes, which included weight and total combined episodes of apnea, bradycardia, and desaturation (A/B/D). The authors of this paper did not report rate of weight gain, which we specified as the primary outcome of this review; instead, they reported "adjusted mean weight" as their primary outcome. We decided not to include "adjusted mean weight" as the outcome of our review, as we considered this misleading. Instead, we derived rate of weight gain (expressed as grams per kilogram of baseline weight per day) from the primary data provided by study authors and included this as the primary outcome of growth in this review. We used the formula ((ln (natural log) (final weight/beginning weight) × 1000)/7 days) (Patel 2005) to derive the rate of weight gain for each week of the study from study entry to week three. We obtained the average rate of weight gain from study entry to week three by averaging the three readings that we obtained for each week of the study. As no information on length of hospital stay was included in the primary data, we could not include this in our analysis.
For Hayward 2007, we adjusted the unit of analysis from each individual infant to each twin pair for the outcomes of length of hospital stay, episodes of quiet sleep, crying, and co‐regulation by halving the number of units (from six [individual infants] to three [twin pairs]). However, we could not adjust the analysis to overcome bias due to differential contributions of data from each twin pair for the outcomes of quiet sleep, crying, and co‐regulation, as this would require the raw data that we have not managed to acquire. We also adjusted the unit of analysis for Byers 2003a from each individual infant to each twin pair, effectively halving the sample size. We performed no adjustment on the unit of analysis for Campbell‐Yeo 2012b and Badiee 2014, as study authors had adjusted the results using GEE and reported no differences in effect sizes for their reported outcomes.
A summary of the effects of co‐bedding versus separate care after adjustment for the unit of analysis follows here.
Primary outcomes
Rate of weight gain (in gram/kg of baseline weight/d) (Outcome 1.1)
We found no difference between co‐bedded twins and twins receiving separate care in rate of weight gain throughout the period of the study (one study, 18 pairs of twins at the end of the study, low quality of evidence, downgraded two levels for study limitations and imprecision; see detailed results according to week after enrolment in Figure 4).

Forest plot of comparison: 1 Co‐bedding vs separate care, outcome: 1.1 Rate of weight gain (in gram/kg of baseline weight/d).
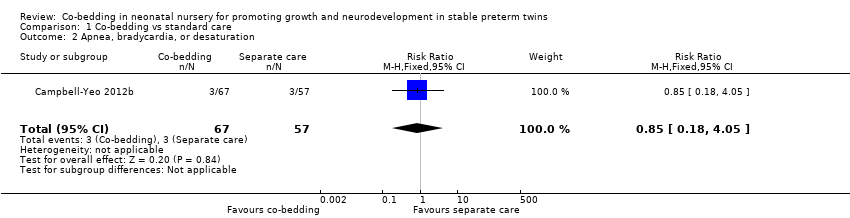
Apnea, bradycardia, and desaturation (Outcome 1.2)
We found no difference in the number of infants with A/B/D in Campbell‐Yeo 2012b (one study, 62 pairs of twins, RR 0.85, 95% CI 0.18 to 4.05, low quality of evidence, downgraded two levels for imprecision and indirectness). However, in Chin 2006 (38 pairs of twins), the co‐bedded group had consistently fewer episodes of A/B/D throughout the three weeks of the study compared with the control group, although the difference was not statistically significant (Table 2).
| Study ID | Study period | Median combined A/B/D episodes | P value | |
| Co‐bedded group | Control group | |||
| Week 1 | 4.5 | 7 | 0.2 | |
| Week 2 | 6 | 12 | 0.8 | |
| Week 3 | 2.5 | 8 | 0.4 | |
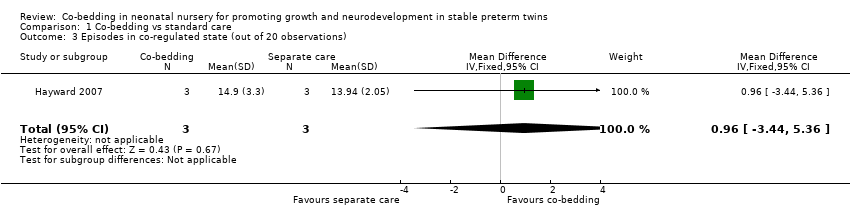
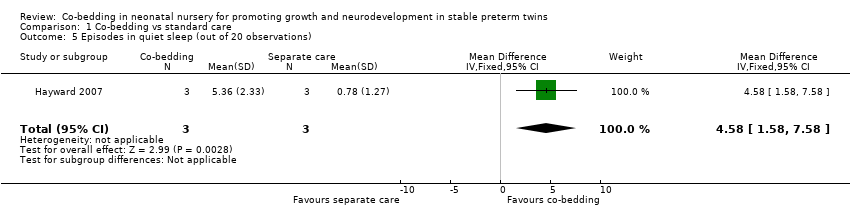
Co‐regulated state (Outcome 1.3), crying (Outcome 1.4), and quiet sleep (Outcome 1.5)
Data from Hayward 2007 showed no differences among episodes in the co‐regulated state (MD 0.96, 95% CI ‐3.44 to 5.36, three pairs of twins, very low quality of evidence, downgraded three levels because of imprecision and serious study limitations [two levels]). However, the co‐bedded group had more crying episodes (one study, six pairs of twins, MD [scale of 0 to 20] 4.4, 95% CI 1.7 to 7.1) and more episodes of quiet sleep (one study, six pairs of twins, MD [scale of 0 to 20] 4.6, 95% CI 1.6 to 7.6).
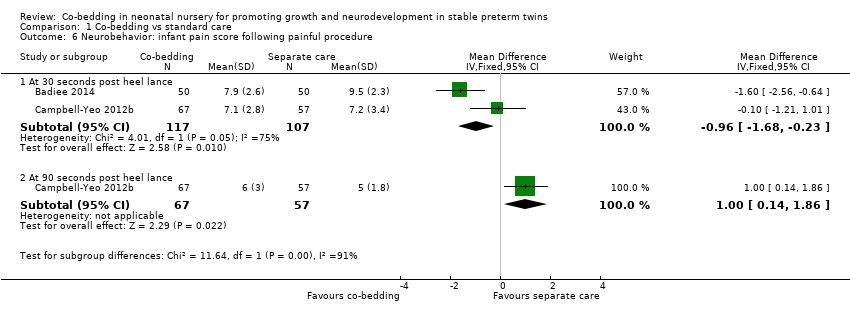
Neurobehavior: infant pain score following painful procedure (Outcome 1.6)
Compared with twins who received separate care, co‐bedded twins had lower mean PIPP score 30 seconds after heel prick (two studies, 117 pairs of twins, MD [scale of 0 to 21] ‐0.96, 95% CI ‐1.68 to ‐0.23, I2 = 75%, low quality of evidence, downgraded two levels for study limitations and inconsistency) but higher mean PIPP score 90 seconds after heel prick (one study, 62 pairs of twins, MD [scale of 0 to 21] 1.00, 95% CI 0.14 to 1.86) (Figure 5).

Forest plot of comparison: 1 Co‐bedding vs separate care, outcome: 1.6 Neurobehavior: infant pain score following painful procedure.
For the outcome of PIPP score 30 seconds after heel prick, the two included studies differed in the direction of their results, with Campbell‐Yeo 2012b showing no difference between the two groups and Badiee 2014 showing marked differences favoring the co‐bedded group. The I2 statistic of 75% confirms substantial heterogeneity between study results.
Although we explored possible causes of the differences in results, we could not identify any plausible explanation in terms of risk of bias, population, nature of the intervention, and outcome measures. Both trials had low risk of bias in most domains, recruited infants of similar gestation and birth weight, and carried out co‐bedding in a similar manner. Both studies evaluated pain using PIPP, a validated pain assessment scale for preterm infants.
The only major difference noted between the two studies was postnatal age of the infants when the study took place. In Campbell‐Yeo 2012b, investigators administered the interventions, which consisted of co‐bedding of twins and heel prick, between 12 and 19 days of life, and Badiee 2014 administered the intervention between days 3 and 4 of life. This difference in timing of the intervention might plausibly explain the heterogeneity on the basis of effects of co‐bedding or infants' response to pain. First, the apparent lack of effectiveness of co‐bedding observed in infants of greater postnatal age, as shown in Campbell‐Yeo 2012b, could be due to the fact that co‐bedding was commenced after a longer period of separation since birth compared with Badiee 2014. Alternatively, infants of greater postnatal age may have developed some form of adaptation to pain following prior exposure to painful procedures, and measures used at this time to alleviate pain, including co‐bedding, might have become less effective than if used earlier. Notably, average PIPP scores in Campbell‐Yeo 2012b were lower than those in Badiee 2014, supporting this postulation. Previous studies have consistently shown that newborn infants who had prior exposure to a greater number of painful procedures and those who stayed longer in the NICU had a dampened pain response (Johnston 1999; Grunau 2001; Grunau 2005; Williams 2009). In Campbell‐Yeo 2012b, the average number of painful procedures in the co‐bedded group and in the control group was 128.5 and 91.3, respectively, and although Badiee 2014 did not report the number of painful procedures that infants had experienced before the start of the study, it was highly unlikely that a similar number of procedures would have been performed by day 3 or 4 of life. Nevertheless, the postulations above regarding the timing of co‐bedding and infants' pain adaptation are hypotheses that await confirmation by future researchers.
After formulating some explanation for possible sources of heterogeneity, we decided to combine the results in a meta‐analysis because the nature of the intervention, namely, co‐bedding, was similar in both studies. If a greater number of studies are included for this outcome in the future, we will further evaluate our hypotheses by performing subgroup analyses based on the postnatal age of infants when the intervention was administered.
Secondary outcomes
Infection (Outcome 1.7)
We found no differences between the two groups in the overall incidence of suspected or proven infection (three studies, 65 pairs of twins, RR 0.84, 95% CI 0.30 to 2.31, very low quality of evidence, downgraded three levels for serious study limitations and imprecision) and in the incidence of specific infection, such as necrotizing enterocolitis, conjunctivitis, and sepsis (Figure 6).

Forest plot of comparison: 1 Co‐bedding vs separate care, outcome: 1.7 Infections.
Length of hospital stay (Outcome 1.8)
Data from Hayward 2007 reveal no differences in length of hospital stay between the two groups (one study, six pairs of twins, MD ‐4.9 days, 95% CI ‐35.23 to 25.43 days, very low quality of evidence, downgraded three levels for serious study limitations and imprecision).
Parental measures, including parental anxiety (Outcome 1.9), parental attachment (Outcome 1.10), and parental satisfaction (Outcome 1.11)
Data from Byers 2003a show no differences in all parental measures, including parental anxiety (one study, 18 pairs of twins, MD as measured by Parental State Anxiety Inventory [0 to 80, with higher score indicating higher anxiety level] 0.9, 95% CI ‐2.13 to 3.93), parental attachment (MD as measured by Maternal Attachment Inventory [0 to 112, with higher score indicating stronger attachment], one study, 18 pairs of twins, MD 0.9, 95% CI ‐2.02 to 3.82), and parental satisfaction (MD as measured by Parental Satisfaction Survey [0 to 55, with higher score indicating higher satisfaction level], one study, 18 pairs of twins, MD ‐0.38, 95% CI ‐4.49 to 3.73, moderate quality of evidence, downgraded one level for study limitations).
Discussion
Summary of main results
In this review, a single study essentially contributed the data for most outcomes, as the included studies reported their outcomes differently. It was not possible to include the data from one study in the analysis. Very limited evidence showed no statistically significant differences between the co‐bedded group and the group receiving separate care in terms of major outcomes, including rate of weight gain, A/B/D episodes, infection, episodes in co‐regulated state, length of hospital stay, and parental perceptions of care. The co‐bedded group appeared to have more crying episodes but seemed to spend more time in quiet sleep. The pain score for this group appeared to be lower 30 seconds after heel prick but slightly higher 90 seconds after heel prick compared with twins who received separate care, although marked heterogeneity in the results of pain score 30 seconds post heel prick precluded a clear conclusion. Overall major uncertainties on the benefits and harms of co‐bedding preterm twins remain (see summary of findings Table for the main comparison for details).
Overall completeness and applicability of evidence
We identified studies that included population, intervention, comparison, and outcomes that matched our pre‐specified selection criteria, especially for our primary outcomes of growth (rate of weight gain), A/B/D episodes, and other major outcomes of infection and parental perceptions of care. However, we found insufficient studies that examined neurodevelopment and other long‐term outcomes. Lack of sufficient evidence on the benefits and harms of co‐bedding, as our review has demonstrated, is reflective of the current state of practice, as co‐bedding, although routinely practiced in some parts of the world, still is not widely practiced in neonatal nurseries worldwide.
Quality of the evidence
Overall low or very low quality of evidence for almost all outcomes assessed due to single‐study contributions to each outcome and small sample sizes gave rise to imprecise estimates, heterogeneity, and limitations in the design of included studies, mainly as the result of non‐blinding of outcome assessors, incomplete outcome data, and possible selective outcome reporting. Six studies addressed our research question but failed to meet the inclusion criteria in terms of study design. Overall, the body of evidence does not allow a clear conclusion to be made regarding the benefits and harms of co‐bedding for stable preterm twins.
Potential biases in the review process
Strengths of this review include a comprehensive search of multiple databases, incorporation of additional study information not provided in published papers but obtained through contact with study authors, adjustments to the unit of analysis in data entry according to our pre‐specified methods, and analysis based on raw data in one study. However, we could not obtain all the relevant data that we set out to obtain because of lack of response by the authors of one study; this could have introduced bias into our review.
Agreements and disagreements with other studies or reviews
One narrative review, which included non‐randomized studies (Tomashek 2007), reported that available studies show that co‐bedding did not improve physiological and/or clinical outcomes over separate care, or show improvements that were considered "not clinically significant." Study authors also commented that the overall quality of evidence was poor and recommended that additional research must be conducted. The findings of this narrative review are consistent with our findings.
Flow diagram of the review process from initial search to final inclusion of studies.
Methodological quality summary: review authors' judgements about each methodological quality item for each included study.

Methodological quality graph: review authors' judgements about each methodological quality item presented as percentages across all included studies.

Forest plot of comparison: 1 Co‐bedding vs separate care, outcome: 1.1 Rate of weight gain (in gram/kg of baseline weight/d).

Forest plot of comparison: 1 Co‐bedding vs separate care, outcome: 1.6 Neurobehavior: infant pain score following painful procedure.
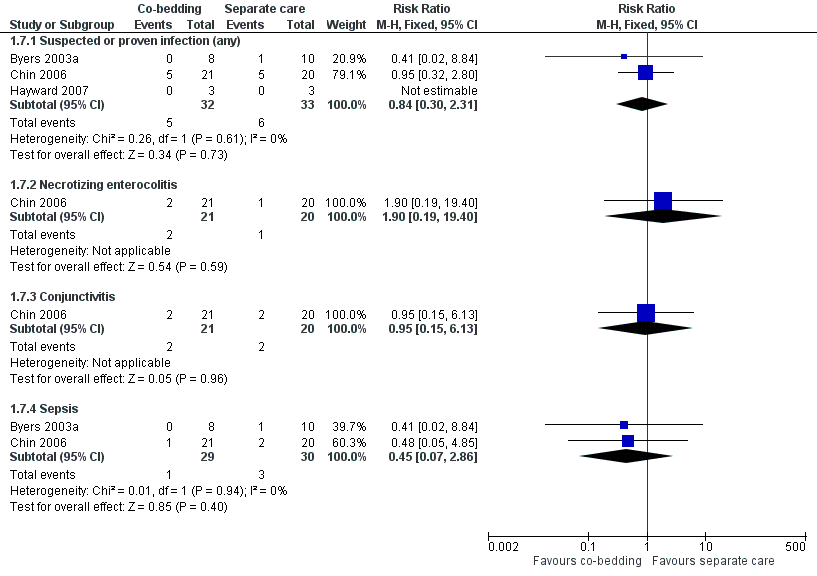
Forest plot of comparison: 1 Co‐bedding vs separate care, outcome: 1.7 Infections.

Comparison 1 Co‐bedding vs standard care, Outcome 1 Rate of weight gain (in gram/kg of baseline weight/d).
Comparison 1 Co‐bedding vs standard care, Outcome 2 Apnea, bradycardia, or desaturation.
Comparison 1 Co‐bedding vs standard care, Outcome 3 Episodes in co‐regulated state (out of 20 observations).

Comparison 1 Co‐bedding vs standard care, Outcome 4 Episodes of crying (out of 20 observations).
Comparison 1 Co‐bedding vs standard care, Outcome 5 Episodes in quiet sleep (out of 20 observations).
Comparison 1 Co‐bedding vs standard care, Outcome 6 Neurobehavior: infant pain score following painful procedure.

Comparison 1 Co‐bedding vs standard care, Outcome 7 Infection.
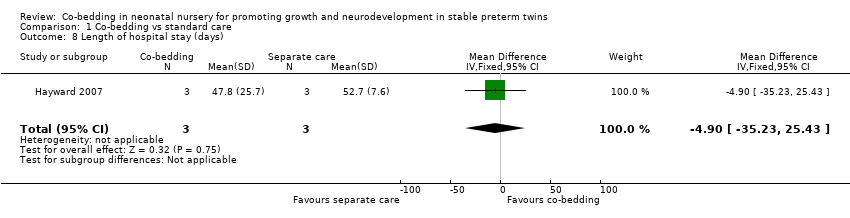
Comparison 1 Co‐bedding vs standard care, Outcome 8 Length of hospital stay (days).

Comparison 1 Co‐bedding vs standard care, Outcome 9 Parental anxiety (Parental State Anxiety Inventory).
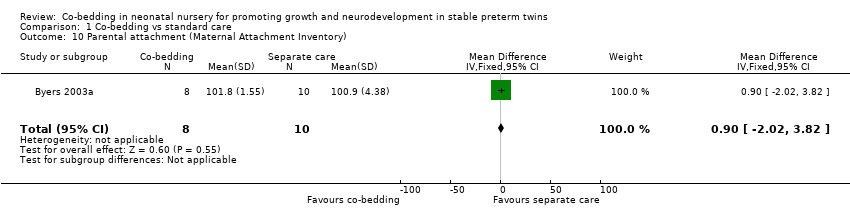
Comparison 1 Co‐bedding vs standard care, Outcome 10 Parental attachment (Maternal Attachment Inventory).

Comparison 1 Co‐bedding vs standard care, Outcome 11 Parental satisfaction.
| Co‐bedding versus separate care for promoting growth and neurodevelopment in stable preterm twins | ||||||
| Patient or population: stable preterm twins with growth and neurodevelopment promoted | ||||||
| Outcomes | Illustrative comparative risks* (95% CI) | Relative effect | Number of participants | Quality of the evidence | Comments | |
| Assumed risk | Corresponding risk | |||||
| Separate care | Co‐bedding | |||||
| Rate of weight gain (in grams/kg of baseline weight/d) ‐ average from study entry to week 3 | Mean rate of weight gain (in grams/kg of baseline weight/d) ‐ average from study entry to week 3 in control groups was | Mean rate of weight gain (in grams/kg of baseline weight/d) ‐ average from study entry to week 3 in intervention groups was | 18 | ⊕⊕⊝⊝ | ||
| Apnea, bradycardia, or desaturation | Study population | RR 0.85 | 124 | ⊕⊕⊝⊝ | ||
| 53 per 1000 | 45 per 1000 | |||||
| Moderate | ||||||
| 53 per 1000 | 45 per 1000 | |||||
| Episodes in co‐regulated state (out of 20 observations) Scale from 0 to 20 | Mean number of episodes in co‐regulated state (out of 20 observations) in control groups was | Mean number of episodes in co‐regulated state (out of 20 observations) in intervention groups was | 6 | ⊕⊝⊝⊝ | ||
| Infections ‐ suspected or proven infections (any) | Study population | RR 0.84 | 65 | ⊕⊝⊝⊝ | ||
| 182 per 1000 | 153 per 1000 | |||||
| Moderate | ||||||
| 100 per 1000 | 84 per 1000 | |||||
| Length of hospital stay (days) | Mean length of hospital stay (days) in control groups was | Mean length of hospital stay (days) in intervention groups was | 6 | ⊕⊝⊝⊝ | ||
| Parental satisfaction Scale from 0 to 55 | Mean parental satisfaction in control groups was | Mean parental satisfaction in intervention groups was | 18 | ⊕⊕⊕⊝ | ||
| Neurobehavior: infant pain score following painful procedure ‐ at 30 seconds post heel lance Scale from 0 to 21 | Mean neurobehavior: infant pain score after painful procedure ‐ at 30 seconds post heel lance in control groups was | Mean neurobehavior: infant pain score after painful procedure ‐ at 30 seconds post heel lance in intervention groups was | 224 | ⊕⊕⊝⊝ | ||
| *The basis for the assumed risk (e.g. median control group risk across studies) is provided in footnotes. The corresponding risk (and its 95% confidence interval) is based on the assumed risk in the comparison group and the relative effect of the intervention (and its 95% CI) | ||||||
| GRADE Working Group grades of evidence | ||||||
| aDowngraded 1 level for study limitations (owing to unclear method of sequence generation, non‐blinding, and presence of selective outcome reporting) fDowngraded 1 level for study limitations (owing to non‐blinding of care personnel and outcome assessors) | ||||||
| Study ID | Outcomes listed in the methods | Additional key outcomes relevant to the study | Actual outcomes reported |
|
| This study assessed specifically physiological measures in the short term. Growth parameters were reported, but as "mean daily weight," which was not suitable for meta‐analysis. Additionally, physiological measures were reported in the form of average figures, such as average "highest activity heart rate," not as episodes of apnea, bradycardia, or desaturation, which are more clinically relevant |
| |
|
| This study assessed specifically infants' response to pain; growth‐related outcomes such as weight gain and length of hospital stay were not included in the outcomes. The only outcome that was relevant to this review was the pain response, which we considered as a form of neurobehavior |
| |
|
|
|
| |
|
|
|
(Study authors stated, "Data were insufficient to analyse parental self‐efficacy and parental stress" ‐ Results, paragraph 1, lines 1 to 3) | |
| No outcome was listed in the methods. However, the following 3 major outcomes were stated in the purpose and hypothesis section
|
|
| |
|
| Like Campbell‐Yeo 2012b, this study assessed specifically infant response to pain; growth‐related outcomes were not assessed | The only outcome included in this review is PIPP score |
| Study ID | Study period | Median combined A/B/D episodes | P value | |
| Co‐bedded group | Control group | |||
| Week 1 | 4.5 | 7 | 0.2 | |
| Week 2 | 6 | 12 | 0.8 | |
| Week 3 | 2.5 | 8 | 0.4 | |
| Outcome or subgroup title | No. of studies | No. of participants | Statistical method | Effect size |
| 1 Rate of weight gain (in gram/kg of baseline weight/d) Show forest plot | 1 | Mean Difference (IV, Fixed, 95% CI) | Subtotals only | |
| 1.1 From study entry to week 1 | 1 | 38 | Mean Difference (IV, Fixed, 95% CI) | 4.0 [‐0.96, 8.96] |
| 1.2 From week 1 to week 2 | 1 | 28 | Mean Difference (IV, Fixed, 95% CI) | 1.40 [‐2.27, 5.07] |
| 1.3 From week 2 to week 3 | 1 | 18 | Mean Difference (IV, Fixed, 95% CI) | ‐2.10 [‐4.33, 0.13] |
| 1.4 Average from study entry to week 3 | 1 | 18 | Mean Difference (IV, Fixed, 95% CI) | 0.20 [‐1.60, 2.00] |
| 2 Apnea, bradycardia, or desaturation Show forest plot | 1 | 124 | Risk Ratio (M‐H, Fixed, 95% CI) | 0.85 [0.18, 4.05] |
| 3 Episodes in co‐regulated state (out of 20 observations) Show forest plot | 1 | 6 | Mean Difference (IV, Fixed, 95% CI) | 0.96 [‐3.44, 5.36] |
| 4 Episodes of crying (out of 20 observations) Show forest plot | 1 | 6 | Mean Difference (IV, Fixed, 95% CI) | 4.43 [1.72, 7.14] |
| 5 Episodes in quiet sleep (out of 20 observations) Show forest plot | 1 | 6 | Mean Difference (IV, Fixed, 95% CI) | 4.58 [1.58, 7.58] |
| 6 Neurobehavior: infant pain score following painful procedure Show forest plot | 2 | Mean Difference (IV, Fixed, 95% CI) | Subtotals only | |
| 6.1 At 30 seconds post heel lance | 2 | 224 | Mean Difference (IV, Fixed, 95% CI) | ‐0.96 [‐1.68, ‐0.23] |
| 6.2 At 90 seconds post heel lance | 1 | 124 | Mean Difference (IV, Fixed, 95% CI) | 1.0 [0.14, 1.86] |
| 7 Infection Show forest plot | 3 | Risk Ratio (M‐H, Fixed, 95% CI) | Subtotals only | |
| 7.1 Suspected or proven infection (any) | 3 | 65 | Risk Ratio (M‐H, Fixed, 95% CI) | 0.84 [0.30, 2.31] |
| 7.2 Necrotizing enterocolitis | 1 | 41 | Risk Ratio (M‐H, Fixed, 95% CI) | 1.90 [0.19, 19.40] |
| 7.3 Conjunctivitis | 1 | 41 | Risk Ratio (M‐H, Fixed, 95% CI) | 0.95 [0.15, 6.13] |
| 7.4 Sepsis | 2 | 59 | Risk Ratio (M‐H, Fixed, 95% CI) | 0.45 [0.07, 2.86] |
| 8 Length of hospital stay (days) Show forest plot | 1 | 6 | Mean Difference (IV, Fixed, 95% CI) | ‐4.90 [‐35.23, 25.43] |
| 9 Parental anxiety (Parental State Anxiety Inventory) Show forest plot | 1 | 18 | Mean Difference (IV, Fixed, 95% CI) | 0.90 [‐2.13, 3.93] |
| 10 Parental attachment (Maternal Attachment Inventory) Show forest plot | 1 | 18 | Mean Difference (IV, Fixed, 95% CI) | 0.90 [‐2.02, 3.82] |
| 11 Parental satisfaction Show forest plot | 1 | 18 | Mean Difference (IV, Fixed, 95% CI) | ‐0.38 [‐4.49, 3.73] |