| 1 Rate of weight gain (in gram/kg of baseline weight/d) Show forest plot | 1 | | Mean Difference (IV, Fixed, 95% CI) | Subtotals only |
|
| 1.1 From study entry to week 1 | 1 | 38 | Mean Difference (IV, Fixed, 95% CI) | 4.0 [‐0.96, 8.96] |
| 1.2 From week 1 to week 2 | 1 | 28 | Mean Difference (IV, Fixed, 95% CI) | 1.40 [‐2.27, 5.07] |
| 1.3 From week 2 to week 3 | 1 | 18 | Mean Difference (IV, Fixed, 95% CI) | ‐2.10 [‐4.33, 0.13] |
| 1.4 Average from study entry to week 3 | 1 | 18 | Mean Difference (IV, Fixed, 95% CI) | 0.20 [‐1.60, 2.00] |
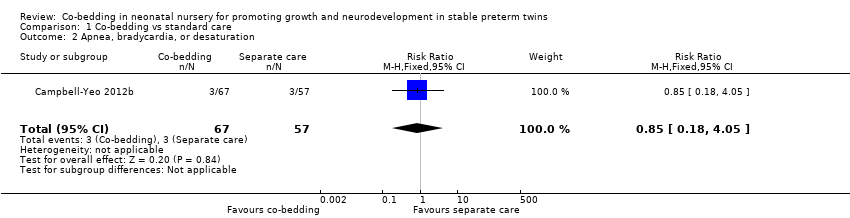
| 2 Apnea, bradycardia, or desaturation Show forest plot | 1 | 124 | Risk Ratio (M‐H, Fixed, 95% CI) | 0.85 [0.18, 4.05] |
|
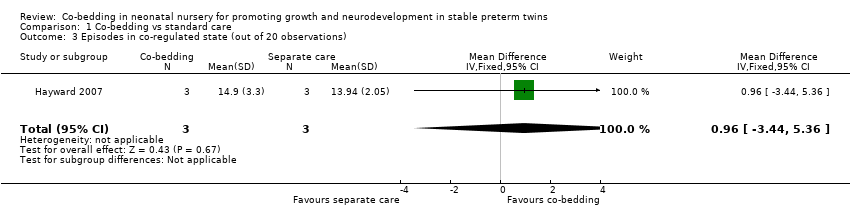
| 3 Episodes in co‐regulated state (out of 20 observations) Show forest plot | 1 | 6 | Mean Difference (IV, Fixed, 95% CI) | 0.96 [‐3.44, 5.36] |
|
| 4 Episodes of crying (out of 20 observations) Show forest plot | 1 | 6 | Mean Difference (IV, Fixed, 95% CI) | 4.43 [1.72, 7.14] |
|
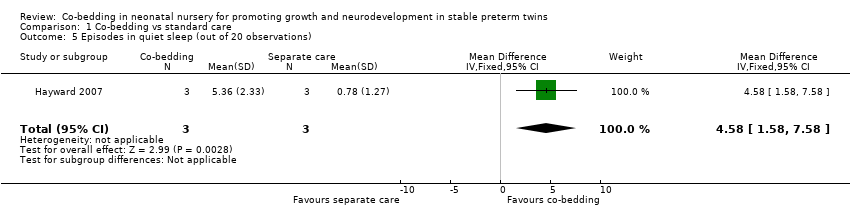
| 5 Episodes in quiet sleep (out of 20 observations) Show forest plot | 1 | 6 | Mean Difference (IV, Fixed, 95% CI) | 4.58 [1.58, 7.58] |
|
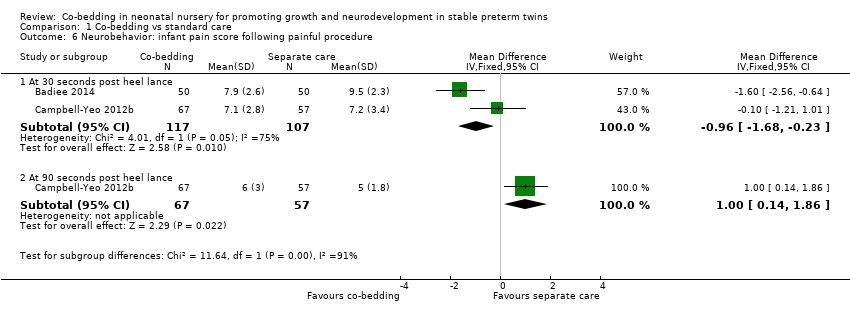
| 6 Neurobehavior: infant pain score following painful procedure Show forest plot | 2 | | Mean Difference (IV, Fixed, 95% CI) | Subtotals only |
|
| 6.1 At 30 seconds post heel lance | 2 | 224 | Mean Difference (IV, Fixed, 95% CI) | ‐0.96 [‐1.68, ‐0.23] |
| 6.2 At 90 seconds post heel lance | 1 | 124 | Mean Difference (IV, Fixed, 95% CI) | 1.0 [0.14, 1.86] |
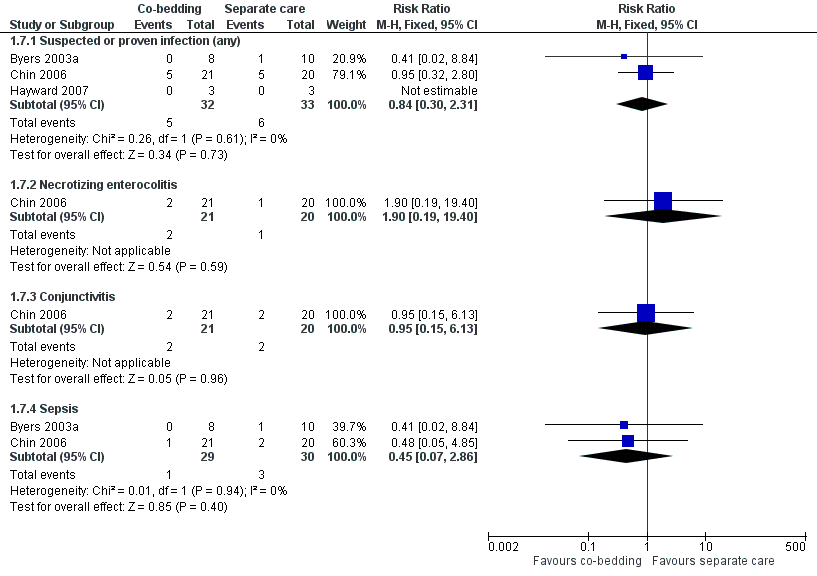
| 7 Infection Show forest plot | 3 | | Risk Ratio (M‐H, Fixed, 95% CI) | Subtotals only |
|
| 7.1 Suspected or proven infection (any) | 3 | 65 | Risk Ratio (M‐H, Fixed, 95% CI) | 0.84 [0.30, 2.31] |
| 7.2 Necrotizing enterocolitis | 1 | 41 | Risk Ratio (M‐H, Fixed, 95% CI) | 1.90 [0.19, 19.40] |
| 7.3 Conjunctivitis | 1 | 41 | Risk Ratio (M‐H, Fixed, 95% CI) | 0.95 [0.15, 6.13] |
| 7.4 Sepsis | 2 | 59 | Risk Ratio (M‐H, Fixed, 95% CI) | 0.45 [0.07, 2.86] |
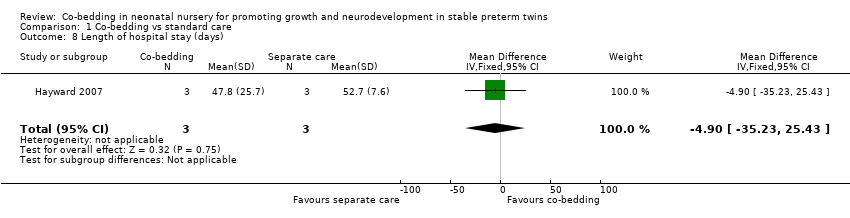
| 8 Length of hospital stay (days) Show forest plot | 1 | 6 | Mean Difference (IV, Fixed, 95% CI) | ‐4.90 [‐35.23, 25.43] |
|
| 9 Parental anxiety (Parental State Anxiety Inventory) Show forest plot | 1 | 18 | Mean Difference (IV, Fixed, 95% CI) | 0.90 [‐2.13, 3.93] |
|
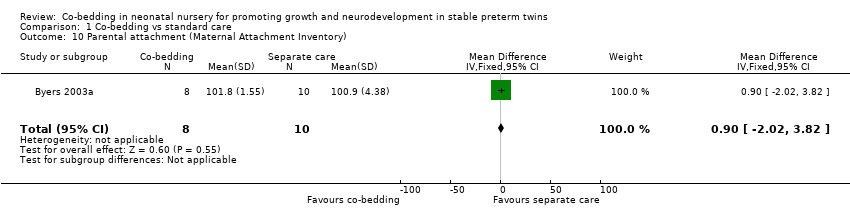
| 10 Parental attachment (Maternal Attachment Inventory) Show forest plot | 1 | 18 | Mean Difference (IV, Fixed, 95% CI) | 0.90 [‐2.02, 3.82] |
|
| 11 Parental satisfaction Show forest plot | 1 | 18 | Mean Difference (IV, Fixed, 95% CI) | ‐0.38 [‐4.49, 3.73] |
|