Cama de compañía en la unidad neonatal para la promoción del crecimiento y el desarrollo neurológico en gemelos prematuros estables
Information
- DOI:
- https://doi.org/10.1002/14651858.CD008313.pub3Copy DOI

- Database:
-
- Cochrane Database of Systematic Reviews
- Version published:
-
- 14 April 2016see what's new
- Type:
-
- Intervention
- Stage:
-
- Review
- Cochrane Editorial Group:
-
Cochrane Neonatal Group
- Copyright:
-
- Copyright © 2017 The Cochrane Collaboration. Published by John Wiley & Sons, Ltd.
Article metrics
Altmetric:
Cited by:
Authors
Contributions of authors
NML, SCF, WCF, and KT drafted the protocol.
NML, SCF, and WCF performed the search and identified relevant articles.
NML and SCF acquired full texts for articles identified to be potentially suitable.
NML and SCF independently assessed the eligibility of identified articles.
NML, SCF, WCF, and KT wrote the description of studies, the results, the discussion, and the conclusions.
NML wrote the abstract.
NML and SCF wrote the plain language summary.
All review authors approved the final draft.
NML updated the review with edits from the other review authors.
Sources of support
Internal sources
-
No sources of support supplied
External sources
-
SEA‐ORCHID (South East Asian Optimising Reproductive and Child Health Outcomes for Developing Countries) Project, Malaysia.
A five‐year (2003‐2008) project, funded by the National Medical Research Council of Australia and Wellcome Trust, and supported by the Cochrane Australasian Centre, involving four South East Asian countries (Indonesia, Malaysia, Philippines, and Thailand) aiming to promote the synthesis and use of high‐level clinical evidence particularly for topics in maternal and child health that are relevant to this part of the world
-
Eunice Kennedy Shriver National Institute of Child Health and Human Development National Institutes of Health, Department of Health and Human Services, USA.
The Cochrane Neonatal Review Group has been funded in part with Federal funds from the Eunice Kennedy Shriver National Institute of Child Health and Human Development National Institutes of Health, Department of Health and Human Services, USA, under Contract No. HHSN267200603418C
-
National Institute for Health Research, UK.
Editorial support for Cochrane Neonatal has been funded with funds from a UK National Institute of Health Research Grant (NIHR) Cochrane Programme Grant (13/89/12). The views expressed in this publication are those of the authors and not necessarily those of the NHS, the NIHR, or the UK Department of Health.
Declarations of interest
None declared by the review authors.
Acknowledgements
We thank Drs. Roger Soll, John Sinclair, Jeffrey Horbar, G Suresh, and Michael Bracken for their comments on the draft protocol and draft review. We thank Ms. Diane Haugthon, Managing Editor, and Ms. Yolanda Montage, Trials Search Co‐ordinator of the Neonatal Review Group, for their assistance with tasks leading to publication of this review.
We are also grateful to the lead authors of our included studies ‐ Susan DiNonno Chin and Kathryn Hayward ‐ for generously providing additional information about their studies upon receipt of our requests.
Version history
| Published | Title | Stage | Authors | Version |
| 2016 Apr 14 | Co‐bedding in neonatal nursery for promoting growth and neurodevelopment in stable preterm twins | Review | Nai Ming Lai, Siew Cheng Foong, Wai Cheng Foong, Kenneth Tan | |
| 2012 Dec 12 | Co‐bedding in neonatal nursery for promoting growth and neurodevelopment in stable preterm twins | Review | Nai Ming Lai, Siew Cheng Foong, Wai Cheng Foong, Kenneth Tan | |
| 2010 Jan 20 | Co‐bedding in neonatal nursery for promoting growth and neurodevelopment in stable preterm twins | Protocol | Nai Ming Lai, Siew Cheng Foong, Wai Cheng Foong, Kenneth Tan | |
Differences between protocol and review
We revised the following outcomes after receiving feedback from the external referee on our draft review.
-
Primary outcome: neurobehavior ‐ we have added "infant co‐regulation" and "stress response" to our statement.
-
Secondary outcome: adverse effects ‐ we have added "and other patient safety‐related outcomes as defined by the individual studies."
-
A new outcome added: secondary outcome: incidence of co‐bedding post discharge .
Keywords
MeSH
Medical Subject Headings (MeSH) Keywords
Medical Subject Headings Check Words
Humans; Infant, Newborn;
PICOs
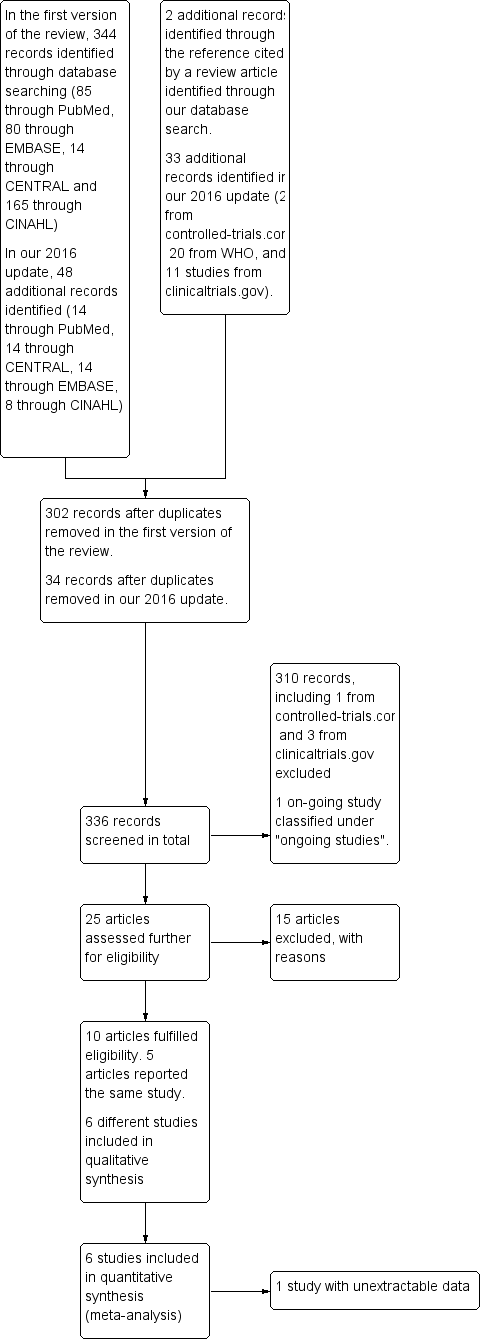
Flow diagram of the review process from initial search to final inclusion of studies.
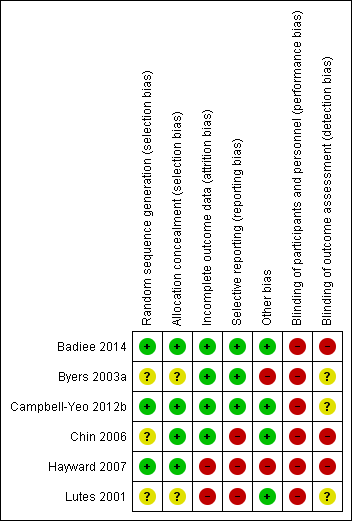
Methodological quality summary: review authors' judgements about each methodological quality item for each included study.
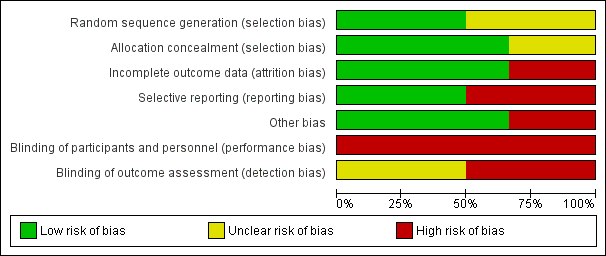
Methodological quality graph: review authors' judgements about each methodological quality item presented as percentages across all included studies.

Forest plot of comparison: 1 Co‐bedding vs separate care, outcome: 1.1 Rate of weight gain (in gram/kg of baseline weight/d).

Forest plot of comparison: 1 Co‐bedding vs separate care, outcome: 1.6 Neurobehavior: infant pain score following painful procedure.
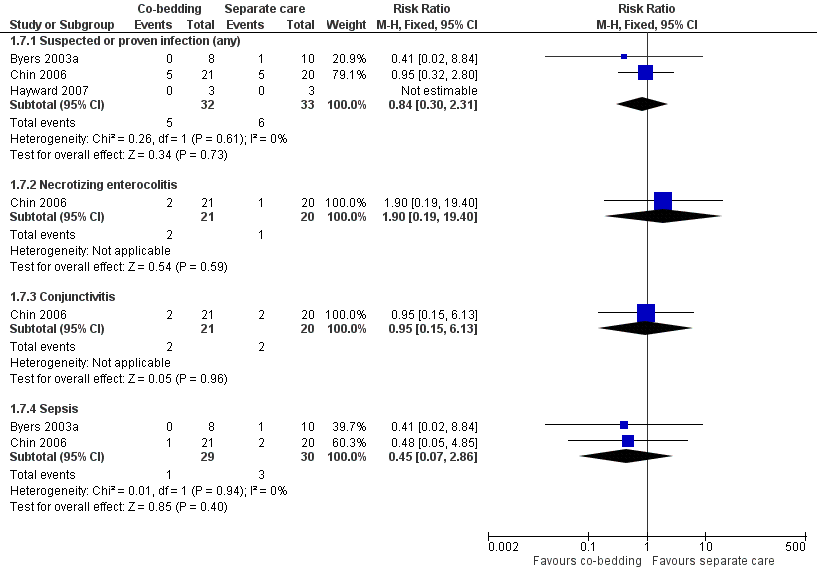
Forest plot of comparison: 1 Co‐bedding vs separate care, outcome: 1.7 Infections.

Comparison 1 Co‐bedding vs standard care, Outcome 1 Rate of weight gain (in gram/kg of baseline weight/d).

Comparison 1 Co‐bedding vs standard care, Outcome 2 Apnea, bradycardia, or desaturation.

Comparison 1 Co‐bedding vs standard care, Outcome 3 Episodes in co‐regulated state (out of 20 observations).

Comparison 1 Co‐bedding vs standard care, Outcome 4 Episodes of crying (out of 20 observations).

Comparison 1 Co‐bedding vs standard care, Outcome 5 Episodes in quiet sleep (out of 20 observations).

Comparison 1 Co‐bedding vs standard care, Outcome 6 Neurobehavior: infant pain score following painful procedure.

Comparison 1 Co‐bedding vs standard care, Outcome 7 Infection.

Comparison 1 Co‐bedding vs standard care, Outcome 8 Length of hospital stay (days).

Comparison 1 Co‐bedding vs standard care, Outcome 9 Parental anxiety (Parental State Anxiety Inventory).

Comparison 1 Co‐bedding vs standard care, Outcome 10 Parental attachment (Maternal Attachment Inventory).

Comparison 1 Co‐bedding vs standard care, Outcome 11 Parental satisfaction.
| Co‐bedding versus separate care for promoting growth and neurodevelopment in stable preterm twins | ||||||
| Patient or population: stable preterm twins with growth and neurodevelopment promoted | ||||||
| Outcomes | Illustrative comparative risks* (95% CI) | Relative effect | Number of participants | Quality of the evidence | Comments | |
| Assumed risk | Corresponding risk | |||||
| Separate care | Co‐bedding | |||||
| Rate of weight gain (in grams/kg of baseline weight/d) ‐ average from study entry to week 3 | Mean rate of weight gain (in grams/kg of baseline weight/d) ‐ average from study entry to week 3 in control groups was | Mean rate of weight gain (in grams/kg of baseline weight/d) ‐ average from study entry to week 3 in intervention groups was | 18 | ⊕⊕⊝⊝ | ||
| Apnea, bradycardia, or desaturation | Study population | RR 0.85 | 124 | ⊕⊕⊝⊝ | ||
| 53 per 1000 | 45 per 1000 | |||||
| Moderate | ||||||
| 53 per 1000 | 45 per 1000 | |||||
| Episodes in co‐regulated state (out of 20 observations) Scale from 0 to 20 | Mean number of episodes in co‐regulated state (out of 20 observations) in control groups was | Mean number of episodes in co‐regulated state (out of 20 observations) in intervention groups was | 6 | ⊕⊝⊝⊝ | ||
| Infections ‐ suspected or proven infections (any) | Study population | RR 0.84 | 65 | ⊕⊝⊝⊝ | ||
| 182 per 1000 | 153 per 1000 | |||||
| Moderate | ||||||
| 100 per 1000 | 84 per 1000 | |||||
| Length of hospital stay (days) | Mean length of hospital stay (days) in control groups was | Mean length of hospital stay (days) in intervention groups was | 6 | ⊕⊝⊝⊝ | ||
| Parental satisfaction Scale from 0 to 55 | Mean parental satisfaction in control groups was | Mean parental satisfaction in intervention groups was | 18 | ⊕⊕⊕⊝ | ||
| Neurobehavior: infant pain score following painful procedure ‐ at 30 seconds post heel lance Scale from 0 to 21 | Mean neurobehavior: infant pain score after painful procedure ‐ at 30 seconds post heel lance in control groups was | Mean neurobehavior: infant pain score after painful procedure ‐ at 30 seconds post heel lance in intervention groups was | 224 | ⊕⊕⊝⊝ | ||
| *The basis for the assumed risk (e.g. median control group risk across studies) is provided in footnotes. The corresponding risk (and its 95% confidence interval) is based on the assumed risk in the comparison group and the relative effect of the intervention (and its 95% CI) | ||||||
| GRADE Working Group grades of evidence | ||||||
| aDowngraded 1 level for study limitations (owing to unclear method of sequence generation, non‐blinding, and presence of selective outcome reporting) fDowngraded 1 level for study limitations (owing to non‐blinding of care personnel and outcome assessors) | ||||||
| Study ID | Outcomes listed in the methods | Additional key outcomes relevant to the study | Actual outcomes reported |
|
| This study assessed specifically physiological measures in the short term. Growth parameters were reported, but as "mean daily weight," which was not suitable for meta‐analysis. Additionally, physiological measures were reported in the form of average figures, such as average "highest activity heart rate," not as episodes of apnea, bradycardia, or desaturation, which are more clinically relevant |
| |
|
| This study assessed specifically infants' response to pain; growth‐related outcomes such as weight gain and length of hospital stay were not included in the outcomes. The only outcome that was relevant to this review was the pain response, which we considered as a form of neurobehavior |
| |
|
|
|
| |
|
|
|
(Study authors stated, "Data were insufficient to analyse parental self‐efficacy and parental stress" ‐ Results, paragraph 1, lines 1 to 3) | |
| No outcome was listed in the methods. However, the following 3 major outcomes were stated in the purpose and hypothesis section
|
|
| |
|
| Like Campbell‐Yeo 2012b, this study assessed specifically infant response to pain; growth‐related outcomes were not assessed | The only outcome included in this review is PIPP score |
| Study ID | Study period | Median combined A/B/D episodes | P value | |
| Co‐bedded group | Control group | |||
| Week 1 | 4.5 | 7 | 0.2 | |
| Week 2 | 6 | 12 | 0.8 | |
| Week 3 | 2.5 | 8 | 0.4 | |
| Outcome or subgroup title | No. of studies | No. of participants | Statistical method | Effect size |
| 1 Rate of weight gain (in gram/kg of baseline weight/d) Show forest plot | 1 | Mean Difference (IV, Fixed, 95% CI) | Subtotals only | |
| 1.1 From study entry to week 1 | 1 | 38 | Mean Difference (IV, Fixed, 95% CI) | 4.0 [‐0.96, 8.96] |
| 1.2 From week 1 to week 2 | 1 | 28 | Mean Difference (IV, Fixed, 95% CI) | 1.40 [‐2.27, 5.07] |
| 1.3 From week 2 to week 3 | 1 | 18 | Mean Difference (IV, Fixed, 95% CI) | ‐2.10 [‐4.33, 0.13] |
| 1.4 Average from study entry to week 3 | 1 | 18 | Mean Difference (IV, Fixed, 95% CI) | 0.20 [‐1.60, 2.00] |
| 2 Apnea, bradycardia, or desaturation Show forest plot | 1 | 124 | Risk Ratio (M‐H, Fixed, 95% CI) | 0.85 [0.18, 4.05] |
| 3 Episodes in co‐regulated state (out of 20 observations) Show forest plot | 1 | 6 | Mean Difference (IV, Fixed, 95% CI) | 0.96 [‐3.44, 5.36] |
| 4 Episodes of crying (out of 20 observations) Show forest plot | 1 | 6 | Mean Difference (IV, Fixed, 95% CI) | 4.43 [1.72, 7.14] |
| 5 Episodes in quiet sleep (out of 20 observations) Show forest plot | 1 | 6 | Mean Difference (IV, Fixed, 95% CI) | 4.58 [1.58, 7.58] |
| 6 Neurobehavior: infant pain score following painful procedure Show forest plot | 2 | Mean Difference (IV, Fixed, 95% CI) | Subtotals only | |
| 6.1 At 30 seconds post heel lance | 2 | 224 | Mean Difference (IV, Fixed, 95% CI) | ‐0.96 [‐1.68, ‐0.23] |
| 6.2 At 90 seconds post heel lance | 1 | 124 | Mean Difference (IV, Fixed, 95% CI) | 1.0 [0.14, 1.86] |
| 7 Infection Show forest plot | 3 | Risk Ratio (M‐H, Fixed, 95% CI) | Subtotals only | |
| 7.1 Suspected or proven infection (any) | 3 | 65 | Risk Ratio (M‐H, Fixed, 95% CI) | 0.84 [0.30, 2.31] |
| 7.2 Necrotizing enterocolitis | 1 | 41 | Risk Ratio (M‐H, Fixed, 95% CI) | 1.90 [0.19, 19.40] |
| 7.3 Conjunctivitis | 1 | 41 | Risk Ratio (M‐H, Fixed, 95% CI) | 0.95 [0.15, 6.13] |
| 7.4 Sepsis | 2 | 59 | Risk Ratio (M‐H, Fixed, 95% CI) | 0.45 [0.07, 2.86] |
| 8 Length of hospital stay (days) Show forest plot | 1 | 6 | Mean Difference (IV, Fixed, 95% CI) | ‐4.90 [‐35.23, 25.43] |
| 9 Parental anxiety (Parental State Anxiety Inventory) Show forest plot | 1 | 18 | Mean Difference (IV, Fixed, 95% CI) | 0.90 [‐2.13, 3.93] |
| 10 Parental attachment (Maternal Attachment Inventory) Show forest plot | 1 | 18 | Mean Difference (IV, Fixed, 95% CI) | 0.90 [‐2.02, 3.82] |
| 11 Parental satisfaction Show forest plot | 1 | 18 | Mean Difference (IV, Fixed, 95% CI) | ‐0.38 [‐4.49, 3.73] |