Anestesia raquídea‐epidural combinada versus anestesia raquídea para la cesárea
Resumen
Antecedentes
La anestesia raquídea de una sola aplicación (RSA) y la anestesia raquídea‐epidural combinada (REC) se utilizan con frecuencia durante la cesárea. La técnica de la anestesia raquídea es sencilla y la aparición del bloqueo nervioso es rápida, lo que puede asociarse con hipotensión. La anestesia REC permite un inicio más gradual y también la prolongación de la anestesia mediante el uso de un catéter.
Objetivos
Comparar la efectividad y los efectos adversos de la anestesia REC con la anestesia raquídea de una sola aplicación para la cesárea.
Métodos de búsqueda
Se realizaron búsquedas en el registro de ensayos del Grupo Cochrane de Embarazo y Parto (Cochrane Pregnancy and Childbirth Group), ClinicalTrials.gov, la WHO International Clinical Trials Registry Platform (ICTRP), y en las listas de referencias de los estudios recuperados (fecha de búsqueda: 8 de agosto de 2019).
Criterios de selección
Se consideraron todos los ensayos controlados aleatorios (ECA) publicados que incluyeron una comparación de la anestesia REC con la anestesia raquídea de una sola aplicación para la cesárea. Además, la anestesia raquídea se subagrupó como dosis alta (10 o más mg de bupivacaína) o dosis baja (menos de 10 mg de bupivacaína).
Obtención y análisis de los datos
Dos autores de la revisión evaluaron de forma independiente los ensayos para la inclusión y los riesgos de sesgo, extrajeron los datos y verificaron su exactitud. Se utilizaron los procedimientos metodológicos estándar previstos por Cochrane.
Resultados principales
Se identificaron 18 ensayos con 1272 mujeres, pero casi todas las comparaciones de los resultados individuales incluyeron un número relativamente pequeño de mujeres. Dos ensayos no informaron sobre los resultados de esta revisión y, por lo tanto, no proporcionaron datos. Los ensayos se realizaron en hospitales nacionales o universitarios de Australia (uno), Croacia (uno), India (uno), Italia (uno), Singapur (tres), Corea del Sur (cuatro), España (uno), Suecia (uno), Turquía (dos), Reino Unido (uno), Estados Unidos (dos). En general, los ensayos presentaron un riesgo de sesgo moderado.
Anestesia REC versus raquídea en dosis altas
Puede haber poca o ninguna diferencia entre los grupos de REC y de dosis altas en cuanto al número de mujeres que necesitaron bloqueo regional repetido o anestesia general debido al fracaso para establecer un bloqueo inicial adecuado (cociente de riesgos [CR] 0,32; intervalo de confianza [IC] del 95%: 0,05 a 1,97; siete estudios, 341 mujeres; evidencia de calidad baja). No se sabe si la REC o la anestesia raquídea tienen alguna diferencia en cuanto al número de mujeres que necesitan analgesia intraoperatoria complementaria en cualquier momento después de la REC o de la inserción de la anestesia raquídea (CR promedio 1,25; IC del 95%: 0,19 a 8,43; siete estudios; 390 mujeres; evidencia de calidad muy baja) o en cuanto al número de mujeres que requieren conversión intraoperatoria a anestesia general (CR 1,00; IC del 95%: 0,07 a 14,95; siete estudios; 388 mujeres; evidencia de calidad muy baja). También se desconocen los resultados del número de mujeres que estuvieron satisfechas con la anestesia, independientemente de si recibieron REC o dosis altas de raquídea (CR 0,93; IC del 95%: 0,73 a 1,19; dos estudios, 72 mujeres; evidencia de calidad muy baja). Una cantidad mayor de pacientes en el grupo con REC (13/21) experimentó náuseas o vómitos intraoperatorios que requirieron tratamiento, en relación con el grupo de anestesia raquídea de dosis alta (6/21). Hubo 11 casos de cefalea posterior a la punción dural (5/56 con REC versus 6/57 con RSA; tres ensayos, 113 mujeres), sin diferencias claras entre los grupos. Tampoco hubo diferencias claras en cuanto a la hipotensión intraoperatoria que requirió tratamiento (46/86 con REC versus 41/76 con RSA; cuatro ensayos, 162 mujeres). Ningún recién nacido tuvo una puntuación de Apgar menor de 7 a los cinco minutos (cuatro ensayos, 182 recién nacidos).
Anestesia REC versus raquídea en dosis bajas
Puede haber poca o ninguna diferencia entre el grupo REC y el grupo raquídea en dosis bajas en cuanto al número de mujeres que necesitaron bloqueo regional repetido o anestesia general debido al fracaso para establecer un bloqueo inicial adecuado (CR 4,81; IC del 95%: 0,24 a 97,90; tres estudios, 224 mujeres; evidencia de calidad baja). De manera similar, probablemente hay poca diferencia en cuanto al número de mujeres que requirieron analgesia intraoperatoria complementaria en cualquier momento después de la REC o de la inserción de la anestesia raquídea en dosis bajas (CR 1,75; IC del 95%: 0,78 a 3,92; cuatro estudios, 298 mujeres; evidencia de calidad moderada). No se conoce con certeza el efecto de la anestesia REC o raquídea en dosis bajas sobre la necesidad de conversión intraoperatoria a anestesia general, debido a que ninguna de las 222 mujeres de los tres ensayos lo requirió (evidencia de baja calidad). Ninguno de los estudios examinó si las mujeres estaban satisfechas con la anestesia.
El tiempo medio hasta la anestesia efectiva fue menor en las mujeres que recibieron dosis bajas de anestesia raquídea en comparación con REC, aunque es poco probable que la magnitud de esta diferencia sea clínicamente significativa (diferencia de medias estandarizada [DME] 0,85 minutos; IC del 95%: 0,52 a 1,18 minutos; dos estudios, 160 mujeres).
La REC pareció reducir la incidencia de hipotensión intraoperatoria que requirió tratamiento en comparación con la dosis baja de raquídea (CR promedio 0,59; IC del 95%: 0,38 a 0,93; cuatro estudios, 336 mujeres). Un número similar de mujeres entre el grupo con REC y el grupo con dosis bajas de raquídea presentaron náuseas o vómitos intraoperatorios que requirieron tratamiento (3/50 con REC versus 6/50 con REC; un estudio, 100 mujeres), y no hubo casos de cefalea posterior a la punción dural (un estudio, 138 mujeres). Ninguno de los recién nacidos en los grupos tuvo una puntuación de Apgar menor de 7 a los cinco minutos (un estudio, 60 recién nacidos).
Conclusiones de los autores
En esta revisión el número de estudios y de participantes de la mayoría de los análisis fue pequeño; además, algunos de los ensayos incluidos tuvieron limitaciones en el diseño. Hubo algunas indicaciones de que, en comparación con la anestesia raquídea, la REC podría asociarse con una reducción del número de mujeres con hipotensión intraoperatoria, pero también con un aumento de las náuseas y los vómitos intraoperatorios que requirieron tratamiento. Un estudio pequeño encontró que las dosis bajas de anestesia raquídea dieron lugar a un tiempo menor para la anestesia efectiva, en comparación con la REC. Sin embargo, estos resultados se basan en datos limitados y es poco probable que la diferencia sea clínicamente significativa. En consecuencia, actualmente no hay evidencia suficiente para apoyar una técnica sobre la otra y se necesita más evidencia para evaluar la efectividad y la seguridad relativas de la anestesia REC y la raquídea para la cesárea.
Se necesitan más estudios de alta calidad y con suficiente poder estadístico en esta área. Dichos estudios podrían considerar la utilización de los resultados enumerados en esta revisión y también deberían considerar el informe de los aspectos económicos de los diferentes métodos bajo investigación.
PICO
Resumen en términos sencillos
Anestesia raquídea‐epidural combinada versus anestesia raquídea para la cesárea
¿Cuál es el problema?
El bloqueo nervioso regional es un tipo de anestesia que las mujeres pueden recibir cuando se les realiza una cesárea. Se utilizan dos métodos diferentes. Una sola aplicación de anestesia raquídea implica una sola inyección de anestésico en la parte inferior de la columna vertebral. El bloqueo raquídeo y epidural combinado implica el uso de una aguja más grande y la inserción de un pequeño catéter en la parte inferior de la columna vertebral. Esta revisión examina los efectos beneficiosos y los riesgos relativos de estos dos métodos de bloqueo regional para las mujeres a las que se les realiza una cesárea y para sus recién nacidos.
¿Por qué es esto importante?
La anestesia raquídea con una sola aplicación para la cesárea es relativamente fácil de realizar y funciona rápidamente. Al implicar una sola inyección, la duración del bloqueo no se puede prolongar sin que la mujer reciba otra inyección raquídea. El inicio rápido del bloqueo puede causar efectos adversos como presión arterial baja (hipotensión) y náuseas y vómitos. Dosis más bajas de anestésico local pueden reducir estos eventos adversos y acelerar el retorno de la función muscular. En esta revisión se examinan por separado las dosis altas y bajas de anestesia raquídea.
Con la anestesia raquídea‐epidural combinada (REC), la inserción del catéter epidural permite la inyección de pequeñas dosis en la columna vertebral y la administración de dosis adicionales de anestésico a través del catéter epidural. Por lo general, la anestesia REC funciona más lentamente y puede evitar algunos de los efectos adversos observados durante la anestesia raquídea de una sola aplicación. La posibilidad de completar la anestesia puede reducir la necesidad de anestesia general o sedación cuando el bloqueo nervioso regional no es suficiente para la cirugía. El catéter epidural también se puede utilizar para administrar analgésicos después de la operación.
¿Qué evidencia se encontró?
Se buscó la evidencia (8 de agosto de 2019) y se identificaron 18 ensayos controlados aleatorios (1272 mujeres) que compararon la anestesia raquídea a dosis alta o baja con el método REC. Sin embargo, la mayoría de los análisis incluyeron pocos estudios y un número relativamente pequeño de mujeres. Dos ensayos no aportaron datos para la revisión.
Puede haber poca o ninguna diferencia entre la REC y la raquídea en dosis altas en cuanto al número de mujeres que requieren anestesia repetida o anestesia general debido al fracaso para establecer una anestesia inicial adecuada. No se sabe si la anestesia REC o la raquídea tienen alguna diferencia en cuanto a la necesidad de analgesia intraoperatoria adicional o de conversión a anestesia general. También se desconocen los resultados del número de mujeres que estuvieron satisfechas con la anestesia, independientemente del tipo de bloqueo nervioso. Una cantidad mayor de pacientes en el grupo con REC (13/21) experimentó náuseas o vómitos intraoperatorios que requirieron tratamiento, en relación con el grupo de anestesia raquídea de dosis alta (6/21). Un número similar de mujeres en los grupos experimentó cefalea posterior a la punción dural (5/56 con REC versus 6/57 con RSA; tres estudios, 113 mujeres) o hipotensión intraoperatoria que requirió tratamiento (cuatro ensayos, 162 mujeres).
Puede haber poca o ninguna diferencia entre los grupos de anestesia REC y raquídea en dosis bajas en cuanto al número de mujeres que requirieron anestesia repetida o anestesia general debido al fracaso para establecer una anestesia inicial adecuada (tres estudios, 224 mujeres). Probablemente hay poca o ninguna diferencia en cuanto a la necesidad de analgesia intraoperatoria adicional (cuatro estudios, 298 mujeres). No se conoce con certeza el efecto de la anestesia REC o raquídea en dosis bajas sobre la necesidad de conversión intraoperatoria a anestesia general, porque ninguna de las mujeres lo requirió (tres estudios, 222 mujeres). Ningún estudio examinó la satisfacción de las mujeres con la anestesia. El tiempo promedio hasta la anestesia efectiva fue más rápido con una dosis baja de anestesia raquídea en comparación con la REC, aunque es poco probable que esta pequeña diferencia sea clínicamente significativa (dos estudios, 160 mujeres). La REC pareció reducir la hipotensión intraoperatoria con necesidad de tratamiento en comparación con la dosis baja de anestesia raquídea (cuatro estudios, 336 mujeres). Un número similar de mujeres en el grupo con REC y el grupo con dosis bajas de raquídea presentaron náuseas o vómitos intraoperatorios que requirieron tratamiento (3/50 con REC versus 6/50 con RSA; un ensayo, 100 mujeres). No hubo cefaleas posteriores a la punción dural (un estudio, 138 mujeres).
Todos los recién nacidos estaban sanos al nacer, independientemente de la anestesia materna utilizada (medida por las puntuaciones de Apgar; cinco estudios, 242 recién nacidos).
¿Qué significa esto?
En la actualidad no hay evidencia suficiente para favorecer una técnica anestésica sobre otra. El número de estudios y participantes para la mayoría de los análisis fue pequeño y algunos estudios tuvieron limitaciones de diseño. Se necesitan más estudios para evaluar la efectividad y la seguridad relativa de la REC y la anestesia raquídea para la cesárea.
Conclusiones de los autores
Summary of findings
| CSE compared to high‐dose spinal for caesarean section | ||||||
| Patient or population: women having a caesarean section Setting: university or national hospitals | ||||||
| Outcomes | Anticipated absolute effects* (95% CI) | Relative effect | № of participants | Certainty of the evidence | Comments | |
| Risk with high‐dose spinal | Risk with CSE | |||||
| Number of women requiring a repeat regional block or a general anaesthetic as a result of failure to establish adequate initial blockade | Study population | RR 0.32 | 341 | ⊕⊕⊝⊝ | ‐ | |
| 69 per 1000 | 22 per 1000 | |||||
| Number of women requiring supplemental intra‐operative analgesia at any time after CSE or spinal anaesthetic insertion | Study population | Average RR 1.25 | 390 | ⊕⊝⊝⊝ | ‐ | |
| 124 per 1000 | 154 per 1000 | |||||
| Number of women requiring intra‐operative conversion to general anaesthesia | Study population | RR 1.00 | 388 | ⊕⊝⊝⊝ | ‐ | |
| 48 per 1000 | 48 per 1000 | |||||
| Number of women satisfied with anaesthesia | Study population | RR 0.93 (0.73 to 1.19) | 72 | ⊕⊝⊝⊝ | ‐ | |
| 806 per 1000 | 749 per 1000 | |||||
| *The risk in the intervention group (and its 95% confidence interval) is based on the assumed risk in the comparison group and the relative effect of the intervention (and its 95% CI). | ||||||
| GRADE Working Group grades of evidence | ||||||
| aSmall sample size and wide confidence interval crossing the line of no effect (imprecision −1). | ||||||
| CSE compared to low‐dose spinal for caesarean section | ||||||
| Patient or population: women having a caesarean section Setting: university or national hospitals | ||||||
| Outcomes | Anticipated absolute effects* (95% CI) | Relative effect | № of participants | Certainty of the evidence | Comments | |
| Risk with low‐dose spinal | Risk with CSE | |||||
| Number of women requiring a repeat regional block or a general anaesthetic as a result of failure to establish adequate initial blockade | Study population | RR 4.81 | 224 | ⊕⊕⊝⊝ | ‐ | |
| 0 per 1000 | 0 per 1000 | |||||
| Number of women requiring supplemental intra‐operative analgesia at any time after CSE or spinal anaesthetic insertion | Study population | RR 1.75 | 298 | ⊕⊕⊕⊝ | ‐ | |
| 100 per 1000 | 175 per 1000 | |||||
| Number of women requiring intra‐operative conversion to general anaesthesia | Study population | ‐ | 222 | ⊕⊕⊝⊝ | Effect is uncertain. No women in these 3 RCTs required a conversion to general anaesthetic | |
| see comment | see comment | |||||
| Number of women satisfied with anaesthesia | Study population | ‐ | (0 studies) | ‐ | No data available in the included studies | |
| see comment | see comment | |||||
| *The risk in the intervention group (and its 95% confidence interval) is based on the assumed risk in the comparison group and the relative effect of the intervention (and its 95% CI). | ||||||
| GRADE Working Group grades of evidence | ||||||
| aSmall sample size and very wide confidence interval crossing the line of no effect (imprecision −2). | ||||||
Antecedentes
Descripción de la afección
La cesárea es una forma frecuente del parto, con tasas de 19,4 por cada 100 nacidos vivos (Molina 2015). A menudo se utiliza el bloqueo regional como anestésico para la cesárea. Los métodos que se han utilizado habitualmente para la anestesia regional incluyen el bloqueo epidural o el bloqueo raquídeo administrado como una sola inyección, es decir, una anestesia raquídea de una sola aplicación (RSA). Los efectos beneficiosos relativos y los efectos secundarios de estas técnicas establecidas han sido objeto de una revisión sistemática (Ng 2004). Al combinar los elementos clave de estas dos técnicas, durante más de dos décadas se han utilizado en la clínica varias formas de anestesia raquídea‐epidural combinada (REC), pero han ganado popularidad en los últimos años (Singh 2016). Por lo tanto, es conveniente evaluar los posibles efectos beneficiosos y adversos relativos de la REC para la anestesia en relación con estas otras técnicas. Esta revisión se centrará específicamente en la REC versus la RSA para la anestesia durante la cesárea.
Descripción de la intervención
La anestesia raquídea para la cesárea consiste en una sola inyección que se realiza con relativa facilidad y que tiene un inicio rápido. Sin embargo, cuando se realiza una sola inyección no es posible ampliar el bloqueo después de la administración inicial. También se puede asociar con efectos adversos como hipotensión relacionada con el inicio rápido del bloqueo simpático amplio, en especial cuando se utilizan dosis más altas de anestésico local (Chooi 2017). La anestesia epidural implica la inserción de una aguja más grande, pero el evento final de la técnica a veces es menos obvio que para la RSA, y la tasa de inicio del bloqueo también es considerablemente más lenta. Sin embargo, la técnica epidural típicamente incluye la inserción de un catéter fino, con el cual existe la oportunidad de la administración de fármacos adicionales después de la inyección inicial. Esta característica puede tener varios efectos beneficiosos como la opción de un inicio más gradual de la anestesia, que podría reducir la probabilidad de una caída de la presión arterial al inicio del procedimiento. Lo anterior reducirá la aparición de efectos adversos como náuseas y vómitos y podría ser útil cuando se necesita estabilidad cardiovascular, como en el caso de una enfermedad cardíaca materna importante (Monteiro 2016). También existe la posibilidad de evitar la necesidad de anestesia general durante operaciones más largas en las que la inyección raquídea inicial comienza a desaparecer, ya que se pueden administrar fármacos adicionales a través del catéter (Leo 2009).
Además de los fármacos anestésicos locales, los componentes raquídeos y los epidurales pueden utilizar una serie de adyuvantes diferentes, que incluyen diversos opiáceos y otros fármacos con propiedades analgésicas como la clonidina. Estos agentes puede permitir utilizar dosis más pequeñas de anestésicos locales, lo que podría reducir la incidencia y la gravedad de los efectos secundarios como la hipotensión, o pueden ser útiles para prolongar la duración de la anestesia efectiva durante el procedimiento.
Existen varias variantes de la técnica REC. En su forma más simple, se realiza una punción lumbar y se inserta un catéter epidural al mismo tiempo, como respaldo para la anestesia raquídea o para proporcionar alivio del dolor postoperatorio. Otras variantes utilizan una inyección epidural poco después de la raquídea para ampliar el efecto de esta última, posiblemente a través de la compresión mecánica de la duramadre. Las soluciones salinas y los anestésicos locales han demostrado ser efectivos para aumentar la altura del bloqueo sensorial de esta manera (Yun 2014), aunque el efecto parece estar limitado a aproximadamente los primeros 15 a 20 minutos después de la inyección raquídea, lo que también está influenciado por la posición de la mujer, pues tiene la mayor efectividad con la mujer en posición lateral o supina, en lugar de sentada (Zaphiratos 2016). Por lo tanto, en esta revisión se han considerado como subgrupos de la REC todos los estudios en los que existió la posibilidad de aumentar la altura del bloqueo por compresión dural, mediante la administración epidural de solución salina o anestésico local dentro de los 20 minutos posteriores a una dosis intencionalmente baja de anestesia raquídea. Sin embargo, el término "aumento del volumen epidural" (AVE) se ha llegado a aplicar cuando se administra solución salina para la compresión dural solo dentro de los primeros minutos después de la inyección raquídea, mientras que a la administración de una o más dosis pequeñas de anestésico local, habitualmente hasta 20 minutos o más después de la raquídea, se le ha llamado "REC secuencial" de dosis baja (McNaught 2007). Además de la utilidad clínica, existe una base teórica que respalda la opinión de que estas alternativas son suficientemente diferentes entre sí para considerarlas como subgrupos separados. Todas estas técnicas de REC pueden tener efectos beneficiosos particulares relacionados con las dosis más bajas del anestésico local utilizado como el retorno más rápido de la función motora, lo que permite un alta más temprana de la unidad de cuidados postanestésicos, y un menor efecto sobre el sistema cardiovascular (McNaught 2007), y da lugar a una menor necesidad de intervenciones secundarias a la disminución de la presión arterial, o a su administración a mujeres seleccionadas de alto riesgo (Hamlyn 2005). Debido a estos posibles efectos beneficiosos de la REC, también se ha informado cada vez más la disminución constante de las dosis de anestésico local en la RSA (Langesaeter 2008). Por lo tanto, puede ser informativo subdividir los estudios de RSA en técnicas anestésicas locales de dosis alta más tradicionales, y técnicas de dosis baja.
De qué manera podría funcionar la intervención
La combinación de la anestesia raquídea con una epidural crea la oportunidad de obtener posibles efectos beneficiosos de la colocación de un catéter epidural, a la vez que se mantiene la rapidez en el comienzo de la raquídea. Sin embargo, la técnica REC implica la inserción de dos agujas, y ha habido cierto debate sobre si la aguja raquídea se debe colocar a través de la aguja epidural o si se debe insertar como un procedimiento separado, habitualmente en un sitio diferentes para mejorar la eficacia o reducir los efectos secundarios; hay diversos resultados que favorecen a uno (Backe 2004) o a otro (Ahn 2016). La técnica de aguja a través de aguja comúnmente utilizada puede facilitar la colocación del catéter epidural, pero este procedimiento puede estar significativamente influenciado por el diseño de la aguja (Browne 2005). También existen al menos preocupaciones teóricas sobre la creciente complejidad de la REC frente a la de la RSA, que se suma a la dificultad técnica y al tiempo necesario para realizar el bloqueo, así como sobre su eficacia, especialmente en caso de fracaso total, y la necesidad de realizar otro bloqueo regional o de administrar un anestésico general (Kinsella 2008).
Por qué es importante realizar esta revisión
Para las embarazadas a las que se les realiza una cesárea, es importante comprender los efectos secundarios graves de la REC y la RSA. Estos efectos secundarios incluyen riesgo de infección (Sandkovsky 2009), cefalea posterior a la punción dural (CPPD) y lesión neurológica a más largo plazo. Como la mayoría de estos resultados son poco frecuentes, los resultados de los ensayos controlados aleatorios únicos generalmente no tienen números suficientes para ser informativos, y las series de casos o las auditorías están sujetas a las limitaciones de estos métodos. El más frecuente de estos problemas es la cefalea posterior a la punción dural, ya sea como resultado de una punción dural accidental con la aguja epidural o después de la perforación intencional de la duramadre con una aguja raquídea. La incidencia informada de punción dural accidental con una aguja epidural es de aproximadamente el 1,5%; y la mitad de estas mujeres desarrollan CPPD (Choi 2003). La incidencia de CPPD después de un RSA depende del calibre de la aguja y del diseño de la punta de la aguja. Las agujas de calibre más pequeño de uso habitual con un diseño atraumático tienen una incidencia similar de CPPD a la de las agujas epidurales (Choi 2003). Para la técnica REC también se ha informado una incidencia de CPPD similar a estas otras alternativas (Van de Velde 2008).
La experiencia de las molestias intraoperatorias es de especial interés para las usuarias y los anestesistas. Puede variar desde efectos menores y transitorios, hasta dolor y angustia importantes que requieren la conversión del bloqueo regional a un anestésico general. Con dosis cada vez menores de anestésico local, es importante evaluar la incidencia de la necesidad de analgesia intraoperatoria y de conversión a anestesia general después del establecimiento del bloqueo.
Objetivos
Comparar la efectividad y los efectos adversos de la anestesia raquídea‐epidural combinada versus la anestesia raquídea de una sola aplicación para la cesárea.
Métodos
Criterios de inclusión de estudios para esta revisión
Tipos de estudios
Todos los ensayos controlados aleatorios (ECA) publicados que incluyan una comparación de la anestesia raquídea y epidural combinada (REC) con la anestesia raquídea de una sola aplicación (RSA) para la cesárea. En esta revisión no hubo ECA grupales elegibles para inclusión. Se incluyeron estudios que solo se publicaron como resúmenes.
Los ensayos controlados cuasialeatorizados no fueron elegibles para inclusión. Los estudios que utilizaron un diseño cruzado (cross‐over) no se consideraron elegibles para inclusión. Se excluyeron los estudios que no informaron resultados de interés.
Tipos de participantes
Mujeres a las que se les realiza una cesárea.
Tipos de intervenciones
La anestesia REC se comparó con la anestesia raquídea de una sola aplicación para la cesárea. La anestesia raquídea de una sola aplicación se subagrupó sobre la base de la dosis del anestésico local utilizado como dosis alta o baja, y la dosis baja se definió como menos de 10 mg de bupivacaína o equivalente. Los grupos de intervención de REC se subcategorizaron según:
-
ningún uso de epidural, REC secuencial y aumento del volumen epidural (AVE);
-
aguja a través de aguja (A‐A) o REC de dos niveles.
Tipos de medida de resultado
Las medidas de resultado incluidas fueron las siguientes:
Resultados primarios
-
Número de pacientes que requieren un nuevo bloqueo regional o anestesia general como resultado de no establecer un bloqueo inicial adecuado
-
Número de pacientes que requieren analgesia intraoperatoria complementaria en cualquier momento después de inyectar REC o anestesia raquídea
-
Número de pacientes que requieren conversión intraoperatoria a anestesia general
-
Número de pacientes satisfechas con la analgesia
Resultados secundarios
-
Tiempo medio y desviación estándar desde el inicio de la anestesia regional hasta la anestesia efectiva para la cirugía
-
Número de mujeres con hipotensión intraoperatoria que requirieron tratamiento o una intervención específicamente identificada
-
Número de mujeres con náuseas y vómitos intraoperatorios que requirieron tratamiento o una intervención específicamente identificada
-
Tiempo medio y desviación estándar desde el ingreso hasta el alta de la unidad de recuperación postanestésica
-
Número de mujeres que requirieron seguimiento por un resultado adverso presente al mes o más después del procedimiento, específicamente identificado: meningitis, neuropraxia, parálisis, dolor de espalda, caída del pie, cefalea no resuelta después de la punción dural
-
Número de pacientes con cefalea posterior a la punción dural
-
Número de recién nacidos ingresados en la unidad de cuidados neonatales
-
Media y desviación estándar del pH en la arteria umbilical, la vena umbilical o el cordón umbilical del recién nacido
-
Número de recién nacidos con puntuaciones de Apgar menores de 7 a los cinco minutos
Métodos de búsqueda para la identificación de los estudios
The following Methods section of this review is based on a standard template used by Cochrane Pregnancy and Childbirth.
Búsquedas electrónicas
We searched Cochrane Pregnancy and Childbirth’s Trials Register by contacting their Information Specialist (8 August 2019).
The Register is a database containing over 25,000 reports of controlled trials in the field of pregnancy and childbirth. It represents over 30 years of searching. For full current search methods used to populate Pregnancy and Childbirth’s Trials Register, including the detailed search strategies for CENTRAL, MEDLINE, Embase and CINAHL, the list of handsearched journals and conference proceedings, and the list of journals reviewed via the current awareness service, please follow this link.
Briefly, Cochrane Pregnancy and Childbirth’s Trials Register is maintained by their Information Specialist and contains trials identified from:
-
monthly searches of the Cochrane Central Register of Controlled Trials (CENTRAL);
-
weekly searches of MEDLINE (Ovid);
-
weekly searches of Embase (Ovid);
-
monthly searches of CINAHL (EBSCO);
-
handsearches of 30 journals and the proceedings of major conferences;
-
weekly current awareness alerts for a further 44 journals plus monthly BioMed Central email alerts.
Two people screen the search results, and review the full text of all relevant trial reports identified through the searching activities described above. Based on the intervention described, each trial report is assigned a number that corresponds to a specific Pregnancy and Childbirth review topic (or topics), and is then added to the Register. The Information Specialist searches the Register for each review using this topic number rather than keywords. This results in a more specific search set which has been fully accounted for in the relevant review sections (Included studies; Excluded studies; Studies awaiting classification).
In addition, we searched ClinicalTrials.gov and the WHO International Clinical Trials Registry Platform (ICTRP) (8 August 2019) for unpublished, planned and ongoing trial reports, using the search terms given in Appendix 1.
Búsqueda de otros recursos
We searched the reference lists of retrieved studies.
We did not apply any language or date restrictions.
Obtención y análisis de los datos
The following Methods section of this review is based on a standard template used by the Cochrane Pregnancy and Childbirth Group.
Selección de los estudios
Two review authors independently assessed for inclusion all the studies identified as a result of the search strategy. We resolved any disagreement through discussion or, if required, we consulted a third review author.
Extracción y manejo de los datos
We designed a form to extract data, which two review authors used to extract the data from eligible studies. We resolved discrepancies through discussion or, if required, we consulted a third review author. We entered data into Review Manager 5 software (RevMan 2014) and checked them for accuracy.
When information on any of the above was unclear, we planned to contact authors of the original reports to provide further details.
Evaluación del riesgo de sesgo de los estudios incluidos
Two review authors independently assessed risks of bias for each study, using the criteria outlined in the Cochrane Handbook for Systematic Reviews of Interventions (Handbook; Higgins 2017). We resolved any disagreement by discussion or by involving a third assessor.
(1) Random sequence generation (checking for possible selection bias)
We described for each included study the method used to generate the allocation sequence in sufficient detail to allow an assessment of whether it should produce comparable groups.
We assessed the method as:
-
low risk of bias (any truly random process, e.g. random‐number table; computer random‐number generator);
-
high risk of bias (any non‐random process, e.g. odd or even date of birth; hospital or clinic record number);
-
unclear risk of bias.
(2) Allocation concealment (checking for possible selection bias)
We described for each included study the method used to conceal allocation to interventions prior to assignment and assessed whether intervention allocation could have been foreseen in advance of, or during recruitment, or changed after assignment.
We assessed the methods as:
-
low risk of bias (e.g. telephone or central randomisation; consecutively‐numbered sealed opaque envelopes);
-
high risk of bias (open random allocation; unsealed or non‐opaque envelopes; alternation; date of birth);
-
unclear risk of bias.
(3.1) Blinding of participants and personnel (checking for possible performance bias)
We described for each included study the methods used, if any, to blind study participants and personnel from knowledge of which intervention a participant received. We considered that studies were at low risk of bias if they were blinded, or if we judged the lack of blinding unlikely to affect results. We assessed blinding separately for different outcomes or classes of outcomes.
We assessed the methods as:
-
low, high or unclear risk of bias for participants;
-
low, high or unclear risk of bias for personnel.
(3.2) Blinding of outcome assessment (checking for possible detection bias)
We described for each included study the methods used, if any, to blind outcome assessors from knowledge of which intervention a participant received. We assessed blinding separately for different outcomes or classes of outcomes.
We assessed methods used to blind outcome assessment as:
-
low, high or unclear risk of bias.
(4) Incomplete outcome data (checking for possible attrition bias due to the amount, nature and handling of incomplete outcome data)
We described for each included study, and for each outcome or class of outcomes, the completeness of data including attrition and exclusions from the analysis. We stated whether attrition and exclusions were reported and the numbers included in the analysis at each stage (compared with the total randomised participants), reasons for attrition or exclusion where reported, and whether missing data were balanced across groups or were related to outcomes. Where sufficient information was reported or could be supplied by the trial authors, we planned to re‐include missing data in the analyses which we undertook.
We assessed methods as:
-
low risk of bias (e.g. no missing outcome data; missing outcome data balanced across groups);
-
high risk of bias (e.g. numbers or reasons for missing data imbalanced across groups; ‘as treated’ analysis done with substantial departure of intervention received from that assigned at randomisation);
-
unclear risk of bias.
(5) Selective reporting (checking for reporting bias)
We described for each included study how we investigated the possibility of selective outcome reporting bias and what we found.
We assessed the methods as:
-
low risk of bias (where it is clear that all of the study’s prespecified outcomes and all expected outcomes of interest to the review have been reported);
-
high risk of bias (where not all the study’s prespecified outcomes have been reported; one or more reported primary outcomes were not prespecified; outcomes of interest are reported incompletely and so cannot be used; study fails to include results of a key outcome that would have been expected to have been reported);
-
unclear risk of bias.
(6) Other bias (checking for bias due to problems not covered by (1) to (5) above)
We described for each included study any important concerns we had about other possible sources of bias.
(7) Overall risk of bias
We made explicit judgements about whether studies were at high risk of bias, according to the criteria given in the Handbook (Higgins 2017). With reference to (1) to (6) above, we planned to assess the likely magnitude and direction of the bias and whether we considered it likely to impact on the findings. In future updates, we will explore the impact of the level of bias through undertaking sensitivity analyses (see Sensitivity analysis).
Assessment of the quality of the evidence using the GRADE approach
For this review we assessed the quality of the evidence using the GRADE approach, as outlined in the GRADE Handbook. We assessed the quality of the body of evidence relating to the following outcomes for the main comparisons.
-
Number of women requiring a repeat regional block or a general anaesthetic as a result of failure to establish adequate initial blockade
-
Number of women requiring supplemental intra‐operative analgesia at any time after CSE or spinal anaesthetic insertion
-
Number of women requiring intra‐operative conversion to general anaesthesia
-
Number of women satisfied with their anaesthesia
We used the GRADEpro Guideline Development Tool to import data from Review Manager 5 (RevMan 2014) in order to create ’Summary of findings’ tables. We produced a summary of the intervention effect and a measure of quality for each of the above outcomes using the GRADE approach. The GRADE approach uses five considerations (study limitations, consistency of effect, imprecision, indirectness and publication bias) to assess the quality of the body of evidence for each outcome. The evidence can be downgraded from 'high quality' by one level for serious (or by two levels for very serious) limitations, depending on assessments of risk of bias, indirectness of evidence, serious inconsistency, imprecision of effect estimates or potential publication bias.
Medidas del efecto del tratamiento
Dichotomous data
For dichotomous data, we presented results as a summary risk ratio (RR) with a 95% confidence interval (CI).
Continuous data
We used the mean difference (MD) if outcomes were measured in the same way between trials. We used the standardised mean difference (SMD) to combine trials that measured the same outcome, but used different methods.
Cuestiones relativas a la unidad de análisis
Cluster‐randomised trials
In future updates, if cluster‐randomised trials are available we will include them in the analyses along with individually‐randomised trials. We will adjust their sample size using the methods described in Section 16.3.4 of the Handbook (Higgins 2011), using an estimate of the intracluster correlation co‐efficient (ICC) derived from the trial (if possible), from a similar trial or from a study of a similar population. If we use ICCs from other sources, we will report this and conduct sensitivity analyses to investigate the effect of variation in the ICC. If we identify both cluster‐randomised trials and individually‐randomised trials, we plan to synthesise the relevant information. We will consider it reasonable to combine the results from both if there is little heterogeneity between the study designs, and if we consider the interaction between the effect of intervention and the choice of randomisation unit to be unlikely.
We will also acknowledge heterogeneity in the randomisation unit and perform a sensitivity analysis to investigate the effects of the randomisation unit.
Cross‐over trials
We did not include cross‐over trials.
Other unit of analysis issues
For studies that include more than two treatment groups, we included each pair‐wise comparison separately, but with shared intervention groups divided out approximately evenly among the comparisons. For dichotomous outcomes, we divided up both the number of events and the total number of women. For continuous outcomes, we divided up only the total number of participants, and left the means and standard deviations unchanged.
Manejo de los datos faltantes
For included studies, we noted levels of attrition. In future updates, if we include more eligible studies, we will explore the impact of including studies with high levels of missing data in the overall assessment of treatment effect by using sensitivity analysis.
For all outcomes, we conducted analyses as far as possible on an intention‐to‐treat basis, i.e. we attempted to include all participants randomised to each group in the analyses. The denominator for each outcome in each trial was the number randomised minus any participants whose outcomes were known to be missing.
Evaluación de la heterogeneidad
We assessed statistical heterogeneity in each meta‐analysis using the Tau2, I2 and Chi2 statistics. We regarded heterogeneity as substantial if I2 was greater than 30% and either Tau2 was greater than zero, or there was a low P value (less than 0.10) in the Chi2 test for heterogeneity. If we identified substantial heterogeneity (above 30%), we planned to explore it by prespecified subgroup analysis.
Evaluación de los sesgos de notificación
In future updates, if there are 10 or more studies in the meta‐analysis we will investigate reporting biases (such as publication bias) using funnel plots. We will assess funnel plot asymmetry visually. If asymmetry is suggested by a visual assessment, we will perform exploratory analyses to investigate it.
Síntesis de los datos
We carried out statistical analysis using the Review Manager 5 software (RevMan 2014). We used a fixed‐effect meta‐analysis for combining data where it was reasonable to assume that studies were estimating the same underlying treatment effect, i.e. where trials were examining the same intervention, and we judged the trials’ populations and methods to be sufficiently similar.
If there was clinical heterogeneity sufficient to expect that the underlying treatment effects differed between trials, or if we found substantial statistical heterogeneity, we used a random‐effects meta‐analysis to produce an overall summary if we considered an average treatment effect across trials to be clinically meaningful. We treat the random‐effects summary as the average range of possible treatment effects and we discuss the clinical implications of treatment effects differing between trials. If the average treatment effect is not clinically meaningful, we have not combined trials. Where we use random‐effects analyses, we present the results as the average treatment effect with a 95% confidence interval, and the estimates of Tau2 and I2.
Análisis de subgrupos e investigación de la heterogeneidad
If we identified substantial heterogeneity, we investigated it using subgroup analyses. We considered whether an overall summary was meaningful, and if it was, we used a random‐effects analysis to produce it.
We carried out the following subgroup analyses, but had insufficient data to enable us to carry out any meaningful tests of subgroup difference.
-
Combined spinal‐epidural technique:
-
no epidural use (no ED use);
-
sequential CSE;
-
epidural volume extension (EVE).
-
In future updates, we will assess subgroup differences by interaction tests available within Review Manager 5 (RevMan 2014). We will report the results of subgroup analyses quoting the Chi2 statistic and P value, and the interaction test I2 value.
Análisis de sensibilidad
We planned to carry out sensitivity analyses to explore the effect of trial quality assessed by concealment of allocation, high attrition rates, or both, with poor‐quality studies being excluded from the analyses in order to assess whether this made any difference to the overall result. There were insufficient high‐quality trials to carry out planned sensitivity analysis. We will carry out planned sensitivity analysis in future updates, if appropriate, and will restrict sensitivity analysis to the review's primary outcomes. We will also carry out sensitivity analysis to investigate the effect of the randomisation unit if we combine cluster‐RCTs along with individually‐randomised trials.
Results
Description of studies
Results of the search
The 8 August 2019 search of the Cochrane Pregnancy and Childbirth Group's Trials Register found 28 trial reports. The search of the ClinicalTrials.gov and the WHO International Clinical Trials Registry Platform (ICTRP), and reference lists of retrieved studies found 49 additional reports. We found one more report by manual search. We found a total of 78 reports, which included 23 duplicates. After screening by title and abstract, we excluded 26 reports. Of the remaining 29 reports, we excluded three trials (four reports) based on failure to fulfil inclusion criteria and included 18 (23 reports) in the meta‐analysis. Two are awaiting further classification, see Studies awaiting classification. See Figure 1 for a flow chart of the search process.

Study flow diagram.
For details of the individual included and excluded studies, see the tables of Characteristics of included studies and Characteristics of excluded studies.
Included studies
Eighteen trials involving 1272 women presenting for caesarean section met the criteria for inclusion in the review.
Setting
Eleven studies were conducted in a University Hospital (Abizanda 2007; Choi 2006; Fabris 2013a; Horstman 2009; Kim 1995; Kim 1997; Kim 2003; Ross 2014; Salman 2013; Tyagi 2009; Uysallar 2011) and the remaining seven in a National Hospital (Brizzi 2005; Ithnin 2006; Lew 2004; Lim 2006; Macfarlane 2009; McAndrew 2003; Thoren 1994).
The trials took place in Australia (McAndrew 2003), Croatia (Fabris 2013a), India (Tyagi 2009), Italy (Brizzi 2005), Singapore (Ithnin 2006; Lew 2004; Lim 2006), South Korea (Choi 2006; Kim 1995; Kim 1997; Kim 2003), Spain (Abizanda 2007), Sweden (Thoren 1994), Turkey (Salman 2013; Uysallar 2011), UK (Macfarlane 2009) and USA (Horstman 2009; Ross 2014).
Trial dates
The Abizanda 2007 study ran between January 2005 until November 2006, Horstman 2009 took place between August and October 2006, McAndrew 2003 took place between July 2001 until March 2002, and Ross 2014 took place between September 2004 until August 2007.
None of the remaining trials reported the study dates (Brizzi 2005; Choi 2006; Fabris 2013a; Ithnin 2006; Kim 1995; Kim 1997; Kim 2003; Lew 2004; Lim 2006; Macfarlane 2009; Salman 2013; Thoren 1994; Tyagi 2009; Uysallar 2011).
Publication language
Of the 18 included studies, five were published in a language other than English: one in Turkish (Uysallar 2011), three in Korean (Kim 1995; Kim 1997; Kim 2003) and one in Spanish (Abizanda 2007).
Source of trial funding
Three studies reported sources of trial funding. Horstman 2009; was funded internally by the Stamford School of Medicine, USA. Ross 2014 was supported by departmental funds (University hospital based in Winston‐Salem, North Carolina, USA) and the authors reported that no additional funding was obtained. Salman 2013 was supported by a grant from the Akdeniz University School of Medicine's Research and Application Centre, Turkey.
The sources of trial funding were not stated in the remaining trials (Abizanda 2007; Brizzi 2005; Choi 2006; Fabris 2013a; Ithnin 2006; Kim 1995; Kim 1997; Kim 2003; Lew 2004; Lim 2006; Macfarlane 2009; McAndrew 2003; Thoren 1994; Tyagi 2009; Uysallar 2011).
Trial authors' declarations of interest
Three trials reported that they had no conflicts of interest to declare (Horstman 2009; Ross 2014; Salman 2013). Information relating to potential conflicts of interest was not mentioned in the remaining trials (Abizanda 2007; Brizzi 2005; Choi 2006; Fabris 2013a; Ithnin 2006; Kim 1995; Kim 1997; Kim 2003; Lew 2004; Lim 2006; Macfarlane 2009; McAndrew 2003; Thoren 1994; Tyagi 2009; Uysallar 2011).
Design
All but four studies (Brizzi 2005; Kim 1995; Kim 1997; Kim 2003) reported obtaining prior ethics committee approval. The same studies (Brizzi 2005; Kim 1995; Kim 1997; Kim 2003) also did not mention if informed written consent was provided by the participants of the trial. The remaining trials explicitly reported obtaining informed written consent from the participants, except for four trials which reported obtaining consent from the women without specifying the form of the consent (Lim 2006; McAndrew 2003; Salman 2013; Uysallar 2011). Of the 18 included studies, only four studies stated when women were recruited for the study (Abizanda 2007; Horstman 2009; McAndrew 2003; Ross 2014).
All studies included in this review were reported to be randomised controlled trials comparing the effects of single‐shot spinal anaesthesia (SSS) to combined spinal‐epidural anaesthesia (CSE) in either elective or non‐elective scenarios. Randomisation techniques varied and the potential for bias was either high or unclear in a number of studies. Refer to Risk of bias in included studies and 'Risk of bias' tables in the Characteristics of included studies section for further details.
Fourteen studies mentioned a crystalloid fluid preload prior to inserting the spinal or CSE; the volumes administered varied: 500 mL (Brizzi 2005; Fabris 2013a; Ithnin 2006; Kim 1997; Lew 2004; Macfarlane 2009), 1000 mL (Kim 1995; Kim 2003; Salman 2013), 1000 mL plus 500 mL of hetastarch (Horstman 2009), 1500 mL to 2000 mL (Thoren 1994). Three studies gave crystalloid preload boluses based on the participants weight: 10 mL/kg (Tyagi 2009), 15 mL/kg (Uysallar 2011), 20 mL/kg (Choi 2006).
Two studies gave a prophylactic 5 mg dose of ephedrine prior to the insertion of the CSE or spinal anaesthetic (Brizzi 2005; Salman 2013).
Where stated, the women's positioning for the block was relatively evenly divided between sitting (Brizzi 2005; Fabris 2013a; Macfarlane 2009; Ross 2014; Thoren 1994; Tyagi 2009; Uysallar 2011) and the right lateral recumbent position (Choi 2006; Horstman 2009; Ithnin 2006; Kim 1997; Lew 2004; Lim 2006; Salman 2013). One study (McAndrew 2003) permitted the proceduralist to choose between these two positions, based on personal preference. Three further studies (Abizanda 2007; Kim 1995; Kim 2003) did not report the position the blocks were performed in.
While all blocks were performed at the lumbar spine level, there was significant variation in the particular level of insertion between the studies. Four studies performed the block at the third lumbar interspace (Choi 2006; Horstman 2009; Ithnin 2006; Macfarlane 2009), while two studies performed the block at the fourth lumbar interspace (Lew 2004; Tyagi 2009) and one study (Abizanda 2007) performed blocks at the level of the intercristal line. Seven studies allowed the proceduralist to choose between two levels, ranging from the second and third or third and fourth lumbar interspace (Fabris 2013a; Kim 1997; Kim 2003; Lim 2006; McAndrew 2003; Salman 2013; Uysallar 2011). One study performed the block at the second lumbar interspace (Thoren 1994) and another at the first lumbar interspace (Brizzi 2005). These higher spinal level blocks could conceivably influence the attributes these blocks in comparison to most of the other studies where lower lumbar levels were targeted, particularly in reference to the number of women with hypotension. Additionally spinal anaesthesia at high lumbar interspaces (first or second) is generally not advised due to variability in the caudal extension of the cauda equina, which may be into the lumbar region, with the possibility of inadvertent nerve injury. One study (Fabris 2013a), which performed the blocks in the sitting position at the third or fourth lumbar interspace, kept the participant in the sitting position after completion of the block for three minutes to "anchor‐fix the block". Two studies (Kim 1995; Ross 2014) did not mention the spinal level at which the blocks were performed.
Sample sizes
Of the studies included, four had 100 or more participants (Abizanda 2007; Brizzi 2005; Choi 2006; Salman 2013), six studies had between 50 and 100 participants (Fabris 2013a; Lew 2004; Kim 1997; Macfarlane 2009; McAndrew 2003; Tyagi 2009) and the remaining eight studies had fewer than 50 participants (Horstman 2009; Ithnin 2006; Kim 1995; Kim 2003; Lim 2006; Ross 2014; Thoren 1994; Uysallar 2011).
Participants
All trials included healthy women, with the exception of one study that was specifically examining obese parturients (Ross 2014). Most studies required the women to be low risk according to the American Society of Anesthesiology (ASA) category I or II (Fabris 2013a; Horstman 2009; Ithnin 2006; Lew 2004; Lim 2006; Macfarlane 2009; Salman 2013; Thoren 1994; Tyagi 2009; Uysallar 2011). Of the five studies that did not mention an ASA grade, four studies (Brizzi 2005; Kim 1995; Kim 1997; Kim 2003) stipulated that the participants must be "healthy" but did not mention any other inclusion criteria apart from being full‐term gestation. When mentioned, obesity was generally an exclusion criterion, with a number of studies setting upper limits for either body weight or body mass index (BMI). Two studies excluded women with a BMI above 35 kg/m2 (Ithnin 2006; Tyagi 2009), while one study (Horstman 2009) excluded women with a BMI above 40 kg/m2. Two studies excluded women based on elevated body weight: above 100 kg (Salman 2013), and above 110 kg (Fabris 2013a).
The potential for extremes of height to influence the response to SSS or CSE anaesthesia resulted in some studies setting upper and lower limits as exclusion criteria. Tyagi 2009 and Ithnin 2006 only included women between 145 and 180 cm, Lew 2004 between 150 and 170 cm, Horstman 2009 above 150 cm, and Salman 2013 above 155 cm. The remaining studies did not set limits on women's height as inclusion or exclusion criteria.
Seven studies only included women who were at term gestation (Brizzi 2005; Choi 2006; Fabris 2013a; Salman 2013; Thoren 1994; Tyagi 2009; Uysallar 2011), although none of these studies defined this criterion. Only one other study (Macfarlane 2009) mentioned a minimum gestation of 36 weeks for inclusion, while the remaining studies did not include gestation as part of the inclusion criteria. Multiple gestation was an exclusion criterion in nine studies (Choi 2006; Fabris 2013a; Horstman 2009; Ithnin 2006; Lew 2004; Macfarlane 2009; Thoren 1994; Tyagi 2009; Uysallar 2011).
Eleven studies specifically mentioned contraindications to regional anaesthesia as an exclusion criterion (Abizanda 2007; Choi 2006; Horstman 2009; Ithnin 2006; Lew 2004; Lim 2006; Macfarlane 2009; McAndrew 2003; Ross 2014; Tyagi 2009; Uysallar 2011). There were a range of other specific exclusion criteria, including hypertensive disorders of pregnancy (Choi 2006; Fabris 2013a; Horstman 2009; Ithnin 2006; Lew 2004; Macfarlane 2009; Salman 2013), placenta praevia (Choi 2006; Salman 2013; Tyagi 2009), diabetes (Horstman 2009; Salman 2013), maternal cardiac conditions (Choi 2006; Macfarlane 2009) and being in labour (Fabris 2013a; Horstman 2009; Ithnin 2006; Tyagi 2009). Thoren 1994 excluded any women with "complications" but did not specify what these might be.
Interventions and comparisons
There was considerable heterogeneity between trials in the techniques and equipment used to perform the neuraxial blocks and the drugs and doses used. As described in the Types of interventions section, we subcategorised the spinal anaesthetic dose into high‐dose or low‐dose spinal anaesthesia (low‐dose defined as a subarachnoid local anaesthetic dose of less than 10 mg bupivacaine). We further subcategorised the CSE intervention groups according to:
-
no epidural use (no ED use), sequential CSE and epidural volume extension (EVE);
-
needle through needle (N‐t‐N) or two‐level CSE.
See Table 1 for the distribution of these subgroups. As there were very few studies with small numbers of women, we have not conducted any subgroup analysis based on the needle‐through‐needle or two‐level types of CSE interventions.
|
| CSE: Needle‐through‐needle | CSE: Two injection | ||||
| SPINAL | No ED use | Sequential | EVE | No ED use | Sequential | EVE |
| High‐dose | ‐ | ‐ | ‐ | |||
| Low‐dose | ‐ | ‐ | ||||
Abizanda 2007 is not included in this table as the doses of drugs used and the mode of administration were not stated
Most studies compared two groups of women (SSS versus CSE); however, Abizanda 2007 had four groups comparing two CSE groups (with and without introducer needle) and two SSS groups (different depths of introducer needle insertion). Salman 2013 studied three groups of women: 1) SSS, 2) CSE with EVE, and 3) CSE with LD sequential. Tyagi 2009 also studied three groups of women: 1) SSS, 2) CSE with no ED use, and 3) CSE with EVE. Most of the studies used a N‐t‐N technique for the CSE, with only Brizzi 2005 using two separate injections (at the same lumbar interspace).
Intrathecal drugs and doses
Hyperbaric bupivacaine was the most commonly used local anaesthetic for intrathecal injections (Choi 2006; Horstman 2009; Ithnin 2006; Kim 1995; Kim 2003; Lew 2004; Lim 2006; Macfarlane 2009; Ross 2014; Thoren 1994; Tyagi 2009; Uysallar 2011). Three studies used levobupicaine, with Fabris 2013a using a hyperbaric solution, while Brizzi 2005 and Salman 2013 used isobaric solutions. Only one study used hyperbaric lidocaine as the other local anaesthetics used for intrathecal injection (Kim 1997).
In the SSS groups, doses of hyperbaric bupivacaine ranged from 9 mg (Choi 2006; Lew 2004; Tyagi 2009), 10 mg (Ithnin 2006; Lim 2006), 12 mg (Horstman 2009; Ross 2014) and 12.5 mg (Kim 1995; Macfarlane 2009; Thoren 1994; Uysallar 2011). In the SSS groups using levobupivicaine or lidocaine (Brizzi 2005; Fabris 2013a; Kim 1997; Salman 2013), the doses were all calculated based on the participant's height (see Characteristics of included studies for details).
In the CSE groups, the doses of intrathecal local anaesthetic were usually the same as the SSS groups if the epidural catheter was either not inserted or not used (Horstman 2009; Ithnin 2006; Lim 2006; Macfarlane 2009; Ross 2014). This dosing regimen was due to the fact that these studies were generally trying to demonstrate a difference in the characteristics of an identical intrathecal injection in the presence or absence of the CSE technique. Salman 2013 did however use the same intrathecal dose of local anaesthetic in all three groups, two of which were CSE groups with either EVE or LD sequential techniques. In the remaining studies, the intrathecal doses in the CSE groups were reduced by varying amounts (around 50%: Fabris 2013a; Lew 2004); around 35%: Choi 2006; Brizzi 2005; Kim 1995; Kim 2003; Thoren 1994; Uysallar 2011). Kim 1997 used over twice the dose of lidocaine in the CSE group, using between 105 and 135 mg given through the epidural catheter. McAndrew 2003 did not report the drugs or doses used in either spinal or epidural injections in their study.
Ten studies reported using intrathecal opioids including fentanyl, sufentanil, meperidine, morphine and diamorphine. Fentanyl was the most commonly used intrathecal opioid, with doses ranging from 10 mcg (Horstman 2009; Horstman 2009; Tyagi 2009), 20 mcg (Choi 2006; Kim 2003; Ross 2014; Salman 2013) or a range between 15 to 25 mcg increasing with participant height (Fabris 2013a). Brizzi 2005 was the only study to use sufentanil (5 mcg), Macfarlane 2009 was the only study to use diamorphine (300 mcg), and Kim 1997 was the only study to use meperidine (25 mg). Morphine (200 mcg) was used in combination with fentanyl by Horstman 2009 and Ross 2014. Four studies did not use any intrathecal opioid adjuvants (Ithnin 2006; Lim 2006; Thoren 1994; Uysallar 2011). When opioids were used in the SSS, the same opioid and dose were used in the intrathecal component of the CSE group in the same studies.
The techniques used to locate the epidural space also varied. Seven studies used loss of resistance to air (LORTA), with Horstman 2009, Ithnin 2006, Lim 2006, and Tyagi 2009 limiting the volume of air to be injected to less that two millilitres in an attempt to reduce the potential effects of epidural air injection on thecal sac compression and intrathecal drug spread. Fabris 2013a avoided the potential for this influence by using a "hanging drop" technique. Seven studies used loss of resistance to saline (LORTS), although volumes were not specified (Brizzi 2005; Kim 2003; Macfarlane 2009; Ross 2014; Salman 2013; Thoren 1994; Uysallar 2011). McAndrew 2003 allowed the proceduralist to choose between LORTS or LORTA.
Epidural drugs and doses
While all the studies included in this review compared SSS to CSE, there was considerable variation in the way the CSE technique was used. Seven studies used a LD sequential CSE only (Brizzi 2005; Choi 2006; Kim 1995; Kim 1997; Kim 2003; Thoren 1994; Uysallar 2011) and a further two studies used EVE CSE only (Fabris 2013a; Lew 2004). Salman 2013 compared SSS to both EVE and LD sequential groups, and Tyagi 2009 compared SSS to a CSE‐EVE group and a CSE‐no epidural catheter use group. Four of the remaining six studies did not insert epidural catheters (Horstman 2009; Ithnin 2006; Lim 2006; Macfarlane 2009), while the remaining two did not use the catheters in the initial establishment of anaesthesia for caesarean section (McAndrew 2003; Ross 2014). In one study (Abizanda 2007) the outcome was the incidence of paraesthesia at needle insertion and the doses of drugs used for surgery were not reported.
In the EVE groups, 20 mL of saline was the most volume injected in Fabris 2013a. This was in the context of the lowest dose of intrathecal local anaesthetic as part of a CSE technique amongst all the studies (4 to 4.4 mg of hyperbaric levobupivicaine). The remaining CSE‐EVE groups used either 5 mL or 6 mL of saline (Lew 2004; Salman 2013; Tyagi 2009). In the LD sequential groups, isobaric bupivicaine was the most commonly used local anaesthetic, with Choi 2006 using 10 mL of 0.25% bupivicaine five minutes after intrathecal injection for all CSE group participants. Both Thoren 1994 and Uysallar 2011 gave a 2 mL test dose of epidural 0.5% bupivicaine 15 minutes after the intrathecal injection and then gave a further 2 mL of the same solution for each dermatomal segment with preserved sensation to pin‐prick up to the fourth thoracic dermatome. Brizzi 2005 used between 10 and 12 mL of 0.25% levobupivicaine epidurally based on the participant's height as the LD sequential dose after the 5 mg of levobupivicaine intrathecal spinal dose. Salman 2013 used 5 mL of 0.5% levobupivicaine in the LD sequential group of their study.
Equipment
Heterogeneity in the equipment used for the neuroaxial techniques was important to consider in this review, as certain types of spinal needles in particular can increase the risk of post‐dural puncture headache (PDPH). It has been suggested that it may even be unethical to use 'cutting' Quinke needles in obstetric research, given the significantly increased risk of PDPH and the need for epidural blood patching (Heard 2002). Four studies in this review (Kim 1995; Salman 2013; Thoren 1994; Uysallar 2011) used Quinke spinal needles in both the SSS and CSE groups. The remaining studies used a variety of atraumatic spinal needles, including Whitacre, Sprotte, Gertie Marx and other pencil‐point varieties for the SSS and CSE groups. Six studies (Abizanda 2007; Choi 2006; Horstman 2009; Lew 2004; McAndrew 2003; Ross 2014) mentioned the use of spinal needle introducers, ranging between 19‐ and 20‐gauge needles, except for McAndrew 2003 who did not specify the gauge of introducer used.
All CSE were inserted using Tuohy needles ranging from 16‐gauge to 19‐gauge in size. Thirteen studies inserted epidural catheters as part of the CSE technique, although only three studies specified the gauge of catheter (Brizzi 2005; Choi 2006; Uysallar 2011). Choi 2006 was the only study to use a 'sham catheter' stuck to the participant's back in the SSS group to ensure blinding of the participant to the technique used. The remaining studies either did not mention catheter insertion (Abizanda 2007; Macfarlane 2009) or did not insert one at all (Horstman 2009; Ithnin 2006; Lim 2006).
Outcomes
Ten of the studies included in this review stated that they conducted a pre‐study power analysis relating to their primary outcome. The remaining eight studies (Abizanda 2007; Brizzi 2005; Fabris 2013a; Kim 1995; Kim 1997; Kim 2003; Thoren 1994; Uysallar 2011) did not mention power analysis but did describe primary outcomes.
Of the 10 studies with primary outcomes supported by a stated power analysis, peak sensory level was the most common primary outcome (Horstman 2009; Ithnin 2006; Lim 2006; Salman 2013; Tyagi 2009). Primary outcomes related to hypotension were the next most common (Choi 2006; Lew 2004; Macfarlane 2009), followed by the incidence of paraesthesia during insertion of block (McAndrew 2003) and time from insertion of introducer to intrathecal injection (Ross 2014). One study (Kim 2003) compared three different types of sensory modalities to evaluate differences in maximal sensory block level; this was not an outcome of this review.
Excluded studies
The three studies excluded from this review can be found under the Excluded studies section and the reason for their exclusion in the table of Characteristics of excluded studies. The excluded studies examined postoperative pain relief, which is not relevant for this review.
Risk of bias in included studies
There was a wide range of methodological quality. Overall, the studies were at moderate risk of bias. Details are shown in the table of Characteristics of included studies. Also see Figure 2; and Figure 3 for summaries of ’Risk of bias’ assessments for all studies.

Risk of bias graph: review authors' judgements about each risk of bias item presented as percentages across all included studies.
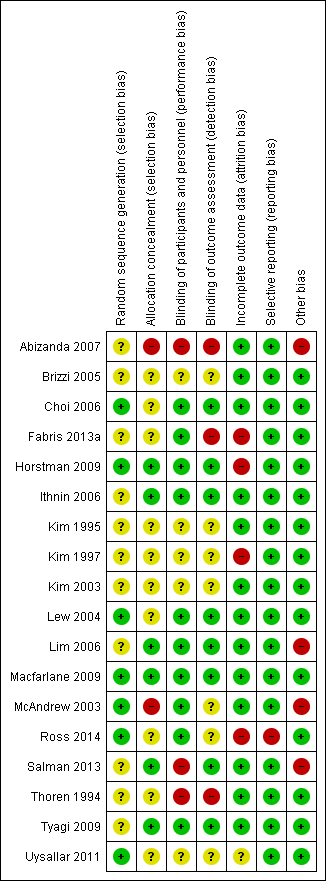
Risk of bias summary: review authors' judgements about each risk of bias item for each included study.
Allocation
Sequence generation
All included studies stated that women were randomised into either group. Randomisation was achieved in seven studies using computer generation (Choi 2006; Horstman 2009; Lew 2004; Macfarlane 2009; McAndrew 2003; Ross 2014; Uysallar 2011) and we rated them at low risk of bias. We rated the remaining 11 studies at unclear risk of bias because there was no information provided about the generation of randomisation (Abizanda 2007; Brizzi 2005; Fabris 2013a; Ithnin 2006; Kim 1995; Kim 1997; Kim 2003; Lim 2006; Salman 2013; Thoren 1994; Tyagi 2009).
Allocation concealment
We judged allocation concealment to be at low risk of bias in studies which used sealed opaque envelopes (Horstman 2009; Ithnin 2006; Lim 2006; Macfarlane 2009; Salman 2013; Tyagi 2009). Whilst McAndrew 2003 also used 'sealed envelopes' the allocation of operator was not randomised or concealed and there were three grades of operator experience involved; it is possible that some selection bias may have been generated at this point. We therefore assessed McAndrew 2003 as being at high risk of selection bias. We judged one other study (Abizanda 2007) as high risk of bias, because the anaesthetist revealed the allocation.
In Ross 2014, a binder was used but it was not clear whether the pages were sealed, opaque, or interchangeable, so we assessed this study as being at unclear risk of selection bias. The remaining nine studies did not report on a concealment method (Brizzi 2005; Choi 2006; Fabris 2013a; Kim 1995; Kim 1997; Kim 2003; Lew 2004; Thoren 1994; Uysallar 2011).
Blinding
Performance bias
For all studies included, it was impossible to blind the proceduralist performing the technique.
Detection bias
Eight studies had adequate blinding of assessors and were assessed as being at low risk of detection bias (Choi 2006; Horstman 2009; Ithnin 2006; Lew 2004; Lim 2006; Macfarlane 2009; Salman 2013; Tyagi 2009). In contrast, there was no blinding of assessors in three studies (Abizanda 2007; Fabris 2013a; Thoren 1994) and we rated these at a high risk of detection bias. Risk of detection bias was unclear in seven studies: six because there was insufficient information in the trial report to permit assessment (Brizzi 2005; Kim 1995; Kim 1997; Kim 2003; Ross 2014; Uysallar 2011), and in McAndrew 2003 the use of a blinded observer was attempted but proved unworkable.
Incomplete outcome data
Eight of the studies explicitly mentioned that there was no loss of participants and that intention‐to‐treat analysis was performed or implied as a result (Abizanda 2007; Brizzi 2005; Ithnin 2006; Kim 1995; Lew 2004; Lim 2006; Macfarlane 2009; Salman 2013); we assessed these as being at a low risk of attrition bias. Two studies (Thoren 1994; Tyagi 2009) did not mention any participant dropout and all participants appeared to be accounted for in the respective Results sections (low risk of bias). One study (Kim 2003) did not mention participant dropout and only some results stated the number of participants analysed, but we assessed this as low risk of attrition bias. McAndrew 2003 conducted an intention‐to‐treat analysis by including one woman in the CSE group despite the fact that she received only a SSS after experiencing persistent paraesthesia on insertion of the Tuohy needle (low risk of bias).
Uysallar 2011 reported no loss of participants but we deemed it to be at an unclear risk of bias because a number of outcomes were only reported as percentages, without absolute numbers.
Five studies excluded women based on: study protocol violation (Ross 2014, 3/44 or 7%), failed attempt at regional anaesthesia (Choi 2006, 2/102 or 2%; Kim 1997, 4/54 or 7%; Horstman 2009, 2/30 or 7%) and recognised dural puncture with Touhy needle during insertion of CSE (Fabris 2013a, 1/77 or 1%). We assessed Ross 2014, Kim 1997, Horstman 2009 and Fabris 2013a as being at high risk of attrition bias. We rated Choi 2006 at low risk of attrition bias because the data can be identified against the outcome of 'complications of the interventions'. These studies did not use intention‐to‐treat analysis. One study (Fabris 2013a) reported different numbers of participants in the abstract and Methods section and then misreported the numbers of women in a table of participant characteristics.
Selective reporting
We did not assess any trial protocols for this review, but all outcomes listed were reported within each paper, including any non‐significant findings. We rated one study (Ross 2014) at high risk of reporting bias as a number of secondary outcomes were first mentioned in the Results or Discussion sections. We judged the remaining 17 studies to be at low risk of reporting bias (Abizanda 2007; Brizzi 2005; Choi 2006; Fabris 2013a; Horstman 2009; Ithnin 2006; Kim 1995; Kim 1997; Kim 2003; Lew 2004; Lim 2006; Macfarlane 2009; McAndrew 2003; Salman 2013; Thoren 1994; Tyagi 2009; Uysallar 2011).
Other potential sources of bias
There were four studies which we deemed to be at a high risk for other sources of bias. Abizanda 2007 is a technical study assessing paraesthesia on needle insertion with subtle differences in needle placement. Without further information from the authors about drugs administered and any other secondary outcomes, we did not include the study data as part of this review. McAndrew 2003 had a significantly higher proportion of women with a high BMI in the SSS group compared to CSE, as well as a variety of positioning and techniques used within the study to insert the spinal or epidural needle. Hypotension was not defined, nor was any protocol provided for the administration of phenylephrine in Lim 2006. In Salman 2013, the spinal doses given varied according to height, which made the 'High‐dose versus low‐dose' categorisation problematic. As most women received a high‐dose spinal, we included this study as a 'high‐dose' spinal study.
We judged the remaining 14 studies to be at low risk of other potential sources of bias (Brizzi 2005; Choi 2006; Fabris 2013a; Horstman 2009; Ithnin 2006; Kim 1995; Kim 1997; Kim 2003; Lew 2004; Macfarlane 2009; Ross 2014; Thoren 1994; Tyagi 2009; Uysallar 2011).
Effects of interventions
See: Summary of findings for the main comparison Combined spinal‐epidural compared to high‐dose spinal for caesarean section; Summary of findings 2 Combined spinal‐epidural compared to low‐dose spinal for caesarean section
1.Combined spinal‐epidural compared to high‐dose spinal for caesarean section
Please see summary of findings Table for the main comparison.
Primary outcomes
Number of women requiring a repeat regional block or a general anaesthetic as a result of failure to establish adequate initial blockade
No studies examined this as a primary outcome, but seven studies reported it as a secondary outcome (Horstman 2009; Ithnin 2006; Lim 2006; Macfarlane 2009; McAndrew 2003; Thoren 1994; Uysallar 2011). With a total of only five events in just two of the studies (Horstman 2009; McAndrew 2003), there may be little or no difference in the number of women requiring a repeat regional block or a general anaesthetic as a result of failure to establish adequate initial blockade between CSE versus high‐dose spinal (risk ratio (RR) 0.32, 95% confidence interval (CI) 0.05 to 1.97; 7 studies, 341 women; low‐quality evidence; Analysis 1.1).
Number of women requiring supplemental intra‐operative analgesia at any time after CSE or spinal anaesthetic insertion
No studies examined the number of women requiring supplemental intra‐operative analgesia at any time after CSE or spinal anaesthetic insertion as a primary outcome, but seven studies reported it as a secondary outcome (Horstman 2009; Ithnin 2006; Lim 2006; Macfarlane 2009; Salman 2013; Thoren 1994; Uysallar 2011). Four of these studies had no events in both arms of the study, and in the other three studies (Salman 2013; Thoren 1994; Uysallar 2011) there was a total of 37 events. There was marked heterogeneity between these three studies and we used a random‐effects analysis (average RR 1.25, 95% CI 0.19 to 8.43; Tau2 = 2.31, I2 = 65%; 7 studies, 390 women; very low‐quality evidence; Analysis 1.2), which was not resolvable by subgroup analysis based on the predetermined CSE subgroups. Because of this heterogeneity and the very wide CI we are uncertain about this result.
Number of women requiring intra‐operative conversion to general anaesthesia
No studies examined the number of women requiring intra‐operative conversion to general anaesthesia as a primary outcome, but seven studies reported it as a secondary outcome (Horstman 2009; Ithnin 2006; Lim 2006; Macfarlane 2009; Salman 2013; Thoren 1994; Uysallar 2011). There was only one study (Thoren 1994) with any events, i.e. one in each group from a total of 42 women. Overall, we are uncertain about this result (RR 1.00, 95% CI 0.07 to 14.95; 7 studies, 388 women; Analysis 1.3).
Number of women satisfied with their anaesthesia
Kim 1995 and Thoren 1994 were the only two studies from the high‐dose spinal group to examine the number of women satisfied with their anaesthesia. This was tested by asking the women to rate their analgesia as either excellent, good, fair or poor. For the purposes of this review, we considered a rating of excellent or good analogous with this review's outcome of satisfaction with anaesthesia. We are uncertain about the results for this outcome, as it is based on very low‐quality evidence (RR 0.93, 95% CI 0.73 to 1.19 2 studies, 72 women; Analysis 1.4).
Secondary outcomes (maternal)
Mean time and standard deviation from start of the regional anaesthetic to effective anaesthesia for surgery
Five studies examined mean time and standard deviation from the start of the regional anaesthetic to effective anaesthesia for surgery as a secondary outcome (Kim 1995; Kim 1997; Macfarlane 2009; Thoren 1994; Uysallar 2011). Whilst the results generally appeared to favour the high‐dose spinal group, we observed substantial heterogeneity (I2 = 95%) and we therefore decided not to pool these results in meta‐analysis (see Analysis 1.5).
Number of women with intra‐operative hypotension requiring treatment or intervention specifically identified
Five studies reported on hypotension as a secondary outcome (Ithnin 2006; Kim 1997; Lim 2006; Thoren 1994; Uysallar 2011). All studies used either phenylephrine or ephedrine to treat the hypotension. We did not include Uysallar 2011, as they reported the number of hypotensive episodes rather than the incidence of hypotension. There was no evidence of a difference in the incidence of hypotension requiring treatment in women who received CSE (46/86) or high‐dose spinal (41/76) (RR 1.01, 95% CI 0.76 to 1.33; 4 studies, 162 women; Analysis 1.6).
Number of women with intra‐operative nausea or vomiting or both, requiring treatment or intervention specifically identified
Five studies reported nausea and vomiting as a secondary outcome (Ithnin 2006; Kim 1997; Lim 2006; Thoren 1994; Uysallar 2011), but only one study included an anti‐emetic as treatment for nausea or vomiting. Thoren 1994 used dixyrazine. There was an increased incidence of nausea or vomiting or both requiring treatment in women who received CSE (13/21) compared to high‐dose spinal (6/21) (RR 2.17, 95% CI 1.02 to 4.61; Analysis 1.7) but this result is based on just one small study involving 42 women.
Mean time and standard deviation from admission to discharge from the postanaesthesia recovery unit
No studies examined this outcome.
Number of women requiring follow‐up for an adverse outcome present at one month or more after the procedure and specifically identified: meningitis, neuropraxia, paralysis, backache, footdrop, unresolved post‐dural puncture headache (PDPH)
No studies examined these outcomes.
Number of women with a PDPH
Three studies reported this as a secondary outcome (Kim 1995; Ross 2014; Thoren 1994), with only Kim 1995 reporting any events (5/15 women in the CSE group and 6/15 women in the high‐dose spinal group) (RR 0.83, 95% CI 0.32 to 2.15; 3 studies, 113 women; Analysis 1.8). No women in the remaining studies experienced a headache (Ross 2014; Thoren 1994). One other study (Kim 1997) reported women who experienced a 'mild headache', which was deemed not to be PDPH.
Secondary outcomes (neonatal)
All neonatal outcomes reported were secondary outcomes, both in this review and in the studies reporting the outcome.
Number of neonates admitted to the neonatal unit
No studies reported this outcome.
Mean pH and standard deviation in the neonate for umbilical artery, umbilical vein, umbilical cord
One study (Uysallar 2011) reported this outcome. The mean pH was 7.25 in the CSE group and 7.26 in the high‐dose spinal group (standardised mean difference (SMD) −0.18, 95% CI −0.80 to 0.44; 40 babies; Analysis 1.9).
Number of neonates with Apgar scores less than seven at five minutes
Four studies (Kim 1997; Macfarlane 2009; Thoren 1994; Uysallar 2011) reported this outcome; there were no babies who had an Apgar score less than seven at five minutes (4 studies, 182 babies; Analysis 1.10.
2. Combined spinal‐epidural compared to low‐dose spinal for caesarean section
Please see summary of findings Table 2.
Primary outcomes
Number of women requiring a repeat regional block or a general anaesthetic as a result of failure to establish adequate initial blockade
There may be little or no difference between the CSE and low‐dose spinal groups in the number of women requiring a repeat regional block or general anaesthetic as a result of failure to establish adequate initial blockade (RR 4.81, 95% CI 0.24 to 97.80; 3 studies, 224 women; low‐quality evidence; Analysis 2.1). No studies examined this as a primary outcome but three studies reported it as a secondary outcome (Choi 2006; Lew 2004; Tyagi 2009). There were zero events in Lew 2004 and Tyagi 2009, but in Choi 2006 (102 women), two women in the CSE group required a repeat regional block or general anaesthetic as a result of failure to establish initial blockade.
Number of women requiring supplemental intra‐operative analgesia at any time after CSE or spinal anaesthetic insertion
No studies examined this as a primary outcome but four studies reported it as a secondary outcome (Choi 2006; Fabris 2013a; Lew 2004; Tyagi 2009). Only two studies (Fabris 2013a; Lew 2004) had any events. There is probably little or no difference in the number of women requiring supplemental intra‐operative analgesia at any time after CSE or spinal anaesthetic insertion between the CSE (12/68) or low‐dose spinal (7/70) group (RR 1.75, 95% CI 0.78 to 3.92; 4 studies, 298 women; moderate‐quality evidence; Analysis 2.2).
Number of women requiring intra‐operative conversion to general anaesthesia
No studies examined this as a primary outcome but three studies reported it as a secondary outcome (Choi 2006; Lew 2004; Tyagi 2009). As there were no events in both arms of all three studies it was not possible to draw any conclusions (3 studies, 222 women; low‐quality evidence; Analysis 2.3).
Number of women satisfied with their anaesthesia
No studies examined the number of women satisfied with their anaesthesia.
Secondary outcomes (maternal)
Mean time and standard deviation from start of the regional anaesthetic to effective anaesthesia for surgery
Two studies examined this as a secondary outcome (Choi 2006; Tyagi 2009). Low‐dose spinal had a slightly faster mean time to onset compared to CSE (SMD 0.85 minutes, 95% CI 0.52 to 1.18; 2 studies, 160 women; Analysis 2.4).
Number of women with intra‐operative hypotension requiring treatment or intervention specifically identified
Four studies reported on hypotension as a secondary outcome (Brizzi 2005; Choi 2006; Fabris 2013a; Tyagi 2009). All studies used either phenylephrine or ephedrine to treat the hypotension. CSE had a reduced incidence of hypotension requiring treatment (52/179) compared with low‐dose spinal (79/157). We observed substantial heterogeneity in our analysis and used a random‐effects model (average RR 0.59, 95% CI 0.38 to 0.93; I2 = 53%, Tau2 = 0.11; 4 studies, 336 women; Analysis 2.5).
Number of women with intra‐operative nausea or vomiting or both, requiring treatment or intervention specifically identified
Four studies reported nausea and vomiting as a secondary outcome (Brizzi 2005; Choi 2006; Fabris 2013a; Tyagi 2009), but only one of the studies included an anti‐emetic as treatment for nausea or vomiting; Brizzi 2005 used ondansetron. There were similar numbers of women with nausea or vomiting requiring treatment in the CSE group (3/50) compared with low‐dose spinal (6/50) (RR 0.50, 95% CI 0.13 to 1.89; 1 study, 100 women; Analysis 2.6).
Mean time and standard deviation from admission to discharge from the postanaesthesia recovery unit
No studies examined this outcome.
Number of women requiring follow‐up for an adverse outcome present at one month or more after the procedure and specifically identified: meningitis, neuropraxia, paralysis, backache, footdrop, unresolved PDPH
No studies examined these outcomes.
Number of women with a PDPH
Two studies measured this as a secondary outcome (Fabris 2013a; Lew 2004), but there were no events in either study (2 studies, 138 women; Analysis 2.7).
Secondary outcomes (neonatal)
All neonatal outcomes reported were secondary outcomes in both this review and the studies reporting the outcome.
Number of neonates admitted to the neonatal unit
No studies reported this outcome.
Mean pH and standard deviation in the neonate for umbilical artery, umbilical vein, umbilical cord
One study (Fabris 2013a) reported this outcome. There was no clinical difference in neonatal blood pH between infants born to mothers who received CSE or low‐dose spinal anaesthesia, despite a higher pH level detected in babies born to mothers who received CSE compared with those who received low‐dose spinal study (SMD 1.17, 95% CI 0.68 to 1.66; 1 study, 76 babies; Analysis 2.8).
Number of neonates with Apgar scores less than seven at five minutes
Only one study (Tyagi 2009) examined this outcome; there were no infants with an Apgar scores less than seven at five minutes born to mothers who received CSE or low‐dose spinal (1 study, 60 babies; Analysis 2.9).
Discusión
Resumen de los resultados principales
El grupo de evidencia identificada mediante esta revisión se basa en 18 estudios con 1272 mujeres participantes; sin embargo, todos los análisis se basan en un número mucho menor de estudios y de mujeres. Se comparó el efecto de la anestesia raquídea‐epidural combinada (REC) con la anestesia raquídea en dosis alta (Comparación 1) o la anestesia raquídea (RSA) en dosis baja (Comparación 2).
Para las medidas de resultado primarias no hubo evidencia de diferencias en los estudios que compararon la anestesia REC con la raquídea en dosis altas (10 mg o más de bupivacaína), ni en los que compararon la anestesia REC con la raquídea en dosis bajas (menos de 10 mg de bupivacaína). Las cuatro medidas de resultado primarias fueron el número de mujeres que necesitaron un bloqueo regional repetido o un anestésico general como resultado del fracaso para establecer un bloqueo inicial adecuado; analgesia intraoperatoria complementaria en cualquier momento después de la REC o la inserción de anestesia raquídea; conversión intraoperatoria a anestesia general; y satisfacción con el tipo de anestesia administrada. En general, la calidad de la evidencia para los resultados primarios y relevantes para GRADE varió de moderada a muy baja (Resumen de hallazgos, tabla 1; Resumen de los hallazgos, tabla 2).
Se encontraron algunas diferencias en cuanto a los resultados maternos secundarios, pero ninguna diferencia clínicamente significativa para los resultados neonatales. Debido a la heterogeneidad significativa no se combinaron los datos para la anestesia REC versus dosis alta de raquídea para el resultado anestesia efectiva, pero el tiempo medio hasta la anestesia efectiva fue menor en las mujeres que recibieron dosis bajas de raquídea en comparación con REC. Sin embargo, es poco probable que la magnitud de esta diferencia sea clínicamente significativa.
Con respecto a los efectos secundarios maternos, no hubo evidencia de una diferencia en cuanto a la incidencia de hipotensión que requirió tratamiento en las mujeres que recibieron REC en comparación con la raquídea en dosis altas, aunque pareció haber una reducción en la incidencia de hipotensión que requirió tratamiento en las mujeres que recibieron REC en comparación con raquídea en dosis bajas.
Hubo una mayor incidencia de náuseas y vómitos que requirieron tratamiento en las mujeres que recibieron REC (13/21), en comparación con las que recibieron dosis altas de raquídea (6/21). Esta diferencia no se observó en la comparación REC (3/50) versus dosis bajas de raquídea (6/50).
Hubo una tasa similar de cefalea posterior a la punción dural en las mujeres que recibieron REC (5/56) o una dosis alta de raquídea (6/57), y no se informaron casos de cefalea posterior a la punción dural en los estudios que compararon REC con una dosis baja de raquídea. Ningún estudio informó sobre mujeres que requirieran seguimiento por un resultado adverso presente al mes o más después del procedimiento. Ningún recién nacido tuvo una puntuación de Apgar menor de 7 a los cinco minutos, independientemente de la dosis o el tipo de anestesia que recibió la madre.
Compleción y aplicabilidad general de las pruebas
Hubo 11 ensayos en la comparación REC versus raquídea en dosis alta y cinco ensayos en la comparación REC versus raquídea en dosis baja (Abizanda 2007; Kim 2003 no proporcionó datos para el análisis). Las participantes fueron relativamente homogéneas: todos los ensayos incluyeron mujeres sanas a término, con la excepción de un estudio que examinó específicamente mujeres con obesidad (Ross 2014). Por lo tanto, estos resultados se pueden aplicar a grupos de mujeres sanas a las que se les realiza una cesárea.
Los ensayos se realizaron en países occidentales que incluyeron Europa (Brizzi 2005; Fabris 2013a; Macfarlane 2009; Thoren 1994), Turquía (Salman 2013; Uysallar 2011), EE.UU. y Australia (Horstman 2009; McAndrew 2003; Ross 2014) y en regiones orientales como Asia (Choi 2006; Ithnin 2006; Kim 1995; Kim 1997; Lew 2004; Lim 2006) e India (Tyagi 2009). Por lo tanto, la evidencia es aplicable a una amplia variedad de poblaciones.
Calidad de la evidencia
Desde un punto de vista estrictamente metodológico, la mayoría de los estudios incluidos se deben considerar de calidad moderada. Para todos los estudios incluidos es imposible el cegamiento del profesional que realizó la técnica, pero algo menos de la mitad de los estudios se calificaron como riesgo alto o incierto de sesgo, ya que no estaba claro si los evaluadores estaban cegados. Esta es una consideración importante para los estudios futuros. Además, más de la mitad de los estudios no indicaron si se realizó la asignación al azar, y solo el 40% de los estudios incluidos utilizaron la asignación al azar generada por computadora.
Para la comparación REC versus dosis altas de raquídea, las evaluaciones GRADE variaron de bajas a muy bajas; las decisiones sobre la disminución de la calidad se basaron en la imprecisión (tamaños de muestra pequeños, intervalos de confianza amplios que cruzan la línea de ningún efecto), la inconsistencia (heterogeneidad inexplicable) y las limitaciones en el diseño del estudio (riesgos de sesgo). Ver "Resumen de resultados", tabla 1.
Para la comparación REC versus dosis bajas de raquídea, las evaluaciones GRADE variaron de moderadas a bajas; las decisiones para disminuir la calidad se basaron en la imprecisión (p.ej. tamaños de muestra pequeños, intervalos de confianza amplios que cruzan la línea de ningún efecto, cero eventos). Ver "Resumen de resultados", tabla 2.
Tres estudios (Brizzi 2005; Kim 1995; Kim 1997) no informaron haber obtenido la aprobación previa del comité de ética y estos estudios tampoco mencionaron si los participantes en el ensayo dieron su consentimiento informado por escrito. Estos estudios se incluyeron en la revisión después de obtener el asesoramiento del Grupo Cochrane de Embarazo y Parto. La obtención de la aprobación previa del comité de ética y el consentimiento informado son requisitos fundamentales para los ensayos controlados aleatorios contemporáneos, por lo que esta es una consideración importante para las revisiones futuras.
Sesgos potenciales en el proceso de revisión
La calidad se evaluó según los métodos descritos en el Manual Cochrane para las Revisiones Sistemáticas de Intervenciones (Cochrane Handbook for Systematic Reviews of Interventions) (Higgins 2011). Además de la búsqueda en el Registro Especializado de Ensayos Controlados del Grupo Cochrane de Embarazo y Parto (Cochrane Pregnancy and Childbirth Group's Trials Register), se realizaron búsquedas en ClinicalTrials.gov, la WHO International Clinical Trials Registry Platform (ICTRP) y en las actas de congresos para obtener informes y resúmenes de ensayos no publicados, planificados y en curso. En esta revisión se realizó una búsqueda exhaustiva y sistemática en las bases de datos para reducir la posibilidad de sesgo de publicación y no se aplicaron restricciones de idioma, fecha o estado de publicación. Dos revisores verificaron de manera independiente todos los procesos de la revisión. En caso de desacuerdo participaron un tercer y un cuarto revisores. Se estableció contacto con los autores de protocolos de estudios publicados y se les preguntó el estado real y si había datos disponibles para su inclusión en la revisión actual. Por lo tanto, es posible asegurar que se identificaron todos los ensayos que cumplieron los criterios.
Acuerdos y desacuerdos con otros estudios o revisiones
No se identificaron otros estudios o revisiones que abordaran esta área de investigación.
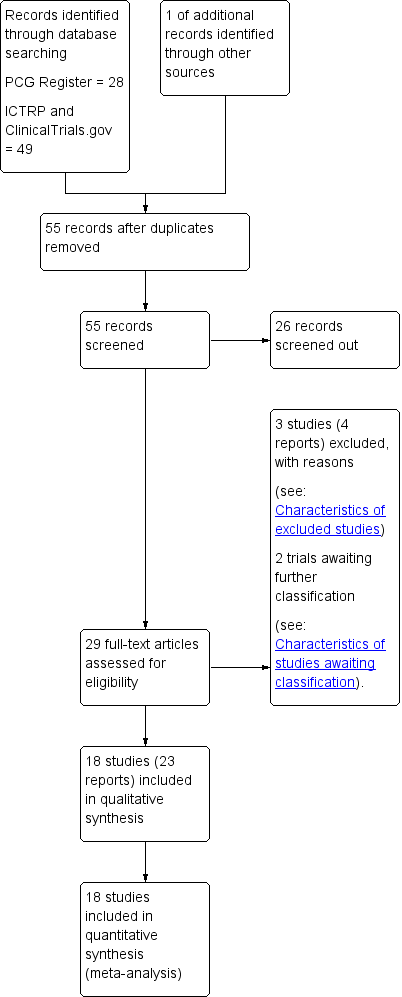
Study flow diagram.
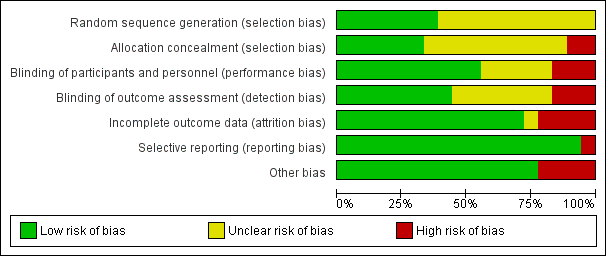
Risk of bias graph: review authors' judgements about each risk of bias item presented as percentages across all included studies.

Risk of bias summary: review authors' judgements about each risk of bias item for each included study.

Comparison 1 CSE versus high‐dose spinal, Outcome 1 Number of women requiring a repeat regional block or a general anaesthetic as a result of failure to establish adequate initial blockade.

Comparison 1 CSE versus high‐dose spinal, Outcome 2 Number of women requiring supplemental intra‐operative analgesia at any time after CSE or spinal anaesthetic insertion.
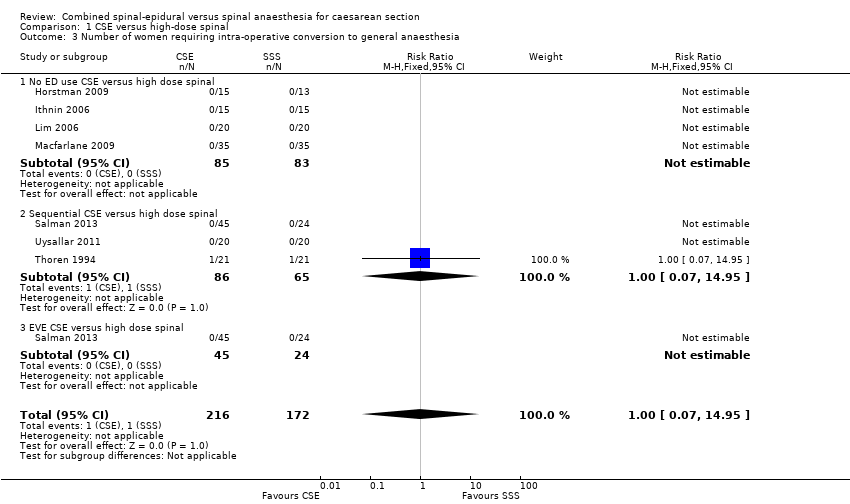
Comparison 1 CSE versus high‐dose spinal, Outcome 3 Number of women requiring intra‐operative conversion to general anaesthesia.
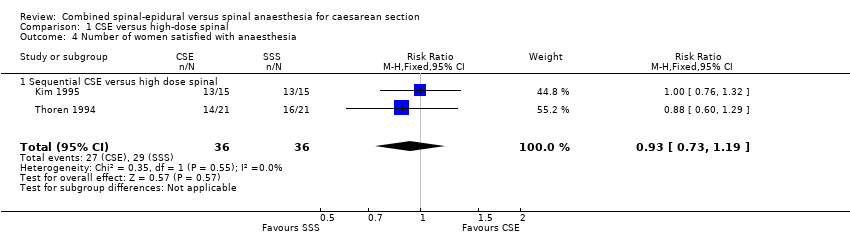
Comparison 1 CSE versus high‐dose spinal, Outcome 4 Number of women satisfied with anaesthesia.
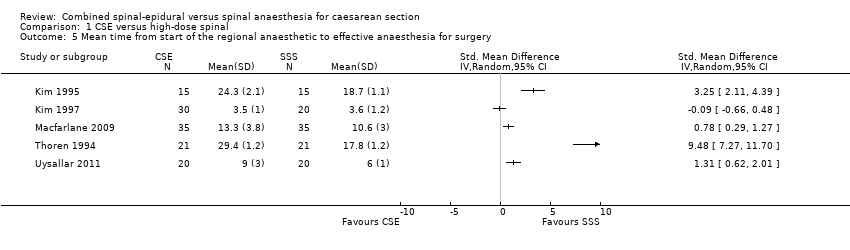
Comparison 1 CSE versus high‐dose spinal, Outcome 5 Mean time from start of the regional anaesthetic to effective anaesthesia for surgery.

Comparison 1 CSE versus high‐dose spinal, Outcome 6 Number of women with hypotension.
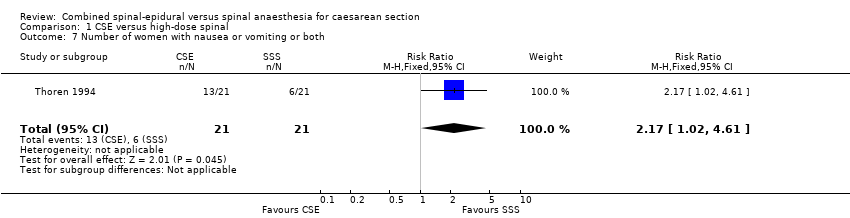
Comparison 1 CSE versus high‐dose spinal, Outcome 7 Number of women with nausea or vomiting or both.
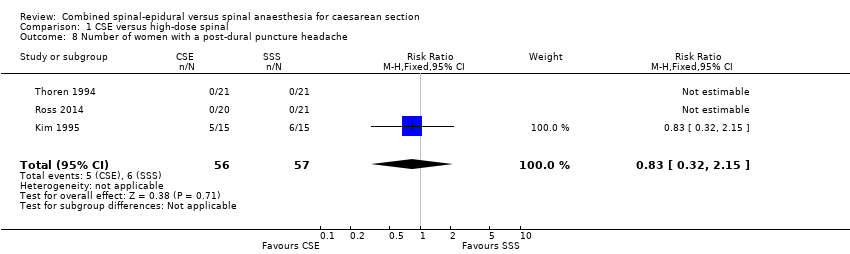
Comparison 1 CSE versus high‐dose spinal, Outcome 8 Number of women with a post‐dural puncture headache.
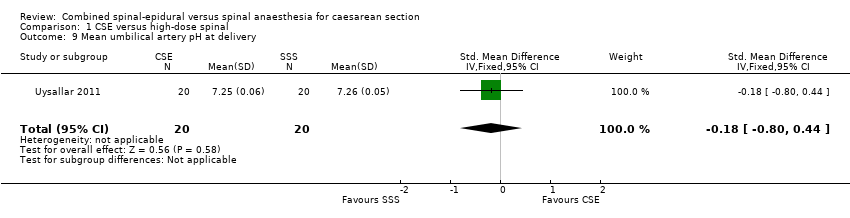
Comparison 1 CSE versus high‐dose spinal, Outcome 9 Mean umbilical artery pH at delivery.
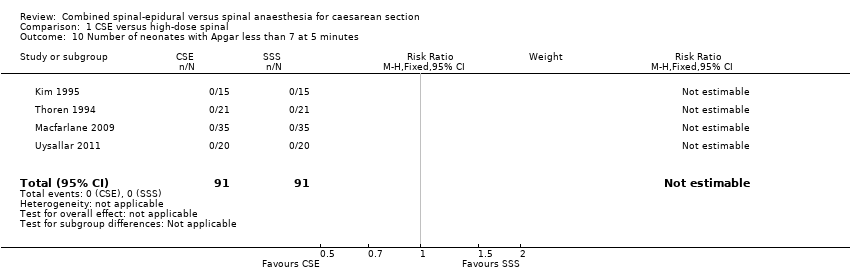
Comparison 1 CSE versus high‐dose spinal, Outcome 10 Number of neonates with Apgar less than 7 at 5 minutes.

Comparison 2 CSE versus low‐dose spinal, Outcome 1 Number of women requiring a repeat regional block or a general anaesthetic as a result of failure to establish adequate initial blockade.
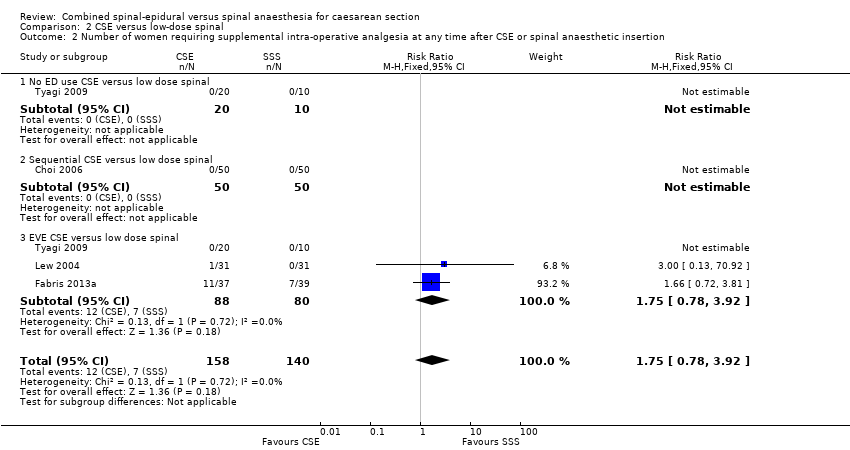
Comparison 2 CSE versus low‐dose spinal, Outcome 2 Number of women requiring supplemental intra‐operative analgesia at any time after CSE or spinal anaesthetic insertion.

Comparison 2 CSE versus low‐dose spinal, Outcome 3 Number of women requiring intra‐operative conversion to general anaesthesia.
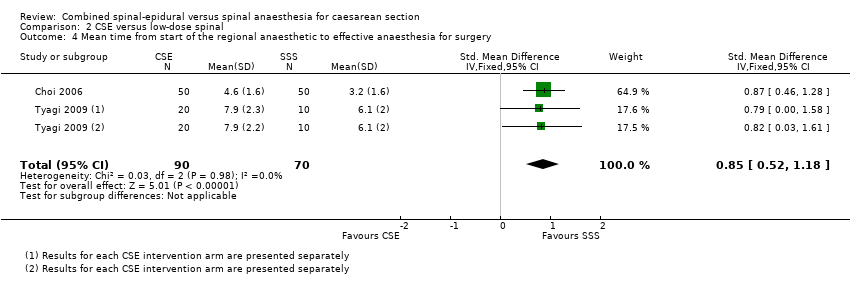
Comparison 2 CSE versus low‐dose spinal, Outcome 4 Mean time from start of the regional anaesthetic to effective anaesthesia for surgery.

Comparison 2 CSE versus low‐dose spinal, Outcome 5 Number of women with hypotension.

Comparison 2 CSE versus low‐dose spinal, Outcome 6 Number of women with nausea or vomiting or both.

Comparison 2 CSE versus low‐dose spinal, Outcome 7 Number of women with a post‐dural puncture headache.
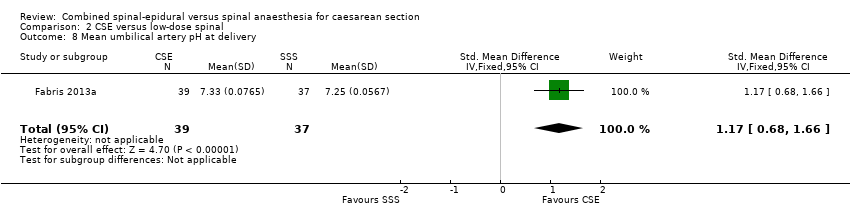
Comparison 2 CSE versus low‐dose spinal, Outcome 8 Mean umbilical artery pH at delivery.

Comparison 2 CSE versus low‐dose spinal, Outcome 9 Number of neonates with Apgar less than 7 at 5 minutes.
| CSE compared to high‐dose spinal for caesarean section | ||||||
| Patient or population: women having a caesarean section Setting: university or national hospitals | ||||||
| Outcomes | Anticipated absolute effects* (95% CI) | Relative effect | № of participants | Certainty of the evidence | Comments | |
| Risk with high‐dose spinal | Risk with CSE | |||||
| Number of women requiring a repeat regional block or a general anaesthetic as a result of failure to establish adequate initial blockade | Study population | RR 0.32 | 341 | ⊕⊕⊝⊝ | ‐ | |
| 69 per 1000 | 22 per 1000 | |||||
| Number of women requiring supplemental intra‐operative analgesia at any time after CSE or spinal anaesthetic insertion | Study population | Average RR 1.25 | 390 | ⊕⊝⊝⊝ | ‐ | |
| 124 per 1000 | 154 per 1000 | |||||
| Number of women requiring intra‐operative conversion to general anaesthesia | Study population | RR 1.00 | 388 | ⊕⊝⊝⊝ | ‐ | |
| 48 per 1000 | 48 per 1000 | |||||
| Number of women satisfied with anaesthesia | Study population | RR 0.93 (0.73 to 1.19) | 72 | ⊕⊝⊝⊝ | ‐ | |
| 806 per 1000 | 749 per 1000 | |||||
| *The risk in the intervention group (and its 95% confidence interval) is based on the assumed risk in the comparison group and the relative effect of the intervention (and its 95% CI). | ||||||
| GRADE Working Group grades of evidence | ||||||
| aSmall sample size and wide confidence interval crossing the line of no effect (imprecision −1). | ||||||
| CSE compared to low‐dose spinal for caesarean section | ||||||
| Patient or population: women having a caesarean section Setting: university or national hospitals | ||||||
| Outcomes | Anticipated absolute effects* (95% CI) | Relative effect | № of participants | Certainty of the evidence | Comments | |
| Risk with low‐dose spinal | Risk with CSE | |||||
| Number of women requiring a repeat regional block or a general anaesthetic as a result of failure to establish adequate initial blockade | Study population | RR 4.81 | 224 | ⊕⊕⊝⊝ | ‐ | |
| 0 per 1000 | 0 per 1000 | |||||
| Number of women requiring supplemental intra‐operative analgesia at any time after CSE or spinal anaesthetic insertion | Study population | RR 1.75 | 298 | ⊕⊕⊕⊝ | ‐ | |
| 100 per 1000 | 175 per 1000 | |||||
| Number of women requiring intra‐operative conversion to general anaesthesia | Study population | ‐ | 222 | ⊕⊕⊝⊝ | Effect is uncertain. No women in these 3 RCTs required a conversion to general anaesthetic | |
| see comment | see comment | |||||
| Number of women satisfied with anaesthesia | Study population | ‐ | (0 studies) | ‐ | No data available in the included studies | |
| see comment | see comment | |||||
| *The risk in the intervention group (and its 95% confidence interval) is based on the assumed risk in the comparison group and the relative effect of the intervention (and its 95% CI). | ||||||
| GRADE Working Group grades of evidence | ||||||
| aSmall sample size and very wide confidence interval crossing the line of no effect (imprecision −2). | ||||||
|
| CSE: Needle‐through‐needle | CSE: Two injection | ||||
| SPINAL | No ED use | Sequential | EVE | No ED use | Sequential | EVE |
| High‐dose | ‐ | ‐ | ‐ | |||
| Low‐dose | ‐ | ‐ | ||||
| Abizanda 2007 is not included in this table as the doses of drugs used and the mode of administration were not stated | ||||||
| Outcome or subgroup title | No. of studies | No. of participants | Statistical method | Effect size |
| 1 Number of women requiring a repeat regional block or a general anaesthetic as a result of failure to establish adequate initial blockade Show forest plot | 7 | 341 | Risk Ratio (M‐H, Fixed, 95% CI) | 0.32 [0.05, 1.97] |
| 1.1 No ED use CSE versus high dose spinal | 5 | 259 | Risk Ratio (M‐H, Fixed, 95% CI) | 0.32 [0.05, 1.97] |
| 1.2 Sequential CSE versus high dose spinal | 2 | 82 | Risk Ratio (M‐H, Fixed, 95% CI) | 0.0 [0.0, 0.0] |
| 2 Number of women requiring supplemental intra‐operative analgesia at any time after CSE or spinal anaesthetic insertion Show forest plot | 7 | 390 | Risk Ratio (M‐H, Random, 95% CI) | 1.25 [0.19, 8.43] |
| 2.1 No ED use CSE versus high dose spinal | 4 | 170 | Risk Ratio (M‐H, Random, 95% CI) | 0.0 [0.0, 0.0] |
| 2.2 Sequential CSE versus high dose spinal | 3 | 151 | Risk Ratio (M‐H, Random, 95% CI) | 1.99 [0.18, 21.49] |
| 2.3 EVE CSE versus high dose spinal | 1 | 69 | Risk Ratio (M‐H, Random, 95% CI) | 0.18 [0.01, 4.28] |
| 3 Number of women requiring intra‐operative conversion to general anaesthesia Show forest plot | 7 | 388 | Risk Ratio (M‐H, Fixed, 95% CI) | 1.0 [0.07, 14.95] |
| 3.1 No ED use CSE versus high dose spinal | 4 | 168 | Risk Ratio (M‐H, Fixed, 95% CI) | 0.0 [0.0, 0.0] |
| 3.2 Sequential CSE versus high dose spinal | 3 | 151 | Risk Ratio (M‐H, Fixed, 95% CI) | 1.0 [0.07, 14.95] |
| 3.3 EVE CSE versus high dose spinal | 1 | 69 | Risk Ratio (M‐H, Fixed, 95% CI) | 0.0 [0.0, 0.0] |
| 4 Number of women satisfied with anaesthesia Show forest plot | 2 | 72 | Risk Ratio (M‐H, Fixed, 95% CI) | 0.93 [0.73, 1.19] |
| 4.1 Sequential CSE versus high dose spinal | 2 | 72 | Risk Ratio (M‐H, Fixed, 95% CI) | 0.93 [0.73, 1.19] |
| 5 Mean time from start of the regional anaesthetic to effective anaesthesia for surgery Show forest plot | 5 | Std. Mean Difference (IV, Random, 95% CI) | Totals not selected | |
| 6 Number of women with hypotension Show forest plot | 4 | 162 | Risk Ratio (M‐H, Fixed, 95% CI) | 1.01 [0.76, 1.33] |
| 7 Number of women with nausea or vomiting or both Show forest plot | 1 | 42 | Risk Ratio (M‐H, Fixed, 95% CI) | 2.17 [1.02, 4.61] |
| 8 Number of women with a post‐dural puncture headache Show forest plot | 3 | 113 | Risk Ratio (M‐H, Fixed, 95% CI) | 0.83 [0.32, 2.15] |
| 9 Mean umbilical artery pH at delivery Show forest plot | 1 | 40 | Std. Mean Difference (IV, Fixed, 95% CI) | ‐0.18 [‐0.80, 0.44] |
| 10 Number of neonates with Apgar less than 7 at 5 minutes Show forest plot | 4 | 182 | Risk Ratio (M‐H, Fixed, 95% CI) | 0.0 [0.0, 0.0] |
| Outcome or subgroup title | No. of studies | No. of participants | Statistical method | Effect size |
| 1 Number of women requiring a repeat regional block or a general anaesthetic as a result of failure to establish adequate initial blockade Show forest plot | 3 | 224 | Risk Ratio (M‐H, Fixed, 95% CI) | 4.81 [0.24, 97.80] |
| 1.1 No ED use CSE versus low dose spinal | 1 | 30 | Risk Ratio (M‐H, Fixed, 95% CI) | 0.0 [0.0, 0.0] |
| 1.2 Sequential CSE versus low dose spinal | 1 | 102 | Risk Ratio (M‐H, Fixed, 95% CI) | 4.81 [0.24, 97.80] |
| 1.3 EVE CSE versus low dose spinal | 2 | 92 | Risk Ratio (M‐H, Fixed, 95% CI) | 0.0 [0.0, 0.0] |
| 2 Number of women requiring supplemental intra‐operative analgesia at any time after CSE or spinal anaesthetic insertion Show forest plot | 4 | 298 | Risk Ratio (M‐H, Fixed, 95% CI) | 1.75 [0.78, 3.92] |
| 2.1 No ED use CSE versus low dose spinal | 1 | 30 | Risk Ratio (M‐H, Fixed, 95% CI) | 0.0 [0.0, 0.0] |
| 2.2 Sequential CSE versus low dose spinal | 1 | 100 | Risk Ratio (M‐H, Fixed, 95% CI) | 0.0 [0.0, 0.0] |
| 2.3 EVE CSE versus low dose spinal | 3 | 168 | Risk Ratio (M‐H, Fixed, 95% CI) | 1.75 [0.78, 3.92] |
| 3 Number of women requiring intra‐operative conversion to general anaesthesia Show forest plot | 3 | 222 | Risk Ratio (M‐H, Fixed, 95% CI) | 0.0 [0.0, 0.0] |
| 3.1 No ED use CSE versus low dose spinal | 1 | 30 | Risk Ratio (M‐H, Fixed, 95% CI) | 0.0 [0.0, 0.0] |
| 3.2 Sequential CSE versus low dose spinal | 1 | 100 | Risk Ratio (M‐H, Fixed, 95% CI) | 0.0 [0.0, 0.0] |
| 3.3 EVE CSE versus low dose spinal | 2 | 92 | Risk Ratio (M‐H, Fixed, 95% CI) | 0.0 [0.0, 0.0] |
| 4 Mean time from start of the regional anaesthetic to effective anaesthesia for surgery Show forest plot | 2 | 160 | Std. Mean Difference (IV, Fixed, 95% CI) | 0.85 [0.52, 1.18] |
| 5 Number of women with hypotension Show forest plot | 4 | 336 | Risk Ratio (M‐H, Random, 95% CI) | 0.59 [0.38, 0.93] |
| 6 Number of women with nausea or vomiting or both Show forest plot | 1 | 100 | Risk Ratio (M‐H, Fixed, 95% CI) | 0.5 [0.13, 1.89] |
| 7 Number of women with a post‐dural puncture headache Show forest plot | 2 | 138 | Risk Ratio (M‐H, Fixed, 95% CI) | 0.0 [0.0, 0.0] |
| 8 Mean umbilical artery pH at delivery Show forest plot | 1 | 76 | Std. Mean Difference (IV, Fixed, 95% CI) | 1.17 [0.68, 1.66] |
| 9 Number of neonates with Apgar less than 7 at 5 minutes Show forest plot | 1 | 60 | Risk Ratio (M‐H, Fixed, 95% CI) | 0.0 [0.0, 0.0] |