| 1 Number of women requiring a repeat regional block or a general anaesthetic as a result of failure to establish adequate initial blockade Show forest plot | 7 | 341 | Risk Ratio (M‐H, Fixed, 95% CI) | 0.32 [0.05, 1.97] |
|
| 1.1 No ED use CSE versus high dose spinal | 5 | 259 | Risk Ratio (M‐H, Fixed, 95% CI) | 0.32 [0.05, 1.97] |
| 1.2 Sequential CSE versus high dose spinal | 2 | 82 | Risk Ratio (M‐H, Fixed, 95% CI) | 0.0 [0.0, 0.0] |
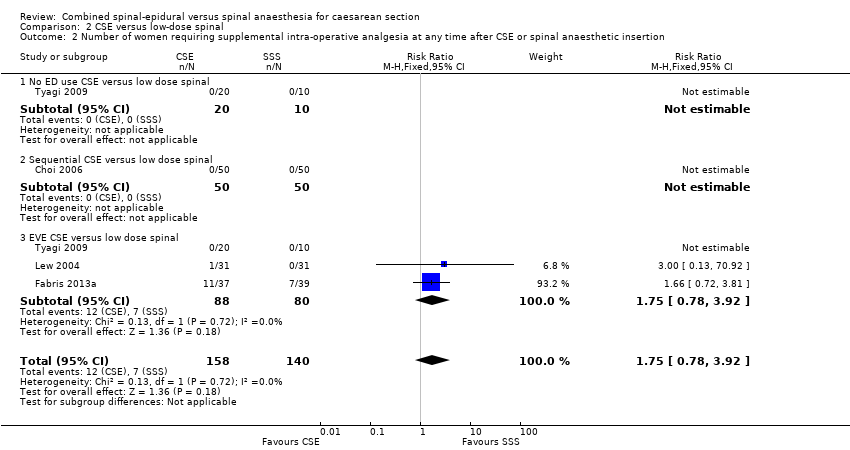
| 2 Number of women requiring supplemental intra‐operative analgesia at any time after CSE or spinal anaesthetic insertion Show forest plot | 7 | 390 | Risk Ratio (M‐H, Random, 95% CI) | 1.25 [0.19, 8.43] |
|
| 2.1 No ED use CSE versus high dose spinal | 4 | 170 | Risk Ratio (M‐H, Random, 95% CI) | 0.0 [0.0, 0.0] |
| 2.2 Sequential CSE versus high dose spinal | 3 | 151 | Risk Ratio (M‐H, Random, 95% CI) | 1.99 [0.18, 21.49] |
| 2.3 EVE CSE versus high dose spinal | 1 | 69 | Risk Ratio (M‐H, Random, 95% CI) | 0.18 [0.01, 4.28] |
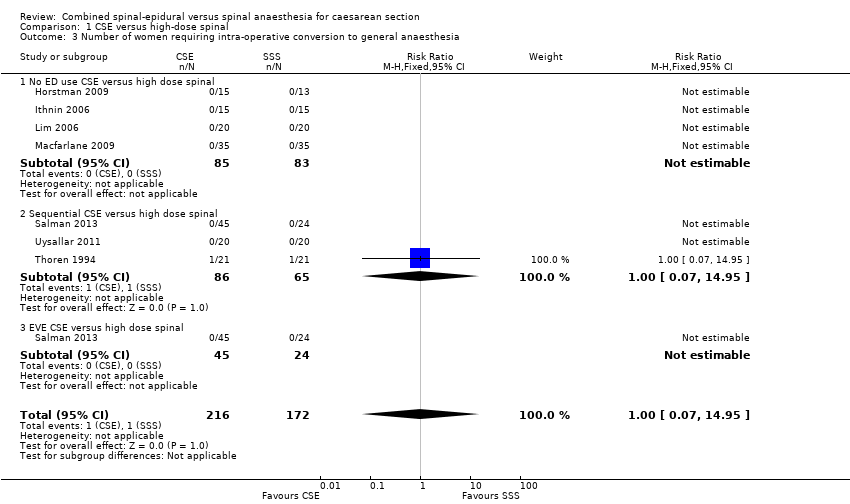
| 3 Number of women requiring intra‐operative conversion to general anaesthesia Show forest plot | 7 | 388 | Risk Ratio (M‐H, Fixed, 95% CI) | 1.0 [0.07, 14.95] |
|
| 3.1 No ED use CSE versus high dose spinal | 4 | 168 | Risk Ratio (M‐H, Fixed, 95% CI) | 0.0 [0.0, 0.0] |
| 3.2 Sequential CSE versus high dose spinal | 3 | 151 | Risk Ratio (M‐H, Fixed, 95% CI) | 1.0 [0.07, 14.95] |
| 3.3 EVE CSE versus high dose spinal | 1 | 69 | Risk Ratio (M‐H, Fixed, 95% CI) | 0.0 [0.0, 0.0] |
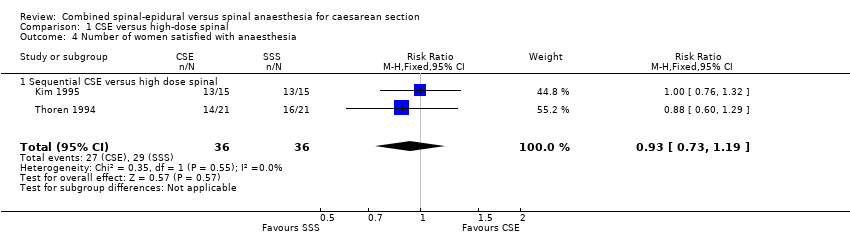
| 4 Number of women satisfied with anaesthesia Show forest plot | 2 | 72 | Risk Ratio (M‐H, Fixed, 95% CI) | 0.93 [0.73, 1.19] |
|
| 4.1 Sequential CSE versus high dose spinal | 2 | 72 | Risk Ratio (M‐H, Fixed, 95% CI) | 0.93 [0.73, 1.19] |
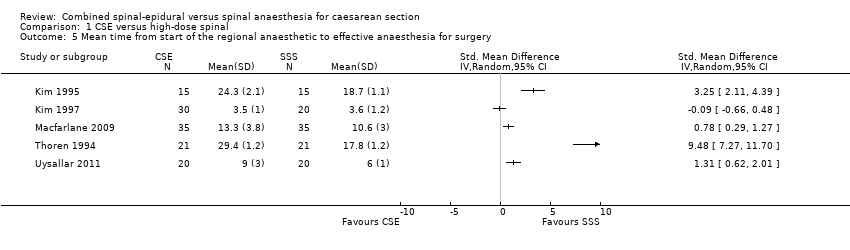
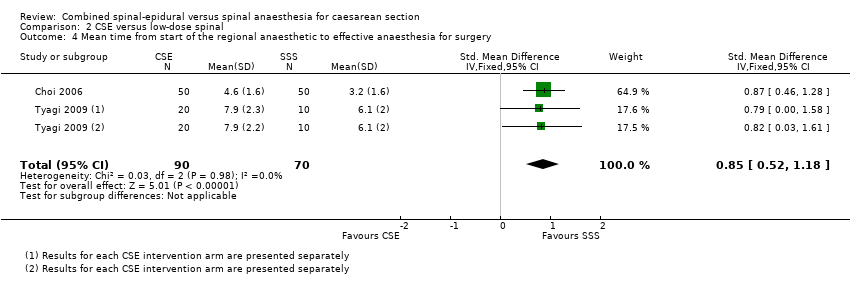
| 5 Mean time from start of the regional anaesthetic to effective anaesthesia for surgery Show forest plot | 5 | | Std. Mean Difference (IV, Random, 95% CI) | Totals not selected |
|
| 6 Number of women with hypotension Show forest plot | 4 | 162 | Risk Ratio (M‐H, Fixed, 95% CI) | 1.01 [0.76, 1.33] |
|
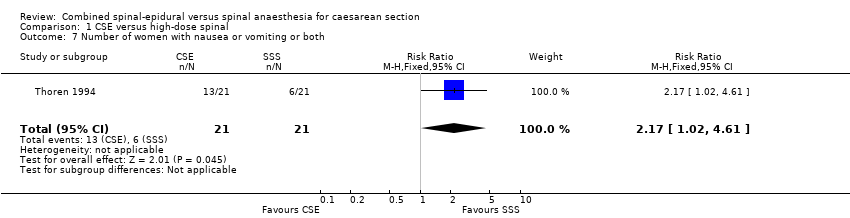
| 7 Number of women with nausea or vomiting or both Show forest plot | 1 | 42 | Risk Ratio (M‐H, Fixed, 95% CI) | 2.17 [1.02, 4.61] |
|
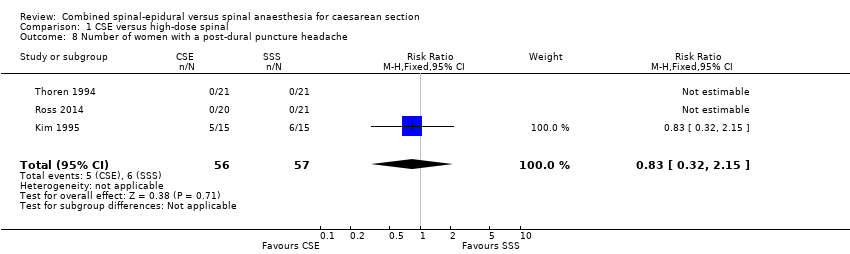
| 8 Number of women with a post‐dural puncture headache Show forest plot | 3 | 113 | Risk Ratio (M‐H, Fixed, 95% CI) | 0.83 [0.32, 2.15] |
|
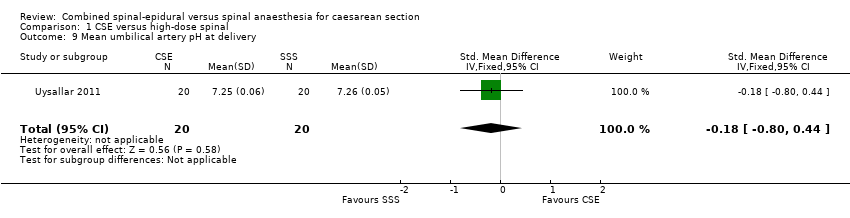
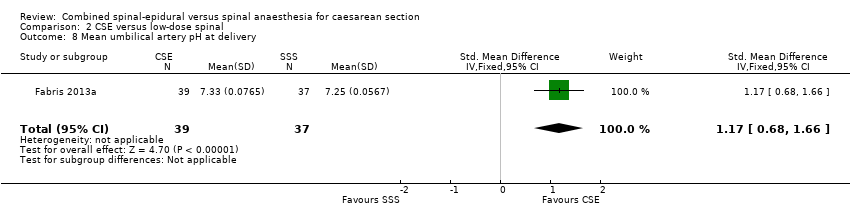
| 9 Mean umbilical artery pH at delivery Show forest plot | 1 | 40 | Std. Mean Difference (IV, Fixed, 95% CI) | ‐0.18 [‐0.80, 0.44] |
|
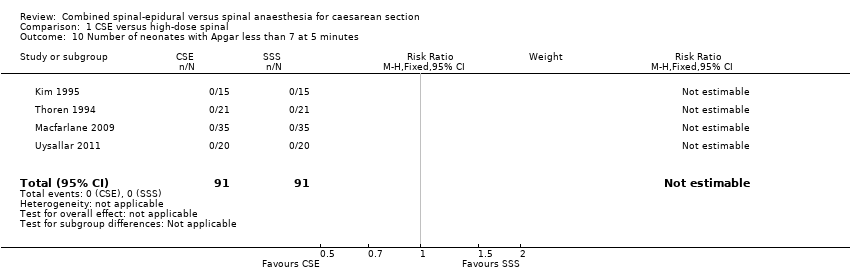
| 10 Number of neonates with Apgar less than 7 at 5 minutes Show forest plot | 4 | 182 | Risk Ratio (M‐H, Fixed, 95% CI) | 0.0 [0.0, 0.0] |
|