Anestesia raquídea‐epidural combinada versus anestesia raquídea para la cesárea
Información
- DOI:
- https://doi.org/10.1002/14651858.CD008100.pub2Copiar DOI

- Base de datos:
-
- Cochrane Database of Systematic Reviews
- Versión publicada:
-
- 10 octubre 2019see what's new
- Tipo:
-
- Intervention
- Etapa:
-
- Review
- Grupo Editorial Cochrane:
-
Grupo Cochrane de Embarazo y parto
- Copyright:
-
- Copyright © 2020 The Cochrane Collaboration. Published by John Wiley & Sons, Ltd.
Cifras del artículo
Altmetric:
Citado por:
Autores
Contributions of authors
The review was conceived by Drs Simmons, Cyna and Dennis as an extension of the previously published review comparing combined spinal‐epidural (CSE) and epidural block for labour analgesia. Dr Simmons, as the lead author on the most recent update of that review, was the guarantor for this review. Papers were independently reviewed by Drs Simmons, and Dennis for the initial round of reviews, and then with the updated reviews Drs Richardson, Dennis and Bright reviewed, with Dr Cyna providing arbitration as necessary.
Sources of support
Internal sources
-
Mercy Health, Australia.
Salary
-
Royal Womens Hospital, Australia.
Salary
-
Womens and Childrens Hospital, Australia.
Salary
External sources
-
National Health and Medical Research Council (NHMRC), Australia.
Alicia Dennis holds an NHMRC Fellowship APP1109598
Declarations of interest
Scott W Simmons: none known.
Alicia T Dennis holds an Australian National Health and Medical Research Council (NHMRC) Fellowship APP1109598.
Allan M Cyna was invited to speak at the Society of Paediatric Anaesthesia of New Zealand and Australia (SPANZA) annual scientific meeting (Oct 15‐18 2019) and his travel and accommodation expenses were reimbursed by SPANZA. Allan is also the Director of Studies for the South Australian Society of Hypnosis, for which he receives an honorarium. Allan is employed as a consultant anaesthetist by Women's and Children's Hospital, Adelaide, Australia, and the Nepean Hospital Penrith and Nepean Hospital Blue Mountains (both in New South Wales, Australia).
Matthew G Richardson: none known.
Matthew R Bright: none known.
Acknowledgements
Philippa Middleton for administrative support.
As part of the pre‐publication editorial process, this review has been commented on by three peers (an editor and two referees who are external to the editorial team), a member of Cochrane Pregnancy and Childbirth's international panel of consumers, and the Group's Statistical Adviser.
This project was supported by the National Institute for Health Research, via Cochrane Infrastructure funding to Cochrane Pregnancy and Childbirth. The views and opinions expressed therein are those of the authors and do not necessarily reflect those of the Systematic Reviews Programme, NIHR, NHS or the Department of Health.
We thank John A Crowhurst for his contribution to the protocol for this review (Simmons 2009).
Version history
| Published | Title | Stage | Authors | Version |
| 2019 Oct 10 | Combined spinal‐epidural versus spinal anaesthesia for caesarean section | Review | Scott W Simmons, Alicia T Dennis, Allan M Cyna, Matthew G Richardson, Matthew R Bright | |
| 2009 Oct 07 | Combined spinal‐epidural versus spinal anaesthesia for caesarean section | Protocol | Scott W Simmons, John A Crowhurst, Allan M Cyna, Alicia T Dennis | |
Differences between protocol and review
There are some differences between the published Cochrane protocol for this review (Simmons 2009) and this full review:
John A Crowhurst has left the review team. Matthew G Richardson and Matthew R Bright have joined the review team.
We identified additional trials from ClinicalTrials.gov and the WHO International Clinical Trials Registry Platform (ICTRP), using the search terms as outlined in Appendix 1, as well as searching the reference lists of retrieved studies.
We updated the Methods in line with the standard methods of Cochrane Pregnancy and Childbirth.
The original protocol did not include consideration of cluster‐randomised controlled trials. With the passage of time to the full review, we acknowledged that this study design has become somewhat more prevalent and we therefore included it, with such studies to be analysed according to the methods as described. We found no such studies.
We changed 'Types of participants' from 'Women having an elective caesarean section' in the protocol to 'Women having a caesarean'. We anticipated that included studies were likely to be conducted in an elective setting only. This change allowed for the inclusion of studies involving emergency caesareans as well, this being a common and important participant subgroup, which there was no reasonable basis to preclude.
We have stated in the full review that quasi‐RCTs are not being included.
In the protocol we distinguished between low‐dose and high‐dose spinals without providing any definition. We now provide a definition for 'low dose' in the full review.
The primary outcomes originally stated in the protocol were amended slightly for the full review, with a view to providing greater detail and clarity about important clinical endpoints as follows.
-
'Number of women requiring an additional intervention for anaesthesia at any time after CSE or spinal anaesthetic insertion' in the protocol was changed to 'Number of women requiring a repeat regional block or a general anaesthetic as a result of failure to establish adequate initial blockade'. This change provided greater detail about the type of additional intervention that may have been needed, and specifically in relation to the occurrence of failure of the regional block at the time of insertion, as opposed to at any time during the operation.
-
We added a new outcome to this review in the form of 'Number of women requiring supplemental intra‐operative analgesia at any time after combined spinal‐epidural or spinal anaesthetic insertion'. We included this to provide specific information about the need for supplementation, which is a lesser intervention than completely redoing the regional block or administering a general anaesthesia.
-
We amended 'Number of women requiring conversion to general anaesthesia' in the protocol to 'Number of women requiring intra‐operative conversion to general anaesthesia' to identify those women who experienced a block failure at any time during the procedure after the initial block establishment, such as for example with prolonged surgery, in which circumstance the use of a CSE could provide rescue not available with a single‐shot spinal.
For the full review we deleted the secondary outcome of 'Women fully breastfeeding at hospital discharge'. In recognising the importance to consumers of this outcome, we had included it in the protocol, but we acknowledged in undertaking the full review that this was unlikely to be significantly influenced by the interventions in this study. Future reviews may include a measure of the timeliness or the number of women able to initiate skin‐to‐skin contact intra‐operatively as being more directly determined by the mode of anaesthesia, especially for complications and failure rates.
For the full review we amended the secondary outcome 'Number of women with an intra‐operative complication requiring treatment or intervention specifically identified: pruritus, nausea and/or vomiting, hypotension, respiratory depression/arrest, sedation, high block' to the specific adverse events considered individually: 'Number of women with hypotension', 'Number of women with nausea and or vomiting', and 'Number of women with a post‐dural puncture headache'. This was to avoid potential confusion that may have arisen from this being seen as an aggregate measure versus each type of event being counted separately.
This review also excluded two studies Gurlit 2003 and Mueller 2010. Both of these studies compared SSS and CSE for caesarean section and only evaluated post‐operative pain relief, which was not relevant for our review.
PICO
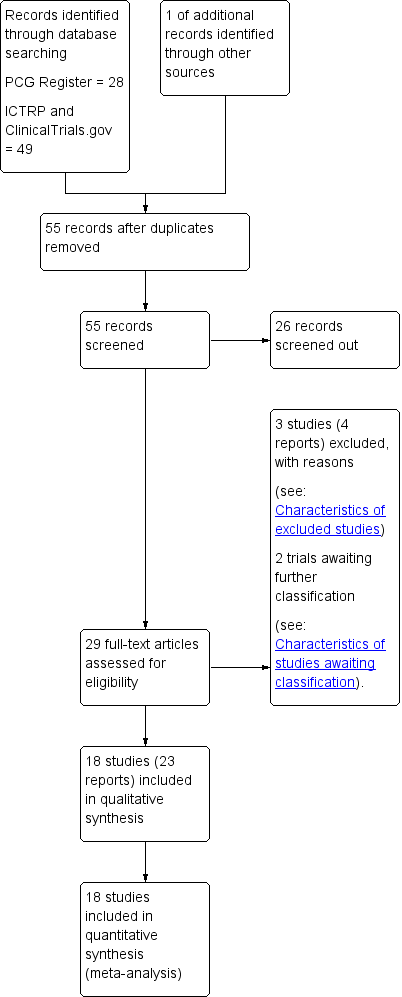
Study flow diagram.
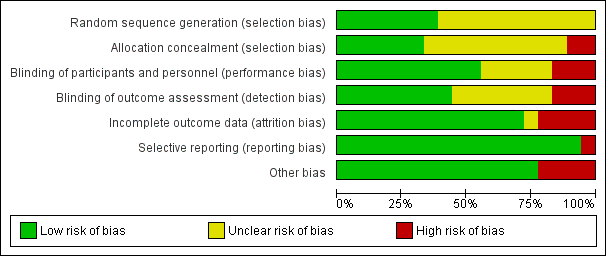
Risk of bias graph: review authors' judgements about each risk of bias item presented as percentages across all included studies.

Risk of bias summary: review authors' judgements about each risk of bias item for each included study.

Comparison 1 CSE versus high‐dose spinal, Outcome 1 Number of women requiring a repeat regional block or a general anaesthetic as a result of failure to establish adequate initial blockade.

Comparison 1 CSE versus high‐dose spinal, Outcome 2 Number of women requiring supplemental intra‐operative analgesia at any time after CSE or spinal anaesthetic insertion.
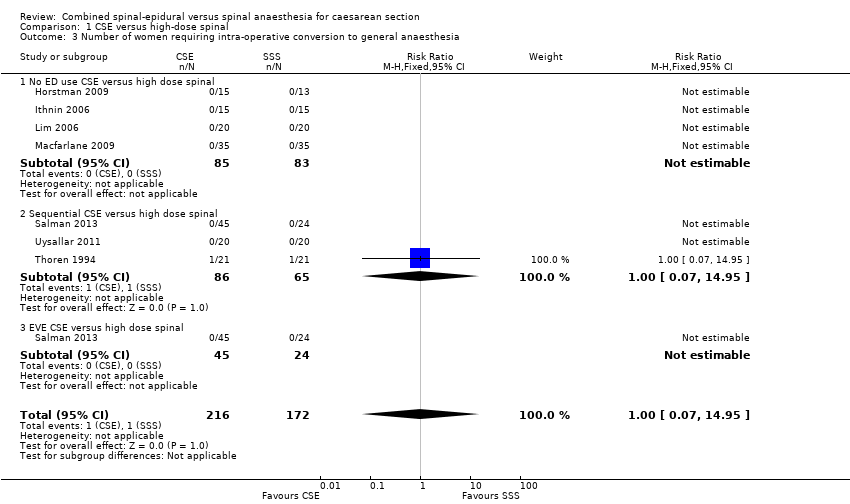
Comparison 1 CSE versus high‐dose spinal, Outcome 3 Number of women requiring intra‐operative conversion to general anaesthesia.
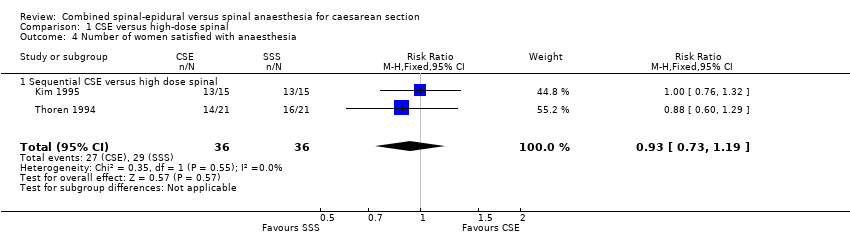
Comparison 1 CSE versus high‐dose spinal, Outcome 4 Number of women satisfied with anaesthesia.
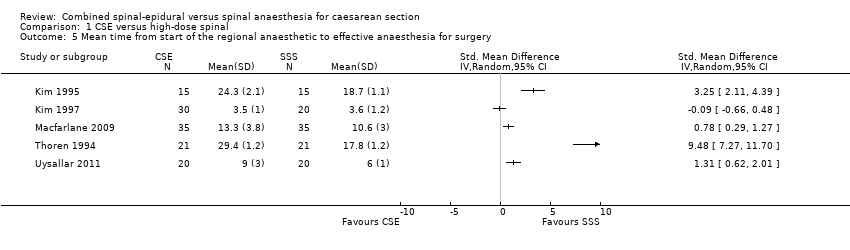
Comparison 1 CSE versus high‐dose spinal, Outcome 5 Mean time from start of the regional anaesthetic to effective anaesthesia for surgery.

Comparison 1 CSE versus high‐dose spinal, Outcome 6 Number of women with hypotension.
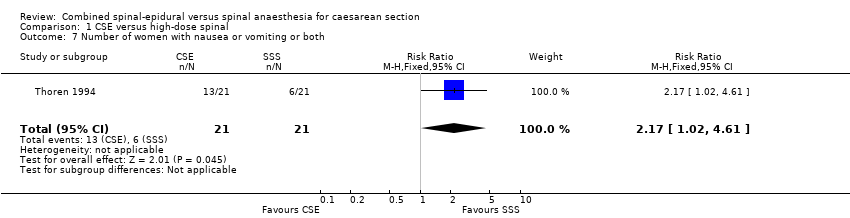
Comparison 1 CSE versus high‐dose spinal, Outcome 7 Number of women with nausea or vomiting or both.
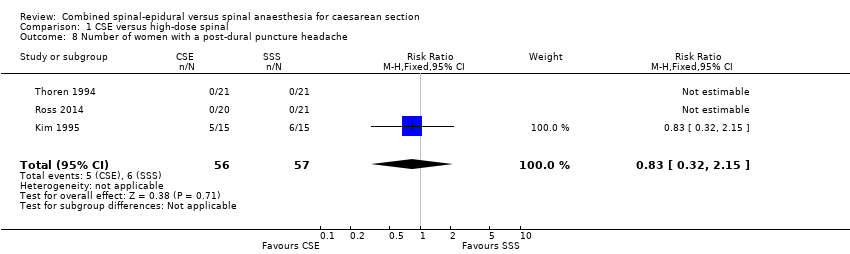
Comparison 1 CSE versus high‐dose spinal, Outcome 8 Number of women with a post‐dural puncture headache.
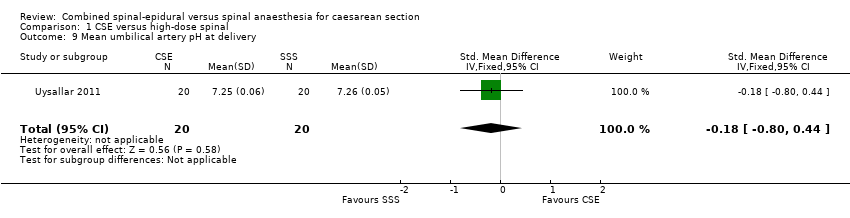
Comparison 1 CSE versus high‐dose spinal, Outcome 9 Mean umbilical artery pH at delivery.
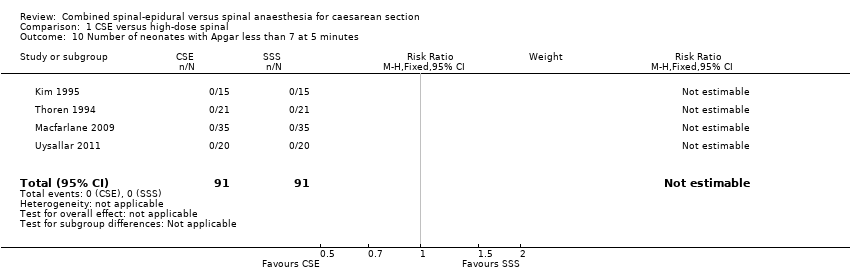
Comparison 1 CSE versus high‐dose spinal, Outcome 10 Number of neonates with Apgar less than 7 at 5 minutes.

Comparison 2 CSE versus low‐dose spinal, Outcome 1 Number of women requiring a repeat regional block or a general anaesthetic as a result of failure to establish adequate initial blockade.
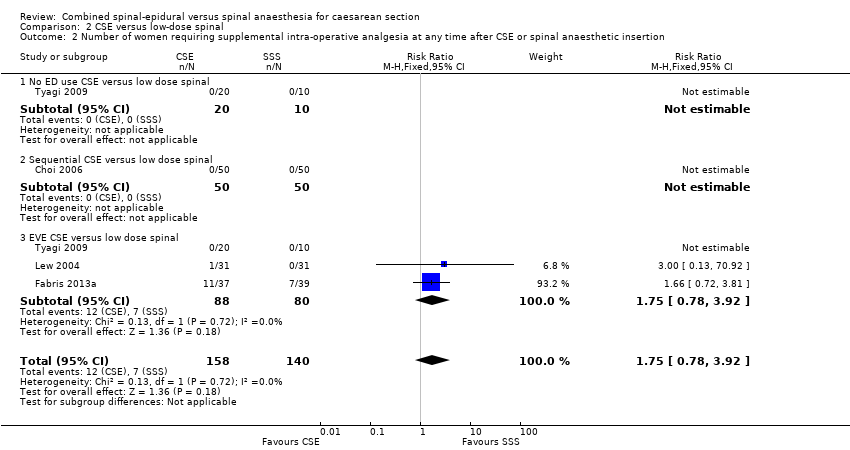
Comparison 2 CSE versus low‐dose spinal, Outcome 2 Number of women requiring supplemental intra‐operative analgesia at any time after CSE or spinal anaesthetic insertion.

Comparison 2 CSE versus low‐dose spinal, Outcome 3 Number of women requiring intra‐operative conversion to general anaesthesia.
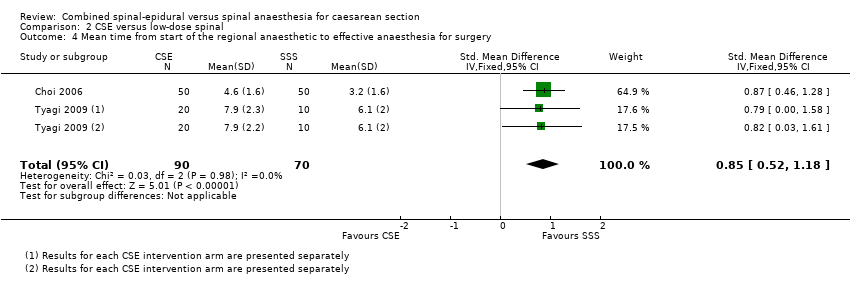
Comparison 2 CSE versus low‐dose spinal, Outcome 4 Mean time from start of the regional anaesthetic to effective anaesthesia for surgery.

Comparison 2 CSE versus low‐dose spinal, Outcome 5 Number of women with hypotension.

Comparison 2 CSE versus low‐dose spinal, Outcome 6 Number of women with nausea or vomiting or both.

Comparison 2 CSE versus low‐dose spinal, Outcome 7 Number of women with a post‐dural puncture headache.
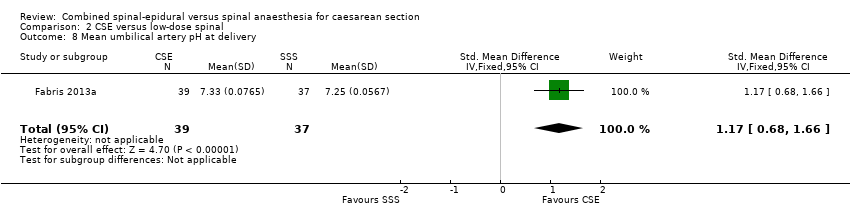
Comparison 2 CSE versus low‐dose spinal, Outcome 8 Mean umbilical artery pH at delivery.

Comparison 2 CSE versus low‐dose spinal, Outcome 9 Number of neonates with Apgar less than 7 at 5 minutes.
| CSE compared to high‐dose spinal for caesarean section | ||||||
| Patient or population: women having a caesarean section Setting: university or national hospitals | ||||||
| Outcomes | Anticipated absolute effects* (95% CI) | Relative effect | № of participants | Certainty of the evidence | Comments | |
| Risk with high‐dose spinal | Risk with CSE | |||||
| Number of women requiring a repeat regional block or a general anaesthetic as a result of failure to establish adequate initial blockade | Study population | RR 0.32 | 341 | ⊕⊕⊝⊝ | ‐ | |
| 69 per 1000 | 22 per 1000 | |||||
| Number of women requiring supplemental intra‐operative analgesia at any time after CSE or spinal anaesthetic insertion | Study population | Average RR 1.25 | 390 | ⊕⊝⊝⊝ | ‐ | |
| 124 per 1000 | 154 per 1000 | |||||
| Number of women requiring intra‐operative conversion to general anaesthesia | Study population | RR 1.00 | 388 | ⊕⊝⊝⊝ | ‐ | |
| 48 per 1000 | 48 per 1000 | |||||
| Number of women satisfied with anaesthesia | Study population | RR 0.93 (0.73 to 1.19) | 72 | ⊕⊝⊝⊝ | ‐ | |
| 806 per 1000 | 749 per 1000 | |||||
| *The risk in the intervention group (and its 95% confidence interval) is based on the assumed risk in the comparison group and the relative effect of the intervention (and its 95% CI). | ||||||
| GRADE Working Group grades of evidence | ||||||
| aSmall sample size and wide confidence interval crossing the line of no effect (imprecision −1). | ||||||
| CSE compared to low‐dose spinal for caesarean section | ||||||
| Patient or population: women having a caesarean section Setting: university or national hospitals | ||||||
| Outcomes | Anticipated absolute effects* (95% CI) | Relative effect | № of participants | Certainty of the evidence | Comments | |
| Risk with low‐dose spinal | Risk with CSE | |||||
| Number of women requiring a repeat regional block or a general anaesthetic as a result of failure to establish adequate initial blockade | Study population | RR 4.81 | 224 | ⊕⊕⊝⊝ | ‐ | |
| 0 per 1000 | 0 per 1000 | |||||
| Number of women requiring supplemental intra‐operative analgesia at any time after CSE or spinal anaesthetic insertion | Study population | RR 1.75 | 298 | ⊕⊕⊕⊝ | ‐ | |
| 100 per 1000 | 175 per 1000 | |||||
| Number of women requiring intra‐operative conversion to general anaesthesia | Study population | ‐ | 222 | ⊕⊕⊝⊝ | Effect is uncertain. No women in these 3 RCTs required a conversion to general anaesthetic | |
| see comment | see comment | |||||
| Number of women satisfied with anaesthesia | Study population | ‐ | (0 studies) | ‐ | No data available in the included studies | |
| see comment | see comment | |||||
| *The risk in the intervention group (and its 95% confidence interval) is based on the assumed risk in the comparison group and the relative effect of the intervention (and its 95% CI). | ||||||
| GRADE Working Group grades of evidence | ||||||
| aSmall sample size and very wide confidence interval crossing the line of no effect (imprecision −2). | ||||||
|
| CSE: Needle‐through‐needle | CSE: Two injection | ||||
| SPINAL | No ED use | Sequential | EVE | No ED use | Sequential | EVE |
| High‐dose | ‐ | ‐ | ‐ | |||
| Low‐dose | ‐ | ‐ | ||||
| Abizanda 2007 is not included in this table as the doses of drugs used and the mode of administration were not stated | ||||||
| Outcome or subgroup title | No. of studies | No. of participants | Statistical method | Effect size |
| 1 Number of women requiring a repeat regional block or a general anaesthetic as a result of failure to establish adequate initial blockade Show forest plot | 7 | 341 | Risk Ratio (M‐H, Fixed, 95% CI) | 0.32 [0.05, 1.97] |
| 1.1 No ED use CSE versus high dose spinal | 5 | 259 | Risk Ratio (M‐H, Fixed, 95% CI) | 0.32 [0.05, 1.97] |
| 1.2 Sequential CSE versus high dose spinal | 2 | 82 | Risk Ratio (M‐H, Fixed, 95% CI) | 0.0 [0.0, 0.0] |
| 2 Number of women requiring supplemental intra‐operative analgesia at any time after CSE or spinal anaesthetic insertion Show forest plot | 7 | 390 | Risk Ratio (M‐H, Random, 95% CI) | 1.25 [0.19, 8.43] |
| 2.1 No ED use CSE versus high dose spinal | 4 | 170 | Risk Ratio (M‐H, Random, 95% CI) | 0.0 [0.0, 0.0] |
| 2.2 Sequential CSE versus high dose spinal | 3 | 151 | Risk Ratio (M‐H, Random, 95% CI) | 1.99 [0.18, 21.49] |
| 2.3 EVE CSE versus high dose spinal | 1 | 69 | Risk Ratio (M‐H, Random, 95% CI) | 0.18 [0.01, 4.28] |
| 3 Number of women requiring intra‐operative conversion to general anaesthesia Show forest plot | 7 | 388 | Risk Ratio (M‐H, Fixed, 95% CI) | 1.0 [0.07, 14.95] |
| 3.1 No ED use CSE versus high dose spinal | 4 | 168 | Risk Ratio (M‐H, Fixed, 95% CI) | 0.0 [0.0, 0.0] |
| 3.2 Sequential CSE versus high dose spinal | 3 | 151 | Risk Ratio (M‐H, Fixed, 95% CI) | 1.0 [0.07, 14.95] |
| 3.3 EVE CSE versus high dose spinal | 1 | 69 | Risk Ratio (M‐H, Fixed, 95% CI) | 0.0 [0.0, 0.0] |
| 4 Number of women satisfied with anaesthesia Show forest plot | 2 | 72 | Risk Ratio (M‐H, Fixed, 95% CI) | 0.93 [0.73, 1.19] |
| 4.1 Sequential CSE versus high dose spinal | 2 | 72 | Risk Ratio (M‐H, Fixed, 95% CI) | 0.93 [0.73, 1.19] |
| 5 Mean time from start of the regional anaesthetic to effective anaesthesia for surgery Show forest plot | 5 | Std. Mean Difference (IV, Random, 95% CI) | Totals not selected | |
| 6 Number of women with hypotension Show forest plot | 4 | 162 | Risk Ratio (M‐H, Fixed, 95% CI) | 1.01 [0.76, 1.33] |
| 7 Number of women with nausea or vomiting or both Show forest plot | 1 | 42 | Risk Ratio (M‐H, Fixed, 95% CI) | 2.17 [1.02, 4.61] |
| 8 Number of women with a post‐dural puncture headache Show forest plot | 3 | 113 | Risk Ratio (M‐H, Fixed, 95% CI) | 0.83 [0.32, 2.15] |
| 9 Mean umbilical artery pH at delivery Show forest plot | 1 | 40 | Std. Mean Difference (IV, Fixed, 95% CI) | ‐0.18 [‐0.80, 0.44] |
| 10 Number of neonates with Apgar less than 7 at 5 minutes Show forest plot | 4 | 182 | Risk Ratio (M‐H, Fixed, 95% CI) | 0.0 [0.0, 0.0] |
| Outcome or subgroup title | No. of studies | No. of participants | Statistical method | Effect size |
| 1 Number of women requiring a repeat regional block or a general anaesthetic as a result of failure to establish adequate initial blockade Show forest plot | 3 | 224 | Risk Ratio (M‐H, Fixed, 95% CI) | 4.81 [0.24, 97.80] |
| 1.1 No ED use CSE versus low dose spinal | 1 | 30 | Risk Ratio (M‐H, Fixed, 95% CI) | 0.0 [0.0, 0.0] |
| 1.2 Sequential CSE versus low dose spinal | 1 | 102 | Risk Ratio (M‐H, Fixed, 95% CI) | 4.81 [0.24, 97.80] |
| 1.3 EVE CSE versus low dose spinal | 2 | 92 | Risk Ratio (M‐H, Fixed, 95% CI) | 0.0 [0.0, 0.0] |
| 2 Number of women requiring supplemental intra‐operative analgesia at any time after CSE or spinal anaesthetic insertion Show forest plot | 4 | 298 | Risk Ratio (M‐H, Fixed, 95% CI) | 1.75 [0.78, 3.92] |
| 2.1 No ED use CSE versus low dose spinal | 1 | 30 | Risk Ratio (M‐H, Fixed, 95% CI) | 0.0 [0.0, 0.0] |
| 2.2 Sequential CSE versus low dose spinal | 1 | 100 | Risk Ratio (M‐H, Fixed, 95% CI) | 0.0 [0.0, 0.0] |
| 2.3 EVE CSE versus low dose spinal | 3 | 168 | Risk Ratio (M‐H, Fixed, 95% CI) | 1.75 [0.78, 3.92] |
| 3 Number of women requiring intra‐operative conversion to general anaesthesia Show forest plot | 3 | 222 | Risk Ratio (M‐H, Fixed, 95% CI) | 0.0 [0.0, 0.0] |
| 3.1 No ED use CSE versus low dose spinal | 1 | 30 | Risk Ratio (M‐H, Fixed, 95% CI) | 0.0 [0.0, 0.0] |
| 3.2 Sequential CSE versus low dose spinal | 1 | 100 | Risk Ratio (M‐H, Fixed, 95% CI) | 0.0 [0.0, 0.0] |
| 3.3 EVE CSE versus low dose spinal | 2 | 92 | Risk Ratio (M‐H, Fixed, 95% CI) | 0.0 [0.0, 0.0] |
| 4 Mean time from start of the regional anaesthetic to effective anaesthesia for surgery Show forest plot | 2 | 160 | Std. Mean Difference (IV, Fixed, 95% CI) | 0.85 [0.52, 1.18] |
| 5 Number of women with hypotension Show forest plot | 4 | 336 | Risk Ratio (M‐H, Random, 95% CI) | 0.59 [0.38, 0.93] |
| 6 Number of women with nausea or vomiting or both Show forest plot | 1 | 100 | Risk Ratio (M‐H, Fixed, 95% CI) | 0.5 [0.13, 1.89] |
| 7 Number of women with a post‐dural puncture headache Show forest plot | 2 | 138 | Risk Ratio (M‐H, Fixed, 95% CI) | 0.0 [0.0, 0.0] |
| 8 Mean umbilical artery pH at delivery Show forest plot | 1 | 76 | Std. Mean Difference (IV, Fixed, 95% CI) | 1.17 [0.68, 1.66] |
| 9 Number of neonates with Apgar less than 7 at 5 minutes Show forest plot | 1 | 60 | Risk Ratio (M‐H, Fixed, 95% CI) | 0.0 [0.0, 0.0] |