Combined spinal‐epidural versus spinal anaesthesia for caesarean section
Abstract
Background
Single‐shot spinal anaesthesia (SSS) and combined spinal‐epidural (CSE) anaesthesia are both commonly used for caesarean section anaesthesia. Spinals offer technical simplicity and rapid onset of nerve blockade which can be associated with hypotension. CSE anaesthesia allows for more gradual onset and also prolongation of the anaesthesia through use of a catheter.
Objectives
To compare the effectiveness and adverse effects of CSE anaesthesia to single‐shot spinal anaesthesia for caesarean section.
Search methods
We searched the Cochrane Pregnancy and Childbirth’s Trials Register, ClinicalTrials.gov, the WHO International Clinical Trials Registry Platform (ICTRP), and reference lists of retrieved studies (search date: 8 August 2019).
Selection criteria
We considered all published randomised controlled trials (RCTs) involving a comparison of CSE anaesthesia with single‐shot spinal anaesthesia for caesarean section. We further subgrouped spinal anaesthesia as either high‐dose (10 or more mg bupivacaine), or low‐dose (less than 10 mg bupivacaine).
Data collection and analysis
Two review authors independently assessed trials for inclusion and risks of bias, extracted data and checked them for accuracy. We used standard methodological procedures expected by Cochrane.
Main results
We identified 18 trials including 1272 women, but almost all comparisons for individual outcomes involved relatively small numbers of women. Two trials did not report on this review's outcomes and therefore contribute no data towards this review. Trials were conducted in national or university hospitals in Australia (1), Croatia (1), India (1), Italy (1), Singapore (3), South Korea (4), Spain (1), Sweden (1), Turkey (2), UK (1), USA (2). The trials were at a moderate risk of bias overall.
CSE versus high‐dose spinal anaesthesia
There may be little or no difference between the CSE and high‐dose spinal groups for the number of women requiring a repeat regional block or general anaesthetic as a result of failure to establish adequate initial blockade (risk ratio (RR) 0.32, 95% confidence interval (CI) 0.05 to 1.97; 7 studies, 341 women; low‐quality evidence). We are uncertain whether having CSE or spinal makes any difference in the number of women requiring supplemental intra‐operative analgesia at any time after CSE or spinal anaesthetic insertion (average RR 1.25, 95% CI 0.19 to 8.43; 7 studies, 390 women; very low‐quality evidence), or the number of women requiring intra‐operative conversion to general anaesthesia (RR 1.00, 95% CI 0.07 to 14.95; 7 studies, 388 women; very low‐quality evidence). We are also uncertain about the results for the number of women who were satisfied with anaesthesia, regardless of whether they received CSE or high‐dose spinal (RR 0.93 95% CI 0.73 to 1.19; 2 studies, 72 women; very low‐quality evidence). More women in the CSE group (13/21) experienced intra‐operative nausea or vomiting requiring treatment than in the high‐dose spinal group (6/21). There were 11 cases of post‐dural puncture headache (5/56 with CSE versus 6/57 with SSS; 3 trials, 113 women) with no clear difference between groups. There was also no clear difference in intra‐operative hypotension requiring treatment (46/86 with CSE versus 41/76 with SSS; 4 trials, 162 women). There were no babies with Apgar score less than seven at five minutes (4 trials, 182 babies).
CSE versus low‐dose spinal anaesthesia
There may be little or no difference between the CSE and low‐dose spinal groups for the number of women requiring a repeat regional block or general anaesthetic as a result of failure to establish adequate initial blockade (RR 4.81, 95% CI 0.24 to 97.90; 3 studies, 224 women; low‐quality evidence). Similarly, there is probably little difference in the number of women requiring supplemental intra‐operative analgesia at any time after CSE or low‐dose spinal anaesthetic insertion (RR 1.75, 95% CI 0.78 to 3.92; 4 studies, 298 women; moderate‐quality evidence). We are uncertain about the effect of CSE or low‐dose spinal on the need for intra‐operative conversion to general anaesthesia, because this was not required by any of the 222 women in the three trials (low‐quality evidence). None of the studies examined whether women were satisfied with their anaesthesia.
The mean time to effective anaesthesia was faster in women who received low‐dose spinal compared to CSE, although it is unlikely that the magnitude of this difference is clinically meaningful (standardised mean difference (SMD) 0.85 minutes, 95% CI 0.52 to 1.18 minutes; 2 studies, 160 women).
CSE appeared to reduce the incidence of intra‐operative hypotension requiring treatment compared with low‐dose spinal (average RR 0.59, 95% CI 0.38 to 0.93; 4 studies, 336 women). Similar numbers of women between the CSE and low‐dose spinal groups experienced intra‐operative nausea or vomiting requiring treatment (3/50 with CSE versus 6/50 with SSS; 1 study, 100 women), and there were no cases of post‐dural puncture headache (1 study, 138 women). No infants in either group had an Apgar score of less than seven at five minutes (1 study; 60 babies).
Authors' conclusions
In this review, the number of studies and participants for most of our analyses were small and some of the included trials had design limitations. There was some suggestion that, compared to spinal anaesthesia, CSE could be associated with a reduction in the number of women with intra‐operative hypotension, but an increase in intra‐operative nausea and vomiting requiring treatment. One small study found that low‐dose spinal resulted in a faster time to effective anaesthesia compared to CSE. However, these results are based on limited data and the difference is unlikely to be clinically meaningful. Consequently, there is currently insufficient evidence in support of one technique over the other and more evidence is needed in order to further evaluate the relative effectiveness and safety of CSE and spinal anaesthesia for caesarean section.
More high‐quality, sufficiently‐powered studies in this area are needed. Such studies could consider using the outcomes listed in this review and should also consider reporting economic aspects of the different methods under investigation.
PICOs
Plain language summary
Combined spinal‐epidural versus spinal anaesthesia for caesarean section
What is the issue?
Regional nerve block is one type of anaesthetic women can receive when having a caesarean section. Two different methods are used. Single‐shot spinal involves a single injection of anaesthetic into the lower spine. Combined spinal and epidural block involves using a larger needle and the insertion of a small catheter into the lower spine. This review examines the relative benefits and risks of these two regional block methods for women undergoing caesarean and for their babies.
Why is this important?
Single‐shot spinal anaesthesia for caesarean section is relatively easily performed and works quickly. As it involves a single injection, block duration cannot be extended without the woman having another spinal injection. The rapid onset of the block can cause adverse effects, such as low blood pressure (hypotension) and nausea and vomiting. Lower doses of local anaesthetic may reduce these adverse events, and speed up the return of muscle function. In this review, we look at high‐ and low‐dose spinals separately.
With combined spinal‐epidural anaesthesia (CSE) the insertion of the epidural catheter allows the injection of small doses into the spine and additional doses of anaesthetic to be administered through the epidural catheter. CSE anaesthetic typically works more slowly and may avoid some of the adverse effects seen in single‐shot spinal anaesthetics. Being able to top up anaesthesia can reduce the need for general anaesthetic or sedation when the regional nerve block is not sufficient for surgery. The epidural catheter may also be used to give pain medication after the operation.
What evidence did we find?
We searched for evidence (8 August 2019) and identified 18 randomised controlled trials (1272 women) comparing high‐ or low‐dose single‐shot spinal anaesthesia with the CSE method. However, most of our analyses involved fewer studies and relatively small numbers of women. Two trials did not contribute data to our review.
There may be little or no difference between CSE and high‐dose spinal in the number of women requiring repeat anaesthesia or general anaesthetic due to failure to establish adequate initial anaesthesia. We are uncertain whether CSE or spinal makes any difference in the need for additional intra‐operative analgesia or conversion to general anaesthesia. We are also uncertain about the results for the number of women who were satisfied with anaesthesia, regardless of the type of nerve block. More women in the CSE group (13/21) experienced intra‐operative nausea or vomiting requiring treatment than in the high‐dose spinal group (6/21). Similar numbers of women between groups experienced post‐dural puncture headache (5/56 with CSE versus 6/57 with SSS; 3 studies, 113 women), or intra‐operative hypotension requiring treatment (4 trials, 162 women).
There may be little or no difference between CSE and low‐dose spinal groups in the number of women requiring repeat anaesthesia or general anaesthetic because of failure to establish adequate initial anaesthesia (3 studies, 224 women). There is probably little or no difference in the need for additional intra‐operative analgesia (4 studies, 298 women). We are uncertain of the effect of CSE or low‐dose spinal on the need for intra‐operative conversion to general anaesthesia, because none of the women required this (3 studies, 222 women). No studies examined women's satisfaction with anaesthesia. The average time to effective anaesthesia was faster with low‐dose spinal compared to CSE, although the small difference is unlikely to be clinically meaningful (2 studies, 160 women). CSE appeared to reduce intra‐operative hypotension requiring treatment compared with low‐dose spinal (4 studies, 336 women). Similar numbers of women between the CSE and low‐dose spinal groups experienced intra‐operative nausea or vomiting requiring treatment (3/50 with CSE versus 6/50 with SSS; 1 trial, 100 women). There were no post‐dural puncture headaches (1 study, 138 women).
All babies were healthy at birth, irrespective of the maternal anaesthesia used (measured by Apgar scores; 5 studies, 242 babies).
What does this mean?
There is currently insufficient evidence to favour one anaesthetic technique over the other. The number of studies and participants for most of our analyses were small, and some studies had design limitations. More studies are needed in order to further evaluate the relative effectiveness and safety of CSE and spinal anaesthesia for caesarean section.
Authors' conclusions
Summary of findings
| CSE compared to high‐dose spinal for caesarean section | ||||||
| Patient or population: women having a caesarean section Setting: university or national hospitals | ||||||
| Outcomes | Anticipated absolute effects* (95% CI) | Relative effect | № of participants | Certainty of the evidence | Comments | |
| Risk with high‐dose spinal | Risk with CSE | |||||
| Number of women requiring a repeat regional block or a general anaesthetic as a result of failure to establish adequate initial blockade | Study population | RR 0.32 | 341 | ⊕⊕⊝⊝ | ‐ | |
| 69 per 1000 | 22 per 1000 | |||||
| Number of women requiring supplemental intra‐operative analgesia at any time after CSE or spinal anaesthetic insertion | Study population | Average RR 1.25 | 390 | ⊕⊝⊝⊝ | ‐ | |
| 124 per 1000 | 154 per 1000 | |||||
| Number of women requiring intra‐operative conversion to general anaesthesia | Study population | RR 1.00 | 388 | ⊕⊝⊝⊝ | ‐ | |
| 48 per 1000 | 48 per 1000 | |||||
| Number of women satisfied with anaesthesia | Study population | RR 0.93 (0.73 to 1.19) | 72 | ⊕⊝⊝⊝ | ‐ | |
| 806 per 1000 | 749 per 1000 | |||||
| *The risk in the intervention group (and its 95% confidence interval) is based on the assumed risk in the comparison group and the relative effect of the intervention (and its 95% CI). | ||||||
| GRADE Working Group grades of evidence | ||||||
| aSmall sample size and wide confidence interval crossing the line of no effect (imprecision −1). | ||||||
| CSE compared to low‐dose spinal for caesarean section | ||||||
| Patient or population: women having a caesarean section Setting: university or national hospitals | ||||||
| Outcomes | Anticipated absolute effects* (95% CI) | Relative effect | № of participants | Certainty of the evidence | Comments | |
| Risk with low‐dose spinal | Risk with CSE | |||||
| Number of women requiring a repeat regional block or a general anaesthetic as a result of failure to establish adequate initial blockade | Study population | RR 4.81 | 224 | ⊕⊕⊝⊝ | ‐ | |
| 0 per 1000 | 0 per 1000 | |||||
| Number of women requiring supplemental intra‐operative analgesia at any time after CSE or spinal anaesthetic insertion | Study population | RR 1.75 | 298 | ⊕⊕⊕⊝ | ‐ | |
| 100 per 1000 | 175 per 1000 | |||||
| Number of women requiring intra‐operative conversion to general anaesthesia | Study population | ‐ | 222 | ⊕⊕⊝⊝ | Effect is uncertain. No women in these 3 RCTs required a conversion to general anaesthetic | |
| see comment | see comment | |||||
| Number of women satisfied with anaesthesia | Study population | ‐ | (0 studies) | ‐ | No data available in the included studies | |
| see comment | see comment | |||||
| *The risk in the intervention group (and its 95% confidence interval) is based on the assumed risk in the comparison group and the relative effect of the intervention (and its 95% CI). | ||||||
| GRADE Working Group grades of evidence | ||||||
| aSmall sample size and very wide confidence interval crossing the line of no effect (imprecision −2). | ||||||
Background
Description of the condition
Caesarean section is a common form of child birth reported at rates of 19.4 per 100 live births (Molina 2015). A regional block is often employed as the anaesthetic for the caesarean section. Methods which have been commonly used for the regional anaesthesia include an epidural block, or a spinal block given as a single injection, i.e. a single‐shot spinal (SSS). The relative benefits and side effects of these established techniques have been the subject of a systematic review (Ng 2004). Combining the key elements of these two techniques, various forms of combined spinal‐epidural (CSE) have been in clinical use for more than two decades, but have gained popularity in recent years (Singh 2016). It is therefore appropriate to evaluate the possible benefits and relative adverse effects of CSE for anaesthesia relative to these other techniques. This review will focus specifically on CSE versus SSS for caesarean section anaesthesia.
Description of the intervention
Spinal anaesthesia for caesarean section involves a single injection which is relatively easily performed and with a rapid onset. However, when a single injection is done there is no capacity to extend the block after initial administration. It may also be associated with adverse effects such as hypotension related to the rapid onset of extensive sympathetic blockade, especially when higher doses of local anaesthetic are used (Chooi 2017). Epidural anaesthesia involves the insertion of a larger needle but with a technique endpoint that is sometimes less obvious than for a SSS, and the rate of onset of the block is also considerably slower. However, the epidural technique typically includes the insertion of a fine catheter, with which there is the opportunity for further administration of drugs after the initial injection. This feature may have several benefits, including the option for a more gradual onset of anaesthesia which could reduce the likelihood of a fall in blood pressure at the start of the procedure. This will reduce the occurrence of adverse effects like nausea and vomiting and could be useful in cases where cardiovascular stability is required, such as with significant maternal cardiac disease (Monteiro 2016). There is also the possibility of avoiding the need for a general anaesthetic during longer operations in which the initial spinal injection starts to wear off, as additional drugs can be administered through the catheter (Leo 2009).
In addition to local anaesthetic drugs, both the spinal and epidural components may use a number of different adjuvants including a variety of opioids and other drugs with analgesic properties, such as clonidine. The use of the agents may allow smaller doses of local anaesthetic drugs to be used which could reduce the incidence and severity of side effects such as hypotension, or may be helpful in prolonging the duration of effective anaesthesia during the procedure.
There are several variants of the CSE technique. In its simplest form a spinal is performed and an epidural catheter is inserted at the same time, as a backup for the spinal anaesthesia or to provide for postoperative pain relief. Other variants use an epidural injection shortly after the spinal to extend the spinal effect possibly through mechanical compression of the dura. Both saline and local anaesthetic solutions have been shown to be effective in increasing the sensory block height in this way (Yun 2014), although the effect appears to be limited to approximately the first 15 to 20 minutes after spinal injection, and are also influenced by the woman's position, being most effective with the woman in the lateral or supine position, but not sitting (Zaphiratos 2016). Hence in this review, we have considered as a CSE subgroup all studies in which there was the potential for increasing the height of block by dural compression through epidural administration of saline or local anaesthetic within 20 minutes after an intentionally low spinal dose. In addition, however, the term 'epidural volume extension' (EVE) has come to be applied when saline is administered for dural compression only within the first few minutes after spinal injection, while the administration of one or more small doses of local anaesthetic, typically up to 20 minutes or more after the spinal, has been referred to as low‐dose 'sequential CSE' (McNaught 2007). As well as clinical utility, there is some theoretical basis to support the view that these alternatives are potentially sufficiently different from each other to be considered as separate subgroups. All of these CSE techniques may have particular benefits related to the lower doses of local anaesthetic used, including quicker return of motor function, enabling earlier discharge from the postanaesthesia care unit, and less effect on the cardiovascular system (McNaught 2007), leading to a reduced need for interventions secondary to a fall in blood pressure, or for use in selected high‐risk women (Hamlyn 2005). In the light of these possible benefits of CSE, there have also been increasing reports of ever‐diminishing doses of local anaesthetic in SSS as well (Langesaeter 2008). It may be informative therefore to subgroup the SSS studies into the more traditional high‐dose local anaesthetic and also low‐dose techniques.
How the intervention might work
The combination of spinal anaesthesia with an epidural creates the opportunity for the potential benefits of an epidural catheter in place while retaining the speed of onset of the spinal. The CSE technique, however, involves the insertion of two needles, and there has been some debate as to whether the spinal needle should be placed through the epidural needle or inserted as a separate procedure, typically at a separate site so as to improve effectiveness or reduce side effects; there are varying results favouring one (Backe 2004) or the other (Ahn 2016). The commonly‐used needle‐through‐needle technique may facilitate epidural catheter placement, but this may be significantly influenced by needle design (Browne 2005). There are also at least theoretical concerns for the increasing complexity of CSE versus SSS adding to technical difficulty and the time taken to perform the block, as well as its effectiveness, notably for outright failure and the need to either perform another regional block or to administer a general anaesthetic (Kinsella 2008).
Why it is important to do this review
For pregnant women undergoing caesarean section it is important to understand the serious side effects of CSE and SSS. These side effects include the risk of infection (Sandkovsky 2009), post‐dural puncture headache (PDPH) and longer‐term neurological injury. As most of these outcomes are infrequent, results from single randomised controlled trials generally do not produce sufficient numbers to be informative, and case series or audits are subject to the limitations of these methods. The most common of these problems is PDPH, either as a result of an accidental dural puncture with the epidural needle or following the intentional piercing of the dura with a spinal needle. The reported incidence of accidental dural puncture with an epidural needle is approximately 1.5%, with half of these women developing a PDPH (Choi 2003). The incidence of PDPH after a SSS is dependent on the needle gauge and the needle tip design. Commonly‐used smaller‐gauge needles with an atraumatic design have a similar incidence of PDPH to that of epidural needles (Choi 2003). The CSE technique also has a similar reported incidence of PDPH to these other alternatives (Van de Velde 2008).
Of particular concern both to consumers and anaesthetists is the experience of intra‐operative discomfort. This may range from minor, transient effects to severe pain and distress requiring conversion of the regional block to a general anaesthetic. With ever‐diminishing doses of local anaesthetic, it is important to assess the incidence of the need for intra‐operative analgesia and for conversion to general anaesthetic after establishment of the block.
Objectives
To compare the effectiveness and adverse effects of combined spinal‐epidural anaesthesia to single‐shot spinal anaesthesia for caesarean section.
Methods
Criteria for considering studies for this review
Types of studies
All published randomised controlled trials (RCTs) involving a comparison of combined spinal‐epidural anaesthesia (CSE) with single‐shot spinal anaesthesia (SSS) for caesarean section. Cluster‐RCTs were also eligible for inclusion in this review. We included studies reported only as abstracts.
Quasi‐RCTs were not eligible for inclusion. Trials using a cross‐over design were not eligible for inclusion. We excluded studies that did not report an outcome of interest.
Types of participants
Women having a caesarean section.
Types of interventions
CSE anaesthesia was compared with single‐shot spinal anaesthesia for caesarean section. We subgrouped single‐shot spinals on the basis of the dose of local anaesthetic used as either high‐dose or low‐dose, with low‐dose being defined as less than 10 mg of bupivacaine or equivalent. The CSE intervention groups were further subcategorised according to:
-
no epidural use (no ED use), sequential CSE and epidural volume extension (EVE);
-
needle through needle (N‐t‐N) or two‐level CSE.
Types of outcome measures
The outcome measures included were as follows.
Primary outcomes
-
Number of women requiring a repeat regional block or a general anaesthetic as a result of failure to establish adequate initial blockade
-
Number of women requiring supplemental intra‐operative analgesia at any time after CSE or spinal anaesthetic insertion
-
Number of women requiring intra‐operative conversion to general anaesthesia
-
Number of women satisfied with their anaesthesia
Secondary outcomes
-
Mean time and standard deviation from start of the regional anaesthetic to effective anaesthesia for surgery
-
Number of women with intra‐operative hypotension requiring treatment or intervention specifically identified
-
Number of women with intra‐operative nausea and vomiting requiring treatment or intervention specifically identified
-
Mean time and standard deviation from admission to discharge from the postanaesthesia recovery unit
-
Number of women requiring follow‐up for an adverse outcome present at one month or more after the procedure and specifically identified: meningitis, neuropraxia, paralysis, backache, footdrop, unresolved post‐dural puncture headache
-
Number of women with a post‐dural puncture headache
-
Number of neonates admitted to the neonatal unit
-
Mean pH and standard deviation in the neonate for umbilical artery, umbilical vein or umbilical cord
-
Number of neonates with Apgar scores less than seven at five minutes
Search methods for identification of studies
The following Methods section of this review is based on a standard template used by Cochrane Pregnancy and Childbirth.
Electronic searches
We searched Cochrane Pregnancy and Childbirth’s Trials Register by contacting their Information Specialist (8 August 2019).
The Register is a database containing over 25,000 reports of controlled trials in the field of pregnancy and childbirth. It represents over 30 years of searching. For full current search methods used to populate Pregnancy and Childbirth’s Trials Register, including the detailed search strategies for CENTRAL, MEDLINE, Embase and CINAHL, the list of handsearched journals and conference proceedings, and the list of journals reviewed via the current awareness service, please follow this link.
Briefly, Cochrane Pregnancy and Childbirth’s Trials Register is maintained by their Information Specialist and contains trials identified from:
-
monthly searches of the Cochrane Central Register of Controlled Trials (CENTRAL);
-
weekly searches of MEDLINE (Ovid);
-
weekly searches of Embase (Ovid);
-
monthly searches of CINAHL (EBSCO);
-
handsearches of 30 journals and the proceedings of major conferences;
-
weekly current awareness alerts for a further 44 journals plus monthly BioMed Central email alerts.
Two people screen the search results, and review the full text of all relevant trial reports identified through the searching activities described above. Based on the intervention described, each trial report is assigned a number that corresponds to a specific Pregnancy and Childbirth review topic (or topics), and is then added to the Register. The Information Specialist searches the Register for each review using this topic number rather than keywords. This results in a more specific search set which has been fully accounted for in the relevant review sections (Included studies; Excluded studies; Studies awaiting classification).
In addition, we searched ClinicalTrials.gov and the WHO International Clinical Trials Registry Platform (ICTRP) (8 August 2019) for unpublished, planned and ongoing trial reports, using the search terms given in Appendix 1.
Searching other resources
We searched the reference lists of retrieved studies.
We did not apply any language or date restrictions.
Data collection and analysis
The following Methods section of this review is based on a standard template used by the Cochrane Pregnancy and Childbirth Group.
Selection of studies
Two review authors independently assessed for inclusion all the studies identified as a result of the search strategy. We resolved any disagreement through discussion or, if required, we consulted a third review author.
Data extraction and management
We designed a form to extract data, which two review authors used to extract the data from eligible studies. We resolved discrepancies through discussion or, if required, we consulted a third review author. We entered data into Review Manager 5 software (RevMan 2014) and checked them for accuracy.
When information on any of the above was unclear, we planned to contact authors of the original reports to provide further details.
Assessment of risk of bias in included studies
Two review authors independently assessed risks of bias for each study, using the criteria outlined in the Cochrane Handbook for Systematic Reviews of Interventions (Handbook; Higgins 2017). We resolved any disagreement by discussion or by involving a third assessor.
(1) Random sequence generation (checking for possible selection bias)
We described for each included study the method used to generate the allocation sequence in sufficient detail to allow an assessment of whether it should produce comparable groups.
We assessed the method as:
-
low risk of bias (any truly random process, e.g. random‐number table; computer random‐number generator);
-
high risk of bias (any non‐random process, e.g. odd or even date of birth; hospital or clinic record number);
-
unclear risk of bias.
(2) Allocation concealment (checking for possible selection bias)
We described for each included study the method used to conceal allocation to interventions prior to assignment and assessed whether intervention allocation could have been foreseen in advance of, or during recruitment, or changed after assignment.
We assessed the methods as:
-
low risk of bias (e.g. telephone or central randomisation; consecutively‐numbered sealed opaque envelopes);
-
high risk of bias (open random allocation; unsealed or non‐opaque envelopes; alternation; date of birth);
-
unclear risk of bias.
(3.1) Blinding of participants and personnel (checking for possible performance bias)
We described for each included study the methods used, if any, to blind study participants and personnel from knowledge of which intervention a participant received. We considered that studies were at low risk of bias if they were blinded, or if we judged the lack of blinding unlikely to affect results. We assessed blinding separately for different outcomes or classes of outcomes.
We assessed the methods as:
-
low, high or unclear risk of bias for participants;
-
low, high or unclear risk of bias for personnel.
(3.2) Blinding of outcome assessment (checking for possible detection bias)
We described for each included study the methods used, if any, to blind outcome assessors from knowledge of which intervention a participant received. We assessed blinding separately for different outcomes or classes of outcomes.
We assessed methods used to blind outcome assessment as:
-
low, high or unclear risk of bias.
(4) Incomplete outcome data (checking for possible attrition bias due to the amount, nature and handling of incomplete outcome data)
We described for each included study, and for each outcome or class of outcomes, the completeness of data including attrition and exclusions from the analysis. We stated whether attrition and exclusions were reported and the numbers included in the analysis at each stage (compared with the total randomised participants), reasons for attrition or exclusion where reported, and whether missing data were balanced across groups or were related to outcomes. Where sufficient information was reported or could be supplied by the trial authors, we planned to re‐include missing data in the analyses which we undertook.
We assessed methods as:
-
low risk of bias (e.g. no missing outcome data; missing outcome data balanced across groups);
-
high risk of bias (e.g. numbers or reasons for missing data imbalanced across groups; ‘as treated’ analysis done with substantial departure of intervention received from that assigned at randomisation);
-
unclear risk of bias.
(5) Selective reporting (checking for reporting bias)
We described for each included study how we investigated the possibility of selective outcome reporting bias and what we found.
We assessed the methods as:
-
low risk of bias (where it is clear that all of the study’s prespecified outcomes and all expected outcomes of interest to the review have been reported);
-
high risk of bias (where not all the study’s prespecified outcomes have been reported; one or more reported primary outcomes were not prespecified; outcomes of interest are reported incompletely and so cannot be used; study fails to include results of a key outcome that would have been expected to have been reported);
-
unclear risk of bias.
(6) Other bias (checking for bias due to problems not covered by (1) to (5) above)
We described for each included study any important concerns we had about other possible sources of bias.
(7) Overall risk of bias
We made explicit judgements about whether studies were at high risk of bias, according to the criteria given in the Handbook (Higgins 2017). With reference to (1) to (6) above, we planned to assess the likely magnitude and direction of the bias and whether we considered it likely to impact on the findings. In future updates, we will explore the impact of the level of bias through undertaking sensitivity analyses (see Sensitivity analysis).
Assessment of the quality of the evidence using the GRADE approach
For this review we assessed the quality of the evidence using the GRADE approach, as outlined in the GRADE Handbook. We assessed the quality of the body of evidence relating to the following outcomes for the main comparisons.
-
Number of women requiring a repeat regional block or a general anaesthetic as a result of failure to establish adequate initial blockade
-
Number of women requiring supplemental intra‐operative analgesia at any time after CSE or spinal anaesthetic insertion
-
Number of women requiring intra‐operative conversion to general anaesthesia
-
Number of women satisfied with their anaesthesia
We used the GRADEpro Guideline Development Tool to import data from Review Manager 5 (RevMan 2014) in order to create ’Summary of findings’ tables. We produced a summary of the intervention effect and a measure of quality for each of the above outcomes using the GRADE approach. The GRADE approach uses five considerations (study limitations, consistency of effect, imprecision, indirectness and publication bias) to assess the quality of the body of evidence for each outcome. The evidence can be downgraded from 'high quality' by one level for serious (or by two levels for very serious) limitations, depending on assessments of risk of bias, indirectness of evidence, serious inconsistency, imprecision of effect estimates or potential publication bias.
Measures of treatment effect
Dichotomous data
For dichotomous data, we presented results as a summary risk ratio (RR) with a 95% confidence interval (CI).
Continuous data
We used the mean difference (MD) if outcomes were measured in the same way between trials. We used the standardised mean difference (SMD) to combine trials that measured the same outcome, but used different methods.
Unit of analysis issues
Cluster‐randomised trials
In future updates, if cluster‐randomised trials are available we will include them in the analyses along with individually‐randomised trials. We will adjust their sample size using the methods described in Section 16.3.4 of the Handbook (Higgins 2011), using an estimate of the intracluster correlation co‐efficient (ICC) derived from the trial (if possible), from a similar trial or from a study of a similar population. If we use ICCs from other sources, we will report this and conduct sensitivity analyses to investigate the effect of variation in the ICC. If we identify both cluster‐randomised trials and individually‐randomised trials, we plan to synthesise the relevant information. We will consider it reasonable to combine the results from both if there is little heterogeneity between the study designs, and if we consider the interaction between the effect of intervention and the choice of randomisation unit to be unlikely.
We will also acknowledge heterogeneity in the randomisation unit and perform a sensitivity analysis to investigate the effects of the randomisation unit.
Cross‐over trials
We did not include cross‐over trials.
Other unit of analysis issues
For studies that include more than two treatment groups, we included each pair‐wise comparison separately, but with shared intervention groups divided out approximately evenly among the comparisons. For dichotomous outcomes, we divided up both the number of events and the total number of women. For continuous outcomes, we divided up only the total number of participants, and left the means and standard deviations unchanged.
Dealing with missing data
For included studies, we noted levels of attrition. In future updates, if we include more eligible studies, we will explore the impact of including studies with high levels of missing data in the overall assessment of treatment effect by using sensitivity analysis.
For all outcomes, we conducted analyses as far as possible on an intention‐to‐treat basis, i.e. we attempted to include all participants randomised to each group in the analyses. The denominator for each outcome in each trial was the number randomised minus any participants whose outcomes were known to be missing.
Assessment of heterogeneity
We assessed statistical heterogeneity in each meta‐analysis using the Tau2, I2 and Chi2 statistics. We regarded heterogeneity as substantial if I2 was greater than 30% and either Tau2 was greater than zero, or there was a low P value (less than 0.10) in the Chi2 test for heterogeneity. If we identified substantial heterogeneity (above 30%), we planned to explore it by prespecified subgroup analysis.
Assessment of reporting biases
In future updates, if there are 10 or more studies in the meta‐analysis we will investigate reporting biases (such as publication bias) using funnel plots. We will assess funnel plot asymmetry visually. If asymmetry is suggested by a visual assessment, we will perform exploratory analyses to investigate it.
Data synthesis
We carried out statistical analysis using the Review Manager 5 software (RevMan 2014). We used a fixed‐effect meta‐analysis for combining data where it was reasonable to assume that studies were estimating the same underlying treatment effect, i.e. where trials were examining the same intervention, and we judged the trials’ populations and methods to be sufficiently similar.
If there was clinical heterogeneity sufficient to expect that the underlying treatment effects differed between trials, or if we found substantial statistical heterogeneity, we used a random‐effects meta‐analysis to produce an overall summary if we considered an average treatment effect across trials to be clinically meaningful. We treat the random‐effects summary as the average range of possible treatment effects and we discuss the clinical implications of treatment effects differing between trials. If the average treatment effect is not clinically meaningful, we have not combined trials. Where we use random‐effects analyses, we present the results as the average treatment effect with a 95% confidence interval, and the estimates of Tau2 and I2.
Subgroup analysis and investigation of heterogeneity
If we identified substantial heterogeneity, we investigated it using subgroup analyses. We considered whether an overall summary was meaningful, and if it was, we used a random‐effects analysis to produce it.
We carried out the following subgroup analyses, but had insufficient data to enable us to carry out any meaningful tests of subgroup difference.
-
Combined spinal‐epidural technique:
-
no epidural use (no ED use);
-
sequential CSE;
-
epidural volume extension (EVE).
-
In future updates, we will assess subgroup differences by interaction tests available within Review Manager 5 (RevMan 2014). We will report the results of subgroup analyses quoting the Chi2 statistic and P value, and the interaction test I2 value.
Sensitivity analysis
We planned to carry out sensitivity analyses to explore the effect of trial quality assessed by concealment of allocation, high attrition rates, or both, with poor‐quality studies being excluded from the analyses in order to assess whether this made any difference to the overall result. There were insufficient high‐quality trials to carry out planned sensitivity analysis. We will carry out planned sensitivity analysis in future updates, if appropriate, and will restrict sensitivity analysis to the review's primary outcomes. We will also carry out sensitivity analysis to investigate the effect of the randomisation unit if we combine cluster‐RCTs along with individually‐randomised trials.
Results
Description of studies
Results of the search
The 8 August 2019 search of the Cochrane Pregnancy and Childbirth Group's Trials Register found 28 trial reports. The search of the ClinicalTrials.gov and the WHO International Clinical Trials Registry Platform (ICTRP), and reference lists of retrieved studies found 49 additional reports. We found one more report by manual search. We found a total of 78 reports, which included 23 duplicates. After screening by title and abstract, we excluded 26 reports. Of the remaining 29 reports, we excluded three trials (four reports) based on failure to fulfil inclusion criteria and included 18 (23 reports) in the meta‐analysis. Two are awaiting further classification, see Studies awaiting classification. See Figure 1 for a flow chart of the search process.
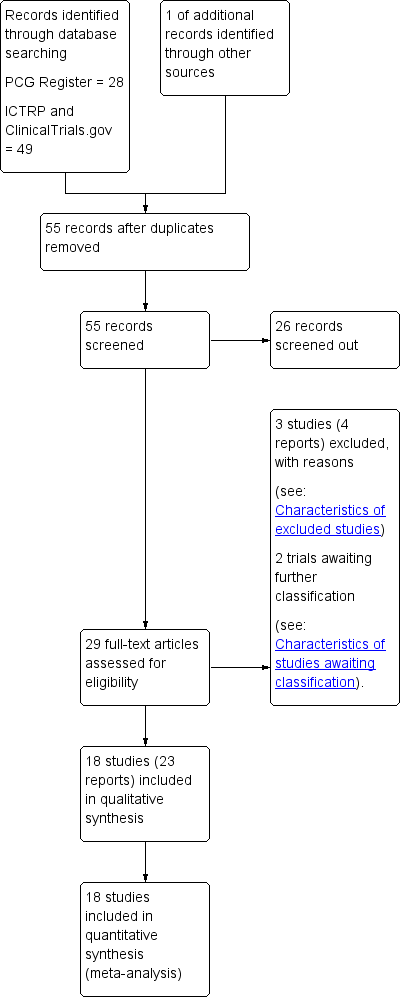
Study flow diagram.
For details of the individual included and excluded studies, see the tables of Characteristics of included studies and Characteristics of excluded studies.
Included studies
Eighteen trials involving 1272 women presenting for caesarean section met the criteria for inclusion in the review.
Setting
Eleven studies were conducted in a University Hospital (Abizanda 2007; Choi 2006; Fabris 2013a; Horstman 2009; Kim 1995; Kim 1997; Kim 2003; Ross 2014; Salman 2013; Tyagi 2009; Uysallar 2011) and the remaining seven in a National Hospital (Brizzi 2005; Ithnin 2006; Lew 2004; Lim 2006; Macfarlane 2009; McAndrew 2003; Thoren 1994).
The trials took place in Australia (McAndrew 2003), Croatia (Fabris 2013a), India (Tyagi 2009), Italy (Brizzi 2005), Singapore (Ithnin 2006; Lew 2004; Lim 2006), South Korea (Choi 2006; Kim 1995; Kim 1997; Kim 2003), Spain (Abizanda 2007), Sweden (Thoren 1994), Turkey (Salman 2013; Uysallar 2011), UK (Macfarlane 2009) and USA (Horstman 2009; Ross 2014).
Trial dates
The Abizanda 2007 study ran between January 2005 until November 2006, Horstman 2009 took place between August and October 2006, McAndrew 2003 took place between July 2001 until March 2002, and Ross 2014 took place between September 2004 until August 2007.
None of the remaining trials reported the study dates (Brizzi 2005; Choi 2006; Fabris 2013a; Ithnin 2006; Kim 1995; Kim 1997; Kim 2003; Lew 2004; Lim 2006; Macfarlane 2009; Salman 2013; Thoren 1994; Tyagi 2009; Uysallar 2011).
Publication language
Of the 18 included studies, five were published in a language other than English: one in Turkish (Uysallar 2011), three in Korean (Kim 1995; Kim 1997; Kim 2003) and one in Spanish (Abizanda 2007).
Source of trial funding
Three studies reported sources of trial funding. Horstman 2009; was funded internally by the Stamford School of Medicine, USA. Ross 2014 was supported by departmental funds (University hospital based in Winston‐Salem, North Carolina, USA) and the authors reported that no additional funding was obtained. Salman 2013 was supported by a grant from the Akdeniz University School of Medicine's Research and Application Centre, Turkey.
The sources of trial funding were not stated in the remaining trials (Abizanda 2007; Brizzi 2005; Choi 2006; Fabris 2013a; Ithnin 2006; Kim 1995; Kim 1997; Kim 2003; Lew 2004; Lim 2006; Macfarlane 2009; McAndrew 2003; Thoren 1994; Tyagi 2009; Uysallar 2011).
Trial authors' declarations of interest
Three trials reported that they had no conflicts of interest to declare (Horstman 2009; Ross 2014; Salman 2013). Information relating to potential conflicts of interest was not mentioned in the remaining trials (Abizanda 2007; Brizzi 2005; Choi 2006; Fabris 2013a; Ithnin 2006; Kim 1995; Kim 1997; Kim 2003; Lew 2004; Lim 2006; Macfarlane 2009; McAndrew 2003; Thoren 1994; Tyagi 2009; Uysallar 2011).
Design
All but four studies (Brizzi 2005; Kim 1995; Kim 1997; Kim 2003) reported obtaining prior ethics committee approval. The same studies (Brizzi 2005; Kim 1995; Kim 1997; Kim 2003) also did not mention if informed written consent was provided by the participants of the trial. The remaining trials explicitly reported obtaining informed written consent from the participants, except for four trials which reported obtaining consent from the women without specifying the form of the consent (Lim 2006; McAndrew 2003; Salman 2013; Uysallar 2011). Of the 18 included studies, only four studies stated when women were recruited for the study (Abizanda 2007; Horstman 2009; McAndrew 2003; Ross 2014).
All studies included in this review were reported to be randomised controlled trials comparing the effects of single‐shot spinal anaesthesia (SSS) to combined spinal‐epidural anaesthesia (CSE) in either elective or non‐elective scenarios. Randomisation techniques varied and the potential for bias was either high or unclear in a number of studies. Refer to Risk of bias in included studies and 'Risk of bias' tables in the Characteristics of included studies section for further details.
Fourteen studies mentioned a crystalloid fluid preload prior to inserting the spinal or CSE; the volumes administered varied: 500 mL (Brizzi 2005; Fabris 2013a; Ithnin 2006; Kim 1997; Lew 2004; Macfarlane 2009), 1000 mL (Kim 1995; Kim 2003; Salman 2013), 1000 mL plus 500 mL of hetastarch (Horstman 2009), 1500 mL to 2000 mL (Thoren 1994). Three studies gave crystalloid preload boluses based on the participants weight: 10 mL/kg (Tyagi 2009), 15 mL/kg (Uysallar 2011), 20 mL/kg (Choi 2006).
Two studies gave a prophylactic 5 mg dose of ephedrine prior to the insertion of the CSE or spinal anaesthetic (Brizzi 2005; Salman 2013).
Where stated, the women's positioning for the block was relatively evenly divided between sitting (Brizzi 2005; Fabris 2013a; Macfarlane 2009; Ross 2014; Thoren 1994; Tyagi 2009; Uysallar 2011) and the right lateral recumbent position (Choi 2006; Horstman 2009; Ithnin 2006; Kim 1997; Lew 2004; Lim 2006; Salman 2013). One study (McAndrew 2003) permitted the proceduralist to choose between these two positions, based on personal preference. Three further studies (Abizanda 2007; Kim 1995; Kim 2003) did not report the position the blocks were performed in.
While all blocks were performed at the lumbar spine level, there was significant variation in the particular level of insertion between the studies. Four studies performed the block at the third lumbar interspace (Choi 2006; Horstman 2009; Ithnin 2006; Macfarlane 2009), while two studies performed the block at the fourth lumbar interspace (Lew 2004; Tyagi 2009) and one study (Abizanda 2007) performed blocks at the level of the intercristal line. Seven studies allowed the proceduralist to choose between two levels, ranging from the second and third or third and fourth lumbar interspace (Fabris 2013a; Kim 1997; Kim 2003; Lim 2006; McAndrew 2003; Salman 2013; Uysallar 2011). One study performed the block at the second lumbar interspace (Thoren 1994) and another at the first lumbar interspace (Brizzi 2005). These higher spinal level blocks could conceivably influence the attributes these blocks in comparison to most of the other studies where lower lumbar levels were targeted, particularly in reference to the number of women with hypotension. Additionally spinal anaesthesia at high lumbar interspaces (first or second) is generally not advised due to variability in the caudal extension of the cauda equina, which may be into the lumbar region, with the possibility of inadvertent nerve injury. One study (Fabris 2013a), which performed the blocks in the sitting position at the third or fourth lumbar interspace, kept the participant in the sitting position after completion of the block for three minutes to "anchor‐fix the block". Two studies (Kim 1995; Ross 2014) did not mention the spinal level at which the blocks were performed.
Sample sizes
Of the studies included, four had 100 or more participants (Abizanda 2007; Brizzi 2005; Choi 2006; Salman 2013), six studies had between 50 and 100 participants (Fabris 2013a; Lew 2004; Kim 1997; Macfarlane 2009; McAndrew 2003; Tyagi 2009) and the remaining eight studies had fewer than 50 participants (Horstman 2009; Ithnin 2006; Kim 1995; Kim 2003; Lim 2006; Ross 2014; Thoren 1994; Uysallar 2011).
Participants
All trials included healthy women, with the exception of one study that was specifically examining obese parturients (Ross 2014). Most studies required the women to be low risk according to the American Society of Anesthesiology (ASA) category I or II (Fabris 2013a; Horstman 2009; Ithnin 2006; Lew 2004; Lim 2006; Macfarlane 2009; Salman 2013; Thoren 1994; Tyagi 2009; Uysallar 2011). Of the five studies that did not mention an ASA grade, four studies (Brizzi 2005; Kim 1995; Kim 1997; Kim 2003) stipulated that the participants must be "healthy" but did not mention any other inclusion criteria apart from being full‐term gestation. When mentioned, obesity was generally an exclusion criterion, with a number of studies setting upper limits for either body weight or body mass index (BMI). Two studies excluded women with a BMI above 35 kg/m2 (Ithnin 2006; Tyagi 2009), while one study (Horstman 2009) excluded women with a BMI above 40 kg/m2. Two studies excluded women based on elevated body weight: above 100 kg (Salman 2013), and above 110 kg (Fabris 2013a).
The potential for extremes of height to influence the response to SSS or CSE anaesthesia resulted in some studies setting upper and lower limits as exclusion criteria. Tyagi 2009 and Ithnin 2006 only included women between 145 and 180 cm, Lew 2004 between 150 and 170 cm, Horstman 2009 above 150 cm, and Salman 2013 above 155 cm. The remaining studies did not set limits on women's height as inclusion or exclusion criteria.
Seven studies only included women who were at term gestation (Brizzi 2005; Choi 2006; Fabris 2013a; Salman 2013; Thoren 1994; Tyagi 2009; Uysallar 2011), although none of these studies defined this criterion. Only one other study (Macfarlane 2009) mentioned a minimum gestation of 36 weeks for inclusion, while the remaining studies did not include gestation as part of the inclusion criteria. Multiple gestation was an exclusion criterion in nine studies (Choi 2006; Fabris 2013a; Horstman 2009; Ithnin 2006; Lew 2004; Macfarlane 2009; Thoren 1994; Tyagi 2009; Uysallar 2011).
Eleven studies specifically mentioned contraindications to regional anaesthesia as an exclusion criterion (Abizanda 2007; Choi 2006; Horstman 2009; Ithnin 2006; Lew 2004; Lim 2006; Macfarlane 2009; McAndrew 2003; Ross 2014; Tyagi 2009; Uysallar 2011). There were a range of other specific exclusion criteria, including hypertensive disorders of pregnancy (Choi 2006; Fabris 2013a; Horstman 2009; Ithnin 2006; Lew 2004; Macfarlane 2009; Salman 2013), placenta praevia (Choi 2006; Salman 2013; Tyagi 2009), diabetes (Horstman 2009; Salman 2013), maternal cardiac conditions (Choi 2006; Macfarlane 2009) and being in labour (Fabris 2013a; Horstman 2009; Ithnin 2006; Tyagi 2009). Thoren 1994 excluded any women with "complications" but did not specify what these might be.
Interventions and comparisons
There was considerable heterogeneity between trials in the techniques and equipment used to perform the neuraxial blocks and the drugs and doses used. As described in the Types of interventions section, we subcategorised the spinal anaesthetic dose into high‐dose or low‐dose spinal anaesthesia (low‐dose defined as a subarachnoid local anaesthetic dose of less than 10 mg bupivacaine). We further subcategorised the CSE intervention groups according to:
-
no epidural use (no ED use), sequential CSE and epidural volume extension (EVE);
-
needle through needle (N‐t‐N) or two‐level CSE.
See Table 1 for the distribution of these subgroups. As there were very few studies with small numbers of women, we have not conducted any subgroup analysis based on the needle‐through‐needle or two‐level types of CSE interventions.
|
| CSE: Needle‐through‐needle | CSE: Two injection | ||||
| SPINAL | No ED use | Sequential | EVE | No ED use | Sequential | EVE |
| High‐dose | ‐ | ‐ | ‐ | |||
| Low‐dose | ‐ | ‐ | ||||
Abizanda 2007 is not included in this table as the doses of drugs used and the mode of administration were not stated
Most studies compared two groups of women (SSS versus CSE); however, Abizanda 2007 had four groups comparing two CSE groups (with and without introducer needle) and two SSS groups (different depths of introducer needle insertion). Salman 2013 studied three groups of women: 1) SSS, 2) CSE with EVE, and 3) CSE with LD sequential. Tyagi 2009 also studied three groups of women: 1) SSS, 2) CSE with no ED use, and 3) CSE with EVE. Most of the studies used a N‐t‐N technique for the CSE, with only Brizzi 2005 using two separate injections (at the same lumbar interspace).
Intrathecal drugs and doses
Hyperbaric bupivacaine was the most commonly used local anaesthetic for intrathecal injections (Choi 2006; Horstman 2009; Ithnin 2006; Kim 1995; Kim 2003; Lew 2004; Lim 2006; Macfarlane 2009; Ross 2014; Thoren 1994; Tyagi 2009; Uysallar 2011). Three studies used levobupicaine, with Fabris 2013a using a hyperbaric solution, while Brizzi 2005 and Salman 2013 used isobaric solutions. Only one study used hyperbaric lidocaine as the other local anaesthetics used for intrathecal injection (Kim 1997).
In the SSS groups, doses of hyperbaric bupivacaine ranged from 9 mg (Choi 2006; Lew 2004; Tyagi 2009), 10 mg (Ithnin 2006; Lim 2006), 12 mg (Horstman 2009; Ross 2014) and 12.5 mg (Kim 1995; Macfarlane 2009; Thoren 1994; Uysallar 2011). In the SSS groups using levobupivicaine or lidocaine (Brizzi 2005; Fabris 2013a; Kim 1997; Salman 2013), the doses were all calculated based on the participant's height (see Characteristics of included studies for details).
In the CSE groups, the doses of intrathecal local anaesthetic were usually the same as the SSS groups if the epidural catheter was either not inserted or not used (Horstman 2009; Ithnin 2006; Lim 2006; Macfarlane 2009; Ross 2014). This dosing regimen was due to the fact that these studies were generally trying to demonstrate a difference in the characteristics of an identical intrathecal injection in the presence or absence of the CSE technique. Salman 2013 did however use the same intrathecal dose of local anaesthetic in all three groups, two of which were CSE groups with either EVE or LD sequential techniques. In the remaining studies, the intrathecal doses in the CSE groups were reduced by varying amounts (around 50%: Fabris 2013a; Lew 2004); around 35%: Choi 2006; Brizzi 2005; Kim 1995; Kim 2003; Thoren 1994; Uysallar 2011). Kim 1997 used over twice the dose of lidocaine in the CSE group, using between 105 and 135 mg given through the epidural catheter. McAndrew 2003 did not report the drugs or doses used in either spinal or epidural injections in their study.
Ten studies reported using intrathecal opioids including fentanyl, sufentanil, meperidine, morphine and diamorphine. Fentanyl was the most commonly used intrathecal opioid, with doses ranging from 10 mcg (Horstman 2009; Horstman 2009; Tyagi 2009), 20 mcg (Choi 2006; Kim 2003; Ross 2014; Salman 2013) or a range between 15 to 25 mcg increasing with participant height (Fabris 2013a). Brizzi 2005 was the only study to use sufentanil (5 mcg), Macfarlane 2009 was the only study to use diamorphine (300 mcg), and Kim 1997 was the only study to use meperidine (25 mg). Morphine (200 mcg) was used in combination with fentanyl by Horstman 2009 and Ross 2014. Four studies did not use any intrathecal opioid adjuvants (Ithnin 2006; Lim 2006; Thoren 1994; Uysallar 2011). When opioids were used in the SSS, the same opioid and dose were used in the intrathecal component of the CSE group in the same studies.
The techniques used to locate the epidural space also varied. Seven studies used loss of resistance to air (LORTA), with Horstman 2009, Ithnin 2006, Lim 2006, and Tyagi 2009 limiting the volume of air to be injected to less that two millilitres in an attempt to reduce the potential effects of epidural air injection on thecal sac compression and intrathecal drug spread. Fabris 2013a avoided the potential for this influence by using a "hanging drop" technique. Seven studies used loss of resistance to saline (LORTS), although volumes were not specified (Brizzi 2005; Kim 2003; Macfarlane 2009; Ross 2014; Salman 2013; Thoren 1994; Uysallar 2011). McAndrew 2003 allowed the proceduralist to choose between LORTS or LORTA.
Epidural drugs and doses
While all the studies included in this review compared SSS to CSE, there was considerable variation in the way the CSE technique was used. Seven studies used a LD sequential CSE only (Brizzi 2005; Choi 2006; Kim 1995; Kim 1997; Kim 2003; Thoren 1994; Uysallar 2011) and a further two studies used EVE CSE only (Fabris 2013a; Lew 2004). Salman 2013 compared SSS to both EVE and LD sequential groups, and Tyagi 2009 compared SSS to a CSE‐EVE group and a CSE‐no epidural catheter use group. Four of the remaining six studies did not insert epidural catheters (Horstman 2009; Ithnin 2006; Lim 2006; Macfarlane 2009), while the remaining two did not use the catheters in the initial establishment of anaesthesia for caesarean section (McAndrew 2003; Ross 2014). In one study (Abizanda 2007) the outcome was the incidence of paraesthesia at needle insertion and the doses of drugs used for surgery were not reported.
In the EVE groups, 20 mL of saline was the most volume injected in Fabris 2013a. This was in the context of the lowest dose of intrathecal local anaesthetic as part of a CSE technique amongst all the studies (4 to 4.4 mg of hyperbaric levobupivicaine). The remaining CSE‐EVE groups used either 5 mL or 6 mL of saline (Lew 2004; Salman 2013; Tyagi 2009). In the LD sequential groups, isobaric bupivicaine was the most commonly used local anaesthetic, with Choi 2006 using 10 mL of 0.25% bupivicaine five minutes after intrathecal injection for all CSE group participants. Both Thoren 1994 and Uysallar 2011 gave a 2 mL test dose of epidural 0.5% bupivicaine 15 minutes after the intrathecal injection and then gave a further 2 mL of the same solution for each dermatomal segment with preserved sensation to pin‐prick up to the fourth thoracic dermatome. Brizzi 2005 used between 10 and 12 mL of 0.25% levobupivicaine epidurally based on the participant's height as the LD sequential dose after the 5 mg of levobupivicaine intrathecal spinal dose. Salman 2013 used 5 mL of 0.5% levobupivicaine in the LD sequential group of their study.
Equipment
Heterogeneity in the equipment used for the neuroaxial techniques was important to consider in this review, as certain types of spinal needles in particular can increase the risk of post‐dural puncture headache (PDPH). It has been suggested that it may even be unethical to use 'cutting' Quinke needles in obstetric research, given the significantly increased risk of PDPH and the need for epidural blood patching (Heard 2002). Four studies in this review (Kim 1995; Salman 2013; Thoren 1994; Uysallar 2011) used Quinke spinal needles in both the SSS and CSE groups. The remaining studies used a variety of atraumatic spinal needles, including Whitacre, Sprotte, Gertie Marx and other pencil‐point varieties for the SSS and CSE groups. Six studies (Abizanda 2007; Choi 2006; Horstman 2009; Lew 2004; McAndrew 2003; Ross 2014) mentioned the use of spinal needle introducers, ranging between 19‐ and 20‐gauge needles, except for McAndrew 2003 who did not specify the gauge of introducer used.
All CSE were inserted using Tuohy needles ranging from 16‐gauge to 19‐gauge in size. Thirteen studies inserted epidural catheters as part of the CSE technique, although only three studies specified the gauge of catheter (Brizzi 2005; Choi 2006; Uysallar 2011). Choi 2006 was the only study to use a 'sham catheter' stuck to the participant's back in the SSS group to ensure blinding of the participant to the technique used. The remaining studies either did not mention catheter insertion (Abizanda 2007; Macfarlane 2009) or did not insert one at all (Horstman 2009; Ithnin 2006; Lim 2006).
Outcomes
Ten of the studies included in this review stated that they conducted a pre‐study power analysis relating to their primary outcome. The remaining eight studies (Abizanda 2007; Brizzi 2005; Fabris 2013a; Kim 1995; Kim 1997; Kim 2003; Thoren 1994; Uysallar 2011) did not mention power analysis but did describe primary outcomes.
Of the 10 studies with primary outcomes supported by a stated power analysis, peak sensory level was the most common primary outcome (Horstman 2009; Ithnin 2006; Lim 2006; Salman 2013; Tyagi 2009). Primary outcomes related to hypotension were the next most common (Choi 2006; Lew 2004; Macfarlane 2009), followed by the incidence of paraesthesia during insertion of block (McAndrew 2003) and time from insertion of introducer to intrathecal injection (Ross 2014). One study (Kim 2003) compared three different types of sensory modalities to evaluate differences in maximal sensory block level; this was not an outcome of this review.
Excluded studies
The three studies excluded from this review can be found under the Excluded studies section and the reason for their exclusion in the table of Characteristics of excluded studies. The excluded studies examined postoperative pain relief, which is not relevant for this review.
Risk of bias in included studies
There was a wide range of methodological quality. Overall, the studies were at moderate risk of bias. Details are shown in the table of Characteristics of included studies. Also see Figure 2; and Figure 3 for summaries of ’Risk of bias’ assessments for all studies.

Risk of bias graph: review authors' judgements about each risk of bias item presented as percentages across all included studies.
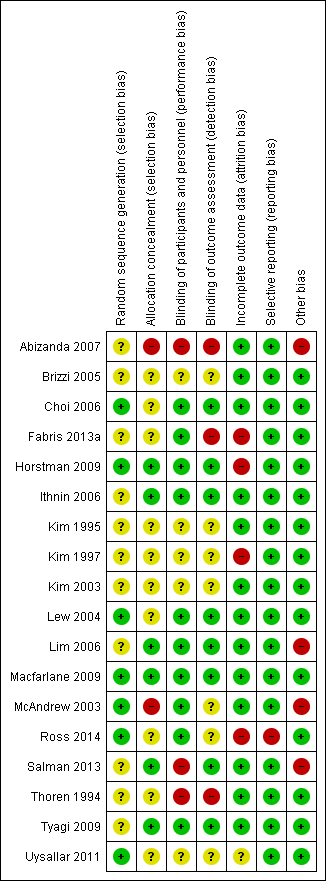
Risk of bias summary: review authors' judgements about each risk of bias item for each included study.
Allocation
Sequence generation
All included studies stated that women were randomised into either group. Randomisation was achieved in seven studies using computer generation (Choi 2006; Horstman 2009; Lew 2004; Macfarlane 2009; McAndrew 2003; Ross 2014; Uysallar 2011) and we rated them at low risk of bias. We rated the remaining 11 studies at unclear risk of bias because there was no information provided about the generation of randomisation (Abizanda 2007; Brizzi 2005; Fabris 2013a; Ithnin 2006; Kim 1995; Kim 1997; Kim 2003; Lim 2006; Salman 2013; Thoren 1994; Tyagi 2009).
Allocation concealment
We judged allocation concealment to be at low risk of bias in studies which used sealed opaque envelopes (Horstman 2009; Ithnin 2006; Lim 2006; Macfarlane 2009; Salman 2013; Tyagi 2009). Whilst McAndrew 2003 also used 'sealed envelopes' the allocation of operator was not randomised or concealed and there were three grades of operator experience involved; it is possible that some selection bias may have been generated at this point. We therefore assessed McAndrew 2003 as being at high risk of selection bias. We judged one other study (Abizanda 2007) as high risk of bias, because the anaesthetist revealed the allocation.
In Ross 2014, a binder was used but it was not clear whether the pages were sealed, opaque, or interchangeable, so we assessed this study as being at unclear risk of selection bias. The remaining nine studies did not report on a concealment method (Brizzi 2005; Choi 2006; Fabris 2013a; Kim 1995; Kim 1997; Kim 2003; Lew 2004; Thoren 1994; Uysallar 2011).
Blinding
Performance bias
For all studies included, it was impossible to blind the proceduralist performing the technique.
Detection bias
Eight studies had adequate blinding of assessors and were assessed as being at low risk of detection bias (Choi 2006; Horstman 2009; Ithnin 2006; Lew 2004; Lim 2006; Macfarlane 2009; Salman 2013; Tyagi 2009). In contrast, there was no blinding of assessors in three studies (Abizanda 2007; Fabris 2013a; Thoren 1994) and we rated these at a high risk of detection bias. Risk of detection bias was unclear in seven studies: six because there was insufficient information in the trial report to permit assessment (Brizzi 2005; Kim 1995; Kim 1997; Kim 2003; Ross 2014; Uysallar 2011), and in McAndrew 2003 the use of a blinded observer was attempted but proved unworkable.
Incomplete outcome data
Eight of the studies explicitly mentioned that there was no loss of participants and that intention‐to‐treat analysis was performed or implied as a result (Abizanda 2007; Brizzi 2005; Ithnin 2006; Kim 1995; Lew 2004; Lim 2006; Macfarlane 2009; Salman 2013); we assessed these as being at a low risk of attrition bias. Two studies (Thoren 1994; Tyagi 2009) did not mention any participant dropout and all participants appeared to be accounted for in the respective Results sections (low risk of bias). One study (Kim 2003) did not mention participant dropout and only some results stated the number of participants analysed, but we assessed this as low risk of attrition bias. McAndrew 2003 conducted an intention‐to‐treat analysis by including one woman in the CSE group despite the fact that she received only a SSS after experiencing persistent paraesthesia on insertion of the Tuohy needle (low risk of bias).
Uysallar 2011 reported no loss of participants but we deemed it to be at an unclear risk of bias because a number of outcomes were only reported as percentages, without absolute numbers.
Five studies excluded women based on: study protocol violation (Ross 2014, 3/44 or 7%), failed attempt at regional anaesthesia (Choi 2006, 2/102 or 2%; Kim 1997, 4/54 or 7%; Horstman 2009, 2/30 or 7%) and recognised dural puncture with Touhy needle during insertion of CSE (Fabris 2013a, 1/77 or 1%). We assessed Ross 2014, Kim 1997, Horstman 2009 and Fabris 2013a as being at high risk of attrition bias. We rated Choi 2006 at low risk of attrition bias because the data can be identified against the outcome of 'complications of the interventions'. These studies did not use intention‐to‐treat analysis. One study (Fabris 2013a) reported different numbers of participants in the abstract and Methods section and then misreported the numbers of women in a table of participant characteristics.
Selective reporting
We did not assess any trial protocols for this review, but all outcomes listed were reported within each paper, including any non‐significant findings. We rated one study (Ross 2014) at high risk of reporting bias as a number of secondary outcomes were first mentioned in the Results or Discussion sections. We judged the remaining 17 studies to be at low risk of reporting bias (Abizanda 2007; Brizzi 2005; Choi 2006; Fabris 2013a; Horstman 2009; Ithnin 2006; Kim 1995; Kim 1997; Kim 2003; Lew 2004; Lim 2006; Macfarlane 2009; McAndrew 2003; Salman 2013; Thoren 1994; Tyagi 2009; Uysallar 2011).
Other potential sources of bias
There were four studies which we deemed to be at a high risk for other sources of bias. Abizanda 2007 is a technical study assessing paraesthesia on needle insertion with subtle differences in needle placement. Without further information from the authors about drugs administered and any other secondary outcomes, we did not include the study data as part of this review. McAndrew 2003 had a significantly higher proportion of women with a high BMI in the SSS group compared to CSE, as well as a variety of positioning and techniques used within the study to insert the spinal or epidural needle. Hypotension was not defined, nor was any protocol provided for the administration of phenylephrine in Lim 2006. In Salman 2013, the spinal doses given varied according to height, which made the 'High‐dose versus low‐dose' categorisation problematic. As most women received a high‐dose spinal, we included this study as a 'high‐dose' spinal study.
We judged the remaining 14 studies to be at low risk of other potential sources of bias (Brizzi 2005; Choi 2006; Fabris 2013a; Horstman 2009; Ithnin 2006; Kim 1995; Kim 1997; Kim 2003; Lew 2004; Macfarlane 2009; Ross 2014; Thoren 1994; Tyagi 2009; Uysallar 2011).
Effects of interventions
See: Summary of findings for the main comparison Combined spinal‐epidural compared to high‐dose spinal for caesarean section; Summary of findings 2 Combined spinal‐epidural compared to low‐dose spinal for caesarean section
1.Combined spinal‐epidural compared to high‐dose spinal for caesarean section
Please see summary of findings Table for the main comparison.
Primary outcomes
Number of women requiring a repeat regional block or a general anaesthetic as a result of failure to establish adequate initial blockade
No studies examined this as a primary outcome, but seven studies reported it as a secondary outcome (Horstman 2009; Ithnin 2006; Lim 2006; Macfarlane 2009; McAndrew 2003; Thoren 1994; Uysallar 2011). With a total of only five events in just two of the studies (Horstman 2009; McAndrew 2003), there may be little or no difference in the number of women requiring a repeat regional block or a general anaesthetic as a result of failure to establish adequate initial blockade between CSE versus high‐dose spinal (risk ratio (RR) 0.32, 95% confidence interval (CI) 0.05 to 1.97; 7 studies, 341 women; low‐quality evidence; Analysis 1.1).
Number of women requiring supplemental intra‐operative analgesia at any time after CSE or spinal anaesthetic insertion
No studies examined the number of women requiring supplemental intra‐operative analgesia at any time after CSE or spinal anaesthetic insertion as a primary outcome, but seven studies reported it as a secondary outcome (Horstman 2009; Ithnin 2006; Lim 2006; Macfarlane 2009; Salman 2013; Thoren 1994; Uysallar 2011). Four of these studies had no events in both arms of the study, and in the other three studies (Salman 2013; Thoren 1994; Uysallar 2011) there was a total of 37 events. There was marked heterogeneity between these three studies and we used a random‐effects analysis (average RR 1.25, 95% CI 0.19 to 8.43; Tau2 = 2.31, I2 = 65%; 7 studies, 390 women; very low‐quality evidence; Analysis 1.2), which was not resolvable by subgroup analysis based on the predetermined CSE subgroups. Because of this heterogeneity and the very wide CI we are uncertain about this result.
Number of women requiring intra‐operative conversion to general anaesthesia
No studies examined the number of women requiring intra‐operative conversion to general anaesthesia as a primary outcome, but seven studies reported it as a secondary outcome (Horstman 2009; Ithnin 2006; Lim 2006; Macfarlane 2009; Salman 2013; Thoren 1994; Uysallar 2011). There was only one study (Thoren 1994) with any events, i.e. one in each group from a total of 42 women. Overall, we are uncertain about this result (RR 1.00, 95% CI 0.07 to 14.95; 7 studies, 388 women; Analysis 1.3).
Number of women satisfied with their anaesthesia
Kim 1995 and Thoren 1994 were the only two studies from the high‐dose spinal group to examine the number of women satisfied with their anaesthesia. This was tested by asking the women to rate their analgesia as either excellent, good, fair or poor. For the purposes of this review, we considered a rating of excellent or good analogous with this review's outcome of satisfaction with anaesthesia. We are uncertain about the results for this outcome, as it is based on very low‐quality evidence (RR 0.93, 95% CI 0.73 to 1.19 2 studies, 72 women; Analysis 1.4).
Secondary outcomes (maternal)
Mean time and standard deviation from start of the regional anaesthetic to effective anaesthesia for surgery
Five studies examined mean time and standard deviation from the start of the regional anaesthetic to effective anaesthesia for surgery as a secondary outcome (Kim 1995; Kim 1997; Macfarlane 2009; Thoren 1994; Uysallar 2011). Whilst the results generally appeared to favour the high‐dose spinal group, we observed substantial heterogeneity (I2 = 95%) and we therefore decided not to pool these results in meta‐analysis (see Analysis 1.5).
Number of women with intra‐operative hypotension requiring treatment or intervention specifically identified
Five studies reported on hypotension as a secondary outcome (Ithnin 2006; Kim 1997; Lim 2006; Thoren 1994; Uysallar 2011). All studies used either phenylephrine or ephedrine to treat the hypotension. We did not include Uysallar 2011, as they reported the number of hypotensive episodes rather than the incidence of hypotension. There was no evidence of a difference in the incidence of hypotension requiring treatment in women who received CSE (46/86) or high‐dose spinal (41/76) (RR 1.01, 95% CI 0.76 to 1.33; 4 studies, 162 women; Analysis 1.6).
Number of women with intra‐operative nausea or vomiting or both, requiring treatment or intervention specifically identified
Five studies reported nausea and vomiting as a secondary outcome (Ithnin 2006; Kim 1997; Lim 2006; Thoren 1994; Uysallar 2011), but only one study included an anti‐emetic as treatment for nausea or vomiting. Thoren 1994 used dixyrazine. There was an increased incidence of nausea or vomiting or both requiring treatment in women who received CSE (13/21) compared to high‐dose spinal (6/21) (RR 2.17, 95% CI 1.02 to 4.61; Analysis 1.7) but this result is based on just one small study involving 42 women.
Mean time and standard deviation from admission to discharge from the postanaesthesia recovery unit
No studies examined this outcome.
Number of women requiring follow‐up for an adverse outcome present at one month or more after the procedure and specifically identified: meningitis, neuropraxia, paralysis, backache, footdrop, unresolved post‐dural puncture headache (PDPH)
No studies examined these outcomes.
Number of women with a PDPH
Three studies reported this as a secondary outcome (Kim 1995; Ross 2014; Thoren 1994), with only Kim 1995 reporting any events (5/15 women in the CSE group and 6/15 women in the high‐dose spinal group) (RR 0.83, 95% CI 0.32 to 2.15; 3 studies, 113 women; Analysis 1.8). No women in the remaining studies experienced a headache (Ross 2014; Thoren 1994). One other study (Kim 1997) reported women who experienced a 'mild headache', which was deemed not to be PDPH.
Secondary outcomes (neonatal)
All neonatal outcomes reported were secondary outcomes, both in this review and in the studies reporting the outcome.
Number of neonates admitted to the neonatal unit
No studies reported this outcome.
Mean pH and standard deviation in the neonate for umbilical artery, umbilical vein, umbilical cord
One study (Uysallar 2011) reported this outcome. The mean pH was 7.25 in the CSE group and 7.26 in the high‐dose spinal group (standardised mean difference (SMD) −0.18, 95% CI −0.80 to 0.44; 40 babies; Analysis 1.9).
Number of neonates with Apgar scores less than seven at five minutes
Four studies (Kim 1997; Macfarlane 2009; Thoren 1994; Uysallar 2011) reported this outcome; there were no babies who had an Apgar score less than seven at five minutes (4 studies, 182 babies; Analysis 1.10.
2. Combined spinal‐epidural compared to low‐dose spinal for caesarean section
Please see summary of findings Table 2.
Primary outcomes
Number of women requiring a repeat regional block or a general anaesthetic as a result of failure to establish adequate initial blockade
There may be little or no difference between the CSE and low‐dose spinal groups in the number of women requiring a repeat regional block or general anaesthetic as a result of failure to establish adequate initial blockade (RR 4.81, 95% CI 0.24 to 97.80; 3 studies, 224 women; low‐quality evidence; Analysis 2.1). No studies examined this as a primary outcome but three studies reported it as a secondary outcome (Choi 2006; Lew 2004; Tyagi 2009). There were zero events in Lew 2004 and Tyagi 2009, but in Choi 2006 (102 women), two women in the CSE group required a repeat regional block or general anaesthetic as a result of failure to establish initial blockade.
Number of women requiring supplemental intra‐operative analgesia at any time after CSE or spinal anaesthetic insertion
No studies examined this as a primary outcome but four studies reported it as a secondary outcome (Choi 2006; Fabris 2013a; Lew 2004; Tyagi 2009). Only two studies (Fabris 2013a; Lew 2004) had any events. There is probably little or no difference in the number of women requiring supplemental intra‐operative analgesia at any time after CSE or spinal anaesthetic insertion between the CSE (12/68) or low‐dose spinal (7/70) group (RR 1.75, 95% CI 0.78 to 3.92; 4 studies, 298 women; moderate‐quality evidence; Analysis 2.2).
Number of women requiring intra‐operative conversion to general anaesthesia
No studies examined this as a primary outcome but three studies reported it as a secondary outcome (Choi 2006; Lew 2004; Tyagi 2009). As there were no events in both arms of all three studies it was not possible to draw any conclusions (3 studies, 222 women; low‐quality evidence; Analysis 2.3).
Number of women satisfied with their anaesthesia
No studies examined the number of women satisfied with their anaesthesia.
Secondary outcomes (maternal)
Mean time and standard deviation from start of the regional anaesthetic to effective anaesthesia for surgery
Two studies examined this as a secondary outcome (Choi 2006; Tyagi 2009). Low‐dose spinal had a slightly faster mean time to onset compared to CSE (SMD 0.85 minutes, 95% CI 0.52 to 1.18; 2 studies, 160 women; Analysis 2.4).
Number of women with intra‐operative hypotension requiring treatment or intervention specifically identified
Four studies reported on hypotension as a secondary outcome (Brizzi 2005; Choi 2006; Fabris 2013a; Tyagi 2009). All studies used either phenylephrine or ephedrine to treat the hypotension. CSE had a reduced incidence of hypotension requiring treatment (52/179) compared with low‐dose spinal (79/157). We observed substantial heterogeneity in our analysis and used a random‐effects model (average RR 0.59, 95% CI 0.38 to 0.93; I2 = 53%, Tau2 = 0.11; 4 studies, 336 women; Analysis 2.5).
Number of women with intra‐operative nausea or vomiting or both, requiring treatment or intervention specifically identified
Four studies reported nausea and vomiting as a secondary outcome (Brizzi 2005; Choi 2006; Fabris 2013a; Tyagi 2009), but only one of the studies included an anti‐emetic as treatment for nausea or vomiting; Brizzi 2005 used ondansetron. There were similar numbers of women with nausea or vomiting requiring treatment in the CSE group (3/50) compared with low‐dose spinal (6/50) (RR 0.50, 95% CI 0.13 to 1.89; 1 study, 100 women; Analysis 2.6).
Mean time and standard deviation from admission to discharge from the postanaesthesia recovery unit
No studies examined this outcome.
Number of women requiring follow‐up for an adverse outcome present at one month or more after the procedure and specifically identified: meningitis, neuropraxia, paralysis, backache, footdrop, unresolved PDPH
No studies examined these outcomes.
Number of women with a PDPH
Two studies measured this as a secondary outcome (Fabris 2013a; Lew 2004), but there were no events in either study (2 studies, 138 women; Analysis 2.7).
Secondary outcomes (neonatal)
All neonatal outcomes reported were secondary outcomes in both this review and the studies reporting the outcome.
Number of neonates admitted to the neonatal unit
No studies reported this outcome.
Mean pH and standard deviation in the neonate for umbilical artery, umbilical vein, umbilical cord
One study (Fabris 2013a) reported this outcome. There was no clinical difference in neonatal blood pH between infants born to mothers who received CSE or low‐dose spinal anaesthesia, despite a higher pH level detected in babies born to mothers who received CSE compared with those who received low‐dose spinal study (SMD 1.17, 95% CI 0.68 to 1.66; 1 study, 76 babies; Analysis 2.8).
Number of neonates with Apgar scores less than seven at five minutes
Only one study (Tyagi 2009) examined this outcome; there were no infants with an Apgar scores less than seven at five minutes born to mothers who received CSE or low‐dose spinal (1 study, 60 babies; Analysis 2.9).
Discussion
Summary of main results
The body of evidence identified by this review is based on 18 studies with 1272 participating women; however, all of our analyses are based on far fewer numbers of studies and women. We compared the effect of combined spinal‐epidural (CSE) with either high‐dose (comparison 1) or low‐dose single‐shot spinal anaesthesia (SSS) (comparison 2).
For the primary outcomes, there was no evidence of any differences in studies comparing CSE to high‐dose spinal anaesthetic (10 mg or more of bupivacaine) or those comparing CSE to low‐dose spinal anaesthesia (less than 10 mg bupivacaine). The four primary outcomes were the number of women who required a repeat regional block or a general anaesthetic as a result of failure to establish adequate initial blockade; supplemental intra‐operative analgesia at any time after CSE or spinal anaesthetic insertion; intra‐operative conversion to general anaesthesia; and satisfaction with the type of anaesthesia administered. Overall, the quality of evidence for the primary and GRADE‐relevant outcomes ranged from moderate to very low (summary of findings Table for the main comparison; summary of findings Table 2).
We found some differences in the secondary maternal outcomes but no clinically significant differences for neonatal outcomes. Because of substantial heterogeneity, we did not pool the data for CSE versus high‐dose spinal for the outcome of effective anaesthesia, but the mean time to effective anaesthesia was faster in women who received low‐dose spinal compared to CSE. It is, however, unlikely that the magnitude of this difference is clinically meaningful.
For maternal side effects, there was no evidence of a difference in the incidence in hypotension requiring treatment in women receiving CSE compared to high‐dose spinal, although there appeared to be a reduction in the incidence of hypotension requiring treatment in women receiving CSE compared to low‐dose spinal.
There was an increased incidence of nausea and vomiting requiring treatment in women receiving CSE (13/21) compared to high‐dose spinal (6/21). We did not observe this difference in the comparison of CSE (3/50) versus low‐dose spinal (6/50).
There was a similar rate of post‐dural puncture headache in women who received CSE (5/56) or high‐dose spinal (6/57), and no cases of post‐dural puncture headache were reported in the studies comparing CSE to low‐dose spinal. No studies reported women requiring follow‐up for an adverse outcome present at one month or more after the procedure. No infants had an Apgar score less that seven at five minutes, regardless of the dose or type of anaesthesia the mother received.
Overall completeness and applicability of evidence
There were 11 trials in the CSE versus high‐dose spinal comparison and five trials in the comparison of CSE versus low‐dose spinal (Abizanda 2007; Kim 2003 did not contribute data towards our analyses). Participants were relatively homogeneous: all trials included healthy women at term, with the exception of one study that specifically examined obese women (Ross 2014). These results can therefore be applied to healthy women groups, undergoing caesarean section.
Trials were conducted in Western countries, including Europe (Brizzi 2005; Fabris 2013a; Macfarlane 2009; Thoren 1994), Turkey (Salman 2013; Uysallar 2011), USA and Australia (Horstman 2009; McAndrew 2003; Ross 2014) and in Eastern regions such as Asia (Choi 2006; Ithnin 2006; Kim 1995; Kim 1997; Lew 2004; Lim 2006) and India (Tyagi 2009). The evidence is therefore applicable to a wide range of demographics.
Quality of the evidence
From a strictly methodological point of view most included studies must be considered to be of moderate quality. For all studies included, it is impossible to blind the proceduralist performing the technique, but we rated fewer than half of the studies as being at high or unclear risk of bias, as it was not clear if assessors were blinded. This is an important consideration for future studies. Furthermore, over half the studies did not state whether randomisation occurred, with only 40% of included studies using computer‐generated randomisation.
For our comparison of CSE versus high‐dose spinal, our GRADE assessments ranged from low to very low, with downgrading decisions based on imprecision (small sample sizes, wide confidence intervals crossing the line of no effect), inconsistency (unexplained heterogeneity) and limitations in study design (risks of bias). See summary of findings Table for the main comparison.
For our comparison of CSE versus low‐dose spinal, our GRADE assessments ranged from moderate to low, with downgrading decisions based on imprecision (e.g. small sample sizes, wide confidence intervals crossing the line of no effect, zero events). See summary of findings Table 2.
Three studies (Brizzi 2005; Kim 1995; Kim 1997) did not report obtaining prior ethics committee approval and these studies also did not mention if informed written consent was provided by the participants in the trial. We included these studies in this review after obtaining advice from the Pregnancy and Childbirth Group. Obtaining prior ethics committee approval and informed consent is a fundamental requirement for contemporary randomised controlled trials, so this is an important consideration for future reviews.
Potential biases in the review process
This review was performed according to procedures described in the Cochrane Handbook for Systematic Reviews of Interventions (Higgins 2011). In addition to the search of the Cochrane Pregnancy and Childbirth Group’s Trials Register, we searched ClinicalTrials.gov, the WHO International Clinical Trials Registry Platform (ICTRP) and congress proceedings for unpublished, planned and ongoing trial reports and abstracts. In this review, we undertook a comprehensive and systematic search of databases to reduce the potential for publication bias, and did not apply any language, date, or publication status restrictions. All processes in the review were independently checked by two review authors. In case of disagreement, a third and fourth review author were involved. We contacted authors with published study protocols and asked for the actual status, and whether there were data available for inclusion in the current review. We can therefore be confident that we identified all trials that met our criteria.
Agreements and disagreements with other studies or reviews
We identified no other studies or reviews that addressed this area of research.
Risk of bias graph: review authors' judgements about each risk of bias item presented as percentages across all included studies.
Risk of bias summary: review authors' judgements about each risk of bias item for each included study.

Comparison 1 CSE versus high‐dose spinal, Outcome 1 Number of women requiring a repeat regional block or a general anaesthetic as a result of failure to establish adequate initial blockade.

Comparison 1 CSE versus high‐dose spinal, Outcome 2 Number of women requiring supplemental intra‐operative analgesia at any time after CSE or spinal anaesthetic insertion.

Comparison 1 CSE versus high‐dose spinal, Outcome 3 Number of women requiring intra‐operative conversion to general anaesthesia.

Comparison 1 CSE versus high‐dose spinal, Outcome 4 Number of women satisfied with anaesthesia.

Comparison 1 CSE versus high‐dose spinal, Outcome 5 Mean time from start of the regional anaesthetic to effective anaesthesia for surgery.

Comparison 1 CSE versus high‐dose spinal, Outcome 6 Number of women with hypotension.

Comparison 1 CSE versus high‐dose spinal, Outcome 7 Number of women with nausea or vomiting or both.

Comparison 1 CSE versus high‐dose spinal, Outcome 8 Number of women with a post‐dural puncture headache.

Comparison 1 CSE versus high‐dose spinal, Outcome 9 Mean umbilical artery pH at delivery.

Comparison 1 CSE versus high‐dose spinal, Outcome 10 Number of neonates with Apgar less than 7 at 5 minutes.

Comparison 2 CSE versus low‐dose spinal, Outcome 1 Number of women requiring a repeat regional block or a general anaesthetic as a result of failure to establish adequate initial blockade.

Comparison 2 CSE versus low‐dose spinal, Outcome 2 Number of women requiring supplemental intra‐operative analgesia at any time after CSE or spinal anaesthetic insertion.

Comparison 2 CSE versus low‐dose spinal, Outcome 3 Number of women requiring intra‐operative conversion to general anaesthesia.

Comparison 2 CSE versus low‐dose spinal, Outcome 4 Mean time from start of the regional anaesthetic to effective anaesthesia for surgery.

Comparison 2 CSE versus low‐dose spinal, Outcome 5 Number of women with hypotension.

Comparison 2 CSE versus low‐dose spinal, Outcome 6 Number of women with nausea or vomiting or both.

Comparison 2 CSE versus low‐dose spinal, Outcome 7 Number of women with a post‐dural puncture headache.

Comparison 2 CSE versus low‐dose spinal, Outcome 8 Mean umbilical artery pH at delivery.

Comparison 2 CSE versus low‐dose spinal, Outcome 9 Number of neonates with Apgar less than 7 at 5 minutes.
| CSE compared to high‐dose spinal for caesarean section | ||||||
| Patient or population: women having a caesarean section Setting: university or national hospitals | ||||||
| Outcomes | Anticipated absolute effects* (95% CI) | Relative effect | № of participants | Certainty of the evidence | Comments | |
| Risk with high‐dose spinal | Risk with CSE | |||||
| Number of women requiring a repeat regional block or a general anaesthetic as a result of failure to establish adequate initial blockade | Study population | RR 0.32 | 341 | ⊕⊕⊝⊝ | ‐ | |
| 69 per 1000 | 22 per 1000 | |||||
| Number of women requiring supplemental intra‐operative analgesia at any time after CSE or spinal anaesthetic insertion | Study population | Average RR 1.25 | 390 | ⊕⊝⊝⊝ | ‐ | |
| 124 per 1000 | 154 per 1000 | |||||
| Number of women requiring intra‐operative conversion to general anaesthesia | Study population | RR 1.00 | 388 | ⊕⊝⊝⊝ | ‐ | |
| 48 per 1000 | 48 per 1000 | |||||
| Number of women satisfied with anaesthesia | Study population | RR 0.93 (0.73 to 1.19) | 72 | ⊕⊝⊝⊝ | ‐ | |
| 806 per 1000 | 749 per 1000 | |||||
| *The risk in the intervention group (and its 95% confidence interval) is based on the assumed risk in the comparison group and the relative effect of the intervention (and its 95% CI). | ||||||
| GRADE Working Group grades of evidence | ||||||
| aSmall sample size and wide confidence interval crossing the line of no effect (imprecision −1). | ||||||
| CSE compared to low‐dose spinal for caesarean section | ||||||
| Patient or population: women having a caesarean section Setting: university or national hospitals | ||||||
| Outcomes | Anticipated absolute effects* (95% CI) | Relative effect | № of participants | Certainty of the evidence | Comments | |
| Risk with low‐dose spinal | Risk with CSE | |||||
| Number of women requiring a repeat regional block or a general anaesthetic as a result of failure to establish adequate initial blockade | Study population | RR 4.81 | 224 | ⊕⊕⊝⊝ | ‐ | |
| 0 per 1000 | 0 per 1000 | |||||
| Number of women requiring supplemental intra‐operative analgesia at any time after CSE or spinal anaesthetic insertion | Study population | RR 1.75 | 298 | ⊕⊕⊕⊝ | ‐ | |
| 100 per 1000 | 175 per 1000 | |||||
| Number of women requiring intra‐operative conversion to general anaesthesia | Study population | ‐ | 222 | ⊕⊕⊝⊝ | Effect is uncertain. No women in these 3 RCTs required a conversion to general anaesthetic | |
| see comment | see comment | |||||
| Number of women satisfied with anaesthesia | Study population | ‐ | (0 studies) | ‐ | No data available in the included studies | |
| see comment | see comment | |||||
| *The risk in the intervention group (and its 95% confidence interval) is based on the assumed risk in the comparison group and the relative effect of the intervention (and its 95% CI). | ||||||
| GRADE Working Group grades of evidence | ||||||
| aSmall sample size and very wide confidence interval crossing the line of no effect (imprecision −2). | ||||||
|
| CSE: Needle‐through‐needle | CSE: Two injection | ||||
| SPINAL | No ED use | Sequential | EVE | No ED use | Sequential | EVE |
| High‐dose | ‐ | ‐ | ‐ | |||
| Low‐dose | ‐ | ‐ | ||||
| Abizanda 2007 is not included in this table as the doses of drugs used and the mode of administration were not stated | ||||||
| Outcome or subgroup title | No. of studies | No. of participants | Statistical method | Effect size |
| 1 Number of women requiring a repeat regional block or a general anaesthetic as a result of failure to establish adequate initial blockade Show forest plot | 7 | 341 | Risk Ratio (M‐H, Fixed, 95% CI) | 0.32 [0.05, 1.97] |
| 1.1 No ED use CSE versus high dose spinal | 5 | 259 | Risk Ratio (M‐H, Fixed, 95% CI) | 0.32 [0.05, 1.97] |
| 1.2 Sequential CSE versus high dose spinal | 2 | 82 | Risk Ratio (M‐H, Fixed, 95% CI) | 0.0 [0.0, 0.0] |
| 2 Number of women requiring supplemental intra‐operative analgesia at any time after CSE or spinal anaesthetic insertion Show forest plot | 7 | 390 | Risk Ratio (M‐H, Random, 95% CI) | 1.25 [0.19, 8.43] |
| 2.1 No ED use CSE versus high dose spinal | 4 | 170 | Risk Ratio (M‐H, Random, 95% CI) | 0.0 [0.0, 0.0] |
| 2.2 Sequential CSE versus high dose spinal | 3 | 151 | Risk Ratio (M‐H, Random, 95% CI) | 1.99 [0.18, 21.49] |
| 2.3 EVE CSE versus high dose spinal | 1 | 69 | Risk Ratio (M‐H, Random, 95% CI) | 0.18 [0.01, 4.28] |
| 3 Number of women requiring intra‐operative conversion to general anaesthesia Show forest plot | 7 | 388 | Risk Ratio (M‐H, Fixed, 95% CI) | 1.0 [0.07, 14.95] |
| 3.1 No ED use CSE versus high dose spinal | 4 | 168 | Risk Ratio (M‐H, Fixed, 95% CI) | 0.0 [0.0, 0.0] |
| 3.2 Sequential CSE versus high dose spinal | 3 | 151 | Risk Ratio (M‐H, Fixed, 95% CI) | 1.0 [0.07, 14.95] |
| 3.3 EVE CSE versus high dose spinal | 1 | 69 | Risk Ratio (M‐H, Fixed, 95% CI) | 0.0 [0.0, 0.0] |
| 4 Number of women satisfied with anaesthesia Show forest plot | 2 | 72 | Risk Ratio (M‐H, Fixed, 95% CI) | 0.93 [0.73, 1.19] |
| 4.1 Sequential CSE versus high dose spinal | 2 | 72 | Risk Ratio (M‐H, Fixed, 95% CI) | 0.93 [0.73, 1.19] |
| 5 Mean time from start of the regional anaesthetic to effective anaesthesia for surgery Show forest plot | 5 | Std. Mean Difference (IV, Random, 95% CI) | Totals not selected | |
| 6 Number of women with hypotension Show forest plot | 4 | 162 | Risk Ratio (M‐H, Fixed, 95% CI) | 1.01 [0.76, 1.33] |
| 7 Number of women with nausea or vomiting or both Show forest plot | 1 | 42 | Risk Ratio (M‐H, Fixed, 95% CI) | 2.17 [1.02, 4.61] |
| 8 Number of women with a post‐dural puncture headache Show forest plot | 3 | 113 | Risk Ratio (M‐H, Fixed, 95% CI) | 0.83 [0.32, 2.15] |
| 9 Mean umbilical artery pH at delivery Show forest plot | 1 | 40 | Std. Mean Difference (IV, Fixed, 95% CI) | ‐0.18 [‐0.80, 0.44] |
| 10 Number of neonates with Apgar less than 7 at 5 minutes Show forest plot | 4 | 182 | Risk Ratio (M‐H, Fixed, 95% CI) | 0.0 [0.0, 0.0] |
| Outcome or subgroup title | No. of studies | No. of participants | Statistical method | Effect size |
| 1 Number of women requiring a repeat regional block or a general anaesthetic as a result of failure to establish adequate initial blockade Show forest plot | 3 | 224 | Risk Ratio (M‐H, Fixed, 95% CI) | 4.81 [0.24, 97.80] |
| 1.1 No ED use CSE versus low dose spinal | 1 | 30 | Risk Ratio (M‐H, Fixed, 95% CI) | 0.0 [0.0, 0.0] |
| 1.2 Sequential CSE versus low dose spinal | 1 | 102 | Risk Ratio (M‐H, Fixed, 95% CI) | 4.81 [0.24, 97.80] |
| 1.3 EVE CSE versus low dose spinal | 2 | 92 | Risk Ratio (M‐H, Fixed, 95% CI) | 0.0 [0.0, 0.0] |
| 2 Number of women requiring supplemental intra‐operative analgesia at any time after CSE or spinal anaesthetic insertion Show forest plot | 4 | 298 | Risk Ratio (M‐H, Fixed, 95% CI) | 1.75 [0.78, 3.92] |
| 2.1 No ED use CSE versus low dose spinal | 1 | 30 | Risk Ratio (M‐H, Fixed, 95% CI) | 0.0 [0.0, 0.0] |
| 2.2 Sequential CSE versus low dose spinal | 1 | 100 | Risk Ratio (M‐H, Fixed, 95% CI) | 0.0 [0.0, 0.0] |
| 2.3 EVE CSE versus low dose spinal | 3 | 168 | Risk Ratio (M‐H, Fixed, 95% CI) | 1.75 [0.78, 3.92] |
| 3 Number of women requiring intra‐operative conversion to general anaesthesia Show forest plot | 3 | 222 | Risk Ratio (M‐H, Fixed, 95% CI) | 0.0 [0.0, 0.0] |
| 3.1 No ED use CSE versus low dose spinal | 1 | 30 | Risk Ratio (M‐H, Fixed, 95% CI) | 0.0 [0.0, 0.0] |
| 3.2 Sequential CSE versus low dose spinal | 1 | 100 | Risk Ratio (M‐H, Fixed, 95% CI) | 0.0 [0.0, 0.0] |
| 3.3 EVE CSE versus low dose spinal | 2 | 92 | Risk Ratio (M‐H, Fixed, 95% CI) | 0.0 [0.0, 0.0] |
| 4 Mean time from start of the regional anaesthetic to effective anaesthesia for surgery Show forest plot | 2 | 160 | Std. Mean Difference (IV, Fixed, 95% CI) | 0.85 [0.52, 1.18] |
| 5 Number of women with hypotension Show forest plot | 4 | 336 | Risk Ratio (M‐H, Random, 95% CI) | 0.59 [0.38, 0.93] |
| 6 Number of women with nausea or vomiting or both Show forest plot | 1 | 100 | Risk Ratio (M‐H, Fixed, 95% CI) | 0.5 [0.13, 1.89] |
| 7 Number of women with a post‐dural puncture headache Show forest plot | 2 | 138 | Risk Ratio (M‐H, Fixed, 95% CI) | 0.0 [0.0, 0.0] |
| 8 Mean umbilical artery pH at delivery Show forest plot | 1 | 76 | Std. Mean Difference (IV, Fixed, 95% CI) | 1.17 [0.68, 1.66] |
| 9 Number of neonates with Apgar less than 7 at 5 minutes Show forest plot | 1 | 60 | Risk Ratio (M‐H, Fixed, 95% CI) | 0.0 [0.0, 0.0] |