Intervenciones educativas, de apoyo y conductuales para mejorar el uso de aparatos de presión positiva continua de las vías respiratorias en adultos con apnea obstructiva del sueño
Resumen
Antecedentes
Aunque es efectiva para el tratamiento de la apnea obstructiva del sueño (AOS), la presión positiva continua en las vías respiratorias (PPCVR) no tiene una aceptación universal entre los usuarios. Las intervenciones educativas, de apoyo y conductuales pueden ayudar a los pacientes con AOS a reconocer la necesidad de uso regular y continuo de PPCVR.
Objetivos
Evaluar la efectividad de las estrategias educativas, de apoyo o conductuales para alentar a los pacientes a los que se les ha prescrito PPCVR a utilizar sus aparatos.
Métodos de búsqueda
Las búsquedas se realizaron en el registro especializado del Grupo Cochrane de Vías Respiratorias (Cochrane Airways Group). Se actualizaron las búsquedas hasta el 17 de enero de 2013.
Criterios de selección
Se incluyeron estudios controlados aleatorios de grupos paralelos que evaluaron una intervención dirigida a informar a los participantes sobre la PPCVR o la AOS, a apoyarlos en el uso de la PPCVR o a modificar su comportamiento mediante el incremento del uso de los aparatos de PPCVR. Se consideraron estudios de cualquier duración.
Obtención y análisis de los datos
Dos autores de la revisión evaluaron los estudios para determinar su idoneidad para ser incluidos en la revisión. Los datos fueron extraídos de forma independiente y se introdujeron en el programa informático Review Manager para el análisis.
Resultados principales
Se incluyeron 30 estudios (2047 participantes). Los estudios se categorizaron por tipo de intervención: intervenciones de apoyo durante el seguimiento, intervenciones educativas y terapia conductual. A través de las tres clases de intervención, la mayoría de los estudios incorporaron elementos de más de una intervención. Con objeto de realizar esta revisión sistemática, se categorizaron por tipo predominante de intervención y se creyó que este procedimiento tendría el mayor impacto sobre el resultado del estudio.
La puntuación inicial de la Epworth Sleepinesis Scale (ESS) indicó que la mayoría de los participantes experimentaron somnolencia diurna, y la PPCVR se indicó sobre la base de los índices de trastornos del sueño. Una gran mayoría de los participantes incluidos no había utilizado PPCVR anteriormente. La mayoría de los estudios estuvieron en riesgo incierto de sesgo en general, aunque debido a la naturaleza de la intervención, el cegamiento tanto del personal del estudio como de los participantes no fue factible, lo cual afectó algunos de los resultados clave. En estos estudios, no se informaron los eventos adversos.
Las pruebas de calidad baja a moderada mostraron que los tres tipos de intervenciones dieron lugar a un mayor uso de aparatos en los participantes con síndrome de AOS moderado a grave que no habían recibido PPCVR de forma previa. En comparación con la atención habitual, las intervenciones de apoyo continuo aumentaron el uso de aparatos en alrededor de 50 minutos por noche (0,82 horas, intervalo de confianza [IC] del 95%: 0,36 a 1,27; N = 803, 13 estudios; pruebas de baja calidad), aumentaron el número de participantes que utilizaron aparatos durante más de cuatro horas por noche de 59 a 75 por 100 (odds ratio [OR] 2,06; IC del 95%: 1,22 a 3,47; N = 268; cuatro estudios; pruebas de baja calidad) y redujeron la probabilidad de retiros del estudio (OR 0,65; IC del 95%: 0,44 a 0,97; N = 903; 12 estudios; pruebas de calidad moderada). Con la excepción de los retiros del estudio, se observó una considerable variación entre los hallazgos de los estudios individuales a través de estos resultados. Las pruebas de un efecto sobre los síntomas y la calidad de vida fueron estadísticamente imprecisas (puntuación ESS ‐0,60 puntos, IC del 95%: ‐1,81 a 0,62; N = 501; ocho estudios; pruebas de muy baja calidad; Functional Outcomes of Sleep Questionnaire 0,98 unidades, IC del 95%: ‐0,84 a 2,79; N = 70; dos estudios; pruebas de baja calidad, respectivamente).
Las intervenciones educativas aumentaron el uso de aparatos en alrededor de 35 minutos por noche (0,60 horas, IC del 95%: 0,27 a 0,93; N = 508; siete estudios; pruebas de calidad moderada), aumentaron el número de participantes que utilizaron los aparatos durante más de cuatro horas por noche de 57 a 70 por 100 (OR 1,80; IC del 95%: 1,09 a 2,95; N = 285; tres estudios; pruebas de baja calidad) y redujeron la probabilidad de retiros del estudio (OR 0,67; IC del 95%: 0,45 a 0,98; N = 683; ocho estudios; pruebas de baja calidad). Los participantes experimentaron una mejoría pequeña en los síntomas, cuyo tamaño puede no ser clínicamente significativo (puntuación ESS ‐1,17 puntos, IC del 95%: ‐2,07 a ‐0,26; N = 336; cinco estudios).
La terapia conductual dio lugar a una mejoría apreciable en el uso promedio de aparatos de 1,44 horas por noche (IC del 95%: 0,43 a 2,45; N = 584; seis estudios; pruebas de baja calidad) y aumentó el número de participantes que usaron los aparatos durante más de cuatro horas por noche de 28 a 47 por 100 (OR 2,23; IC del 95%: 1,45 a 3,45; N = 358; tres estudios; pruebas de baja calidad), aunque con niveles altos de heterogeneidad estadística. La tasa inferior calculada de retiros con las intervenciones conductuales fue imprecisa y no alcanzó significación estadística (OR 0,85; IC del 95%: 0,57 a 1,25; N = 609; cinco estudios, pruebas de muy baja calidad).
Conclusiones de los autores
En los pacientes con apnea del sueño grave que no habían recibido PPCVR de forma previa, las pruebas de baja calidad indican que las intervenciones de apoyo que alientan a los pacientes a continuar utilizando los aparatos de PPCVR aumentan el uso en comparación con la atención habitual. Las pruebas de calidad moderada indican que una intervención educativa a corto plazo da lugar a un aumento moderado en el uso de PPCVR. Las pruebas de baja calidad indican que la terapia conductual da lugar a un aumento grande en el uso de aparatos de PPCVR. Sigue sin poder precisarse la repercusión de un mejor uso de la PPCVR sobre la somnolencia diurna, la calidad de vida y el riesgo cardiovascular a largo plazo. Para los resultados que reflejan el uso de aparatos, la calidad se disminuyó debido al riesgo de sesgo y la inconsistencia. Una limitación adicional para las medidas de la somnolencia diurna y la calidad de vida fue la imprecisión. Se necesitan ensayos en pacientes que han luchado por continuar con el tratamiento, debido a que actualmente hay pocas pruebas disponibles para esta población. Aún no se conocen el momento adecuado, la duración óptima ni la efectividad a largo plazo de las intervenciones. La relación entre el mejor uso de los aparatos y el efecto sobre los síntomas y la calidad de vida debe evaluarse de forma adicional. Se necesitan estudios que consideren la elección de las intervenciones que coinciden mejor con las necesidades de los pacientes individuales y que, por lo tanto, dan lugar al tratamiento más exitoso y efectivo en función de los costos.
PICO
Resumen en términos sencillos
¿Las intervenciones de apoyo, educativas o conductuales mejoran el uso de los aparatos de PPCVR por parte de los adultos con apnea obstructiva del sueño (AOS)?
¿Qué es la AOS y la PPCVR?
La apnea obstructiva del sueño (AOS) es un trastorno que causa la interrupción de la respiración durante el sueño. Los pacientes con AOS pasan más tiempo en sueño ligero y menos tiempo en sueño profundo y en consecuencia, se sienten muy somnolientos durante el día, lo cual puede afectar su vida laboral/familiar. La PPCVR (presión positiva continua de las vías respiratorias) es un tratamiento que proporciona una columna de aire presurizado que sirve de soporte para mantener las vías respiratorias abiertas. El tratamiento con PPCVR incluye un aparato que tiene tres partes principales: una máscara u otro dispositivo que se coloca sobre la nariz o la nariz y la boca (con correas que mantienen la máscara en su lugar); un tubo que conecta la máscara al motor del aparato; y un motor que echa aire en el tubo. Algunos aparatos de PPCVR tienen también otras características, como humidificadores de aire caliente. Los aparatos de PPCVR son pequeños, livianos y bastante silenciosos.
La presión positiva continua de las vías respiratorias trata la AOS de forma efectiva en la mayoría de los pacientes. Puede mejorar los síntomas causados por la AOS, y en algunos adultos, puede reducir el riesgo a largo plazo de enfermedades relacionadas con el corazón. Sin embargo, la efectividad de la PPCVR es limitada por el hecho de que los pacientes no utilizan la máquina de la mejor manera posible. Se ha propuesto el apoyo, la educación y la modificación del comportamiento para mejorar el uso de PPCVR.
Pregunta de la revisión
La intención fue evaluar los tratamientos diseñados para informar a los participantes acerca de la PPCVR o la AOS, para apoyarlos en cuanto al uso de PPCVR o para modificar su comportamiento con objeto de mejorar el uso de los aparatos de PPCVR. La pregunta principal considerada por esta revisión es cuán efectivas son estas intervenciones para mejorar el cumplimiento del tratamiento con PPCVR.
Características de los estudios
Se consideraron las pruebas de los estudios aleatorios de grupos paralelos. Tras una búsqueda bibliográfica exhaustiva y evaluación de los ensayos existentes, se han incluido 30 estudios con un total de 2047 participantes. Una gran mayoría de los participantes sufría de somnolencia diurna excesiva y AOS grave. La duración de los estudios varió de cuatro semanas a 12 meses. Las pruebas se actualizaron hasta enero de 2013.
Resultados
Al combinar los resultados de todos los ensayos, se encontró que los tres tipos de intervenciones aumentaron el uso de PPCVR en grados variables. Las intervenciones de apoyo continuo fueron más exitosas que la atención habitual para aumentar el uso de PPCVR en alrededor de 50 minutos por noche. Las intervenciones educativas dieron lugar a una mejoría moderada de alrededor de 35 minutos por noche. La terapia conductual aumentó el uso de los aparatos en poco menos de una hora y media por noche. Se observó algún grado de inconsistencia entre los resultados de los estudios individuales, lo cual introduce algunas dudas acerca del tamaño de la diferencia que podría anticiparse en la práctica. No está claro si alguna de estas intervenciones también dio lugar a una mejoría significativa de los síntomas diurnos o la calidad de vida. En general, los estudios incluyeron a pacientes que no habían utilizado PPCVR, y actualmente hay pocas pruebas disponibles sobre los pacientes que han luchado por continuar con el tratamiento. No se ha explorado el costo‐eficacia de las intervenciones, y no está claro qué intervención es la más conveniente para los pacientes individuales.
Calidad de la evidencia
En términos generales, la calidad de las pruebas presentadas es baja debido a cuestiones con el diseño del estudio y algún grado de inconsistencia en los resultados entre los estudios. La calidad de las pruebas sobre los síntomas y la calidad de vida fue afectada por el bajo número de estudios que midieron estos resultados.
Authors' conclusions
Summary of findings
| Increased practical support and encouragement for adults with sleep apnoea | ||||||
| Patient or population: adults with sleep apnoea Comparison: CPAP Settings: community | ||||||
| Outcomes | Illustrative comparative risks* (95% CI) | Relative effect | No of participants | Quality of the evidence | Comments | |
| Assumed risk | Corresponding risk | |||||
| Control | Increased practical support and encouragement | |||||
| Machine usage | Average CPAP machine usage ranged across control groups from | Mean machine usage in the intervention groups was | 803 | ⊕⊕⊝⊝ | ||
| N deemed adherent (≥ four hours/night) | 59 per 100 | 75 per 100 | OR 2.06 | 268 | ⊕⊕⊝⊝ | |
| Symptoms of sleepiness | Average Epworth symptom scores in control groups ranged from 4.5 to 13 | Mean symptoms of sleepiness in the intervention groups was | 501 | ⊕⊝⊝⊝ | ||
| Quality of life | Mean quality of life in the intervention groups was | 70 | ⊕⊕⊝⊝ | |||
| Quality of life | See comment | See comment | 108 | ⊕⊕⊝⊝ | Single study estimate | |
| Withdrawals | 17 per 100 | 11 per 100 | OR 0.65 | 903 | ⊕⊕⊕⊝ | |
| *The basis for the assumed risk (e.g. the median control group risk across studies) is provided in footnotes. The corresponding risk (and its 95% confidence interval) is based on the assumed risk in the comparison group and the relative effect of the intervention (and its 95% CI). | ||||||
| GRADE Working Group grades of evidence. | ||||||
| 1Risk of bias (‐1): In the absence of blinding across studies, the study effect estimates are at risk of performance bias. | ||||||
| Educational interventions for adults with sleep apnoea | ||||||
| Patient or population: adults with sleep apnoea Comparison: CPAP Settings: community | ||||||
| Outcomes | Illustrative comparative risks* (95% CI) | Relative effect | No of participants | Quality of the evidence | Comments | |
| Assumed risk | Corresponding risk | |||||
| Control | Educational interventions | |||||
| Machine usage | Average CPAP machine usage ranged across control groups from 2.6 to 5.7 hours per night | Mean machine usage in the intervention groups was | 508 | ⊕⊕⊕⊝ | ||
| N deemed adherent (≥4 hours/night) | 57 per 100 | 71 per 100 | OR 1.8 | 285 | ⊕⊕⊝⊝ | |
| Symptoms of sleepiness | Mean Epworth Sleepiness Scale scores across control groups ranged from 5.4 to 10.8 | Mean Epworth Sleepiness Scale scores in the intervention groups was | 336 | ⊕⊕⊕⊝ | ||
| Quality of life: Sleep Apnoea Quality of Life Index (SAQLI) | See comment | See comment | Not estimable | 89 | ⊕⊝⊝⊝ | Single study estimate |
| Withdrawal | 24 per 100 | 18 per 100 | OR 0.67 | 683 | ⊕⊕⊝⊝ | |
| *The basis for the assumed risk (e.g. the median control group risk across studies) is provided in footnotes. The corresponding risk (and its 95% confidence interval) is based on the assumed risk in the comparison group and the relative effect of the intervention (and its 95% CI). | ||||||
| GRADE Working Group grades of evidence. | ||||||
| 1Risk of bias (‐1): In the absence of blinding across studies, effect estimates may be biased because of performance bias. | ||||||
| Behavioural therapy for adults with sleep apnoea who are using CPAP | ||||||
| Patient or population: adults with sleep apnoea Comparison: CPAP Settings: community | ||||||
| Outcomes | Illustrative comparative risks* (95% CI) | Relative effect | No of participants | Quality of the evidence | Comments | |
| Assumed risk | Corresponding risk | |||||
| Control | Behavioural therapy | |||||
| Machine usage | See comment | Average machine usage in the intervention groups was | 584 | ⊕⊕⊝⊝ | Data analysed as generic inverse variance | |
| N deemed adherent (≥4 hours/night) | 28 per 100 | 47 per 100 | OR 2.23 | 358 | ⊕⊝⊝⊝ | |
| Symptoms | See comment | See comment | 100 | ⊕⊕⊝⊝ | Single study estimate | |
| Quality of life | See comment | See comment | 100 | ⊕⊕⊝⊝ | Single study estimate | |
| Withdrawal | 23 per 100 | 20 per 100 | OR 0.85 | 609 | ⊕⊝⊝⊝ | |
| *The basis for the assumed risk (e.g. the median control group risk across studies) is provided in footnotes. The corresponding risk (and its 95% confidence interval) is based on the assumed risk in the comparison group and the relative effect of the intervention (and its 95% CI). | ||||||
| GRADE Working Group grades of evidence. | ||||||
| 1Risk of bias (‐1): In the absence of blinding across studies, effect estimates may be biased because of performance bias. | ||||||
Background
Description of the condition
Obstructive sleep apnoea (OSA) is a common sleep‐related breathing disorder characterised by transient interruption of ventilation caused by complete or partial occlusion of the upper airway. As a consequence, oxygen desaturation, increased inspiratory effort, sleep fragmentation and arousal from sleep occur. This in turn leads to excessive daytime sleepiness, mood alterations and impairment of cognition, memory and driving competence. Furthermore, OSA is associated with cardiovascular and metabolic co‐morbidities (Harsch 2004; Peppard 2000).
Description of the intervention
Continuous positive airway pressure (CPAP) involves the use of an airflow generator, which, via an interface, provides a constant stream of pressurised air to splint open and maintain patency of the upper airways during the inspiratory and expiratory phases of breathing. CPAP is very effective in abolishing obstructive nocturnal breathing, and since it was first introduced into clinical practice in 1981 (Sullivan 1981), CPAP has become a mainstay of OSA treatment.
Consistent application of CPAP therapy improves the quality of sleep, normalises sleep architecture, reduces daytime sleepiness, enhances neurobehavioural performance and prevents automobile accidents (Gay 2006; Giles 2006). Patients who are compliant with CPAP achieve better blood pressure control and have reduced risk of cardiovascular events (Dong 2013; Marin 2005; Martinez‐Garcia 2012; Myhill 2012). Furthermore, emerging data indicate that CPAP may have a role in the treatment of acute stroke (Bravata 2011; Martinez‐Garcia 2009).
In spite of the widespread recommendation of CPAP in the management of OSA (Giles 2006; SIGN 2003), concerns have arisen about its continued acceptance among people who have to use it on a long‐term basis. Reported usage of CPAP ranges from 29% to 85% (Lewis 2004; Lindberg 2006; Pépin 1999; Weaver 2010). Eight per cent to 15%of patients refuse to accept the treatment after a single night's use, and some case series report an abandonment rate of up to 50% within one year (Bollig 2010; Krieger 1992). The definition of optimal CPAP usage is problematic (Lewis 2004), and attempts to ascertain patterns of usage among CPAP users can be affected by their altered behaviour in monitored settings (Pépin 1999; Sin 2002). Self‐reported use is not reliable and overestimates actual use by an average of one hour (Kribbs 1993). The number of hours per night and the frequency of usage required to achieve and maintain therapeutic effectiveness are not well established. The threshold level for daily CPAP use may depend on the outcome measure used and may vary significantly between patients (Bollig 2010). Six to eight hours each night is the usual prescription, but in many studies, adequate CPAP adherence has been proposed as a minimum of four hours of daily use (Lewis 2004; Richard 2007). This threshold, although defined as arbitrary, has proved useful in clinical studies and has some validity. Weaver 2007 found that the greatest gain in improvement in the Epworth Sleepiness Scale (ESS) to a normal value occurred with at least four hours of use per night. Applying this criterion, Pépin 1999 and Lewis 2004 deemed between 71% and 85% of CPAP users 'compliant', but Kribbs 1993 identified only 46% as 'compliant'. The consequences of undertreating sleep‐disordered breathing may include increased cardiovascular risk and mortality (Marin 2005; Mooe 2001; Yaggi 2005).
Side effects of CPAP include discomfort, nasal congestion, abdominal bloating, mask leaks, claustrophobia and inconvenience of regular usage, and these are frequently reported by patients who struggle to persevere with treatment. People commonly skip nights on CPAP or use it only for part of the night. Studies on CPAP usage predictors related to patient characteristics, disease characteristics and CPAP technology have yielded inconsistent results, but certain psychological and cognitive variables have been shown to correlate well with sustained and successful treatment (Stepnowsky 2007a; Wild 2004). Components of social cognitive theory, such as risk perception, treatment outcome expectations and self‐efficacy, are attractive modifiable predictors of adherence. Similarly, social factors, including partner involvement in treatment and partner's sleep quality, have been shown to positively influence CPAP adherence (Lewis 2004). Following treatment initiation, the pattern of CPAP use within the first week can predict long‐term use (Aloia 2007).
How the intervention might work
Various methods to improve initial acceptance and subsequent compliance have been proposed. Modifications of delivery of airway pressure, such as the use of automatically titrating CPAP (auto‐CPAP), bi‐level PAP and humidification therapy to decrease side effects in the upper airway due to cold and dry airflow, have not yielded convincing benefits in clinical trials (Smith 2009a). Ongoing support in resolving problems that occur during CPAP treatment and regular encouragement should enhance its proper use. According to various psychological and behavioural theories, knowledge is a precondition for health behaviour or change in health behaviour and determines adherence at the onset of treatment (Sawyer 2011; Wang 2011a). Other theoretical models emphasise that targeting psychological constructs such as decision balancing (relative weighing of the pros and cons of making changes) and self‐efficacy (which describes the ability to make a behaviour change during times when such a change is expected to be difficult) can influence compliance with treatment. Therefore, educational and behavioural interventions have also been proposed. These interventions are based on a variety of theoretical models, emphasise the importance of persistence with therapy and target some of the perceived barriers to successful continued usage (Bandura 2004; Olsen 2008).
Why it is important to do this review
Interventions directed at improving CPAP usage very greatly in methodology, complexity and effectiveness. Knowing what type of intervention is effective and potentially applicable in clinical practice would guide clinicians and health authorities in developing services aimed at helping patients adhere to treatment. Since the last Cochrane review, published in 2009, which assessed educational, supportive and behavioural interventions aimed at improving CPAP usage, a substantial number of new studies have been reported. This review updates the evidence.
Objectives
To assess the effectiveness of strategies that are educational, supportive or behavioural in encouraging people who have been prescribed CPAP to use their machines.
Methods
Criteria for considering studies for this review
Types of studies
Randomised, parallel‐group trials.
Types of participants
Participants were adults of either sex with a diagnosis of OSA that was based on history and results of sleep studies. Trials assessing interventions in people with central sleep apnoea were excluded. Participants must have received their diagnosis of OSA through a sleep study, that is, an oximetry study showing a desaturation index (DI) of at least five per hour or respiratory polygraphy yielding an apnoea hypopnoea index (AHI) of at least five per hour.
Types of interventions
Intervention and control groups must receive the same make of CPAP machine and the same pressure delivery mode (i.e. fixed, auto‐titrating, bi‐level, etc).
Intervention group
Any short‐term (delivered at the time of diagnosis or CPAP titration) or sustained intervention consisting of an educational intervention (such as written, verbal or audiovisually delivered information) or enhanced support offered to participants in the form of regular meetings, telephone follow‐up or interactive applications aimed at encouraging continued use of the CPAP machine and encouraging participants to report problems associated with its use. We also included behavioural interventions aimed at modifying and promoting adherence behaviours.
Control group
Participants in the control group could receive instruction that would be usual for the study centre in question, provided that the equivalent 'background' level of instruction was also offered to the intervention group.
Types of outcome measures
Primary outcomes
CPAP machine usage, measured as initial acceptance when data were available and subsequent usage as measured by:
-
counter output that records the cumulative time that power is turned on for a CPAP machine (this does not provide information on actual time of day and duration of CPAP used during each 24‐hour period);
-
microprocessor and monitor that measurepressure at the mask for every minute of each 24‐hour day; and
-
subjective participant reports of the duration of CPAP use.
Secondary outcomes
-
Symptom scores such as the Epworth Sleepiness Scale (ESS) and the Stanford Sleepiness Score and nasal symptoms.
-
Disease‐specific quality of life scores such as Functional Outcomes of Sleep Questionnaire (FOSQ) or Calgary Sleep Apnoea Quality of Life Index (SAQLI) scores.
-
Mood (Hospital Anxiety and Depression (HAD) Scale).
-
Withdrawals from the study.
-
Desaturation index, apnoea hypopnoea index (AHI), respiratory disturbance index (RDI) and minimum arterial saturation (min SaO2) during sleep.
-
Maintenance of wakefulness test.
-
Cardiovascular morbidity/mortality.
-
Adverse events.
Search methods for identification of studies
Electronic searches
We identified trials using the Cochrane Airways Group Specialised Register of trials, which is maintained by the Trial Search Co‐ordinator (TSC) for the Group. The Register is derived from systematic searches of bibliographic databases including the Cochrane Central Register of Controlled Trials (CENTRAL), MEDLINE, EMBASE, CINAHL, AMED and PsycINFO, and from handsearching of respiratory journals and meeting abstracts (please see Appendix 1 for further details). The TSC searched all records in the Specialised Register coded as 'sleep apnoea' using the following terms:
((Humidif* OR CPAP OR Auto‐CPAP OR APAP OR NCPAP OR PPR OR "positive pressure" OR positive‐pressure OR "expiratory pressure" OR PEEP OR IPB OR IPPB) OR (continuous OR nasal OR inspiratory AND ("positive airway*"))) AND (educat* or self‐manag* or "self manag*" or "self‐car*" or "self car*" or train* or support* or instruct* or behav* or psychother* or adher* or interact* or telemed*)
The latest search was conducted in January 2013 with no restrictions on language or publication type.
Searching other resources
We undertook additional searching of the bibliographies of identified trials. We handsearched the 2003‐2005 American Thoracic Society (ATS) meeting abstracts for the first version of this review. We handsearched the 2010‐2012 ATS and the 2008‐2012 European Respiratory Society (ERS) meeting abstracts for the 2013 review update.
Authors of studies were contacted to locate other unpublished or in progress studies that met the inclusion criteria.
Data collection and analysis
Selection of studies
Titles, abstracts and citations identified through electronic searching were independently reviewed by three review authors (DRW for the current update, TJL for the original review and IS for both) to assess potential relevance for full review. Following scrutiny of full text, review authors independently assessed studies for inclusion based on criteria for population, intervention and study design. Agreement was measured by simple agreement. A third review author would have resolved disagreements, but none arose.
Data extraction and management
Data were extracted from published and unpublished studies independently by DRW (for the current update), TJL (for the original review) and IS (for both), using data extraction sheets designed in Excel. Data in table or graphic form were used. When data were not available from the trial reports, we contacted study authors to determine whether data could be obtained directly. We sought additional clarification of study design and methods for the risk of bias assessment.
Assessment of risk of bias in included studies
The review authors assessed the risk of bias of included studies in terms of the processes of allocation of participants to treatment groups, blinding and subsequent handling of missing data.
Given the nature of the intervention, it is unlikely that blinding of participants is achievable, but data collectors and analysts could be blinded. We noted whether blinding of the study aim was maintained and sought information on whether participants were informed that machine usage would be monitored.
Two review authors (DRW and IS) independently assessed risk of bias for each study using the criteria outlined in the Cochrane Handbook for Systematic Reviews of Interventions (Higgins 2011). We resolved any disagreements by discussion or by involving another review author (TJL). We assessed the risk of bias according to the following domains.
-
Random sequence generation.
-
Allocation concealment.
-
Blinding .
-
Incomplete outcome data.
We graded each potential source of bias as high, low or unclear and provided a quote from the study report, together with justification for our judgement, in the risk of bias table.
Measures of treatment effect
For dichotomous outcomes, an odds ratio (OR) and 95% confidence intervals (CIs) were calculated on the basis of the number of participants with an event versus the number of participants without an event. Mean differences (MDs) and 95% CIs were calculated for continuous variables measured on identical metrics. We combined data with a standardised mean difference (SMD) for the same continuous variables measured with different metrics. We entered data presented as a scale with a consistent direction of effect.
Unit of analysis issues
Studies with multiple treatment groups
Some studies randomly assigned participants to more than one intervention group: Meurice 2007a, Meurice 2007b, Meurice 2007c and Meurice 2007d randomly assigned participants to one of four different combinations of treatment. We extracted data for increased support and educational interventions by creating four intervention/control comparisons and considered the effects of each as a separate study. We adopted a similar approach to the study by Wang 2011a, Wang 2011b, Wang 2011c and Wang 2011d, which included three intervention arms and one control group. The educational intervention and supportive intervention groups served as a control for the group when a combination of both interventions was used. We created four pair‐wise comparisons incorporated into an educational and supportive interventions analysis. Aloia 2012a and Aloia 2012b investigated two interventions—educational and behavioural—and used one control group. We considered these two arms paired with one control as separate studies.
Dealing with missing data
The authors of the following studies were contacted and responded to the request for additional data: Aloia 2001, Aloia 2012a, Aloia 2012b, Bartlett 2010, Basoglu 2011, Damjanovic 2009, Lewis 2006, Olsen 2012, Parthasarathy 2012, Schiefelbein 2005, Shaikh 2009, Smith 2006 and Stepnowsky 2007.
Assessment of heterogeneity
We used the I² statistic to measure heterogeneity among the trials in each analysis. If we identified substantial heterogeneity (> 20%), we pooled data using a random‐effects model and explored possible causes through prespecified subgroup analysis.
Assessment of reporting biases
We assessed a funnel plot for the primary outcome for publication bias.
Data synthesis
Fixed‐effect modelling was used to pool data for ORs unless heterogeneity was observed, in which case a random‐effects model was used. Standard errors for generic inverse variance analyses were derived from reported 95% CIs of group differences or group standard deviations (SDs), using the RevMan calculator.
Subgroup analysis and investigation of heterogeneity
Subgroup comparisons considered to be defined a priori include the following.
-
Participants with prior CPAP exposure versus CPAP‐naive participants.
-
Population (male vs female).
-
Baseline AHI ≥ 20 versus < 20 per hour.
Sensitivity analysis
We removed studies in which study participants were aware that their usage data were collected. We also excluded studies wherein mean CPAP usage in the control group was equal to or greater than four hours per night.
Summary of findings tables
We included summary of findings tables for the three comparisons (supportive interventions vs usual care; educational interventions vs usual care; behavioural therapy vs usual care). We included information about the following key outcomes in the summary of findings tables.
-
CPAP machine usage.
-
Symptoms.
-
Quality of life.
-
Study withdrawal.
We applied methods outlined by the GRADE working group to rate the quality of evidence by considering the following domains.
-
Risk of bias.
-
Imprecision.
-
Inconsistency.
-
Indirectness.
-
Publication bias.
Results
Description of studies
Results of the search
See Figure 1 for the study flow diagram. The original review, published in 2009, was split from a larger review of educational/psychological interventions and pressure delivery modifications in sleep apnoea (Haniffa 2004). From the original review, we have retained 17 studies (literature search dates: all years to September 2008). Based on new information provided by the study authors, one study previously included has now been excluded as not meeting randomisation criteria (Damjanovic 2009). One further study (Marshall 2003) has been excluded because of the high probability that randomisation did not take place. Update searches conducted to January 2013 yielded 159 citations, and 13 new studies met the inclusion criteria.
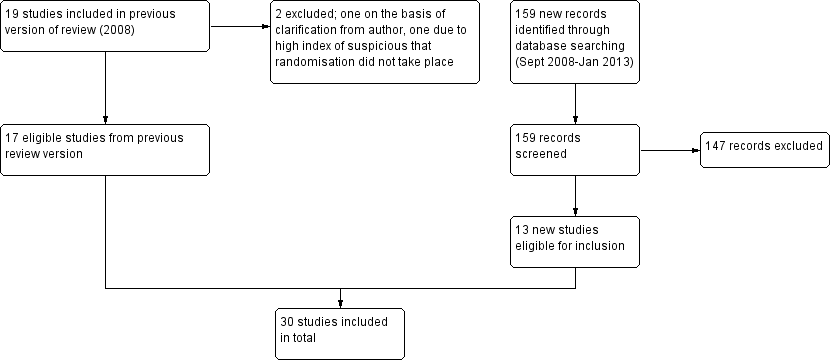
Study flow diagram.
This review summarises evidence from 30 studies reported in 28 references. For descriptions of each study, see Characteristics of included studies. Three trials judged as potentially relevant were not reported in full and are awaiting assessment pending information from the study investigators (Bartlett 2010; Fanfulla 2008; Peach 2003).
We have excluded 10 studies (see Characteristics of excluded studies).
Included studies
Study design
All studies were randomised, single‐blind or unblinded parallel‐group studies.
Participants
A total of 2047 participants were recruited to the studies (Table 1). When reported, in all studies, except for Fox 2012, baseline ESS indicated that participants suffered from excessive daytime somnolence. Sleep disturbance indices also indicated that CPAP therapy was a justified strategy in managing their condition. Only 3.6% of participants recruited had used CPAP previously (Aloia 2001; Chervin 1997; Smith 2006). The remainder were newly diagnosed with OSA or were initiating CPAP treatment.
| Study | N Screened | Entered | Completed | % Screened | % Entered |
| NA | 12 | 12 | NA | 100 | |
| 339 | 227 | 149 | 44 | 66 | |
| 246 | 133 | 133 | 54 | 100 | |
| NA (75% of those approached agreed to participate) | 40 | 33 | NA | 82.5 | |
| NA | 30 | 30 | NA | 100 | |
| NA | 50 | 43 | NA | 86 | |
| NA | 75 | 54 | NA | 72 | |
| NA | 80 | 75 | NA | 94 | |
| NA | 108 | 108 | NA | 100 | |
| 74 | 72 | 55 | 74 | 76 | |
| 133 | 112 | 91 | 68 | 81 | |
| 132 | 100 | 73 | 55 | 73 | |
| 49 | 39 | 37 | 76 | 95 | |
| 109 | 100 | 79 | 72 | 79 | |
| NA | 30 | 28 | NA | 93 | |
| NA | 51 | 51 | NA | 100 | |
| NA | 19 | 19 | NA | 100 | |
| NA | 97 | 73 | NA | 75 | |
| 423 | 250 | 115 | 27 | 46 | |
| 91 | 45 | 40 | 44 | 88 | |
| 160 | 132 | 114 | 71 | 86 | |
| NA | 152 | 130 | NA | 86 | |
| NA | 93 | 56 | NA | 60 |
Interventions
All studies were divided between three groups of supportive, educational and behavioural interventions. Across all three groups, some studies incorporated elements of more than one intervention (Table 2). For the purposes of meta‐analysis, we have categorised them by the prevailing type of intervention, which, in our judgement, would be expected to have the greatest impact on the study outcome ('net' intervention).
| Intervention group | Study | Intervention | Control | Study duration (weeks) | ||
| Increased support and reinforcement components | Increased educational components | Behavioural therapy | ||||
| Increased support and reinforcement | Weekly telephone calls to monitor progress and troubleshoot | Written information on OSA and CPAP | Usual care | Eight | ||
| Computer‐based telecommunication system allowing for monitoring and reinforcing compliance | Education provided by the computer‐based telecommunication system | Usual care | Eight | |||
| Telecomunication system allowing for daily monitoring of CPAP usage, timely detection and troubleshooting of problems | Usual care | 12 | ||||
| 2 additional titration nights in hospital, 4 additional visits at home by sleep nurses | Initial education at home with partner | Usual care | 24 | |||
| 2 additional early reviews by sleep physician and frequent telephone calls by sleep nurses | Videotape and additional education session | Usual care | 12 | |||
| 1 additional early review by sleep physician and 1 early telephone interview with sleep nurse | Educational video | Usual care | 52 | |||
| 4 additional home visits in the first 3 months by sleep practitioner for problem solving | Written information and detailed explanation by the prescriber, additional education during home visits | Written information and detailed explanation by the prescriber + usual care | 52 | |||
| 4 additional home visits in the first 3 months by sleep practitioner for problem solving | Additional education during home visits | Usual care | 52 | |||
| 2 individual sessions and 8 telephone conversations with trained peer CPAP users providing support and sharing their positive experience with CPAP | Peers shared their knowledge on CPAP and OSA | Interventions delivered by peer contained elements of promoting self‐efficacy, risk perception, participant activation and motivation | Usual care | 12 | ||
| Internet‐based application aimed at encouraging CPAP use and problem solving | Internet‐based application similar in format to intervention but directed activities in neutral health topics (vitamin intake) | 16 | ||||
| Home video‐link sessions delivered by nurse, who guided correct CPAP use and provided problem solving | Nurse provided education on CPAP and OSA | Home video‐link sessions similar in form to intervention but directed activities in neutral health topics (vitamin intake) | 12 | |||
| Audiotaped music along with softly spoken directions on relaxation techniques and habit‐promoting instructions for using CPAP, user reminder placard | Handouts on benefits of CPAP adherence and health consequences of poor compliance | Audiotaped music along with spoken information about vitamins. Information packet similar in format to intervention, but content was on vitamins | 24 | |||
| Wireless telemonitoring of compliance and treatment efficacy on daily basis and acting on the data via prespecified clinical pathways | Usual care | Eight | ||||
| Internet‐based application aimed at monitoring self‐reported compliance, acting on the information in timely fashion | Usual care | Four | ||||
| Progressive muscle relaxation | Usual care | 12 | ||||
| Progressive muscle relaxation + 2 additional nights of CPAP titration | 4hour group education session, written information, video CD | Two additional nights of CPAP titration + four‐hour group education session, written information, video CD + usual care | 12 | |||
| Increased education | Two 45‐minute individual didactic sessions and one booster phone call by sleep nurse | Usual care | 52 | |||
| 10‐Minute educational video session on OSA and CPAP | Usual care | 24 | ||||
| Educational and desensitisation course | Usual care | 24 | ||||
| 4 additional home visits in the first 3 months by sleep practitioner for problem solving | Written information and detailed explanation by the prescriber, additional education during home visits | Four additional home visits in the first three months by sleep practitioner for problem solving and additional education + usual care | 52 | |||
| Written information and detailed explanation by the prescriber | Usual care | 52 | ||||
| 2 additional nights of CPAP titration | Four‐hour group education session, written information, video CD | Usual care | 12 | |||
| Progressive muscle relaxation + 2 additional nights of CPAP titration | Four‐hour group education session, written information, video CD | Progressive muscle relaxation + usual care | 12 | |||
| 15‐Minute educational video addressing misconception about OSA and barriers to effective CPAP treatment | Usual care | Four | ||||
| Behavioural therapy | Elements of education on consequences of OSA and efficacy of CPAP | Two 45‐minute sessions of cognitive‐behavioural therapy interventions | Two 45‐minute sessions involving discussion on sleep architecture and sleep clinic | 12 | ||
| Two 45‐minute sessions of Motivational Enhancement Therapy, one booster phone call | Usual care | 52 | ||||
| 45‐Minute individual education session | Three 30‐minute sessions of Motivational Interviewing Therapy | 45‐Minute educational session + usual care | 52 | |||
| Slide presentation and written information on OSA and CPAP | Two one‐hour group sessions of cognitive‐behavioural therapy | Usual care | Four | |||
| Written personalised feedback report framed according to Motivational Enhancement Theory | Written information from the American Academy of Sleep Medicine | 12 | ||||
| Side effects management module incorporated in the automated telephone‐linked communication system | Information exchange on OSA and CPAP incorporated in the automated telephone‐linked communication system | Automated telephone‐linked communication system designed around the concept of Motivational Interviewing, which allowed one to assess and enhance CPAP compliance | General education on unrelated health topics via automated telephone‐linked communication system | 52 | ||
Educational interventions were intended to impart information about CPAP treatment or about OSA more generally and were delivered using a variety of techniques, often in combination, including video (Basoglu 2011; Wang 2011a; Wang 2011c; Wiese 2005), face‐to‐face didactic sessions (Aloia 2012a; Meurice 2007d), group educational sessions (Epstein 2000; Wang 2011a; Wang 2011d), written materials (Meurice 2007c; Meurice 2007d; Wang 2011a; Wang 2011c), telephone calls (Aloia 2012a) and education at home during follow‐up visits (Meurice 2007c).
Supportive interventions comprised intensive follow‐up and monitoring by additional clinic reviews (Hui 2000; Lewis 2006), telephone calls (Chervin 1997; Hui 2000; Lewis 2006), telemedicine technology (including Internet‐based applications, automated digitalised phone calls and wireless CPAP machine data downloading) (DeMolles 2004; Fox 2012; Schiefelbein 2005; Smith 2006; Stepnowsky 2007; Taylor 2006), home visits (Hoy 1999; Meurice 2007a; Meurice 2007b), additional titration nights in hospital (Hoy 1999) and meetings with peer CPAP users (Parthasarathy 2012). The common feature in this group was that participants were encouraged to provide feedback on their experience of CPAP treatment on an ongoing basis, so that barriers to or difficulties with treatment could be addressed in timely fashion. Relaxation before CPAP application and habit‐promoting interventions were also utilised (Smith 2009; Wang 2011b; Wang 2011c).
Behavioural interventions targeted modifiable constructs originating from psychological theories of health behaviour change and preexisting health beliefs. Interventions were focused on promoting self‐efficacy, assessing outcome expectations and influencing decisional balance in favour of CPAP. Again, various strategies and techniques were implemented. Most commonly, interventions designed around the concept of motivational interviewing delivered by face‐to‐face sessions (Aloia 2012b; Olsen 2012), personalised written feedback (Roecklein 2010) or Internet‐based applications (Sparrow 2010) were used. Two studies used cognitive‐behavioural therapy delivered in an individual session (Aloia 2001) or in a group session as part of a multimodality intervention, which, in addition, was composed of an educational slide presentation, a video, written information and demonstration of relaxation techniques (Richards 2007).
To make some sense of the heterogeneity of the interventions, we grouped them under the following three headings.
-
Increased support and reinforcement: Chervin 1997; DeMolles 2004; Fox 2012; Hoy 1999; Hui 2000; Lewis 2006; Meurice 2007a; Meurice 2007b; Parthasarathy 2012; Schiefelbein 2005; Smith 2006; Smith 2009; Stepnowsky 2007; Taylor 2006; Wang 2011b; Wang 2011c.
-
Increased education: Aloia 2012a; Basoglu 2011; Epstein 2000; Meurice 2007c; Meurice 2007d; Wang 2011a;Wang 2011d; Wiese 2005.
-
Behavioural therapy: Aloia 2001; Aloia 2012b; Olsen 2012; Richards 2007; Roecklein 2010; Sparrow 2010.
Study duration
Study duration was four weeks (Richards 2007; Taylor 2006; Wiese 2005), eight weeks (Chervin 1997; DeMolles 2004; Stepnowsky 2007), 12 weeks (Aloia 2001; Fox 2012; Hui 2000; Parthasarathy 2012; Roecklein 2010; Smith 2006; Wang 2011a; Wang 2011b; Wang 2011c; Wang 2011d), 16 weeks (Schiefelbein 2005), 24 weeks (Basoglu 2011; Epstein 2000; Hoy 1999; Smith 2009) and 52 weeks (Aloia 2012a; Aloia 2012b; Lewis 2006; Meurice 2007a; Meurice 2007b; Meurice 2007c; Meurice 2007d; Olsen 2012; Sparrow 2010).
Outcomes
All studies reported outcome data related to machine usage or subsequent attendance at an outpatient clinic, with the exception of Schiefelbein 2005, for which only data pertaining to diary‐recorded experiences of intervention between groups were available. A subset of the studies reported data on ESS (Chervin 1997; DeMolles 2004; Hoy 1999; Hui 2000; Olsen 2012; Wang 2011a; Wang 2011b; Wang 2011c; Wang 2011d; Wiese 2005), AHI (Fox 2012; Olsen 2012) and quality of life (DeMolles 2004; Hoy 1999; Hui 2000; Olsen 2012; Taylor 2006; Wiese 2005).
Excluded studies
We excluded 10 studies from this review. Reasons for their failure to meet review entry criteria are provided in Characteristics of excluded studies.
Risk of bias in included studies
An overview of our judgements of the risk of bias of included studies (allocation, blinding and missing data domains) is provided in Figure 2. The basis for each of these judgements is given in Characteristics of included studies.

Methodological quality summary: review authors' judgements about each methodological quality item for each included study.
Allocation
Following correspondence with study investigators, we were able to ascertain that allocation generation and concealment were adequate in eight studies (Basoglu 2011; Lewis 2006; Olsen 2012; Parthasarathy 2012; Richards 2007; Smith 2006; Smith 2009; Stepnowsky 2007). In a further nine studies, only allocation generation procedures were at low risk of bias (Aloia 2001; Aloia 2012a; Aloia 2012b; Chervin 1997; Fox 2012; Hoy 1999; Schiefelbein 2005; Sparrow 2010; Taylor 2006). For these studies, information regarding concealment of allocation could not be ascertained. For the remainder of the studies, insufficient information was available for review authors to determine the extent to which studies were at risk of bias from these sources.
Blinding
In seven studies, investigators made attempts to blind participants regarding the intensity or content of the intervention received: Hoy 1999; Lewis 2006; Schiefelbein 2005; Smith 2006; Roecklein 2010; Smith 2009; Sparrow 2010.
Participants were not made aware that machine use was being monitored in five studies: Aloia 2001; Aloia 2012a; Aloia 2012b; Lewis 2006; Richards 2007. For a number of studies, participants would have been aware that machine usage data were assessed by study investigators: Basoglu 2011; Chervin 1997; DeMolles 2004; Fox 2012; Hui 2000; Parthasarathy 2012; Roecklein 2010; Stepnowsky 2007; Taylor 2006. In the remainder of the studies, we were not able to assess how this feature of study design was addressed.
Incomplete outcome data
In three studies, data from all participants were collected and analysed (Basoglu 2011; DeMolles 2004; Smith 2006). Only incomplete data were available for the primary outcome for a number of studies: Aloia 2012a; Aloia 2012b; Chervin 1997; Epstein 2000; Fox 2012; Lewis 2006; Meurice 2007a; Meurice 2007b; Meurice 2007c; Meurice 2007d; Olsen 2012; Smith 2009; Sparrow 2010; Parthasarathy 2012; Roecklein 2010; Stepnowsky 2007. For the remaining studies, we could not ascertain how intention‐to‐treat populations were composed. A high attrition rate was noted in the control group following CPAP titration in Richards 2007, Wang 2011a and Wang 2011b. This may have affected the estimates for average machine usage.
Effects of interventions
See: Summary of findings for the main comparison Increased practical support and encouragement for adults with sleep apnoea; Summary of findings 2 Educational interventions for adults with sleep apnoea; Summary of findings 3 Behavioural therapy for adults with sleep apnoea who are using CPAP
We rated the quality of evidence for primary and important secondary outcomes for the three comparisons in summary of findings Table for the main comparison; summary of findings Table 2; and summary of findings Table 3.
Primary outcome: machine usage
Mean hours/night
Increased practical support and encouragement during follow‐up
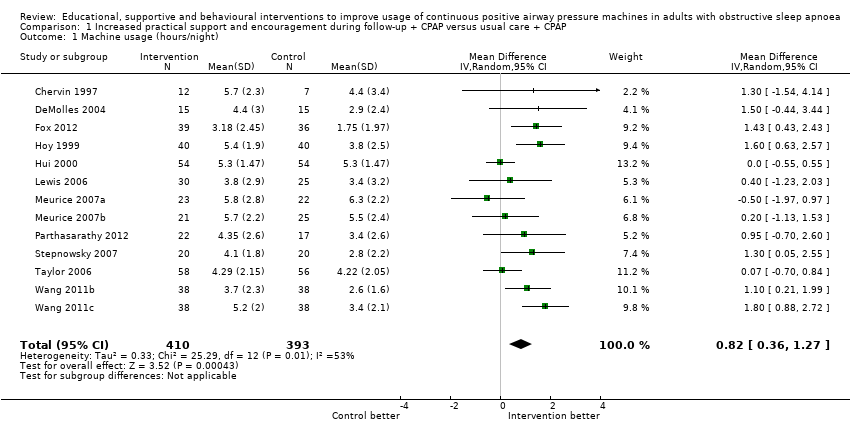
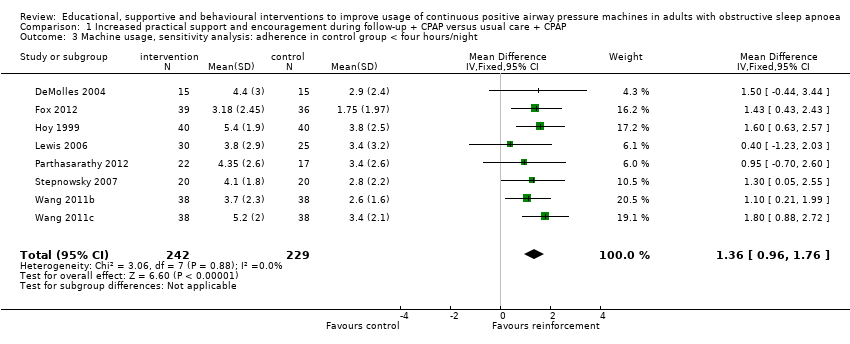
Low‐quality evidence shows that supportive interventions increased machine usage by about 50 minutes per night (0.82 hours, 95% CI 0.36 to 1.27; Figure 3; summary of findings Table for the main comparison). This finding was based on data from 13 studies with 803 participants. This outcome exhibited a moderate to high level of statistical variation (I2 = 53%) with outlying, discordant study estimates. Differences between our a priori subgroups could not be tested reliably, as gender‐specific data were not available (with the exception of Parthasarathy 2012, who recruited male participants only), baseline AHI was above 20 in the trials and only one of the studies recruited prior users of CPAP. Two post hoc sensitivity analyses were undertaken. In the first, we excluded studies in which participants would have been aware that machine usage was monitored. The pooled result favoured intervention more positively by 1.07 hours/night (95% CI 0.61 to 1.52; Analysis 1.2). The second sensitivity analysis excluded trials with an average machine usage equal to or greater than four hours/night in the control group. The magnitude of the intervention effect in the remaining studies was greater (1.36 hours/night, 95% CI 0.96 to 1.76; Analysis 1.3; Figure 4), and the heterogeneity was eliminated (I2 = 0%).

Forest plot of comparison: 1 Increased psychological and/or practical support during follow‐up + CPAP versus usual care + CPAP, outcome: 1.1 Machine usage (hours/night)—first arm/parallel studies.
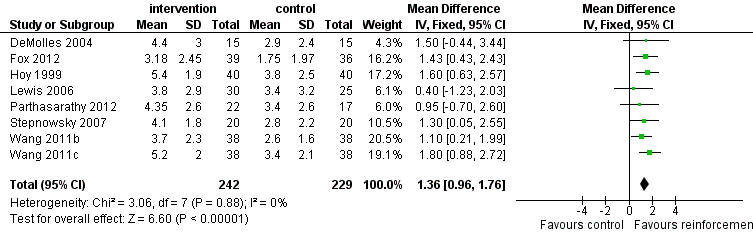
Forest plot of comparison: 1 Increased practical support and encouragement during follow‐up + CPAP versus usual care + CPAP, outcome: 1.3 Machine usage, sensitivity analysis: adherence in control group =< four hours/night.
The funnel plot for this outcome indicates some asymmetry, with less precise studies showing a more positive effect than those near the top of the plot (Figure 5). However, because such high levels of statistical variation were noted between the study results, we are unable to conclude that publication bias explains the asymmetry .

Funnel plot of comparison: 1 Increased practical support and encouragement + CPAP versus usual care + CPAP, outcome: 1.1 Machine usage (hours/night).
Educational interventions
Moderate‐quality evidence indicates that educational interventions led to a small increase in average machine use of about 35 minutes per night (0.60 hours, 95% CI 0.27 to 0.93; Analysis 2.1; summary of findings Table 2). Seven studies with a total of 503 participants were analysed (Figure 6). No statistical heterogeneity was observed (I2 = 0%).

Forest plot of comparison: 2 Educational interventions + CPAP versus usual care + CPAP, outcome: 2.1 Machine usage (hours/night).
Behavioural interventions
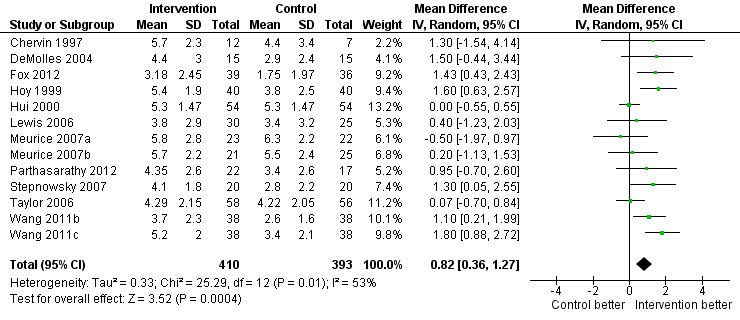
Low‐quality evidence shows that behavioural interventions increased average hours of CPAP use by 1.44 hours per night (95% CI 0.43 to 2.45; Figure 7; summary of findings Table 3). Meta‐analysis was based on six studies with a total of 584 participants. Considerable variation in the intervention effect for this outcome was observed between studies (I2 = 70%). Because sufficient data were lacking, we were not able to conduct the predefined sensitivity analysis. Post hoc subgroup analysis excluding one study, in which participants were aware of machine usage monitoring, favoured the intervention group more strongly (1.54 hours/night, 95% CI 0.99 to 2.09; Analysis 3.2) but has not reduced heterogeneity. In all studies, average machine usage in the control group was less than four hours per night.

Forest plot of comparison: 4 Behavioural therapy + CPAP versus control + CPAP, outcome: 4.1 Machine usage.
The funnel plot indicates slight asymmetry, with only one outlying small study strongly in favour of intervention effect. Larger studies were distributed more symmetrically near the top of the graph. Based on this finding, we could not conclude that publication bias explains the heterogeneity.
Number of participants deemed compliant (average CPAP usage of ≥ four hours/night)
Increased practical support and encouragement during follow‐up
Low‐quality evidence from four studies indicates that more people were using CPAP for four hours or longer (OR 2.06, 95% CI 1.22 to 3.47; Analysis 1.4; summary of findings Table for the main comparison). Based on average control group risk, this translates to an absolute increase from 59 to 75 people per 100.
Educational interventions
Low‐quality evidence from three studies shows that a higher proportion of participants adhered to CPAP following short‐term educational interventions (OR 1.80, 95% CI 1.1 to 2.95; Analysis 2.2; summary of findings Table 2). Based on average control group risk, this translates to an absolute increase from 57 to 70 people per 100.
Behavioural interventions
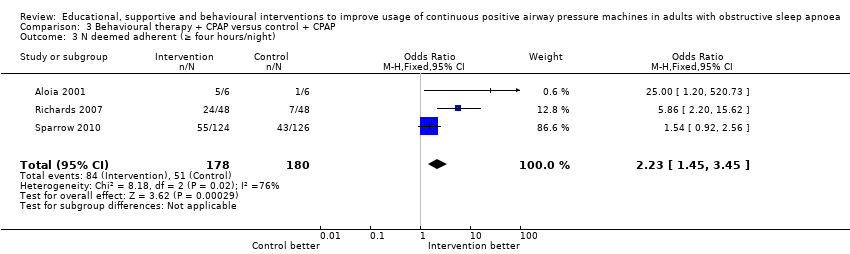
Very low‐quality evidence suggests that behavioural interventions led to a greater likelihood of participants using CPAP for four hours or longer per night (OR 2.23, 95% CI 1.45 to 3.45; Analysis 3.3; summary of findings Table 3). Based on average control group risk, this translates to an absolute increase from 28 to 47 people per 100.
Secondary outcomes
Data were not available for all of the secondary outcomes specified in the protocol. Those with available data are described below.
Symptoms
Only data on Epworth Sleepiness Score (ESS) were available.
Increased practical support and encouragement during follow‐up
The estimated effect on symptoms from supportive interventions was small and statistically imprecise (‐0.6 points, 95% CI ‐1.81 to 0.62, eight studies, 501 participants; Analysis 1.5; summary of findings Table for the main comparison; very low‐quality evidence).
Educational interventions
Moderate‐quality evidence showed improved symptoms following educational interventions (‐1.17 points, 95% CI ‐2.07 to ‐0.26, five studies, 336 participants; Analysis 2.3; summary of findings Table 2). However, the magnitude of this difference is of questionable clinical significance.
Behavioural interventions
Low‐quality evidence from a single study (Olsen 2012) showed a statistically significant difference between groups (‐1.47 points, 95% CI ‐2.85 to ‐0.1; Analysis 3.4; summary of findings Table 3).
Quality of life
Increased practical support and encouragement during follow‐up
Evidence for an effect of increased support on quality of life, as measured by the Functional Outcomes of Sleep Questionnaire (FOSQ) in two small studies, was statistically imprecise (0.98, 95% CI ‐0.84 to 2.79; Analysis 1.6; summary of findings Table for the main comparison).
The Sleep Apnoea Quality of Life Index (SAQLI) was reported by Hui 2000, who found significant differences in favour of augmented support compared with basic support at week 12 of treatment but with a wide confidence interval (MD 12.81, 95% CI 1.50 to 24.12; Analysis 1.7). In addition, this study demonstrated no improvement in CPAP usage, and results should be interpreted with caution.
Educational interventions
Wiese 2005 reported no significant difference between the two groups at four weeks with SAQLI (MD ‐0.27, 95% CI ‐0.9 to 0.36; Analysis 2.4).
Behavioural interventions
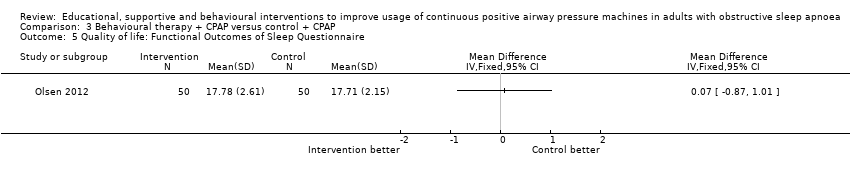
Olsen 2012 found no significant difference in FOSQ between Motivational Interviewing Therapy and usual care (MD 0.07, 95% CI ‐0.87 to 1.01; Analysis 3.5).
Mood
Increased practical support and encouragement during follow‐up
HAD scale for anxiety: Hoy 1999 assessed this outcome but found no significant difference between treatment and control groups (MD ‐1.1, 95% CI ‐2.95 to 0.75; Analysis 1.8).
HAD scale for depression: Pooled data from three trials indicate significant differences in favour of intervention (MD ‐0.93, 95% CI ‐1.57 to ‐0.28; Analysis 1.8).
Educational interventions
HAD scale for depression: The intervention was not superior over the control in improving this outcome in studies by Wang 2011b and Wang 2011d (MD ‐0.52, 95% CI ‐1.25 to 0.22; Analysis 2.5).
Withdrawal from the study
Increased practical support and encouragement during follow‐up
Participants in the support groups were less likely to withdraw from the studies (OR 0.65, 95% CI 0.44 to 0.97, 12 studies, 903 participants; Analysis 1.9).
Educational interventions
The odds of withdrawal favoured intervention (OR 0.67, 95% CI 0.45 to 0.98, eight studies, 683 participants; Analysis 2.6).
Behavioural interventions
The intervention had no effect on the likelihood of withdrawal (OR 0.85, 95% CI 0.57 to 1.25, five studies, 609 participants; Analysis 3.6).
AHI index
Increased practical support and encouragement during follow‐up
This outcome was reported in only two studies, which found no significant differences between the two groups (MD ‐0.07, 95% CI ‐1.62 to 1.48; Analysis 1.10).
Maintenance of wakefulness test
Increased practical support and encouragement during follow‐up
Hoy 1999 found no difference in objectively measured ability to stay awake between participants in the intervention and control groups (MD 1.50, 95% CI ‐3.09 to 6.09; Analysis 1.11).
Cardiovascular morbidity/mortality
None reported.
Adverse events
None reported.
Discussion
Summary of main results
This review identified 30 studies assessing supportive, educational and behavioural strategies for improving CPAP use in 2047 adults with OSA. We found that all three types of interventions had a positive impact on increasing average machine usage and the number of participants compliant with treatment over a limited time. The vast majority of participants suffered from moderate to severe disease and were symptomatic. We found that behavioural interventions delivered through various techniques resulted in the largest improvement in average hours of CPAP use. Ongoing support and intensive follow‐up were also superior over standard care. Educational interventions at the outset produced modest but still statistically significant improvement in average machine usage.
Overall completeness and applicability of evidence
Duration of studies and follow‐up varied from one to 12 months. Considerable differences in the median duration of studies were noted between the three groups: intensive support group 3.0 ± 4.0 months, educational group 6.0 ± 4.7 months and behavioural group 8.0 ± 5.4 months. The distribution of study duration within each group did not allow subgroup analysis. Therefore, we were not able to establish which interventions are likely to offer a durable effect and perform better over longer periods. This unanswered question is relevant to clinical practice, particularly when the cost‐effectiveness of these interventions is considered.
It is plausible that interventions directed toward improving CPAP usage are less effective beyond a certain level of preexisting compliance. This is given some support by our post hoc sensitivity analysis based on control group machine usage. Removing studies in which average CPAP machine usage was high in control groups (mean of four hours or longer/night) nearly doubled the pooled effect estimate, indicating that people with very low compliance benefit most from the intervention. Although this analysis was selected post hoc, further supportive evidence for this hypothesis comes from the most successful behavioural interventions, for which in all control groups, average machine usage was less than four hours/night, although not all trials demonstrated benefit of the intervention. The same is true for two studies that drive positive results in the short‐term educational group (Aloia 2012a; Wang 2011a).
Timing of intervention appears important, particularly for behavioural therapy, in which initial acceptance of CPAP is a promising target. Richards 2007 and Olsen 2012 applied intervention before CPAP initiation and demonstrated significant reduction in the proportion of participants refusing CPAP titration, whereas Aloia 2012b employed Motivational Enhancement Therapy one week after CPAP titration and showed no overall benefit of the intervention. Given that patterns of long‐term CPAP compliance are usually developed during the first week of treatment (Aloia 2007), early intervention may be critical. It is unclear whether the same applies to educational interventions, although similar to psychological and health belief variables, knowledge is recognised as essential for effective health behaviours (Bandura 2004).
Most of the participants had high levels of sleep disturbance at baseline, exhibited symptoms of sleepiness and were new to CPAP therapy. Given the known impact of CPAP in correcting AHI and improving daytime sleepiness (Giles 2006), these characteristics could have predisposed the trial populations to perceive benefit from early stages of CPAP independently of the intervention (Pelletier 2001; Wells 2007; Zozula 2001). Only three studies included people who had used CPAP previously; therefore it would be of particular interest to see whether studies of supportive and educational interventions influence machine usage to a similar degree in prior CPAP users.
Hoy 1999 and Richards 2007 included partners of those with OSA in the intervention. Hoy 1999 reported self‐referral as a predictor of successful continuation with treatment compared with participants who had been prompted to seek health care. It is feasible that self‐referral correlates with a sense of motivation and control over health status and is predictive of uptake of and continuation with treatment (Wild 2004). Findings from observational research suggest a link between outcomes of treatment in people with sleep apnoea and their bed partners (Parish 2003; Weaver 2003). Future interventional research could explore more fully the effect of bed partner involvement on long‐term CPAP adherence when this is relevant.
It seems evident that better adherence must be a favourable outcome, but the evidence base for improved health status as a consequence of increased hours of CPAP use is slight (Stepnowsky 2002). Recent observational data supporting this have come from a cohort of participants for whom high usage of CPAP accompanied improvement in symptoms (Weaver 2007). Although all three interventions assessed in our review led to better usage of CPAP machines, the amount of evidence for associated improvements in symptoms and quality of life is slight, and measuring these outcomes is a priority for future trials.
There remains a need to assess the impact of intervention on long‐term outcome, in particular for patients whose disease is sufficiently severe to warrant intervention but who struggle to persist with positive airways pressure for a number of reasons. Qualitative research may assist in identifying common reasons for not persisting with CPAP, such as technical problems (discomfort, air leakage and mask interface; Schiefelbein 2005). Such studies are required to enable better understanding of the mechanisms associated with non‐adherence, to elucidate the relationship between initial motivation and ongoing perception of benefit and to equip interventional researchers with the means to better determine whether targeting psychological and technical aspects of ongoing CPAP usage modifies long‐term morbidity. The multidimensional nature of CPAP adherence implies that one type of intervention is unlikely to suit all patients, and a personalised approach based on a patient's characteristic and identifiable factors predictive of compliance may be required. Factors that are both predictive and modifiable represent an appealing target. With this knowledge and with the goal of providing the most cost‐effective treatment, subgroups of non‐adherent patients could be targeted right at the outset of CPAP therapy.
Quality of the evidence
Several issues affect the reliability of our findings and their applicability to the general OSA population. We downgraded the evidence primarily for risk of bias and inconsistency across the summary of findings tables (summary of findings Table for the main comparison; summary of findings Table 2; summary of findings Table 3). Performance bias due to lack of blinding is likely, given the nature of the interventions or the subjective nature of the outcomes of interest. This is likely to affect all the studies in this review; therefore quantifying the effect of this is not possible. Although we could partially explain the inconsistency of individual study results by performing a sensitivity analysis for the primary outcome under intensive support, this is not the case for behavioural interventions. Across all three groups, statistical variation between the results of studies may be attributable to one or more plausible causes, including different populations recruited, variation in the intensity and modalities of interventions provided or differences in the timing of interventions. Treatment fidelity, which can be defined as strategies that monitor and enhance the accuracy and consistency of an intervention provided, is of particular importance in behavioural studies. Assessment of treatment fidelity is required to ensure validity of study outcomes. Only Aloia 2012b and Olsen 2012 implemented treatment fidelity checks, and the lack of them in other studies is a potential source of inconsistency between studies. The quality of evidence for daytime sleepiness and quality of life outcomes was weakened by the size and the low number of studies that addressed this outcome.
Potential biases in the review process
Two potential sources of bias have been identified in our review process. First, the categorisation of studies in this review is based on the core attributes of the intervention and how it differed from the control group (the 'net' intervention). It is possible that our classification of studies by intervention type is itself a crude means of differentiating between the interventions. Furthermore, studies that incorporated attributes of more than one intervention type were arbitrarily categorised on the basis of the dominant intervention (Table 2). We did not assess how 'active' components of control interventions may have confounded the results of some of the studies. Many of the control group interventions in the included studies attempted to inform participants about OSA and the importance of treatment through written materials, videos or sessions with specialist staff. However, what constitutes usual care varied between treatment centres. Indeed the control groups of Hoy 1999 and Hui 2000 received education and support at least equivalent to that received by the intervention group in Chervin 1997. Some studies attempted to balance contact with participants between intervention and control groups or to provide 'placebo' in the control arms. In other studies, given the nature of the interventions, this was not practical. We did not consider how the differences in attention received by participants in individual studies may have impacted the outcomes. We assigned the treatment arms of Meurice 2007a, Meurice 2007c, Wang 2011c and Wang 2011d as control groups when it could be argued that they were assessed as providing different intensities of active follow‐up. The varied intensity of the background or control intervention, in addition to the 'net intervention' within the studies (which included different ways of supporting study participants, such as regular telephone contact, telemedicine and intensive clinic review), could have influenced effect sizes in our analyses. Second, as noted above, low and high compliance levels in the study control arms were not defined a priori, and the post hoc definition of this study characteristic may be spurious.
Agreements and disagreements with other studies or reviews
To our knowledge, no other published reviews that meet the standard criteria of a systematic review have investigated the role of educational, supportive or behavioural interventions in improving adherence to CPAP.

Study flow diagram.
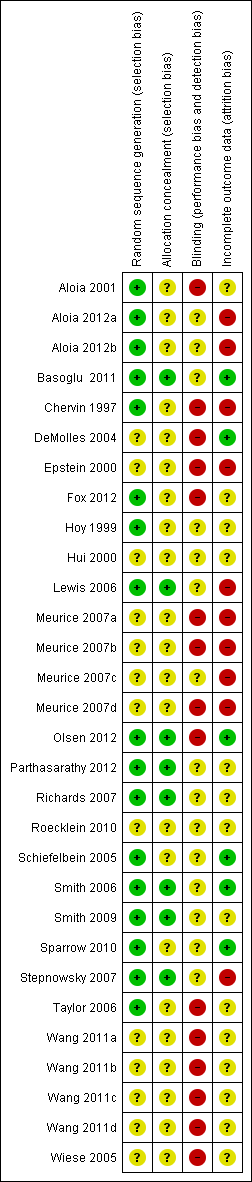
Methodological quality summary: review authors' judgements about each methodological quality item for each included study.
Forest plot of comparison: 1 Increased psychological and/or practical support during follow‐up + CPAP versus usual care + CPAP, outcome: 1.1 Machine usage (hours/night)—first arm/parallel studies.

Forest plot of comparison: 1 Increased practical support and encouragement during follow‐up + CPAP versus usual care + CPAP, outcome: 1.3 Machine usage, sensitivity analysis: adherence in control group =< four hours/night.

Funnel plot of comparison: 1 Increased practical support and encouragement + CPAP versus usual care + CPAP, outcome: 1.1 Machine usage (hours/night).

Forest plot of comparison: 2 Educational interventions + CPAP versus usual care + CPAP, outcome: 2.1 Machine usage (hours/night).

Forest plot of comparison: 4 Behavioural therapy + CPAP versus control + CPAP, outcome: 4.1 Machine usage.
Comparison 1 Increased practical support and encouragement during follow‐up + CPAP versus usual care + CPAP, Outcome 1 Machine usage (hours/night).

Comparison 1 Increased practical support and encouragement during follow‐up + CPAP versus usual care + CPAP, Outcome 2 Machine usage, sensitivity analysis: excluding participants aware of machine usage monitoring.
Comparison 1 Increased practical support and encouragement during follow‐up + CPAP versus usual care + CPAP, Outcome 3 Machine usage, sensitivity analysis: adherence in control group < four hours/night.

Comparison 1 Increased practical support and encouragement during follow‐up + CPAP versus usual care + CPAP, Outcome 4 N deemed adherent (≥ four hours/night).

Comparison 1 Increased practical support and encouragement during follow‐up + CPAP versus usual care + CPAP, Outcome 5 Epworth Sleepiness Scale scores.

Comparison 1 Increased practical support and encouragement during follow‐up + CPAP versus usual care + CPAP, Outcome 6 Quality of life: Functional Outcomes of Sleep Questionnaire.

Comparison 1 Increased practical support and encouragement during follow‐up + CPAP versus usual care + CPAP, Outcome 7 Quality of life: Sleep Apnoea Quality of Life Index (SAQLI).

Comparison 1 Increased practical support and encouragement during follow‐up + CPAP versus usual care + CPAP, Outcome 8 Mood.

Comparison 1 Increased practical support and encouragement during follow‐up + CPAP versus usual care + CPAP, Outcome 9 Withdrawals.

Comparison 1 Increased practical support and encouragement during follow‐up + CPAP versus usual care + CPAP, Outcome 10 AHI on treatment.

Comparison 1 Increased practical support and encouragement during follow‐up + CPAP versus usual care + CPAP, Outcome 11 Maintenance of Wakefulness Test (MWT).

Comparison 2 Educational interventions + CPAP versus usual care + CPAP, Outcome 1 Machine usage (hours/night).

Comparison 2 Educational interventions + CPAP versus usual care + CPAP, Outcome 2 N deemed adherent (≥ four hours/night).

Comparison 2 Educational interventions + CPAP versus usual care + CPAP, Outcome 3 Epworth Sleepiness Scale scores.

Comparison 2 Educational interventions + CPAP versus usual care + CPAP, Outcome 4 Quality of life: Sleep Apnoea Quality of Life Index (SAQLI).

Comparison 2 Educational interventions + CPAP versus usual care + CPAP, Outcome 5 HAD Scale for Depression.

Comparison 2 Educational interventions + CPAP versus usual care + CPAP, Outcome 6 Withdrawal.

Comparison 3 Behavioural therapy + CPAP versus control + CPAP, Outcome 1 Machine usage (hours/night).

Comparison 3 Behavioural therapy + CPAP versus control + CPAP, Outcome 2 Sensitivity analysis: excluding participants aware of machine usage monitoring.
Comparison 3 Behavioural therapy + CPAP versus control + CPAP, Outcome 3 N deemed adherent (≥ four hours/night).

Comparison 3 Behavioural therapy + CPAP versus control + CPAP, Outcome 4 Epworth Sleepiness Scale score.
Comparison 3 Behavioural therapy + CPAP versus control + CPAP, Outcome 5 Quality of life: Functional Outcomes of Sleep Questionnaire.
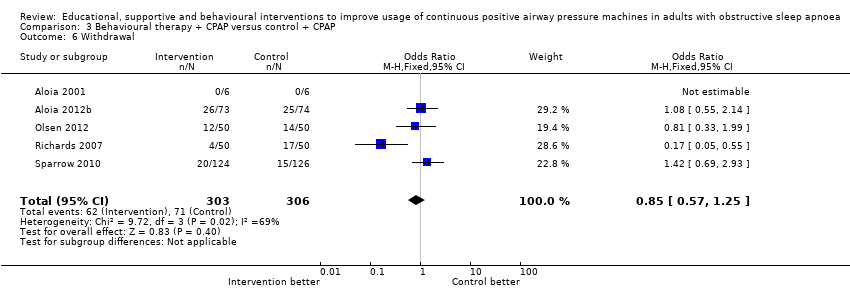
Comparison 3 Behavioural therapy + CPAP versus control + CPAP, Outcome 6 Withdrawal.
| Increased practical support and encouragement for adults with sleep apnoea | ||||||
| Patient or population: adults with sleep apnoea Comparison: CPAP Settings: community | ||||||
| Outcomes | Illustrative comparative risks* (95% CI) | Relative effect | No of participants | Quality of the evidence | Comments | |
| Assumed risk | Corresponding risk | |||||
| Control | Increased practical support and encouragement | |||||
| Machine usage | Average CPAP machine usage ranged across control groups from | Mean machine usage in the intervention groups was | 803 | ⊕⊕⊝⊝ | ||
| N deemed adherent (≥ four hours/night) | 59 per 100 | 75 per 100 | OR 2.06 | 268 | ⊕⊕⊝⊝ | |
| Symptoms of sleepiness | Average Epworth symptom scores in control groups ranged from 4.5 to 13 | Mean symptoms of sleepiness in the intervention groups was | 501 | ⊕⊝⊝⊝ | ||
| Quality of life | Mean quality of life in the intervention groups was | 70 | ⊕⊕⊝⊝ | |||
| Quality of life | See comment | See comment | 108 | ⊕⊕⊝⊝ | Single study estimate | |
| Withdrawals | 17 per 100 | 11 per 100 | OR 0.65 | 903 | ⊕⊕⊕⊝ | |
| *The basis for the assumed risk (e.g. the median control group risk across studies) is provided in footnotes. The corresponding risk (and its 95% confidence interval) is based on the assumed risk in the comparison group and the relative effect of the intervention (and its 95% CI). | ||||||
| GRADE Working Group grades of evidence. | ||||||
| 1Risk of bias (‐1): In the absence of blinding across studies, the study effect estimates are at risk of performance bias. | ||||||
| Educational interventions for adults with sleep apnoea | ||||||
| Patient or population: adults with sleep apnoea Comparison: CPAP Settings: community | ||||||
| Outcomes | Illustrative comparative risks* (95% CI) | Relative effect | No of participants | Quality of the evidence | Comments | |
| Assumed risk | Corresponding risk | |||||
| Control | Educational interventions | |||||
| Machine usage | Average CPAP machine usage ranged across control groups from 2.6 to 5.7 hours per night | Mean machine usage in the intervention groups was | 508 | ⊕⊕⊕⊝ | ||
| N deemed adherent (≥4 hours/night) | 57 per 100 | 71 per 100 | OR 1.8 | 285 | ⊕⊕⊝⊝ | |
| Symptoms of sleepiness | Mean Epworth Sleepiness Scale scores across control groups ranged from 5.4 to 10.8 | Mean Epworth Sleepiness Scale scores in the intervention groups was | 336 | ⊕⊕⊕⊝ | ||
| Quality of life: Sleep Apnoea Quality of Life Index (SAQLI) | See comment | See comment | Not estimable | 89 | ⊕⊝⊝⊝ | Single study estimate |
| Withdrawal | 24 per 100 | 18 per 100 | OR 0.67 | 683 | ⊕⊕⊝⊝ | |
| *The basis for the assumed risk (e.g. the median control group risk across studies) is provided in footnotes. The corresponding risk (and its 95% confidence interval) is based on the assumed risk in the comparison group and the relative effect of the intervention (and its 95% CI). | ||||||
| GRADE Working Group grades of evidence. | ||||||
| 1Risk of bias (‐1): In the absence of blinding across studies, effect estimates may be biased because of performance bias. | ||||||
| Behavioural therapy for adults with sleep apnoea who are using CPAP | ||||||
| Patient or population: adults with sleep apnoea Comparison: CPAP Settings: community | ||||||
| Outcomes | Illustrative comparative risks* (95% CI) | Relative effect | No of participants | Quality of the evidence | Comments | |
| Assumed risk | Corresponding risk | |||||
| Control | Behavioural therapy | |||||
| Machine usage | See comment | Average machine usage in the intervention groups was | 584 | ⊕⊕⊝⊝ | Data analysed as generic inverse variance | |
| N deemed adherent (≥4 hours/night) | 28 per 100 | 47 per 100 | OR 2.23 | 358 | ⊕⊝⊝⊝ | |
| Symptoms | See comment | See comment | 100 | ⊕⊕⊝⊝ | Single study estimate | |
| Quality of life | See comment | See comment | 100 | ⊕⊕⊝⊝ | Single study estimate | |
| Withdrawal | 23 per 100 | 20 per 100 | OR 0.85 | 609 | ⊕⊝⊝⊝ | |
| *The basis for the assumed risk (e.g. the median control group risk across studies) is provided in footnotes. The corresponding risk (and its 95% confidence interval) is based on the assumed risk in the comparison group and the relative effect of the intervention (and its 95% CI). | ||||||
| GRADE Working Group grades of evidence. | ||||||
| 1Risk of bias (‐1): In the absence of blinding across studies, effect estimates may be biased because of performance bias. | ||||||
| Study | N Screened | Entered | Completed | % Screened | % Entered |
| NA | 12 | 12 | NA | 100 | |
| 339 | 227 | 149 | 44 | 66 | |
| 246 | 133 | 133 | 54 | 100 | |
| NA (75% of those approached agreed to participate) | 40 | 33 | NA | 82.5 | |
| NA | 30 | 30 | NA | 100 | |
| NA | 50 | 43 | NA | 86 | |
| NA | 75 | 54 | NA | 72 | |
| NA | 80 | 75 | NA | 94 | |
| NA | 108 | 108 | NA | 100 | |
| 74 | 72 | 55 | 74 | 76 | |
| 133 | 112 | 91 | 68 | 81 | |
| 132 | 100 | 73 | 55 | 73 | |
| 49 | 39 | 37 | 76 | 95 | |
| 109 | 100 | 79 | 72 | 79 | |
| NA | 30 | 28 | NA | 93 | |
| NA | 51 | 51 | NA | 100 | |
| NA | 19 | 19 | NA | 100 | |
| NA | 97 | 73 | NA | 75 | |
| 423 | 250 | 115 | 27 | 46 | |
| 91 | 45 | 40 | 44 | 88 | |
| 160 | 132 | 114 | 71 | 86 | |
| NA | 152 | 130 | NA | 86 | |
| NA | 93 | 56 | NA | 60 |
| Intervention group | Study | Intervention | Control | Study duration (weeks) | ||
| Increased support and reinforcement components | Increased educational components | Behavioural therapy | ||||
| Increased support and reinforcement | Weekly telephone calls to monitor progress and troubleshoot | Written information on OSA and CPAP | Usual care | Eight | ||
| Computer‐based telecommunication system allowing for monitoring and reinforcing compliance | Education provided by the computer‐based telecommunication system | Usual care | Eight | |||
| Telecomunication system allowing for daily monitoring of CPAP usage, timely detection and troubleshooting of problems | Usual care | 12 | ||||
| 2 additional titration nights in hospital, 4 additional visits at home by sleep nurses | Initial education at home with partner | Usual care | 24 | |||
| 2 additional early reviews by sleep physician and frequent telephone calls by sleep nurses | Videotape and additional education session | Usual care | 12 | |||
| 1 additional early review by sleep physician and 1 early telephone interview with sleep nurse | Educational video | Usual care | 52 | |||
| 4 additional home visits in the first 3 months by sleep practitioner for problem solving | Written information and detailed explanation by the prescriber, additional education during home visits | Written information and detailed explanation by the prescriber + usual care | 52 | |||
| 4 additional home visits in the first 3 months by sleep practitioner for problem solving | Additional education during home visits | Usual care | 52 | |||
| 2 individual sessions and 8 telephone conversations with trained peer CPAP users providing support and sharing their positive experience with CPAP | Peers shared their knowledge on CPAP and OSA | Interventions delivered by peer contained elements of promoting self‐efficacy, risk perception, participant activation and motivation | Usual care | 12 | ||
| Internet‐based application aimed at encouraging CPAP use and problem solving | Internet‐based application similar in format to intervention but directed activities in neutral health topics (vitamin intake) | 16 | ||||
| Home video‐link sessions delivered by nurse, who guided correct CPAP use and provided problem solving | Nurse provided education on CPAP and OSA | Home video‐link sessions similar in form to intervention but directed activities in neutral health topics (vitamin intake) | 12 | |||
| Audiotaped music along with softly spoken directions on relaxation techniques and habit‐promoting instructions for using CPAP, user reminder placard | Handouts on benefits of CPAP adherence and health consequences of poor compliance | Audiotaped music along with spoken information about vitamins. Information packet similar in format to intervention, but content was on vitamins | 24 | |||
| Wireless telemonitoring of compliance and treatment efficacy on daily basis and acting on the data via prespecified clinical pathways | Usual care | Eight | ||||
| Internet‐based application aimed at monitoring self‐reported compliance, acting on the information in timely fashion | Usual care | Four | ||||
| Progressive muscle relaxation | Usual care | 12 | ||||
| Progressive muscle relaxation + 2 additional nights of CPAP titration | 4hour group education session, written information, video CD | Two additional nights of CPAP titration + four‐hour group education session, written information, video CD + usual care | 12 | |||
| Increased education | Two 45‐minute individual didactic sessions and one booster phone call by sleep nurse | Usual care | 52 | |||
| 10‐Minute educational video session on OSA and CPAP | Usual care | 24 | ||||
| Educational and desensitisation course | Usual care | 24 | ||||
| 4 additional home visits in the first 3 months by sleep practitioner for problem solving | Written information and detailed explanation by the prescriber, additional education during home visits | Four additional home visits in the first three months by sleep practitioner for problem solving and additional education + usual care | 52 | |||
| Written information and detailed explanation by the prescriber | Usual care | 52 | ||||
| 2 additional nights of CPAP titration | Four‐hour group education session, written information, video CD | Usual care | 12 | |||
| Progressive muscle relaxation + 2 additional nights of CPAP titration | Four‐hour group education session, written information, video CD | Progressive muscle relaxation + usual care | 12 | |||
| 15‐Minute educational video addressing misconception about OSA and barriers to effective CPAP treatment | Usual care | Four | ||||
| Behavioural therapy | Elements of education on consequences of OSA and efficacy of CPAP | Two 45‐minute sessions of cognitive‐behavioural therapy interventions | Two 45‐minute sessions involving discussion on sleep architecture and sleep clinic | 12 | ||
| Two 45‐minute sessions of Motivational Enhancement Therapy, one booster phone call | Usual care | 52 | ||||
| 45‐Minute individual education session | Three 30‐minute sessions of Motivational Interviewing Therapy | 45‐Minute educational session + usual care | 52 | |||
| Slide presentation and written information on OSA and CPAP | Two one‐hour group sessions of cognitive‐behavioural therapy | Usual care | Four | |||
| Written personalised feedback report framed according to Motivational Enhancement Theory | Written information from the American Academy of Sleep Medicine | 12 | ||||
| Side effects management module incorporated in the automated telephone‐linked communication system | Information exchange on OSA and CPAP incorporated in the automated telephone‐linked communication system | Automated telephone‐linked communication system designed around the concept of Motivational Interviewing, which allowed one to assess and enhance CPAP compliance | General education on unrelated health topics via automated telephone‐linked communication system | 52 | ||
| Outcome or subgroup title | No. of studies | No. of participants | Statistical method | Effect size |
| 1 Machine usage (hours/night) Show forest plot | 13 | 803 | Mean Difference (IV, Random, 95% CI) | 0.82 [0.36, 1.27] |
| 2 Machine usage, sensitivity analysis: excluding participants aware of machine usage monitoring Show forest plot | 6 | 378 | Mean Difference (IV, Fixed, 95% CI) | 1.07 [0.61, 1.52] |
| 3 Machine usage, sensitivity analysis: adherence in control group < four hours/night Show forest plot | 8 | 471 | Mean Difference (IV, Fixed, 95% CI) | 1.36 [0.96, 1.76] |
| 4 N deemed adherent (≥ four hours/night) Show forest plot | 4 | 268 | Odds Ratio (M‐H, Fixed, 95% CI) | 2.06 [1.22, 3.47] |
| 5 Epworth Sleepiness Scale scores Show forest plot | 8 | 501 | Mean Difference (IV, Random, 95% CI) | ‐0.60 [‐1.81, 0.62] |
| 6 Quality of life: Functional Outcomes of Sleep Questionnaire Show forest plot | 2 | 70 | Mean Difference (IV, Fixed, 95% CI) | 0.98 [‐0.84, 2.79] |
| 7 Quality of life: Sleep Apnoea Quality of Life Index (SAQLI) Show forest plot | 1 | Mean Difference (IV, Fixed, 95% CI) | Totals not selected | |
| 8 Mood Show forest plot | 3 | 312 | Mean Difference (IV, Fixed, 95% CI) | ‐0.94 [‐1.55, ‐0.33] |
| 8.1 HAD Scale for Anxiety | 1 | 80 | Mean Difference (IV, Fixed, 95% CI) | ‐1.10 [‐2.95, 0.75] |
| 8.2 HAD Scale for Depression | 3 | 232 | Mean Difference (IV, Fixed, 95% CI) | ‐0.93 [‐1.57, ‐0.28] |
| 9 Withdrawals Show forest plot | 12 | 903 | Odds Ratio (M‐H, Fixed, 95% CI) | 0.65 [0.44, 0.97] |
| 10 AHI on treatment Show forest plot | 2 | 115 | Mean Difference (IV, Fixed, 95% CI) | ‐0.07 [‐1.62, 1.48] |
| 11 Maintenance of Wakefulness Test (MWT) Show forest plot | 1 | Mean Difference (IV, Fixed, 95% CI) | Totals not selected | |
| Outcome or subgroup title | No. of studies | No. of participants | Statistical method | Effect size |
| 1 Machine usage (hours/night) Show forest plot | 7 | 508 | Mean Difference (IV, Fixed, 95% CI) | 0.60 [0.27, 0.93] |
| 2 N deemed adherent (≥ four hours/night) Show forest plot | 3 | 285 | Odds Ratio (M‐H, Fixed, 95% CI) | 1.80 [1.09, 2.95] |
| 3 Epworth Sleepiness Scale scores Show forest plot | 5 | 336 | Mean Difference (IV, Fixed, 95% CI) | ‐1.17 [‐2.07, ‐0.26] |
| 4 Quality of life: Sleep Apnoea Quality of Life Index (SAQLI) Show forest plot | 1 | Mean Difference (IV, Fixed, 95% CI) | Totals not selected | |
| 5 HAD Scale for Depression Show forest plot | 2 | 152 | Mean Difference (IV, Fixed, 95% CI) | ‐0.52 [‐1.25, 0.22] |
| 6 Withdrawal Show forest plot | 8 | 683 | Odds Ratio (M‐H, Fixed, 95% CI) | 0.67 [0.45, 0.98] |
| Outcome or subgroup title | No. of studies | No. of participants | Statistical method | Effect size |
| 1 Machine usage (hours/night) Show forest plot | 6 | 584 | Mean Difference (Random, 95% CI) | 1.44 [0.43, 2.45] |
| 2 Sensitivity analysis: excluding participants aware of machine usage monitoring Show forest plot | 5 | Mean Difference (Fixed, 95% CI) | 1.54 [0.99, 2.09] | |
| 3 N deemed adherent (≥ four hours/night) Show forest plot | 3 | 358 | Odds Ratio (M‐H, Fixed, 95% CI) | 2.23 [1.45, 3.45] |
| 4 Epworth Sleepiness Scale score Show forest plot | 1 | Mean Difference (IV, Fixed, 95% CI) | Totals not selected | |
| 5 Quality of life: Functional Outcomes of Sleep Questionnaire Show forest plot | 1 | Mean Difference (IV, Fixed, 95% CI) | Totals not selected | |
| 6 Withdrawal Show forest plot | 5 | 609 | Odds Ratio (M‐H, Fixed, 95% CI) | 0.85 [0.57, 1.25] |