| Intervention group | Study | Intervention | Control | Study duration (weeks) |
| Increased support and reinforcement components | Increased educational components | Behavioural therapy |
| Increased support and reinforcement | Chervin 1997 | Weekly telephone calls to monitor progress and troubleshoot | Written information on OSA and CPAP | | Usual care | Eight |
| DeMolles 2004 | Computer‐based telecommunication system allowing for monitoring and reinforcing compliance | Education provided by the computer‐based telecommunication system | | Usual care | Eight |
| Fox 2012 | Telecomunication system allowing for daily monitoring of CPAP usage, timely detection and troubleshooting of problems | | | Usual care | 12 |
| Hoy 1999 | 2 additional titration nights in hospital, 4 additional visits at home by sleep nurses | Initial education at home with partner | | Usual care | 24 |
| Hui 2000 | 2 additional early reviews by sleep physician and frequent telephone calls by sleep nurses | Videotape and additional education session | | Usual care | 12 |
| Lewis 2006 | 1 additional early review by sleep physician and 1 early telephone interview with sleep nurse | Educational video | | Usual care | 52 |
| Meurice 2007a | 4 additional home visits in the first 3 months by sleep practitioner for problem solving | Written information and detailed explanation by the prescriber, additional education during home visits | | Written information and detailed explanation by the prescriber + usual care | 52 |
| Meurice 2007b | 4 additional home visits in the first 3 months by sleep practitioner for problem solving | Additional education during home visits | | Usual care | 52 |
| Parthasarathy 2012 | 2 individual sessions and 8 telephone conversations with trained peer CPAP users providing support and sharing their positive experience with CPAP | Peers shared their knowledge on CPAP and OSA | Interventions delivered by peer contained elements of promoting self‐efficacy, risk perception, participant activation and motivation | Usual care | 12 |
| Schiefelbein 2005 | Internet‐based application aimed at encouraging CPAP use and problem solving | | | Internet‐based application similar in format to intervention but directed activities in neutral health topics (vitamin intake) | 16 |
| Smith 2006 | Home video‐link sessions delivered by nurse, who guided correct CPAP use and provided problem solving | Nurse provided education on CPAP and OSA | | Home video‐link sessions similar in form to intervention but directed activities in neutral health topics (vitamin intake) | 12 |
| Smith 2009 | Audiotaped music along with softly spoken directions on relaxation techniques and habit‐promoting instructions for using CPAP, user reminder placard | Handouts on benefits of CPAP adherence and health consequences of poor compliance | | Audiotaped music along with spoken information about vitamins. Information packet similar in format to intervention, but content was on vitamins | 24 |
| Stepnowsky 2007 | Wireless telemonitoring of compliance and treatment efficacy on daily basis and acting on the data via prespecified clinical pathways | | | Usual care | Eight |
| Taylor 2006 | Internet‐based application aimed at monitoring self‐reported compliance, acting on the information in timely fashion | | | Usual care | Four |
| Wang 2011b | Progressive muscle relaxation | | | Usual care | 12 |
| Wang 2011c | Progressive muscle relaxation + 2 additional nights of CPAP titration | 4hour group education session, written information, video CD | | Two additional nights of CPAP titration + four‐hour group education session, written information, video CD + usual care | 12 |
| Increased education | Aloia 2012a | | Two 45‐minute individual didactic sessions and one booster phone call by sleep nurse | | Usual care | 52 |
| Basoglu 2011 | | 10‐Minute educational video session on OSA and CPAP | | Usual care | 24 |
| Epstein 2000 | | Educational and desensitisation course | | Usual care | 24 |
| Meurice 2007c | 4 additional home visits in the first 3 months by sleep practitioner for problem solving | Written information and detailed explanation by the prescriber, additional education during home visits | | Four additional home visits in the first three months by sleep practitioner for problem solving and additional education + usual care | 52 |
| Meurice 2007d | | Written information and detailed explanation by the prescriber | | Usual care | 52 |
| Wang 2011a | 2 additional nights of CPAP titration | Four‐hour group education session, written information, video CD | | Usual care | 12 |
| Wang 2011d | Progressive muscle relaxation + 2 additional nights of CPAP titration | Four‐hour group education session, written information, video CD | | Progressive muscle relaxation + usual care | 12 |
| Wiese 2005 | | 15‐Minute educational video addressing misconception about OSA and barriers to effective CPAP treatment | | Usual care | Four |
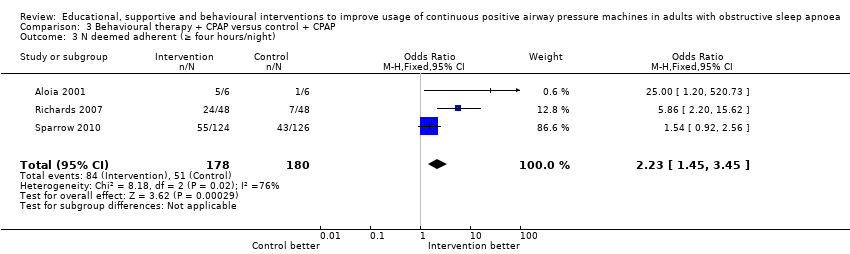
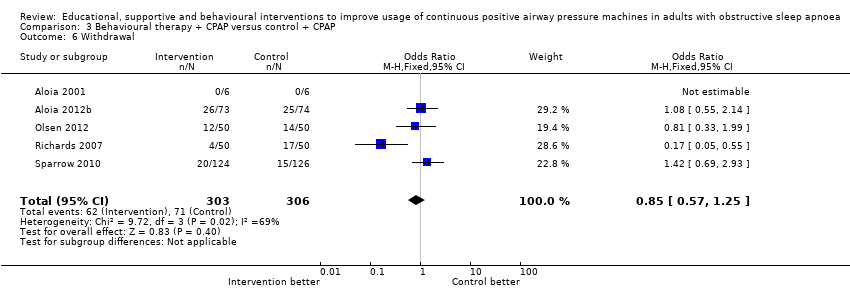
| Behavioural therapy | Aloia 2001 | | Elements of education on consequences of OSA and efficacy of CPAP | Two 45‐minute sessions of cognitive‐behavioural therapy interventions | Two 45‐minute sessions involving discussion on sleep architecture and sleep clinic | 12 |
| Aloia 2012b | | | Two 45‐minute sessions of Motivational Enhancement Therapy, one booster phone call | Usual care | 52 |
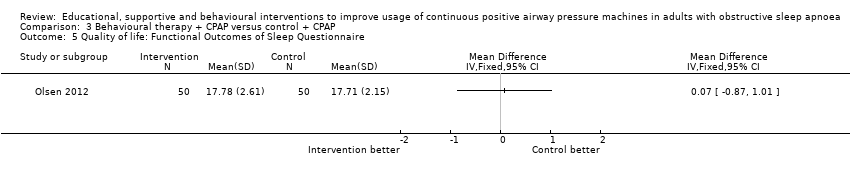
| Olsen 2012 | | 45‐Minute individual education session | Three 30‐minute sessions of Motivational Interviewing Therapy | 45‐Minute educational session + usual care | 52 |
| Richards 2007 | | Slide presentation and written information on OSA and CPAP | Two one‐hour group sessions of cognitive‐behavioural therapy | Usual care | Four |
| Roecklein 2010 | | | Written personalised feedback report framed according to Motivational Enhancement Theory | Written information from the American Academy of Sleep Medicine | 12 |
| Sparrow 2010 | Side effects management module incorporated in the automated telephone‐linked communication system | Information exchange on OSA and CPAP incorporated in the automated telephone‐linked communication system | Automated telephone‐linked communication system designed around the concept of Motivational Interviewing, which allowed one to assess and enhance CPAP compliance | General education on unrelated health topics via automated telephone‐linked communication system | 52 |