Educational, supportive and behavioural interventions to improve usage of continuous positive airway pressure machines in adults with obstructive sleep apnoea
Abstract
Background
Although highly effective in the treatment of obstructive sleep apnoea (OSA), continuous positive airway pressure (CPAP) is not universally accepted by users. Educational, supportive and behavioural interventions may help people with OSA initiate and maintain regular and continued use of CPAP.
Objectives
To assess the effectiveness of educational, supportive, behavioural, or mixed (combination of two or more intervention types) strategies that aim to encourage adults who have been prescribed CPAP to use their devices.
Search methods
Searches were conducted on the Cochrane Airways Group Specialised Register of trials. Searches are current to 29 April 2019.
Selection criteria
We included randomised controlled trials (RCTs) that assessed intervention(s) designed to inform participants about CPAP/OSA, to support them in using CPAP, or to modify their behaviour to increase use of CPAP devices.
Data collection and analysis
We assessed studies to determine their suitability for inclusion in the review. Data were extracted independently and were entered into RevMan for analysis. 'Risk of bias' assessments were performed, using the updated 'Risk of bias 2' tool, for the primary outcome, CPAP usage. Study‐level 'Risk of bias' assessments were performed using the original 'Risk of bias' tool. GRADE assessment was performed using GRADEpro.
Main results
Forty‐one studies (9005 participants) are included in this review; 16 of these studies are newly identified with updated searches. Baseline Epworth Sleepiness Scale (ESS) scores indicate that most participants suffered from excessive daytime sleepiness. The majority of recruited participants had not used CPAP previously. When examining risk of bias for the primary outcome of hourly machine usage/night, 58.3% studies have high overall risk (24/41 studies), 39.0% have some concerns (16/41 studies), and 2.4% have low overall risk (1/41 studies).
We are uncertain whether educational interventions improve device usage, as the certainty of evidence was assessed as very low. We were unable to perform meta‐analyses for number of withdrawals and symptom scores due to high study heterogeneity.
Supportive interventions probably increase device usage by 0.70 hours/night (95% confidence interval (CI) 0.36 to 1.05, N = 1426, 13 studies, moderate‐certainty evidence), and low‐certainty evidence indicates that the number of participants who used their devices ≥ 4 hours/night may increase from 601 to 717 per 1000 (odds ratio (OR), 1.68, 95% CI 1.08 to 2.60, N = 376, 2 studies). However, the number of withdrawals may also increase from 136 to 167 per 1000 (OR 1.27, 95% CI 0.97 to 1.66, N = 1702, 11 studies, low‐certainty evidence). Participants may experience small improvements in symptoms (ESS score ‐0.32 points, 95% CI ‐1.19 to 0.56, N = 470, 5 studies, low‐certainty evidence), and we are uncertain whether quality of life improves with supportive interventions, as the certainty of evidence was assessed as very low.
When compared with usual care, behavioural interventions produce a clinically‐meaningful increase in device usage by 1.31 hours/night (95% CI 0.95 to 1.66, N = 578, 8 studies, high‐certainty evidence), probably increase the number of participants who used their machines ≥ 4 hours/night from 371 to 501 per 1000 (OR 1.70, 95% CI 1.20 to 2.41, N = 549, 6 studies, high‐certainty evidence), and reduce the number of study withdrawals from 146 to 101 per 1000 (OR 0.66, 95% CI 0.44 to 0.98, N = 939, 10 studies, high‐certainty evidence). Behavioural interventions may reduce symptoms (ESS score ‐2.42 points, 95% CI ‐4.27 to ‐0.57, N = 272, 5 studies, low‐certainty evidence), but probably have no effect on quality of life (Functional Outcomes of Sleep Questionnaire (FOSQ), standardised mean difference (SMD) 0.00, 0.95% CI ‐0.26 to 0.26, N = 228, 3 studies, moderate‐certainty evidence). We are uncertain whether behavioural interventions improve apnoea hypopnoea index (AHI), as the certainty of evidence was assessed as very low.
We are uncertain if mixed interventions improve device usage, increase the number of participants using their machines ≥ 4 hours/night, reduce study withdrawals, improve quality of life, or reduce anxiety symptoms, as the certainty of evidence for these outcomes was assessed to be very low. Symptom scores via the ESS could not be measured due to considerable heterogeneity between studies.
Authors' conclusions
In CPAP‐naïve people with OSA, high‐certainty evidence indicates that behavioural interventions yield a clinically‐significant increase in hourly device usage when compared with usual care. Moderate certainty evidence shows that supportive interventions increase usage modestly. Very low‐certainty evidence shows that educational and mixed interventions may modestly increase CPAP usage. The impact of improved CPAP usage on daytime sleepiness, quality of life, and mood and anxiety scores remains unclear since these outcomes were not assessed in the majority of included studies. Studies addressing the choice of interventions that best match individual patient needs and therefore result in the most successful and cost‐effective therapy are needed.
PICO
Plain language summary
Do supportive, educational and behavioural interventions improve usage of continuous positive airway pressure in adults with obstructive sleep apnoea?
What is obstructive sleep apnoea (OSA) and continuous positive airway pressure (CPAP)?
Obstructive sleep apnoea (OSA) is a condition that causes interrupted breathing during sleep. People with OSA spend more time in light sleep and less time in deep sleep and consequently experience daytime sleepiness, which may affect their daily life.
Continuous positive airway pressure (CPAP) is a treatment that delivers pressurised air to keep the airway open. CPAP treatment involves a machine with three main parts: a device that fits over nose and mouth, a tube that connects the mask to the device's motor; and a motor that blows air into the tube.
Review question
We already know that CPAP treats OSA effectively in most people by improving symptoms resulting from OSA. However many people do not use their CPAP machine as much as is recommended. We wanted to look at interventions designed to educate and motivate people with OSA to use their CPAP machines more.
Study characteristics
We looked at evidence from randomised, parallel‐group, controlled studies. Following a comprehensive literature search and assessment of trials, we included 41 studies (number of participants = 9005). Most people experienced excessive daytime sleepiness and had newly diagnosed OSA. Duration of studies ranged from 28 days to two years.
Results
We grouped the trials into those that gave people a) education, b) a supportive intervention, c) behavioural intervention, and d) a mixed intervention (using all thee techniques).
We found that all types of interventions increase CPAP usage with varying levels of certainty. Behavioural therapy increases machine usage by 79 minutes per night, and ongoing supportive interventions probably increase machine use by about 42 minutes per night. Educational and mixed interventions may potentially improve machine usage, however the certainty of this evidence is very low.
We also wanted to look at other outcomes such as daytime sleepiness using the Epworth Sleepiness Scale (ESS), quality of life, depression, and apnoea hypopnoea index (measurement of pauses in breathing and slow or shallow breathing). Not all included studies consistently examined these other outcomes, however behavioural interventions may reduce daytime sleepiness.
Studies generally recruited people who were new to CPAP.
Quality of the evidence
The quality of evidence for improved CPAP adherence varied considerably across studies and study types. We were confident that the behavioural interventions improve adherence for around 70 minutes per night. The quality of evidence for educational, supportive, and mixed interventions was not as strong. The quality of evidence for OSA‐related symptoms including daytime sleepiness, quality of life, anxiety or depression was affected by the low number of studies that measured these outcomes.
Authors' conclusions
Summary of findings
| Educational interventions + CPAP compared to usual care + CPAP in adults with obstructive sleep apnoea | ||||||
| Patient or population: adults with obstructive sleep apnoea | ||||||
| Outcomes | Anticipated absolute effects* (95% CI) | Relative effect | № of participants | Certainty of the evidence | Comments | |
| Risk with usual care + CPAP | Risk with Educational interventions + CPAP | |||||
| 1.1 CPAP device usage (hours/night) | The mean CPAP device usage ranged from 1.97 to 5.1 hours/night | MD 0.85 hours/night higher | ‐ | 1128 | ⊕⊝⊝⊝ | |
| 1.2 CPAP device usage (hours/night), sensitivity analysis: adherence in control group < four hours/night | The mean CPAP device usage , sensitivity analysis: adherence in control group < four hours/night ranged from 1.97 to 3.8 hours/night | MD 0.85 hours/night higher | ‐ | 698 | ⊕⊝⊝⊝ | |
| 1.3 N deemed adherent (≥ four hours/night) | 558 per 1,000 | 765 per 1,000 | OR 2.58 | 1019 | ⊕⊝⊝⊝ | |
| 1.4 Withdrawal ‐ NO META‐ANALYSIS PERFORMED | ‐ | 1745 | ‐ | |||
| 1.5 ESS ‐ Comparison of values at endpoint‐ NO META‐ANALYSIS PERFORMED | ‐ | ‐ | 355 | ‐ | ||
| *The risk in the intervention group (and its 95% confidence interval) is based on the assumed risk in the comparison group and the relative effect of the intervention (and its 95% CI). | ||||||
| GRADE Working Group grades of evidence | ||||||
| 1 Overall risk of bias for this comparison was 'High' for 7/10 and 'some concerns' for the remaining 3/10. In those with high risk, risk derived from randomisation (1), missing outcome data (5), protocol deviation (1) and selective reporting (1). The combined weight of the studies with high risk is 59.2%. Therefore, risk of bias for this comparison was downgraded by 2 levels to 'very serious.' 2 There was minimal or no variability in direction of effect, with all (or nearly all) studies favouring the intervention arm. Magnitude of effect varied substantially (4 studies with CIs excluding null). CIs have reasonable overlap. Substantial statistical heterogeneity P = 0.002, I2 = 66%. Therefore, inconsistency was downgraded by one level to 'serious.' 3 Studies retrieved and analysed for this review directly compare the population, interventions and outcomes of interest, as predefined, in our review protocol. 4 Performed optimal information size (OIS) (sample size) calculation, as per GRADE Handbook recommendations, which indicated OIS criterion was met for this outcome. Confidence interval does not include null and includes potential for important benefit. 5 There was minimal or no variability in direction of effect, with all (or nearly all) studies favouring the intervention arm. Magnitude of effect varied substantially (1 study with CI excluding null). Substantial statistical heterogeneity P = 0.0008, I2 = 76%. Therefore, inconsistency was downgraded by one level to 'serious.' 6 Overall risk of bias for this comparison was 'High' for 3/6 and 'some concerns' for the remaining 3/6. In those with high risk, risk derived from missing outcome data (3). The combined weight of the studies with high risk is 44.8%. Therefore, risk of bias for this comparison was downgraded by 2 levels to 'very serious.' 7 There was no variability in direction of effect, with all (or nearly all) studies favouring the intervention arm. Magnitude of effect varied substantially (3 studies with CI excluding null). Substantial statistical heterogeneity P = 0.003, I2 = 70%. Therefore, inconsistency was downgraded by one level to 'serious.' 8 Overall risk of bias for this comparison was 'High' for 5/7 and 'some concerns' for the remaining 2/7. In those with high risk, risk derived from randomisation (1), missing outcome data (3), and selective reporting (1). The combined weight of the studies with high risk is 68.2%.Therefore, risk of bias for this comparison was downgraded by 2 levels to 'very serious.' | ||||||
| Increased practical support and encouragement during follow‐up + CPAP compared to usual care + CPAP in adults with obstructive sleep apnoea | ||||||
| Patient or population: adults with obstructive sleep apnoea | ||||||
| Outcomes | Anticipated absolute effects* (95% CI) | Relative effect | № of participants | Certainty of the evidence | Comments | |
| Risk with usual care + CPAP | Risk with Increased practical support and encouragement during follow‐up + CPAP | |||||
| 2.1 CPAP device usage (hours/night) | The mean CPAP device usage ranged from 1.75 to 4.9 hours/night | MD 0.70 hours/night higher | ‐ | 1426 | ⊕⊕⊕⊝ | |
| 2.2 CPAP device usage, sensitivity analysis: adherence in control group < four hours/night | The mean CPAP device usage, sensitivity analysis: adherence in control group < four hours/night ranged from 1.75 to 3.8 hours/night | MD 0.91 hours/night higher | ‐ | 735 | ⊕⊕⊕⊕ | |
| 2.3 N deemed adherent (≥ four hours/night) | 601 per 1,000 | 717 per 1,000 | OR 1.68 | 376 | ⊕⊕⊝⊝ | |
| 2.4 Withdrawals | 136 per 1,000 | 167 per 1,000 | OR 1.27 | 1702 | ⊕⊕⊝⊝ | |
| 2.5.2 ESS: Comparison Endpoint or Change from Baseline Values ‐ ESS: Change from Baseline | The mean ESS ‐ Comparison Endpoint or Change from Baseline Values ‐ ESS: Change from Baseline ranged from ‐0.7 to ‐5.1 | MD 0.32 lower | ‐ | 470 | ⊕⊕⊝⊝ | |
| 2.7 Quality of lIfe: Comparison of Change from Baseline Values | The mean Quality of lIfe: Comparison of Change from Baseline Values was 0 | SMD 0.22 higher | ‐ | 294 | ⊕⊝⊝⊝ | |
| *The risk in the intervention group (and its 95% confidence interval) is based on the assumed risk in the comparison group and the relative effect of the intervention (and its 95% CI). | ||||||
| GRADE Working Group grades of evidence | ||||||
| 1 Overall risk of bias for this comparison was 'High' for 8/13 and 'some concerns' for the remaining 5/13. In those with high risk, risk derived from randomisation (1), missing outcome data (6), protocol deviation (1) and selective reporting (2). The combined weight of the studies with high risk is 51.2%. Therefore, risk of bias for this comparison was downgraded by 1 level to 'serious.' 2 Direction of effect had some variability (one study, weight = 6.8%, favoured control), while remaining studies favoured experimental arms. Magnitude of effect varied across studies and CIs had fair overlap. Heterogeneity P = 0.05, I2 = 42%. Heterogeneity explained: attributable to single study with opposite direction of effect (Mendelson 2014). See sensitivity analysis with this study excluded (Analysis 2.13). 3 Studies retrieved and analysed for this review directly compare the population, interventions and outcomes of interest, as predefined, in our review protocol. 4 Performed optimal information size (OIS) (sample size) calculation, as per GRADE Handbook recommendations, which indicated OIS criterion was met for this outcome. Confidence interval does not include null and includes potential for important benefit. 5 Overall risk of bias for this comparison was 'High' for 3/7 and 'some concerns' for the remaining 4/7. In those with high risk, risk derived from missing outcome data (1) and selective reporting (2). The combined weight of the studies with high risk is 14.2%. 6 Overall risk of bias for this comparison was 'High' for 1/2 and 'some concerns' for the remaining 1/2. Hisk risk derived from missing outcome data. The weight of high risk study is 24.8%. Therefore, risk of bias for this comparison was downgraded by 1 level to 'serious.' 7 OIS (sample size) calculation, as per GRADE Handbook recommendations, which indicated OIS criterion not met for this outcome. Therefore, Imprecision for this comparison was downgraded by 1 level to 'serious.' 8 Performed OIS (sample size) calculation, as per GRADE Handbook recommendations, which indicated OIS criterion not met for this outcome. Additionally, CI includes null and potential for important difference in withdrawals. Therefore, Imprecision for this comparison was downgraded by 2 levels to 'very serious.' 9 Overallrisk of bias for this outcome is 'high' for all, or nearly all, included studies because, for all or nearly all studies assessed for this outcome, the following were true: a) outcome assessors (whether participant or investigator) were aware of the intervention received by study participants, b) the outcome assessment could have been influenced by knowledge of the intervention received (because each involves some judgement by the assessor, whether participant or investigator) and c) we have no further information that would permit further adjudication of the likelihood that outcome assessment was influenced by knowledge of the intervention received. Therefore, risk of bias for this comparison was downgraded by 1 level to 'serious.' 10 OIS likely insufficient.Therefore, Imprecision for this comparison was downgraded by 1 level to 'serious.' 11 Our review included a comprehensive search for published reports conducted. All (or nearly all) studies, including all small studies, for this comparison found a benefit for the intervention. Thus, due to suspicion for publication bias, this outcome was downgraded by one level. 12 Overall risk of bias for this comparison was 'High' for 7/12 and 'some concerns' for the remaining 5/12. In those with high risk, risk derived from randomisation (1), missing outcome data (5), protocol deviation (1) and selective reporting (2). The combined weight of the studies with high risk is 46.1%. | ||||||
| Behavioural therapy + CPAP compared to control + CPAP in adults with obstructive sleep apnoea | ||||||
| Patient or population: adults with obstructive sleep apnoea | ||||||
| Outcomes | Anticipated absolute effects* (95% CI) | Relative effect | № of participants | Certainty of the evidence | Comments | |
| Risk with control + CPAP | Risk with Behavioural therapy + CPAP | |||||
| 3.1 CPAP Device Usage (hours/night) | The mean CPAP Device Usage ranged from 1.48 to 5.1 hours/night | MD 1.31 hours/night higher | ‐ | 578 | ⊕⊕⊕⊕ | |
| 3.2 CPAP Device Usage, sensitivity analysis: adherence in control group < four hours/night | The mean CPAP Device Usage, sensitivity analysis: adherence in control group < four hours/night ranged from 1.48 to 3.65 hours/night | MD 1.32 hours/night higher | ‐ | 525 | ⊕⊕⊕⊝ | |
| 3.3 N deemed adherent (≥ four hours/night) | Study population | OR 1.70 | 549 | ⊕⊕⊕⊕ | ||
| 371 per 1,000 | 501 per 1,000 | |||||
| 3.4 Withdrawal | 146 per 1,000 | 101 per 1,000 | OR 0.66 | 939 | ⊕⊕⊕⊕ | |
| 3.5 ESS (Endpoint scores) | The mean ESS (Endpoint scores) ranged from 7.1 to 12.5 | MD 2.42 lower | ‐ | 271 | ⊕⊕⊝⊝ | |
| 3.6 AHI on treatment ‐ Endpoint | The mean AHI at endpoint ranged from 3.7 to 4.3 events/hour | MD 0.95 events/hour lower | ‐ | 89 | ⊕⊝⊝⊝ | |
| 3.7 Quality of Life ‐ Comparison of Values at Endpoint | The mean Quality of Life ‐ Comparison of Values at Endpoint was 0 | SMD 0 | ‐ | 228 | ⊕⊕⊕⊝ | |
| 3.7.1 Quality of Life ‐ Comparison of Values at Endpoint ‐ QoL: FOSQ ‐ Endpoint | The mean Quality of Life ‐ Comparison of Values at Endpoint ‐ QoL: FOSQ ‐ Endpoint was 0 | SMD 0.01 higher | ‐ | 200 | ‐ | |
| *The risk in the intervention group (and its 95% confidence interval) is based on the assumed risk in the comparison group and the relative effect of the intervention (and its 95% CI). | ||||||
| GRADE Working Group grades of evidence | ||||||
| 1 Studies retrieved and analysed for this review directly compare the population, interventions and outcomes of interest, as predefined, in our review protocol. 2 Performed optimal information size (OIS) (sample size) calculation, as per GRADE Handbook recommendations, which indicated OIS criterion was met for this outcome. Confidence interval does not include null and includes potential for important benefit (1 hour more use/night). 3 Overall risk of bias for this comparison was 'Some concerns' for 4/8 and 'high' for the remaining 4/8. In those with high risk, risk derived from randomisation (1), missing outcome (1), protocol deviation/missing outcome data (1) and selective reporting (1). The combined weight of the four studies with high risk is 45.1%. 4 Overall risk of bias for this comparison was 'Some concerns' for 3/6 and 'high' for the remaining 3/6. In those with high risk, risk derived from missing outcome (1), protocol deviation/missing outcome data (1) and selective reporting (1). The combined weight of the two studies with high risk is 54.4%. Therefore, risk of bias for this comparison was downgraded by 1 level to 'serious.' 5 Direction of effect did not vary. Magnitude of effect varied somewhat and CIs had good overlap. Heterogeneity P = 0.38, I2 = 6%. 6 Overall risk of bias for this comparison was 'Some concerns' for 2/6 and 'high' for the remaining 4/6. In those with high risk, risk derived from randomisation process (1), missing outcome data (1), protocol deviation/missing outcome data (1) and selective reporting (1). The combined weight of the two studies with high risk is 32.4%. 7 One (second highest‐weighted) study found opposite direction of effect (favoured control). The remaining studies had similar magnitude of effect and showed reasonable overlap of CIs. Heterogeneity P = 0.46, I2 = 0%. 8 Overall risk of bias for this outcome is 'high' for all, or nearly all, included studies because, for all or nearly all studies assessed for this outcome, the following were true: a) outcome assessors (whether participant or investigator) were aware of the intervention received by study participants, b) the outcome assessment could have been influenced by knowledge of the intervention received (because each involves some judgement by the assessor, whether participant or investigator) and c) we have no further information that would permit further adjudication of the likelihood that outcome assessment was influenced by knowledge of the intervention received. Therefore, risk of bias for this comparison was downgraded by 1 level to 'serious.' 9 Direction of effect had some variability (one study, weight =17.9%, modestly favoured control), while remaining studies favoured experimental arms. Magnitude of effect varied significantly and CIs had moderate overlap. Heterogeneity P = 0.008, I2=71%.Therefore, inconsistency was downgraded by one level to 'serious.' 10 Only two studies provided information for this comparison. Overall risk of bias for this comparison was 'Some concerns' for 1/2 and 'high' for the remaining 1/2 (Diaferia 2017). High‐risk derived from protocol deviation/missing outcome data. Additionally, the other study (Dantas 2015) had 'some concerns' for domain 1 (study level), randomisation process. Therefore, risk of bias for this comparison was downgraded by 1 level to 'serious.' 11 Performed OIS (sample size) calculation, as per GRADE Handbook recommendations, which indicated OIS criterion not met for this outcome. Additionally, CI contained null effect and potential for important benefit.Therefore, Imprecision for this comparison was downgraded by 2 levels to 'very serious.' | ||||||
| Mixed (SUP/EDU/BEH) Intervention + CPAP compared to Usual Care + CPAP in adults with obstructive sleep apnoea | ||||||
| Patient or population: adults with obstructive sleep apnoea | ||||||
| Outcomes | Anticipated absolute effects* (95% CI) | Relative effect | № of participants | Certainty of the evidence | Comments | |
| Risk with Usual Care + CPAP | Risk with Mixed (SUP/EDU/BEH) Intervention + CPAP | |||||
| 4.1 CPAP Device Usage (hours/night) | The mean CPAP Device Usage ranged from 2.6 to 5.5 hours/night | MD 0.82 hours/night higher | ‐ | 4509 | ⊕⊝⊝⊝ | |
| 4.2 CPAP Device Usage, sensitivity analysis: adherence in control group < four hours/night | The mean CPAP Device Usage, sensitivity analysis: adherence in control group < four hours/night ranged from 2.6 to 3.8 hours/night | MD 1.77 hours/night higher | ‐ | 343 | ⊕⊝⊝⊝ | |
| 4.3 N deemed adherent (≥ four hours/night) | 741 per 1,000 | 830 per 1,000 | OR 1.71 | 4015 | ⊕⊝⊝⊝ | |
| 4.4 Withdrawal | 129 per 1,000 | 83 per 1,000 | OR 0.61 | 4956 | ⊕⊝⊝⊝ | |
| 4.5 Quality of LIfe: Comparison of Change from Baseline Values | The mean Quality of LIfe: Comparison of Change from Baseline Values was 0 | SMD 0.45 higher | ‐ | 3012 | ⊕⊕⊝⊝ | |
| 4.7 Anxiety Symptom Rating ‐ Comparison of Values at Endpoint | The mean Anxiety Symptom Rating ‐ Comparison of Values at Endpoint was 0 | SMD 0.19 lower | ‐ | 333 | ⊕⊝⊝⊝ | |
| *The risk in the intervention group (and its 95% confidence interval) is based on the assumed risk in the comparison group and the relative effect of the intervention (and its 95% CI). | ||||||
| GRADE Working Group grades of evidence | ||||||
| 1 Overall risk of bias for this comparison was 'Some concerns' for 4/11 and 'high' for the remaining 6/11. In those with high risk, risk derived from randomisation (2), missing outcome data (2), and selective reporting (3). The combined weight of the studies with high risk is 61.8%. (1 high risk study. Lewis 2006, has no weight contribution because mean difference not estimable.) Therefore, risk of bias for this comparison was downgraded by 1 level to 'serious.' 2 Direction of effect had some variability (two studies, combined weight =18.8%, favoured control), while remaining studies favoured experimental arms. Magnitude of effect varied significantly and CIs had relatively poor overlap. Heterogeneity P < 0.00001, I2 = 92% suggesting very substantial statistical heterogeneity of effect. Therefore, inconsistency was downgraded by two levels to 'very serious.' 3 Studies retrieved and analysed for this review directly compare the population, interventions and outcomes of interest, as predefined, in our review protocol. 4 Performed optimal information size (OIS) (sample size) calculation, as per GRADE Handbook recommendations, which indicated OIS criterion was met for this outcome. Confidence interval does not include null and includes potential for important benefit. 5 Overall risk of bias for this comparison was 'Some concerns' for 1/2 and 'high' for the remaining 1/2. In those with high risk, risk derived from missing outcome data. The weight of the high risk study is 48.3%.Because there were only two studies for this comparison and both were either high or 'some concerns,' risk of bias for this comparison was downgraded by 1 level to 'serious.' 6 There was no variability in direction of effect, both studies favoured experimental arms. Magnitude of effect varied substantially and CIs had no overlap. Heterogeneity P = 0.002, I2 = 90% suggesting very substantial statistical heterogeneity of effect. Therefore, inconsistency was downgraded by two levels to 'very serious.' 7 Overall risk of bias for this comparison was 'high' for 4/9. In those with high risk, risk derived from randomisation (1), missing outcome data (1), and selective reporting (2). The combined weight of the studies with high risk is 51.3%. Therefore, risk of bias for this comparison was downgraded by 1 level to 'serious.' 8 There was variability in direction of effect (three studies, combined weight=31,6%, favoured control), while remaining studies favoured experimental arms. Magnitude of effect varied substantially and CIs had modest overlap. Heterogeneity P < 0.00001, I2 = 79% suggesting very substantial statistical heterogeneity of effect.Therefore, inconsistency was downgraded by two levels to 'very serious.' 9 Performed OIS (sample size) calculation, as per GRADE Handbook recommendations, which indicated OIS criterion was met for this outcome. Confidence interval includes null and includes potential for important benefit.Therefore, imprecision was downgraded by 1 level to 'serious.' 10 There was variability in direction of effect (five studies, combined weight = 35.4%, favoured control), while remaining studies favoured experimental arms. Magnitude of effect varied substantially and CIs had modest overlap. Heterogeneity P < 0.00001, I2 = 85% suggesting very substantial statistical heterogeneity of effect.Therefore, inconsistency was downgraded by two levels to 'very serious.' 11 Overall risk of bias for this comparison was 'high' for 6/11 studies. In those with high risk, risk derived from randomisation (2), missing outcome data (2), and selective reporting (2). The combined weight of the studies with high risk is 52.80%. Therefore, risk of bias for this comparison was downgraded by 1 level to 'serious.' 12 Overall risk of bias for this outcome is 'high' for all, or nearly all, included studies because, for all or nearly all studies assessed for this outcome, the following were true: a) outcome assessors (whether participant or investigator) were aware of the intervention received by study participants, b) the outcome assessment could have been influenced by knowledge of the intervention received (because each involves some judgement by the assessor, whether participant or investigator) and c) we have no further information that would permit further adjudication of the likelihood that outcome assessment was influenced by knowledge of the intervention received.Therefore, risk of bias for this comparison was downgraded by 1 level to 'serious.' 13 There was no variability in direction of effect, both studies favoured experimental arms. Magnitude of effect varied substantially and CIs had minimal overlap. Heterogeneity P = 0.03, I2 = 79% suggesting considerable heterogeneity of effect.Therefore, inconsistency was downgraded by 1 level to 'serious.' 14 Sample size likely sufficient. Confidence interval does not include null, but also likely does not include potential for important benefit (i.e. standardised mean difference of at least 1). No downgrade. 15 Overall risk of bias for this outcome is 'high' for all, or nearly all, included studies because, for all or nearly all studies assessed for this outcome, the following were true: a) outcome assessors (whether participant or investigator) were aware of the intervention received by study participants, b) the outcome assessment could have been influenced by knowledge of the intervention received (because each involves some judgement by the assessor, whether participant or investigator) and c) we have no further information that would permit further adjudication of the likelihood that outcome assessment was influenced by knowledge of the intervention received. Additionally, a different anxiety symptom rating scale was used for each and they targeted different dimensions of anxiety (e.g. state vs. trait). Therefore, risk of bias for this comparison was downgraded by 2 levels to 'very serious.' 16 Sample size for this comparison relatively small, OIS probably not met (approximated based on comparison of means for study with highest weight). CI includes null but likely does not include important benefit/harm.Therefore, imprecision was downgraded by 1 level to 'serious.' | ||||||
Background
Description of the condition
Obstructive sleep apnoea (OSA) is a common sleep‐related breathing disorder characterised by transient interruption of ventilation caused by complete or partial occlusion of the upper airway. Prolonged airway occlusion may lead to oxygen desaturation, which reduces vascular elasticity, increases coagulability and blood pressure, and predisposes to atherosclerosis (Gagnon 2014). The hypoxia and subsequent reoxygenation caused by OSA can increase blood brain barrier permeability, resulting in neurotoxicity and both medical and neuropsychiatric consequences (Bucks 2013; Canessa 2011; Devita 2017; Lochhead 2010; Olaithe 2013; Osorio 2015; Pan 2014; Stranks 2016; Verstraeten 2004; Yaffe 2011). Additionally, recurrent hypoxia and increased inspiratory effort lead to sleep fragmentation and frequent arousals from sleep.
For many individuals, these physiological changes and sleep fragmentation collectively lead to a range of symptoms: excessive daytime sleepiness (Schwab 2013), mood alterations (Garbarino 2018; Jackson 2018), impairment of cognition and memory (Delhikar 2019; Gagnon 2019; Olaithe 2013; Olaithe 2018), and changes in driving competence (Gagnon 2014; Karimi 2015; Phillipson 1993; Schwab 2013; Tregear 2009). Furthermore, OSA is associated with cardiovascular, cerebrovascular and metabolic co‐morbidities (Dong 2018; Gami 2005; Hashmi 2014; Harsch 2004; Marin 2005; Mokhlesi 2016; Peppard 2000; Punjabi 2009; Schwab 2013; Senaratna 2016; Young 2002; Young 2002a; ; ;), as well as increased mortality (Gami 2005; Marin 2005; Marshall 2008; Marshall 2014; Punjabi 2009; Yaggi 2005; Young 2008).
Phenotyping of OSA severity (mild, moderate and severe) is commonly designated by apnoea hypopnoea index (AHI) (> 5 and ≤15, 15 to 30, > 30). However, OSA is a heterogeneous disorder with different risk factors, clinical presentations, pathophysiology and morbidity (Sutherland 2018). AHI is not the only parameter characterising OSA severity. Recently developed measures of hypoxic burden may better predict cardiovascular mortality associated with OSA (Azarbarzin 2019). Patients with excessive daytime sleepiness are not only at a higher risk of cardiovascular complications, but also have significantly diminished quality of life (Mazzotti 2019). Finally, degree of daytime symptom is not tightly correlated with AHI, so patients with AHI in the mild range may experience significant impairment and patients with high AHI may be relatively asymptomatic (Garbarino 2018b; Zinchuk 2017).
Description of the intervention
The usual first line treatment for moderate to severe OSA is continuous positive airway pressure (CPAP) (Schwab 2013; Kennedy 2019), which involves the use of an airflow generator to provide a constant stream of pressurised air to splint open and maintain patency of the upper airway during the inspiratory and expiratory phases of breathing. When used throughout the entirety of sleep, CPAP eliminates nearly 100% of obstructive apneas/hypopnoeas for the majority of treated patients (Reeves‐Hoche 1994; Sawyer 2011; Sullivan 1981).
Consistent application of CPAP therapy improves the quality of sleep, normalises sleep architecture (Canessa 2011; Baker 2016), reduces daytime sleepiness, enhances neurobehavioural performance (Ancoli‐Israel 2008; Bucks 2013; Canessa 2011; Dalmases 2014; Dalmases 2015; Olaithe 2013; Zimmerman 2006); and reduces the risk of motor vehicle crashes (Findley 2000; Giles 2006; Gurubhagavatula 2017t; Hack 2000; Karimi 2015; Tregear 2009). Longitudinal studies have indicated that CPAP treatment has a protective effect on cardiovascular outcomes; patients who are compliant with CPAP achieve better blood pressure control (Haentjens 2007; Marin 2012; Martinez‐Garcia 2012; Pedrosa 2013; Pepperell 2002; Thunstrom 2016), and have reduced the risk of cardiovascular events (Campos‐Rodriguez 2014; Marin 2005; Martinez‐Garcia 2012; Myhill 2012; Wang 2017). Furthermore, adequate adherence to CPAP may slow cognitive decline (Richards 2019), and have a role in the prevention and treatment of acute stroke (Bravata 2011; Faheem 2018; Martinez‐Garcia 2009). However, it should be noted that this evidence has yet to be corroborated through randomised controlled trials (RCTs). The largest and most recent systematic review and meta‐analysis (Yu 2017) of the effect of CPAP on cardiovascular outcomes found no significant association. Notably CPAP usage was < 4 hours/night in the majority of (and all large) included RCTs. Similar nonsignficant findings were found by the SAVE trial (McEvoy 2016); both of these studies, as well as their proposed implications, are discussed at length in Appendix 1.
Despite the widespread recommendation of CPAP in the management of OSA (Fleetham 2011; Giles 2006; Patil 2019; Schwab 2013), concerns have arisen about its initial and continued acceptance among people who have to use it on a long‐term basis (i.e. the majority of patients diagnosed with OSA ). Reported adherence to CPAP ranges from 17% to 85% (Crawford 2014; Finkel 2009; Lewis 2004; Libman 2017; Lindberg 2006; Pépin 1999; Rotenberg 2016; Somers 2008; Weaver 2010; Young 2009). Eight per cent to 15% of patients refuse to accept the treatment after a single night's use, and some case series report an abandonment rate of up to 50% within one year (Bollig 2010; Krieger 1992). Frequently cited side effects leading to CPAP refusal include general discomfort, nasal congestion, abdominal bloating, mask leaks, claustrophobia, and inconvenience of regular usage (Pepin 1995). Poor adherence may also be related to the fact that CPAP requires a substantial and long‐term behavioural change. The difficulty of accomplishing such change may be further compounded by the high rates of comorbid depressive and anxiety symptoms found among patients with OSA (Chirinos 2017; Jackson 2018; Ohayon 2003; Saunamaki 2007). Moreover, CPAP therapy is not reimbursed in many countries (particularly for those with less severe OSA symptoms), further discouraging initiation of treatment, despite proven effectiveness.
Previously, CPAP use was measured through subjective self‐report or observations made within a clinical setting, each presenting its own bias. Self‐reported adherence is often overestimated and inaccurate, and how a patient behaves in a clinical setting is not generalisable to real world behaviour (Kribbs 1993). Technological advances have dramatically improved the accuracy of, and removed bias from adherence measurement through internalised digital counters or electronic microchip, now standard within CPAP devices. Despite this, the number of hours per night and the frequency of usage required to achieve and maintain therapeutic effectiveness are not well established.
Thresholds for "effective" CPAP usage may depend on the desired health benefit, which vary significantly between patients and relative to baseline severity of OSA (Bollig 2010; Campos‐Rodriguez 2005; Sawyer 2011;Stradling 2000; Wang 2017; Weaver 2007; Zimmerman 2006; ; ). Six to eight hours each night is a common clinical prescription for CPAP, but many studies use a threshold of four hours/night to define 'adherence’ (Lewis 2004; Richards 2007). This threshold likely emerged from early seminal studies (Reeves‐Hoche 1994; Kribbs 1993; Engleman 1994), in which average use was reported in the range of four hours/night, although the authors did not suggest this represented adequate or effective use. Unfortunately, not only has this threshold been widely employed in clinical trials, but it has directly impacted clinical practice in ways likely unintended by original or subsequent investigators. For example, several commonly‐used CPAP devices automatically display a happy face (or other positive feedback) on the user interface once they have reached a use threshold of four hours in a 24‐hour cycle. Additionally, some 'payors' will only cover the costs associated with CPAP for patients who use their device at or above an arbitrary (Schwab 2013) minimum of four hours per night on 70% of nights during an initiation period (e.g. Centers for Medicare and Medicaid Services; Mehrtash 2019). These practices, meant to encourage use, may have serious consequences for those aiming to address longstanding symptoms, risk factors or conditions.
Evidence suggests effectiveness of CPAP follows a dose‐response curve with benefit accruing at different thresholds for different outcomes. For example, Wang 2017 found that CPAP use < 4 hours/night improved daytime sleepiness, four to six hours/night improved all measured symptoms (sleep quality, daytime sleepiness, fatigue and depressive symptoms) while use of ≥ 6 hours produced significantly still greater improvements in all measured domains. Average nightly AHI is reduced by any CPAP use, but whether it reduces AHI to 'subthreshold' severity (AHI < 5) will depend upon baseline AHI, duration of CPAP use, and duration of sleep without CPAP (i.e. unrecorded time). However, increased use surpassing four hours/night has been associated with improvement in sleep architecture and arousal outcomes, reductions in blood pressure (Yang 2015), and reductions in the risk of cardiovascular and cerebrovascular events, while improved cognition and memory and decreased mortality (from the limited data available) likely require greater than six hours/night (Campos‐Rodriguez 2005; Zimmerman 2006). As such, maximising total CPAP use (i.e. to the full amount of recommended nightly sleep for adults, ˜8 hours/night) is optimal and preferred.
How the intervention might work
A substantial amount of studies have investigated predictors of CPAP adherence related to patient characteristics, disease characteristics, and CPAP technology. Research has demonstrated that perceived self‐efficacy, confidence, and motivation are both targetable and modifiable (Bandura 1982; Bandura 1986; Bandura 2004; Miller 1994), and correlate well with sustained and successful treatment (Mehrtash 2019). Moreover, social factors, including marital status, partner involvement and attitudes towards treatment, and partner's sleep quality, have been shown to positively influence CPAP adherence (Mehrtash 2019; Lewis 2004). Lastly, early adoption of CPAP treatment (i.e. within the first week to month of CPAP prescription) has been shown to predict long‐term adherence behaviour (Aloia 2007; Chervin 1997).
From these predictors, various interventions to improve initial acceptance and subsequent CPAP adherence have been proposed, each varying in duration, intensity, frequency and modality. Some approaches emphasise that increasing knowledge of OSA, CPAP and associated health outcomes may directly promote CPAP adherence. Targeting social and supportive factors, other interventions aim to quickly troubleshoot problems that occur during CPAP treatment and provide regular feedback and encouragement from automated prompts, peers, or healthcare providers. Alternatively, more interactive interventions, designed in accordance with various cognitive and behavioural models, seek to modify motivation, confidence, goal setting behaviours, and other psychological constructs in an effort to improve CPAP adherence. Often, a combination of approaches is used (Aloia 2013; Bartlett 2013; Bouloukaki 2014; Hui 2000; Hwang 2017; Lewis 2006; Meurice 2007; Sawyer 2017; Sedkaoui 2015; Shapiro 2017; Smith 2006; Wang 2012). On the technological domain, modifications of delivery of airway pressure, such as the use of automatically titrating CPAP (auto‐CPAP), bi‐level PAP (BPAP) and humidification therapy, claim to decrease side effects in the upper airway due to cold and dry airflow and thus improve the comfort of treatment, but have not yielded convincing benefits in clinical trials to date (Smith 2009).
Why it is important to do this review
Despite the apparent efficacy of CPAP and its therapeutic benefits extending beyond amelioration of OSA symptoms to other functional and potential health outcomes, treatment adherence has been persistently low (Rotenberg 2016). Interventions directed at improving CPAP usage vary in methodology, complexity and effectiveness. Knowing what type of intervention is efficacious and potentially effective in clinical practice would guide clinicians and health authorities in developing services and guidelines aimed at improving treatment adherence. Since the last Cochrane Review, published in 2014 (Wozniak 2014), which assessed educational, supportive and behavioural interventions aimed at improving CPAP usage, a substantial number of new studies have been reported. This review updates the evidence.
Objectives
To assess the effectiveness of interventions that employ educational, supportive, behavioural, or mixed approaches to encourage adults who have been prescribed continuous positive airway pressure (CPAP) to use their devices.
Methods
Criteria for considering studies for this review
Types of studies
Randomised, parallel‐controlled trials of any duration.
Types of participants
Participants were adults of either sex with a diagnosis of obstructive sleep apnoea (OSA) using a recognised sleep diagnostic tool giving an Oxygen Desaturation Index (ODI) of ≥ 5 per hour or an apnoea hypopnoea index (AHI) ≥ 5 per hour. Trials that explicitly recruited patients with central sleep apnoea were not eligible for inclusion.
Types of interventions
Intervention group
Any short‐term or sustained intervention aimed at encouraging uptake, acclimation, improvement or maintenance of continuous positive airway pressure (CPAP) adherence among individuals with a diagnosis of OSA. Examples of modalities that our review intended to capture include educational, supportive, group‐based, mindfulness‐based, cognitive, behavioural, motivational or approaches utilising a combination of these strategies.
Control group
Participants in the control group may receive instruction that would be used by the study centre in question, provided that the equivalent 'background' level of instruction was also offered and delivered to the intervention group. Intervention and control groups must have also either 1) received the same make of CPAP machine and pressure delivery mode (i.e. fixed, auto‐titrating, bi‐level PAP (BPAP), etc.) or 2) receive PAP devices in a randomly distributed manner, such that device make remained independent of group assignment.
Types of outcome measures
Primary outcomes
CPAP device usage (hours/night) as measured by:
-
microprocessor and monitor that measure pressure at the mask for every minute of each 24‐hour day;
-
counter output that records the cumulative time that power is turned on for a CPAP machine (this does not provide information on actual time of day and duration of CPAP used during each 24‐hour period);
-
subjective participant reports of the duration of CPAP use.
Secondary outcomes
The following secondary outcomes were considered:
-
proportion of participants adherent (≥ 4 hours/night);
-
sleepiness symptom scores such as the Epworth Sleepiness Scale (ESS);
-
disease‐specific quality of life scores such as Functional Outcomes of Sleep Questionnaire (FOSQ) or Calgary Sleep apnoea Quality of Life Index (SAQLI) scores;
-
any standardised depression or anxiety symptom scale measurement;
-
withdrawals from the study;
-
oxygen desaturation index (ODI), apnoea hypopnoea index (AHI);
-
cost‐effectiveness.
Search methods for identification of studies
Electronic searches
We identified studies from the Cochrane Airways Trials Register, which is maintained by the Information Specialist for the Group. The Cochrane Airways Trials Register contains studies identified from several sources.
-
Monthly searches of the Cochrane Central Register of Controlled Trials (CENTRAL), through the Cochrane Register of Studies Online (crso.cochrane.org)
-
Weekly searches of MEDLINE Ovid SP 1946 to April 2019
-
Weekly searches of Embase Ovid SP 1974 to April 2019
-
Monthly searches of PsycINFO Ovid SP 1967 to April 2019
-
Monthly searches of CINAHL EBSCO (Cumulative Index to Nursing and Allied Health Literature) 1937 to April 2019
-
Monthly searches of AMED EBSCO (Allied and Complementary Medicine) all years to April 2019
-
Hand searches of the proceedings of major respiratory conferences.
Studies contained in the Trials Register were identified through search strategies based on the scope of Cochrane Airways. Details of these strategies, as well as a list of handsearched conference proceedings are in Appendix 2. See Appendix 3 for search terms used to identify studies for this review.
Searches in the Cochrane Airways Trials Register and additional sources were completed from inception to April 2019, with no restrictions on language or publication type. Review authors attempted to contact authors to locate potential unpublished or in‐progress studies that met the inclusion criteria. When seeking further information of studies represented by trial registries or conference proceedings abstracts, the review authors contacted the trial authors for clarification if 1) the study was deemed to be potentially relevant according to inclusion criteria, 2) if the study appeared to be complete based on the information documented on ClinicalTrials.gov, 3) if no full publication was listed on the trial registry records, 4) and if no full publication was identified via an author/title/element PubMed search.
Searching other resources
We searched Epistemonikos (International database of systematic reviews) all years to April 2019 to identify other relevant systematic reviews, and checked their reference lists. We completed additional handsearching of the bibliographies of identified trials. The 2013‐2018 ATS and the 2013‐2018 European Respiratory Society (ERS) meeting abstracts were also handsearched for the current review update.
Data collection and analysis
Selection of studies
Review authors (KDA and LW) independently reviewed the titles, abstracts and citations identified through electronic searching to assess potential relevance for full review. Conflicting decisions on inclusion were resolved through discussion and consensus. Records eligible for full‐text review were scrutinised independently (KDA and LW) for inclusion based on a priori criteria for population, study design, intervention and outcome. Agreement was measured by simple agreement and conflicting decisions on study inclusion were resolved through discussion and consensus (KDA, LW, DRW, IS). See Figure 1 Study Flow Diagram. Reasons for study exclusion at the full‐text review stage were agreed upon by review authors (KDA, LW, DRW, IS) and recorded in the Characteristics of excluded studies table. For included studies, descriptive information for studies and study populations is presented in tabular form (Table 1; Table 2; Table 3;Table 4; Table 5; Table 6; Table 7).

Study flow diagram.
| Study | N Screened | Entered | Completed | % Screened | % Entered |
| NA | 12 | 12 | NA | 100 | |
| 339 | 227 | 183 | 54 | 81 | |
| 479 (only 2 of 4 treatment arms included in this review) | 83 | 78 | 16 | 94 | |
| 294 | 206 | 177 | 60 | 86 | |
| 246 | 133 | 133 | 54 | 100 | |
| 5100 | 3100 | 2836 | 56 | 91 | |
| 85 | 80 | 80 | 94 | 100 | |
| NA (75% of those approached agreed to participate) | 33 | 33 | NA | 100 | |
| 61 | 41 | 40 | 66 | 98 | |
| NA | 30 | 30 | NA | 100 | |
| NA | 49 | 49 | NA | 100 | |
| 533 | 206 | 161 | 30 | 78 | |
| NA | 75 | 54 | NA | 72 | |
| 127 | 46 | 37 | 29 | 80 | |
| NA | 80 | 80 | NA | 100 | |
| NA | 108 | 97 | NA | 90 | |
| 1873 | 1455 | 1236 | 66 | 85 | |
| 212 | 100 | 98 | 46 | 98 | |
| 74 | 72 | 58 | 78 | 81 | |
| 107 | 107 | 82 | 77 | 76 | |
| 133 | 112 | 112 | 84 | 100 | |
| 140 | 140 | 122 | 87 | 87 | |
| 132 | 106 | 94 | 71 | 89 | |
| 49 | 39 | 37 | 76 | 95 | |
| NA | 112 | 85 | NA | 76 | |
| NA | 306 | 239 | NA | 78 | |
| 109 | 100 | 96 | 88 | 96 | |
| NA | 30 | 28 | NA | 93 | |
| 490 | 115 | 115 | 23 | 100 | |
| 431 | 118 | 103 | 24 | 87 | |
| NA | 28 | 28 | NA | 100 | |
| 391 | 379 | 377 | 96 | 99 | |
| NA | 66 | 65 | NA | 98 | |
| NA | 19 | 19 | NA | 100 | |
| NA | 97 | 73 | NA | 75 | |
| NA | 202 | 146 | NA | 72 | |
| 423 | 250 | 222 | 52 | 89 | |
| 91 | 45 | 40 | 44 | 89 | |
| NA | 241 | 240 | NA | 99 | |
| NA | 100 | 100 | NA | 100 | |
| NA | 152 | 130 | NA | 86 |
| Variable | Behavioural (BEH) | Educational (EDU) | Supportive (SUP) | Mixed (MIX) |
| N (total randomised) | 989 | 1878 | 1962 | 5041 |
| Age in years (Mean, SD) | 56.44 (5.76) | 52.73 (4.68) | 53.94 (4.88) | 52.55 (5.46) |
| BMI (Mean, SD) | 32.31 (2.90) | 34.19 (3.51) | 33.19 (2.02) | 33.73 (2.80) |
| Sex (% female)* | 34.38 | 29.98 | 24.68 | 32.44 |
| AHI (Mean, SD) | 38.08 (9.04) | 39.72 (12.25) | 41.11 (10.52) | 38.82 (10.62) |
| ESS (Mean, SD) | 12.80 (4.02) | 11.27 (1.29) | 10.47 (1.50) | 12.53 (1.92) |
* Percentage female calculated based on studies reporting statistics on gender (those not reporting excluded from calculation).
| Intervention Details | Behavioural (BEH), (median, IQR) | Educational (EDU), (median, IQR) | Supportive (SUP), (median, IQR) | Mixed (MIX), (median, IQR) |
| Study duration (weeks) | 12 (12‐52) | 12 (6‐26) | 12 (12‐16) | 14 (12‐52) |
| Intervention duration (weeks) | 4 (2‐12) | 0 (0‐4.5)* | 12 (9‐13) | 12 (10‐25) |
| # of Intervention episodes | 3 (3‐14) | 2 (1‐6) | NR (MOST) | 7 (5‐10) |
| Contact time (minutes) | 90 (80‐240) | 21 (11‐105) | NR | 75 (33‐143) |
* Educational interventions that took place in a single participant interaction (e.g., dispensing written material, single presentation) were assigned a duration of '0' weeks.
Abbreviations: IQR: interquartile range; NR: not reported; NR (MOST): most studies did not report.
| Study | Studies employing Educational Intervention | Control | Study duration (weeks) | |
| Increased support and reinforcement components (if applicable) | Increased educational components | |||
| 2 x 45‐minute education sessions regarding pathophysiology of apnoea, medical and behavioral consequences, and the benefits of treatment; presented in standardised formats, with no tailoring to participant readiness, 1 booster call from sleep nurse | Usual care | 52 | ||
| One 10‐minute educational video session on OSA and CPAP | Usual care | 24 | ||
| Written information on OSA and CPAP | Usual care | 8 | ||
| Two consecutive PSG videos on the computer screen: the first recorded during a standard diagnostic overnight polysomnography, and the second during a full‐night polysomnography with nasal CPAP | Usual care | 52 | ||
| Education about OSA pathophysiology , health‐related risks, impact on daytime vigilance, introduction to CPAP therapy | Usual care | 12 | ||
| Positively or negatively framed messages in addition to CPAP. Patients were phoned weekly and read framed messages (≤ 6 phone calls per patient). | Usual care | 6 | ||
| Slide presentation and written information on OSA and CPAP and 2 x 1‐hour CBT sessions | Usual care | 4 | ||
| Personalised feedback report, including detailed information OSA and its associated risk and barriers to CPAP use and attitudes to change | Usual care | 12 | ||
| 1 x 20‐minute educational session by a sleep medicine physician, including: viewing his/her own PSG chart on morning post PAP‐titration, comparing PSG from diagnostic and CPAP titration studies with explanations that emphasized obstructive events and oxygen desaturations, and the disappearance of those signs on PAP treatment. | Usual care | 24 | ||
| 1 x 1‐hour educational session with information regarding OSA, its symptoms and risks, APAP treatment, the importance of good adherence, and different machine interfaces. | Usual care | 24 | ||
| Two additional nights of CPAP titration | 4‐hour group education session, written information, video CD | Usual care | 12 | |
Abbreviations:
CBT: Cognitive behavioural therapy; CD: compact disc; CPAP: continuous positive air pressure; OSA: obstructive sleep apnoea; PAP: positive air pressure; PSG: polysomnography
| Study | Studies employing Supportive Intervention | Control | Study duration (weeks) | |
| Increased support and reinforcement components | Increased educational components (if applicable) | |||
| Weekly telephone calls to monitor progress and troubleshoot | Usual care | 8 | ||
| Computer‐based telecommunication system allowing for monitoring and reinforcing compliance | Education via computer‐based telecommunication system | Usual care | 8 | |
| Telecomunication system for daily monitoring of CPAP usage, timely detection and troubleshooting of problems | Usual care | 12 | ||
| Telemonitoring device forair leaks, residual AHI > 10/h, or CPAP use less than 3 hours for 3 days | Usual care | 12 | ||
| 2 additional titration nights in hospital, 4 additional home visits by sleep nurses | Initial education at home with partner | Usual care | 24 | |
| Automatic processing of device data. Where CPAP usage thresholds met, automated message encouraged participant to improve use/positive reinforcement | Usual care | 12 | ||
| Participants equipped with smartphone for uploading BP, CPAP adherence, sleepiness, and QoL data. They received daily pictograms containing health‐related messages | Usualo care | 16 | ||
| Web‐based app used to monitor adherence and automatically message patients and providers when pre‐set conditions met | Usual care | 12 | ||
| 2 individual sessions and 8 telephone conversations with trained peer CPAP users providing support and sharing their positive experience with CPAP | Usual care | 12 | ||
| BP and physical activity recorded by multimodal telemonitoring device and electronic questionnaires completed by patients. Automatic algorithms constructed for prompt adjustment of CPAP treatment. | Usual care | 24 | ||
| Daily wireless telemonitoring of compliance and treatment efficacy and acting on the data via prespecified clinical pathways | Usual care | 8 | ||
| Telemonitoring device collecting daily CPAP adherence viewable by both patient and provider. Troubleshooting and feedback provided when necessary | Usual care | 16 | ||
| Daily CPAP adherence, CPAP pressures, mask leak and residual respiratory events transmitted into a web database. Case by case guidance provided by provider when signalled by automatic alarm in the web database | Usual care | 12 | ||
Abbreviations:
AHI: apnoea hypopnoea index; BP: Blood pressure; CPAP: continuous positive air pressure; QoL: quality of life.
| Study | Studies employing Behavioural Intervention | Control | Study duration (weeks) | ||
| Increased support and reinforcement components (if applicable) | Increased educational components (if applicable) | Behavioural therapy | |||
| Elements of education on consequences of OSA and efficacy of CPAP | 2 x 45‐minute sessions of CBT interventions | 2 x 45‐minute sessions on sleep architecture and sleep clinic | 12 | ||
| 2 x 45‐minute sessions of MET, one booster phone call | Usual care | 52 | |||
| Eight ‐ hour in person MET session | Usual care | 52 | |||
| 1 x 10‐minute MET session | Usual care | 8 | |||
| Thirty‐six myofunctional therapy sessions | Usual care | 36 | |||
| One brief MET session (video and patient interview), followed by a follow‐up phone call | Usual Care | 12 | |||
| 45‐Minute individual education session | Three 30‐minute sessions of MET | 45‐Minute educational session + usual care | 52 | ||
| 3 interactive sessions, video with discussion, focus group and role play, respectively 1, 2 and 3 months after receiving the CPAP device. | Usual Care | 52 | |||
| Audiotaped music and softly spoken directions on relaxation techniques and habit‐promoting instructions for using CPAP nightly. Information packet,including CPAP use reminder placard, handouts on benefits of CPAP adherence and health consequences of poor compliance, 4‐week diary for recording experience with CPAP | Audiotaped music with softly spoken information on vitamins, informational packet on vitamins and health. | 12 | |||
| Automated telephone‐linked communication system designed around the concept of Motivational Interviewing, which allowed one to assess and enhance CPAP compliance | Education on unrelated health topics via automated telephone‐linked communication system | 52 | |||
| One night of CPAP titration in the hospital | 12 x 40‐minute group PMR practice sessions over 12 weeks, one per week. Self‐practice of PMR before each CPAP treatment. Brochure and CD with a guide for PMR practice at home. | Usual care | 12 | ||
Abbreviations:
CBT: Cognitive behavioural therapy; CPAP: continuous positive air pressure; MET: Motivational Enhancement Therapy;OSA: obstructive sleep apnoea; PMR: progressive muscle relaxation;
| Study | Studies employing Mixed Intervention | Control | Study duration (weeks) | ||
| Increased support and reinforcement components | Increased educational components | Behavioural therapy | |||
| 1 x 30 minute group education session | 1 x 35‐minute intervention based on SCT , including perceived self‐efficacy, outcome expectations, and social support | Usual care + a 30‐minute group education session and social period matching the duration of the intervention | 24 | ||
| Two phone calls from study nurse to discuss CPAP use, 1 month of sleep diary review by sleep specialist, and 6 in‐person follow‐ups involving patient's family or spouse | 1 x 15 minute video education session covering OSA topics, followed by 10‐minute lecture to reinforce key topics | Usual care | 104 | ||
| Personalised guidance from a study nurse, home visits from a nurse discussing lifestyle management, mental well‐being, and 1 x 30‐minute consultation with a sleep physician | 1 x pre‐treatment OSA educational video | Usual care | 52 | ||
| 2 additional early reviews by sleep physician and frequent telephone calls by sleep nurses | Videotape and additional education session | Usual care | 12 | ||
| Intervention based on automatic processing of device data. If CPAP usage thresholds were met, a message was automatically sent to the patient providing encouragement to improve use or positively reinforcing successful adherence. | Education about pathophysiology of OSA, health‐related risks, impact on daytime vigilance, introduction to CPAP therapy | Usual care | 12 | ||
| 1 additional early review by sleep physician and 1 early telephone interview with sleep nurse | Educational video | Usual care | 52 | ||
| 4 additional home visits in the first 3 months by sleep practitioner for problem solving | Written information and detailed explanation by the prescriber, additional education during home visits | Written information and detailed explanation by the prescriber + usual care | 52 | ||
| Educational DVD on sleep apnoea and PSG review | 4 x 30‐60 minute sessions addressing cognitive perceptions of the OSA and CPAP, outcome expectancies with PAP treatment, and PAP treatment self‐efficacy, all domains of SCT | Usual care and an informational pamphlet about OSA, diagnosis and PAP prescription provided by sleep centre | 12 | ||
| 5 x standardised support sessions through telephone‐based counselling | Education addressing knowledge about OSA, disadvantage or obstacles to CPAP | Usual care | 16 | ||
| 2 x support calls with study investigator to promote the use of CPAP | 1 x educational session using an airway model along with a video and worksheet on OSA, and a report card to document OSA severity, CPAP setting and use and participant self‐evaluation | Usual care | 4 | ||
| Home video‐link sessions delivered by nurse, who guided correct CPAP use and provided problem solving | Nurse provided education on CPAP and OSA | Home video‐link sessions similar in form to intervention but directed activities in neutral health topics (vitamin intake) | 12 | ||
| Three nights of CPAP titration in the hospital | 4‐hout group education session, written information, video CD | 12 x 40 minute group PMR practice sessions over 12 weeks | Usual care | 12 | |
Abbreviations:
CPAP: continuous positive air pressure;DVD: Digital versatile disc; OSA: obstructive sleep apnoea; PAP: positive air pressure; PSG: polysomnography; SCT: social cognitive therapy
Data extraction and management
Data from published studies were extracted (KDA and TE) and checked (KDA, TE, LW) independently. Data were extracted first to an excel database and then to RevMan. After completion of RevMan data input from excel database, data in RevMan were checked for errors by comparison of RevMan tables to original published reports (LW). When data were unavailable from trial registries or conference abstracts, study authors were contacted (TE) to determine if data may be obtained directly. Information from authors was also sought to validate study design and methods for 'Risk of bias' and GRADE assessments. Manuscripts published in languages other than English were translated by volunteers co‐ordinated by Cochrane Airway's Assitant Managing Editor using a standardised form.
Categorisation of studies
In an attempt to limit the heterogeneity that arises when studies are combined into one overarching comparison, studies were classified into one of four comparisons based on the prevailing nature of the active intervention. Classifications were determined by detailed review of study authors' intervention descriptions, rather than the label applied to the intervention by study authors (e.g. in title or abstract). In most cases, the authors' designation was consistent with our judgement.
-
Educational versus control – Interventions imparting information about CPAP treatment or about OSA more generally, delivered through face‐to‐face didactic sessions, group educational sessions, written materials, video format, or any combination of these. Interventions that did not involve a component of active engagement from the participants other than reading written materials or observing a presentation or demonstration, even if the content derived from a behavioural change model, were classified as educational.
-
Supportive versus control ‐ Interventions in which participants were provided with additional clinical follow‐up (e.g. additional office‐ or home‐based visits or phone check‐ins by clinical staff), or with telemonitoring equipment that facilitated either self‐monitoring of CPAP usage or monitoring by clinical staff to prompt 'as needed' clinical follow‐up (e.g. a phone call made to participants when CPAP usage fell below a predetermined threshold) for the purpose of addressing barriers or difficulties with CPAP usage in a timely manner (e.g. telemedicine systems, digitised phone calls or audio messages, and home visits). Thus, supportive interventions either encouraged participants to provide feedback on their experience of CPAP treatment on an ongoing basis or employed automated assessment of transmitted CPAP data to trigger clinician review/intervention.
-
Behavioural versus control ‐ Interventions employing psychotherapeutic techniques deriving from behavioural, cognitive or related models of health behaviour change (e.g. specific models within this broad genre include motivational enhancement therapy (Miller 1994), Social Cognitive Theory (Bandura 1982; Bandura 1986), Transtheoretical/Stages of Change Model (Prochaska 1983), and cognitive behavioural therapy (CBT) (Beck 1975)). By definition, behavioural interventions under any of these related models involves at least a minimal degree of direct participant engagement or interaction (as opposed to purely educational, in which information is merely imparted to participants, even if the educational content or style of presentation was based on a behavioural model). Thus, behavioural interventions targeted a modifiable and measurable construct known or hypothesised to influence health beliefs about OSA and CPAP therapy and CPAP adherence behaviour. The objectives of such interventions might include enhancing behavioural action, motivation for change, self‐efficacy, outcome expectations and decisional balance in favour of CPAP.
-
Mixed versus control – Interventions that combined elements of two or more previously listed intervention‐types (e.g. educational video + telemedicine follow‐up), and therefore met criteria for belonging to more than one of the above‐described classes.
For studies that employed multiple intervention arms, the active interventions arms were separated and included in the appropriate comparison class depending exclusively on the content of that arm (i.e. each arm was independently classified as educational, supportive, behavioural or mixed).
Assessment of risk of bias in included studies
The review authors (KDA, LW, TE) assessed the risk of bias of included studies for the primary outcome, CPAP usage, according to the revised Cochrane 'Risk of bias 2' tool (Sterne 2019) Cochrane's recommended 'Risk of bias' tool for randomised trials as of 15 March 2019, which includes the following five domains:
-
randomisation processes;
-
deviations from intended interventions;
-
missing outcome data;
-
measurement of outcome;
-
selective outcome reporting.
Following detailed guidance provided in the revised Cochrane 'Risk of bias 2' full guidance document (Higgins 2019) and utilising the 'Risk of bias 2' excel tool (downloaded 04 April 2019), we graded each potential source of bias as 'low', 'some concerns', or 'high' and provided justification for item‐ and domain‐level judgements.
Given the nature of interventions, we did not anticipate blinding of participants in studies; however we attempted to determine if data collectors and analysts were blinded until the end of study data collection for 'Risk of bias' assessment.
Review authors (KDA, LW, TE) used the 'Risk of bias2' tool to perform additional 'Risk of bias' assessments as part of GRADE assessments. See Data collection and analysis section, 'Summary of findings' sub‐section for details of GRADE 'Risk of bias' assessments.
We used the 'Risk of bias1' tool to provide study‐level judgement for each new study under the following domains: random sequence generation; allocation concealment; blinding (performance and detection bias); incomplete outcome data; selective outcome reporting; other bias.Studies included in the previous review update were independently assessed by two review authors (DRW, IS) using the criteria outlined in the Cochrane Handbook for Systematic Reviews of Interventions (Higgins 2011), and included in the previous report. Studies new to this review update were independently assessed by two review authors (LW, TE) using the criteria outlined in the Cochrane Handbook for Systematic Reviews of Interventions (Higgins 2011), and added to the previous assessments. We graded each potential source of bias as high, low, or unclear and provided our rationale based on information from the study report and our judgement.
Measures of treatment effect
Effect measures
For dichotomous outcomes, an odds ratio (OR) and 95% confidence intervals (CIs) were calculated on the basis of the number of participants with an event versus the number of participants without an event. Mean differences (MDs) and 95% CIs were calculated for continuous variables in which all studies employed the same outcome measure or instrument (e.g. CPAP usage measured by device; sleepiness measured by ESS). Standardised mean differences (SMDs) were calculated for continuous variables in which studies employed different outcome measures or instruments (e.g. Functional Outcomes of Sleep Questionnaire (FOSQ) and Calgary Sleep apnoea Quality of Life Index (SAQLI) as metrics for quality of life).
Handling skewed data
Our protocol specified that when either medians or interquartile ranges were reported for treatment effects, this would serve as an indicator of skewed outcome distributions. In these cases, analysis based on means were not possible or appropriate. For outcomes where the lowest or highest possible value is known to exist (and not for values such as change from baseline measures), we planned to conduct a rough check for skew as follows: The observed mean would be subtracted from the highest possible (known) value (or the lowest possible (known) value subtracted from the observed mean), and this quantity would be divided by the standard deviation (SD). If the resulting ratio was < 2, this would suggest skew and a ratio < 1 would be considered strong evidence of a skewed distribution. In cases of strong evidence of skew, we would seek to collect appropriate data from the trialists. Appropriate data summaries and analytic strategies would depend on the situation and consultation with a knowledgeable statistician would be sought when necessary.
Unit of analysis issues
The unit of analysis was the patient.
Studies with multiple treatment groups
In most cases, intervention arms of multiple‐arm studies fell under distinct intervention classes (e.g. one arm was educational and another behavioural). In such cases (Aloia 2013; Chervin 1997; Hwang 2017; Wang 2012), the intervention arms were considered within their appropriate class and the full control arm was included in each class‐specific comparisons.
For multiple‐arm studies in which separate intervention arms fell under the same class (Meurice 2007; Pengo 2018), all relevant experimental arms were combined to conduct a single pair‐wise comparison to the full control arm (Higgins 2011).
Dealing with missing data
Where studies had missing data (e.g. means reported without SD), we contacted trial authors by email with a request for complete data. Data that were still missing after efforts to secure it were handled as follows. Data assessed to be missing at random are unlikely to bias results, so analysis proceeded with available data in those instances. For data determined to be not missing at random, an imputation strategy that accounts for uncertainty in the imputed values and results was employed. Per our protocol, sensitivity analyses were conducted if necessary to determine the potential impact of these assumptions.
Assessment of heterogeneity
We used the Inconsistency statistic (I2) to measure heterogeneity among the trials in each outcome analysis. For outcomes without evidence of heterogeneity (I2 = 0%) a fixed‐effect model was used. For outcomes with non‐zero measures of inconsistency (I2 > 0%), potential sources of heterogeneity were explored, including examination of small‐study effects and differences in magnitude or direction of effect. In outcomes for which heterogeneity was explained after examination, the nature of the explanations uncovered were used to make decisions regarding whether to proceed with the meta‐analysis of that outcome, the analysis model to be used, and whether further sensitivity analyses were warranted (Higgins 2011). In outcomes for which heterogeneity remained unexplained but meta‐analysis still warranted, we employed a random‐effects model.
Assessment of reporting biases
We assessed publication bias using funnel plot estimate when criteria to apply asymmetry tests were met (i.e. ≥10 studies in the outcome, heterogeneity I2≤ 50%, ratio of maximal to minimal variance across studies > 4 (Ioannidis 2017). When these criteria were not met, assessment of publication bias was based on guidelines provided in the GRADE handbook, Section 5.2.5 Publication Bias, and published online tutorials provided by Cochrane and GRADEpro online software (Schunemann 2013; GRADEpro 2015)
Data synthesis
See Measures of treatment effect section for description of the effect measures used by review authors to describe effect sizes in included studies and meta‐analyses. Results were combined across studies for meta‐analysis, subgroup and sensitivity analyses using RevMan software. Heterogeneity assessment was also conducted in RevMan for each comparison.
Subgroup analysis and investigation of heterogeneity
Subgroup comparisons planned a priori included the following.
-
Participants with prior CPAP exposure versus CPAP‐naive participants
-
Sex (male versus female)
-
Baseline AHI: mild (AHI ≥ 5 to < 15), moderate (AHI ≥ 15 to < 30), severe (AHI ≥ 30)
-
Baseline Epworth Sleepiness Scale Score (ESS: 0 to 10 versus 11 to 24)
Sensitivity analysis
For our main outcome of CPAP usage, we planned (a priori) sensitivity analyses to analyse studies in which CPAP usage in the control arm was < 4 hours per night and studies in which participants were unaware that their CPAP usage was being recorded.
'Summary of findings' tables
We included 'Summary of findings' tables for the four comparison categories (behavioural versus control, educational versus control, supportive versus control, mixed versus control). Information about the following key outcomes is presented in the tables where possible.
-
CPAP machine usage
-
Sleepiness, depressive and anxiety symptoms
-
Quality of life
-
Study withdrawal
-
Cost‐effectiveness
We additionally applied methods outlined by the GRADE working group (Schunemann 2013; GRADEpro 2015) to rate the confidence in estimates by considering the following domains.
-
Risk of bias
-
Imprecision
-
Inconsistency
-
Indirectness
-
Publication bias
-
Large effects
In downgrading risk of bias within GRADE assessments, we followed the guidance provided in the GRADE Handbook section on guidelines for authors of systematic reviews. When assessing a group of studies (e.g. within an intervention class), risk of bias was downgraded by one level if the combined weight of studies with high risk of bias was > 50%. It was downgraded by an additional level if, in addition, the remaining studies had 'Risk of bias' ratings that were predominantly ‘some concerns’.
Results
Description of studies
Results of the search
See Figure 1 for the study flow diagram. From the previous update of this review, we retained 25 studies (literature search dates: all years to January 2013). Five previously included studies were excluded in the present review for the following reasons: study analysed wrong outcomes (Schiefelbein 2005), not all inclusion criteria met (Taylor 2006; Wiese 2005), no full published report currently available (Epstein 2000), and study record was a duplicate entry for a published report (NCT01715194). Updated searches conducted to May 2019 yielded 16 new studies that met the review's inclusion criteria.
This review summarises the evidence from all 41 included studies. For descriptions of each study, refer to the Characteristics of included studies of this paper. Forty‐seven additional studies were judged to be potentially relevant but could not be assessed for inclusion until additional information is obtained; these were assigned to Studies awaiting classification. Six additional studies were identified as relevant but are currently ongoing (i.e. data and results are not yet publicly available) and were therefore assigned to Ongoing studies (Abreu 2013; Bakker 2017; Castronovo 2017; Crawford 2016; Kotzian 2018; Seixas 2018).
We excluded 101 studies from this review; please see Characteristics of excluded studies for reasons for exclusion.
Included studies
Study design
All studies were randomised, single‐blind or unblinded parallel‐group studies.
Participants
A total of 9005 participants were included and randomised in the studies (Table 1). Mean (SD) age across all studies was 54.3 (5.3). Mean of apnoea hypopnoea index (AHI), Epworth Sleepiness Scale (ESS) and body mass index (BMI) across studies reporting these values was 40.6 (9.9), 11.9 (2.4) and 33.1 (2.7), respectively. Among included studies reporting ESS at baseline, average ESS scores at baseline indicated that 75% of participants suffered from excessive daytime somnolence (ESS 11 to 24). Overall mean baseline AHI among included studies reporting AHI was 40.6 (median 40.7) events/hour, corresponding to severe obstructive sleep apnoea (OSA). Additionally, average AHI measurements at baseline indicated that 82% of participants had severe OSA (AHI > 30). Twenty‐seven studies included participants that were naive to continuous positive airway pressure (CPAP) therapy; 13 did not specify CPAP naivete, and one study included participants who were previously exposed to CPAP therapy. See Table 2 for a breakdown of mean participant characteristics by intervention class.
Included randomised controlled trials (RCTs) were conducted between 1997 and 2018 in 14 countries: Australia (3), Belgium (1), Brazil (1), Canada (1), China (2), Hong Kong (2), France (4), Greece (1), Italy (2), Portugal (2), Spain (1), Turkey (2), UK (2), Scotland (1), and USA (16).
Sample sizes ranged from 12 (Aloia 2001) to 3100 (Bouloukaki 2014). Most studies included in this review were small: 17 studies randomised < 100 participants, 13 randomised 100 to 199 participants, and 11 randomised > 200 participants.
Gender distribution ranged from 0% (Diaferia 2017; Parthasarathy 2013) to 75.3% (Scala 2012) female, with a mean of 28.42% female. Gender distribution was not reported in five studies, but it is likely that these studies were 100% male, both because gender was not reported and because many appear to have been conducted in Vetarans Affairs (VA) hospitals or by investigators with primary VA affiliation.
The majority of study authors did not report outcomes segregated by sex, baseline AHI or baseline ESS. Thus, while our protocol pre‐specified possible subgroup analyses on these bases, there were insufficient data available for such analyses. Additionally, the vast majority of studies recruited participants with newly‐diagnosed OSA or obstructive sleep apnoea syndrome (OSAS), and a small number either included participants with previous diagnosis or did not report whether participants with previous treatment were excluded. Thus, subgroup analysis on the basis of prior CPAP treatment was also not performed.
Interventions
All included studies were classified into one of four types: educational, supportive, behavioural, and mixed intervention. In cases where a study would qualify for classification in more than one class, the study was classified as mixed. For a quick overview of included studies (and their active components) by intervention class, refer to Table 4 (Educational); Table 5 (Supportive); Table 6 (Behavioural); Table 7 (Mixed). Among studies with multiple active intervention arms, each arm was classified separately and included in the respective class meta‐analysis. More detailed descriptions of our classification are provided in Data collection and analysis, Data extraction and management.
Educational interventions were delivered using a variety of techniques, including educational/situational videos (Basoglu 2011; Richards 2007), group education sessions (Soares‐Pires 2013), extended and personalised explanation of polysomnography (PSG) reports (Falcone 2014; Roecklein 2010; Sarac 2017), and positive/negative risk message framing (Pengo 2018).
Supportive interventions included telemonitoring under various formats and platforms (DeMolles 2004; Fox 2012; Hoet 2017; Mendelson 2014; Munafo 2016; Pepin 2019; Stepnowsky 2007; Turino 2017), in‐home tutorials and extended follow‐up visits (Hoy 1999), peer support (Parthasarathy 2013), phone support (Chervin 1997) and personalised web‐based support platforms (Stepnowsky 2013).
Various strategies were employed across included behavioural studies, including Motivational Enhancement Therapy (MET) aimed at resolving ambivalence towards treatment (Aloia 2001; Bakker 2016; Lai 2014; Olsen 2012; Sparrow 2010), a combination of various motivational strategies (Dantas 2015; Scala 2012), habit‐promoting audiotapes (Smith 2009), and myofunctional therapy (Diaferia 2017).
The majority of studies in the mixed class used a combination of educational materials (videos, brochures, tutorials) and support systems (telemedicine or extended follow‐up) in their active intervention (Bouloukaki 2014; Chen 2015; Hui 2000; Hwang 2017; Lewis 2006; Meurice 2007; Sedkaoui 2015; Shapiro 2017 ). Other studies incorporated behavioural with educational intervention components (Bartlett 2013; Wang 2012), behavioural and supportive (Smith 2006), or components from all three classes (Sawyer 2017).
Detailed information pertaining to control interventions can be found in Characteristics of included studies.
Study duration, number of intervention episodes, total contact time
Total study duration varied greatly: four weeks (Richards 2007; Shapiro 2017), six weeks (Pengo 2018), two months (Dantas 2015; Chervin 1997; DeMolles 2004; Stepnowsky 2007), three months (Aloia 2001; Diaferia 2017; Fox 2012; Hoet 2017; Hui 2000; Hwang 2017; Lai 2014; Munafo 2016; Parthasarathy 2013; Roecklein 2010; Sawyer 2017; Smith 2006; Smith 2009; Turino 2017; Wang 2012), four months (Mendelson 2014; Sedkaoui 2015; Stepnowsky 2013), six months (Bartlett 2013; Basoglu 2011; Hoy 1999; Pepin 2019; Sarac 2017; Soares‐Pires 2013), 12 months (Aloia 2013; Bakker 2016; Chen 2015; Falcone 2014; Lewis 2006; Meurice 2007; Olsen 2012; Scala 2012; Sparrow 2010), and 24 months (Bouloukaki 2014). The number of intervention episodes (i.e. number of discrete episodes of contact with study personnel) among studies specifying varied from one (Bartlett 2013; Basoglu 2011; Dantas 2015; Falcone 2014; Roecklein 2010; Soares‐Pires 2013) to 36 (Diaferia 2017). The total intervention contact time was not specified for many studies (DeMolles 2004; Fox 2012; Hoet 2017; Hoy 1999; Hwang 2017; Mendelson 2014; Meurice 2007; Munafo 2016; Parthasarathy 2013; Pepin 2019; Roecklein 2010; Scala 2012; Sparrow 2010; Stepnowsky 2007; Stepnowsky 2013; Turino 2017); among the 25 studies reporting such information, contact time varied from five (Falcone 2014) to 720 (Diaferia 2017) minutes. See Table 3 for summary descriptions of these intervention characteristics by intervention class.
Outcomes
The majority of studies reported hours of machine usage at one or more time points, with the exception of three studies (Basoglu 2011; Smith 2006; ) who reported only proportions of participants who were adherent (yes/no) based on authors' pre‐determined threshold definition. The majority of studies also reported ESS data and participant withdrawals. A subset of studies reported quality of life using a variety of measurement instruments (Bartlett 2013; Bouloukaki 2014; Chen 2015; DeMolles 2004; Hoy 1999; Hwang 2017; Lai 2014; Mendelson 2014; Meurice 2007; Parthasarathy 2013; Pepin 2019; Scala 2012; Stepnowsky 2007; Stepnowsky 2013), depressive or anxiety symptom ratings using a variety of measurement instruments (Bartlett 2013; Bouloukaki 2014; Chen 2015; Hoy 1999; Shapiro 2017; Stepnowsky 2007; Stepnowsky 2013; Wang 2012) oxygen desaturation index (ODI)/AHI measurements (Dantas 2015; Diaferia 2017; Fox 2012; Stepnowsky 2007), and cost‐effectiveness (Bouloukaki 2014; Turino 2017). Finally, Bouloukaki 2014 reported average hours of CPAP usage per night used, rather than the standard values of average hours used per night, overall. Calculations based on per night used would result in potentially significant upward bias in mean usage values relative to studies reporting average use per total intervention time period. However, since the same statistics are reported for intervention and control arms, the mean differences may not be biased. Bouloukaki 2014 data were included in CPAP usage meta‐analysis despite this discrepancy.
Endpoints reported
Due to the tremendous variability and difficulty in interpreting meta‐analytic results for temporally‐disparate endpoints, we elected to use an endpoint of three months (or the measured endpoint closest to three months), which was both the modal endpoint across studies and the most clinically‐relevant among those commonly reported.
Outcomes: exclusion of specific studies from selected meta‐analyses
Sparrow 2010 met our inclusion criteria, however, we were not able to include this study in our primary CPAP usage meta‐analysis because trialists presented their results as a mean difference (MD) and 95% confidence intervals (CIs) derived from a regression of log‐transformed CPAP usage data, and could therefore not be combined with data from the other studies (note: analysis by generic inverse variance (GIV) was also not suitable). Nonetheless, the direction of effect supports the general findings of Analysis 3.1 (CPAP usage 2.40 hours/night in intervention arm (N = 110) and CPAP usage 1.48 hours/night (N = 112) in the control arm). In Sparrow 2010, data were suitable for inclusion in meta‐analyses of other outcomes (N deemed adherent, withdrawal).
Lewis 2006 met our inclusion criteria and available data are shown in some outcome tables (e.g. Analysis 6.10). However, no SDs were available for reported mean CPAP usage and review authors were unable to obtain these data from the trial authors, so MDs could not be calculated. Therefore, this study was retained in the analysis table but SD values are entered as zero. Thus, it is excluded from the meta‐analysis of this outcome. Lewis 2006 data were suitable for inclusion in withdrawal meta‐analysis.
Scala 2012 met our inclusion criteria, but CPAP usage data were not included in our analysis tables, or in our meta‐analysis because the data provided in the published report contained discrepancies that could not be resolved (i.e. reported mean, SD and P values were incompatible and review authors were unable to determine which values were incorrect). Scala 2012 was included in meta‐analyses for other outcomes (withdrawal, ESS and quality of life (QoL)).
Soares‐Pires 2013 was excluded from CPAP usage meta‐analysis because trial authors reported medians only. Review authors were unable to obtain information from authors necessary to implement planned skewed data handling procedures. Therefore, this study was excluded from our analysis tables and the meta‐analysis of this outcome. Soares‐Pires 2013 was included in meta‐analyses for other outcomes (N deemed adherent, withdrawal).
Excluded studies
We excluded 101 studies from this review. Reasons for their failure to meet review entry criteria are provided in Characteristics of excluded studies.
Risk of bias in included studies
It should be noted that full 'Risk of bias' assessments (evaluating each 'Risk of bias 2' domain using 'Risk of bias 2' tool) were performed for primary outcome (CPAP device usage, hours/night) only. Overall 'Risk of bias' assessments were additionally conducted for other outcomes as part of the GRADE assessment process, but the GRADE 'Risk of bias' assessment procedures were often more limited than that involved in the application of the full 'Risk of bias 2' tool, as the GRADE tool is outcome‐ (and not study‐) specific. Therefore, our procedures for GRADE risk of bias varied by outcome, as follows.
GRADE 'Risk of bias' judgements for CPAP usage and N deemed adherent were based on our 'Risk of bias 2' assessment judgements.
GRADE 'Risk of bias' ratings for all subjective, non‐adherence outcomes (i.e. ESS, QoL, depressive symptoms, anxiety symptoms) were judged to be 'serious' or 'very serious' because all, or nearly all, included studies had no masking (of participants or investigators) and such subjective/observational measures would be subject to measurement bias without blinding. Therefore, for these outcomes, domain 4 would be rated as 'high' risk of bias for all studies and result in a GRADE 'Risk of bias' rating of 'high' without the need to evaluate the other domains.
For the remaining outcomes (AHI, study withdrawal, cost‐effectiveness) GRADE 'Risk of bias' ratings were made based on examination of all 'Risk of bias 2' domains unless a 'high' rating was evident based on a preponderance (by weight) of 'high' ratings in study‐level 'Risk of bias 2' domains 1 or 2. (Because 'Risk of bias 2' domains 1 and 2 are study‐ and not outcome‐dependent, judgements of risk for domains 1 and 2 would be the same for all outcomes for a given study). The only outcome for which a high rating was not evident based upon a preponderance of high ratings in 'Risk of bias 2' domains 1 or 2 was 'study withdrawals' within supportive, behavioural and mixed classes. Thus, all 'Risk of bias 2' domains were evaluated for study withdrawals in these classes. Based on the definition of 'withdrawals' employed in our review (see Effects of interventions: Secondary outcomes, Withdrawals, below), 'Risk of bias 2' domain 3 (missing outcome data), domain 4 (bias in outcome measurement), and domain 5 (selective reporting) yielded the same judgement as for our primary outcome, CPAP usage. Because withdrawal was based on the absence of CPAP usage data, the proportions of participants withdrawing from the study would be the same as the proportion with missing CPAP usage data. Similarly, because our definition of withdrawal was based on objective data acquired from the CPAP device (i.e. either a zero usage value transmitted wirelessly or a device in the possession of study personnel and clearly not being used by the participant), judgement regarding the potential for measurement bias or selective reporting bias was the same as that rendered for the CPAP usage outcome in this domain.
Risk of bias 2: CPAP device usage
Risk of bias in included studies
An overview of our 'Risk of bias' judgements for our primary outcome for included studies (randomisation processes, deviations from intended interventions, missing outcome data, measurement of outcome, selective outcome reporting) is provided in Figure 2. The basis for each of these judgements is given in Characteristics of included studies. All of the studies were assessed according to assignment to intervention (the 'intention‐to‐treat' effect) using the 'Risk of bias 2' tool and according to the risk posed on measuring our primary outcome of hourly CPAP device usage. Half of the studies presented as having a high overall risk of bias.

'Risk of bias' summary: review authors' judgements about each risk of bias item for each included study.
Randomisation processes
The majority of studies presented as having "some concerns" regarding risk of bias arising from randomisation procedures; this was mostly due to inadequate descriptions of allocation sequence generation and allocation sequence concealment. Despite this, only a handful of studies presented significant baseline differences in key demographic characteristics (age, sex, BMI, and AHI), suggesting a potential problem with the study's randomisation procedures (Aloia 2001; Hoet 2017; Hui 2000; Meurice 2007; Sarac 2017). Six studies present low risk of bias in this domain (Bartlett 2013; Lai 2014; Mendelson 2014; Olsen 2012; Richards 2007; Sawyer 2017).
Deviations from intended interventions
Two studies presented "high" risk of bias in this domain (Chervin 1997; Diaferia 2017) due to the combination of the following factors: participants and trialists were aware of group assignment, a 'per‐protocol' analysis was employed (participants were analysed according to the treatment they received instead of the treatment to which they were randomised). Three studies presented as having "some concerns" regarding risk of bias in this domain (Chen 2015; Sarac 2017; Scala 2012). This was either due to inadequate information regarding the intervention group to which study "drop‐outs" belonged (i.e. only overall withdrawals were reported) (Chen 2015; Scala 2012) or potential deviations from the study protocol (Sarac 2017 ‐ phone call reminders were given to participants who did not show up for follow‐up appointments, regardless of group assignment).
Missing outcome data
Thirteen studies presented "high" risk of bias in this domain (Chervin 1997; Diaferia 2017; Falcone 2014; Hoet 2017; Lewis 2006; Mendelson 2014; Munafo 2016; Pengo 2018; Pepin 2019; Roecklein 2010; Soares‐Pires 2013; Stepnowsky 2007; Wang 2012), largely due to data being unavailable for ≥10% of participants at the time point analysed (Higgins 2011). Risk increased when considerable differences in proportions of missing outcome data between intervention and control groups were detected, indicating that loss to follow‐up was likely to be related to participant health status.
Measurement of the outcome
The majority of studies presented "low" risk of bias in this domain. Signalling questions addressed appropriateness of outcome measurement, differences in measurements between study groups, and whether outcome assessors were aware of group assignment. All of the studies included in this review measured hourly CPAP machine usage through an internalised digital counter or data microchip, thereby limiting the risk that could arise in this domain. Eleven studies did show "some concerns" (Aloia 2001; Bouloukaki 2014; DeMolles 2004; Falcone 2014; Hoet 2017; Meurice 2007; Olsen 2012; Parthasarathy 2013; Sawyer 2017; Sedkaoui 2015; Soares‐Pires 2013) as the review authors were unable to confirm with trialists if the distribution of CPAP devices (i.e. makes, models) differed significantly between groups.
Selective outcome reporting
Twenty‐three studies presented as having "some concerns" regarding risk of bias arising from selection of reported outcome. This was largely due to limited availability of pre‐specified study protocols or analysis plans, preventing review authors from comparing with published manuscripts to confirm that outcomes and outcome end points were determined prior to data analysis. Moreover, seven studies presented a "high" risk in this domain as a result of: using adherence thresholds or end points that are not commonly reported in literature, e.g. ≥ 3 hours per night instead of ≥ 4 hours per night, reporting at four months instead of three months (Basoglu 2011; Sedkaoui 2015), differences between intended end points in the 'Methods and Results' section of paper (Chen 2015; DeMolles 2004), modification of end points from that originally‐reported in study's trial registry archive (Lai 2014), reporting of adherence only in graphical format (NCT03345524), or reporting mean usage per effective days instead of per total days resulting in an upward bias of estimates (Soares‐Pires 2013; Bouloukaki 2014). See 'Risk of bias' tables for further details on our judgement rationale.
Risk of bias 1: study‐level 'Risk of bias' assessments
The review authors assessed the risk of bias of included studies using the risk of bias tool (Higgins 2011) (for an overall snapshot of our judgements, see Figure 2).
Allocation
The majority of studies (59%) were assessed as having low risk of bias for random sequence generation. Only one study (Sarac 2017) was found to have high risk of bias because, according to author's report, "participants were randomly assigned in order of appearance (random number table...) with exception for patients scheduled for weekend treatment, who were included in the [standard support] group." A judgement of 'Unclear' risk of bias under this domain was generally rendered because authors provided no or insufficient information regarding the random component used in sequence generation or other information regarding how randomisation was achieved.
The vast majority of studies were assessed as having unclear (68%) or low (29%) risk of bias for allocation concealment. One study (Sarac 2017) was found to have high risk of bias because the report permitted confirmation that allocation sequence was not concealed. Those determined to have unclear risk of bias under this domain were most often because the trialists provided no, or insufficient, information to permit assessment of allocation concealment method.
Blinding
The vast majority of studies were assessed as having high (56%) or unclear (29%) risk of bias in this domain because the majority of studies had at least one subjective outcome. Given the nature of the intervention, it is unlikely that blinding of participants is achievable and the majority of studies did not attempt to do so. Six studies (Hoet 2017; Pengo 2018; Sarac 2017; Sawyer 2017; Sedkaoui 2015; Soares‐Pires 2013) were assessed as having low risk of bias in this domain because these studies had only objectively‐measured outcomes, so a lack of blinding would unlikely affect those outcomes.
Incomplete outcome data
For this domain, 39% of studies were assessed as having high risk of bias, primarily due to either a very substantial proportion (> 10%) of participants with missing data and a substantial imbalance in missing across outcome classes. A judgement of 'Unclear' risk of bias (29%) in this domain was most often due to the absence of sufficient information to determine proportion of withdrawals or to compare class‐specific withdrawal rates. Data were available for all or nearly all randomised participants in 32% of studies, warranting a judgement of low risk of bias in this domain.
Selective reporting
For this domain, 63% of studies had 'Unclear' risk of bias primarily because no protocol or ClinicalTrials.gov entry was available to determine if analysis plan was finalised before unblinded outcome data were available for analysis. Those assessed to have 'low' risk of bias (27%) in this domain had a protocol, ClinicalTrials.gov entry or early abstract that permitted adequate verification that the analysis plan was finalised prior to analysis of unblinded data. For those studies judged to be at 'high' risk of bias, review authors found evidence that the outcomes reported were inconsistent with the methods section of the published report, were changed from those originally planned without clear rationale or were atypical (e.g. endpoint measurement, threshold cut‐off) without clear rationale, suggesting that the reported outcome may have been selected after analyses performed.
Other potential sources of bias
Each study was assessed for other potential risks of bias including deviations from intended interventions and baseline imbalances in important demographic or clinical characteristics (age, sex, BMI, AHI) across outcome classes. Reasons for a judgement of 'high' risk of Other bias (7%) were: failure to report selected baseline gender (Aloia 2013; Meurice 2007) and BMI data (Aloia 2013), and substantial baseline differences in gender distribution that was large enough to result in biased effect estimation (Hoet 2017). Studies for which a judgement of 'Unclear' was made were those that did not report baseline data or did not report a statistical comparison for important baseline characteristics across outcome classes.
Effects of interventions
See: Summary of findings for the main comparison Educational intervention versus control; Summary of findings 2 Supportive intervention versus control; Summary of findings 3 Behavioural intervention versus control; Summary of findings 4 Mixed (BEH/EDU/SUP) intervention versus control
Please refer to the 'Summary of findings' tables for each comparison group.
-
summary of findings Table for the main comparison Educational support for adults with obstructive sleep apnoea who are using CPAP
-
summary of findings Table 2 Increased support and encouragement for adults with obstructive sleep apnoea
-
summary of findings Table 3 Behavioral therapy and encouragement for adults with obstructive sleep apnoea
-
summary of findings Table 4 Mixed interventions for adults with obstructive sleep apnoea
Several post hoc sensitivity analyses were also conducted (Table 8; Table 9; Table 10; Table 11; Table 12), and are described in Quality of the evidence .
| Class | Full class effect estimate, MD (95% CI) | Sensitivity: excluding high RoB studies (MD, 95%CI) |
| Behavioural | 1.31 (0.95 to 1.66) I2 = 0% | 1.05 (0.57 to 1.53)1 I2 = 0% |
| Educational | 0.85 (0.32 to 1.39) I2 = 68% | 0.98 (0.07 to 1.89)2 I2 = 86% |
| Supportive | 0.70 (0.36 to 1.05) I2 = 42% | 0.75 (0.42 to 1.09)3 I2 = 34% |
| Mixed | 0.82 (0.20 to 1.43) I2 = 92% | NA |
1. Included in sensitivity analysis: Aloia 2013; Bakker 2016; Dantas 2015; Olsen 2012
2. Included in sensitivity analysis: Aloia 2013; Basoglu 2011; Hwang 2017; Richards 2007
3. Included in sensitivity analysis: Fox 2012; Hoy 1999; Hwang 2017; Stepnowsky 2013; Turino 2017
| Class | Full class effect estimate, MD (95%CI) | Intervention duration, MD (95%CI) | Contact episodes: 1 vs. > 1, MD (95%CI) | Total contact time: > vs. ≤ 60 minutes, MD (95%CI) |
| Behavioral | 1.31 (0.95 to1.66) I2 = 0% | > 4 weeks1: 1.21 (0.60 to 1.82) I2 = 0% ≤ 4 weeks2: 1.38 (0.80 to 1.95) I2 = 38% Test for subgroup differences: Chi² = 0.15, df = 1 (P = 0.70), I² = 0% | > 1 episode3: 1.35 (0.94 to 1.77) I2 = 9% 1 episode4: 1.10 (0.26 to1.94) I2 = 0% Test for subgroup differences: Chi² = 0.28, df = 1 (P = 0.60), I² = 0% | > 60 minutes5: 1.15 (0.71 to 1.60); I2 = 0% ≤ 60 minutes6: 1.56 (0.68 to 2.44); I2 = 57% Test for subgroup differences: Chi² = 0.64, df = 1 (P = 0.42), I² = 0% |
| Educational | 0.85 (0.32 to 1.39) I2 = 68% | > 4 weeks7: 0.33 (‐0.10 to 0.77); I2 = 0% ≤ 4 weeks8: 1.20 (0.39 to2.01); 12=75% Test for subgroup differences: Chi² = 3.36, df = 1 (P = 0.07), I² = 70.2% | > 1 episode9: 1.20 (0.41 to2.00); I2 = 70% 1 episode10: 0.40 (‐0.06 to 0.86); I2 = 0% Test for subgroup differences: Chi² = 2.96, df = 1 (P = 0.09), I² = 66.2% | > 60 minutes11: 1.46 (0.22 to 2.71); I2 = 82% ≤ 60 minutes12: 0.61 (0.00 to 1.22); I2 = 37% Test for subgroup differences: Chi² = 1.47, df = 1 (P = 0.23), I² = 31.9% |
| Supportive | 0.70 (0.36 to 1.05) I2 = 42% | > 12 weeks13: 0.49 (‐0.53 to 1.51); I2 = 77% ≤ 12 weeks14: 0.72 (0.43 to 1.01); I2 = 0% Test for subgroup differences: Chi² = 0.17, df = 1 (P = 0.68), I² = 0% | NA | NA |
| Mixed | 0.82 (0.20 to 1.43) I2 = 92% | > 4 weeks15: 1.22 (0.60 to 1.83); I2 = 91% ≤ 4 weeks16: ‐0.31 (‐0.83 to 0.21); I2 = 0% Test for subgroup differences: Chi² = 13.79, df = 1 (P = 0.0002), I² = 92.7% | > 1 episode17: 0.98 (0.32 to 1.62); I2 = 92% 1 episode18: ‐0.60 (‐1.33 to 0.13); I2 = 93% Test for subgroup differences: Chi² = 9.94, df = 1 (P = 0.002), I² = 89.9% | > 60 minutes19: 1.45 (0.73 to 2.16); I2 = 91% ≤ 60 minutes20: ‐0.15 (‐0.56 to 0.27); I2 = 0% Test for subgroup differences: Chi² = 14.14, df = 1 (P = 0.0002), I² = 92.9% |
1. Bakker 2016; Diaferia 2017; Wang 2012
2. Aloia 2001; Aloia 2013; Dantas 2015; Lai 2014; Olsen 2012
3. Aloia 2001; Aloia 2013; Bakker 2016; Diaferia 2017; Lai 2014; Olsen 2012; Wang 2012
4. Dantas 2015
5. Aloia 2001; Aloia 2013; Bakker 2016; Diaferia 2017; Olsen 2012; Wang 2012
6. Dantas 2015; Lai 2014
7. Hwang 2017; Pengo 2018; Wang 2012
8. Aloia 2013; Basoglu 2011; Chervin 1997; Falcone 2014; Richards 2007; Roecklein 2010; Sarac 2017
9. Aloia 2013; Chervin 1997; Richards 2007; Sarac 2017; Pengo 2018; Wang 2012
10. Basoglu 2011; Falcone 2014; Roecklein 2010
11. Aloia 2013; Richards 2007; Wang 2012
12. Basoglu 2011; Chervin 1997; Falcone 2014; Sarac 2017
13. Hoy 1999; Mendelson 2014; Parthasarathy 2013; Pepin 2019
14. Chervin 1997; DeMolles 2004; Fox 2012; Hoet 2017; Hwang 2017; Munafo 2016; Stepnowsky 2007; Stepnowsky 2013; Turino 2017
15. Bouloukaki 2014; Chen 2015; Hui 2000; Hwang 2017; Meurice 2007; Sedkaoui 2015; Wang 2012
16. Bartlett 2013; Sawyer 2017; Shapiro 2017
17. Bouloukaki 2014; Chen 2015; Hui 2000; Meurice 2007; Sawyer 2017; Sedkaoui 2015; Shapiro 2017; Wang 2012
18. Bartlett 2013
19. Bouloukaki 2014; Chen 2015; Sawyer 2017; Sedkaoui 2015; Wang 2012
| Class | All supportive interventions, MD (95%CI) | Intervention involved human support, MD (95%CI) | Intervention involved scheduled human support, MD (95%CI) |
| Supportive | 0.70 (0.35 to 1.05) I2 = 42% | Any human support1: 0.84 (0.52 to 1.17) I2 = 10% Automated support only2: 0.26 (‐0.51 to 1.04) I2 = 64% Test for subgroup differences: Chi² = 1.85, df = 1 (P = 0.17), I² = 46.0% | Pre‐scheduled human support3: 1.43 (0.61 to 2.24) I2 = 0% No Scheduled human support4: 0.58 (0.33 to 0.83) I2 = 45% Test for subgroup differences: Chi² = 3.82, df = 1 (P = 0.05), I² = 73.8% |
1. Chervin 1997; Fox 2012; Hoet 2017; Hoy 1999; Parthasarathy 2013; Pepin 2019; Stepnowsky 2007; Stepnowsky 2013; Turino 2017
2. DeMolles 2004; Hwang 2017; Mendelson 2014; Munafo 2016
3. Chervin 1997; Hoy 1999; Parthasarathy 2013
4. DeMolles 2004; Fox 2012; Hoet 2017; Hwang 2017; Mendelson 2014; Munafo 2016; Pepin 2019; Stepnowsky 2007; Stepnowsky 2013; Turino 2017
| Class | Updated Review (Askland 2019) Classification Decision, MD (95%CI) | Sensitivity: Original (Wozniak 2014) Classification Decision, MD (95%CI) |
| Behavioral | 1.31 (0.95 to1.66) I2 = 0% | 1.47 (1.12 to 1.83) I2 = 48% |
| Educational | 0.85 (0.32 to 1.39) I2 = 68% | 0.48 (0.21 to 0.76) I2 = 0% |
| Supportive | 0.70 (0.36 to 1.05) I2 = 42% | 0.58 (0.36 to 0.81) I2 = 45% |
| Class | Full Class Effect Estimates | Exclude endpoints NOT 3 months |
| Behavioral | 1.31 (0.95 to 1.66) I2 = 0% | 1.38 (0.97 to 1.79) |
| Educational | 0.85 (0.32 to 1.39) I2 = 68% | 0.63 (0.26 to 1.00) |
| Supportive | 0.70 (0.36 to 1.05) I2 = 42% | 0.67 (0.29 to 1.04) |
| Mixed | 0.82 (0.20 to 1.43) I2 = 92% | 1.09 (0.21 to 1.97) |
Full class effect estimates are those derived in our primary analyses, which includes the data from each included study closest to our primary 3‐month endpoint. That is, if no 3‐month endpoint data were available for a study, the endpoint closest to (and later than) 3 months was used. For example if a study reported data at 2 months and 4 months post‐intervention, the 4‐month endpoint data were used. If only a single endpoint was reported by authors (e.g. Bouloukaki 2014 reported only 2‐year endpoint), data for that endpoint was used.
Primary outcome: CPAP usage
Mean hours/night
Educational interventions
Very low‐certainty evidence showed that educational interventions increased average hours of CPAP use (mean difference (MD) 0.85, 95% confidence interval (CI) 0.32 to 1.39; participants = 1128; studies = 10; I2 = 68%), Analysis 1.1; Figure 3). Substantial statistical heterogeneity was detected (I2 = 68%, P = 0.002) due to poor overlap of estimates and CIs, most notably, the increased effects presented by two studies (Falcone 2014; Richards 2007), leading to a downgrading of certainty by one level. Moreover, the standard deviations (SDs) reported by Falcone 2014 were considerably smaller than the other studies in this comparison (and the reported SDs were inconsistent with reported P values for the comparison), suggesting the possibility of spurious confidence in the estimate. Therefore, Falcone 2014 SDs were therefore entered as zero values, so the Falcone 2014 data did not contribute to overall meta‐analysis and does not appear in the forest plot. However heterogeneity remained significant (resulting in downgrading in this domain). Further downgrading by two levels was also applied in the 'Risk of bias' domain, as the combined weight of studies with "high" risk was 70%, and was due to bias in randomisation procedures (Sarac 2017), missing outcome data (Chervin 1997; Falcone 2014; Pengo 2018; Roecklein 2010; Wang 2012), deviations from intended interventions (Chervin 1997), and selective reporting (Basoglu 2011). Therefore, the overall certainty of the evidence for this outcome was downgraded by three levels, yielding a 'very‐low' rating.

Forest plot of comparison: 1 Educational intervention versus control on primary outcome: CPAP Device Usage (hours/night).
A sensitivity analysis was performed, where studies with average usage in the control group > 4 hours/night were excluded (Basoglu 2011; Chervin 1997; Falcone 2014; Sarac 2017). Very low‐certainty evidence demonstrated that educational interventions increased usage (MD 0.85, 95% CI 0.06 to 1.64), based on 6 studies with 698 participants. Heterogeneity in this sensitivity analysis remained high (I2 = 76%), due to the inclusion of Richards 2007's larger effect estimate, leading to poor overlap of CIs. Certainty of evidence was further downgraded by two levels as the combined weight of studies high risk of bias (3/6 studies) was 44.8%, with the remaining studies having some risk concerns.Therefore, overall certainty for this outcome was reduced by three levels, yielding a 'very low‐certainty' rating.
Supportive interventions
Moderate‐certainty evidence showed that supportive interventions increased average hours of CPAP use (MD 0.70, 95% CI 0.36 to 1.05; participants = 1426; studies = 13; I2 = 42%) (Analysis 2.1; Figure 4). Moderate heterogeneity (I2 = 42%, P = 0.05) was accounted for by the opposite direction of effect observed in Mendelson 2014, where the mean difference favoured the control group. In studies that had "high" overall risk of bias, risk derived from randomisation procedures (Hoet 2017), missing outcome data (Chervin 1997; Hoet 2017; Mendelson 2014; Munafo 2016; Pepin 2019; Stepnowsky 2007), protocol deviation (Chervin 1997), selective outcome reporting (DeMolles 2004; Parthasarathy 2013), and had a combined analysis weight of 51.2%, warranting downgrading by one level in this domain. Therefore, the overall certainty of the evidence was downgraded by one level, yielding a 'moderate' rating.

Forest plot of comparison: 2 Supportive intervention versus control on primary outcome: CPAP Device Usage (hours/night).
A sensitivity analysis Analysis 2.2 was conducted to determine the influence of studies that had an average usage > 4 hours per night in the control group. High‐certainty evidence demonstrated that supportive intervention increased average hours of CPAP use (MD 0.91, 95% CI 0.57 to 1.25; participants = 735; studies = 7; I2 = 0%).
An additional post‐hoc sensitivity analysis was conducted (Analysis 2.9), excluding the single study with opposite direction of effect (Mendelson 2014). In their conclusions, trialists indicated that their findings in favour of the control arm may have derived specifically from the "additional burden associated with the self‐management of BP and CPAP by patients randomised to this group," a study component and outcome not germane to our review. Exclusion of this study resulted in a slight increase in the effect estimate (and narrower CIs) as well as the elimination of heterogeneity (MD 0.74, 95% CI 0.49 to 0.98; participants = 1319; studies = 12; I2 = 0%).
Behavioural interventions
High‐certainty evidence showed that behavioural interventions increased average hours of CPAP use (MD 1.31, 95% CI 0.95 to 1.66; participants = 578; studies = 8; I2 = 0%) (Analysis 3.1; Figure 5). No heterogeneity was detected for this outcome indicating that magnitude and direction of effect estimates were similar. Certainty of this effect estimate for this outcome (as per GRADE assessment procedures) was judged to be high.
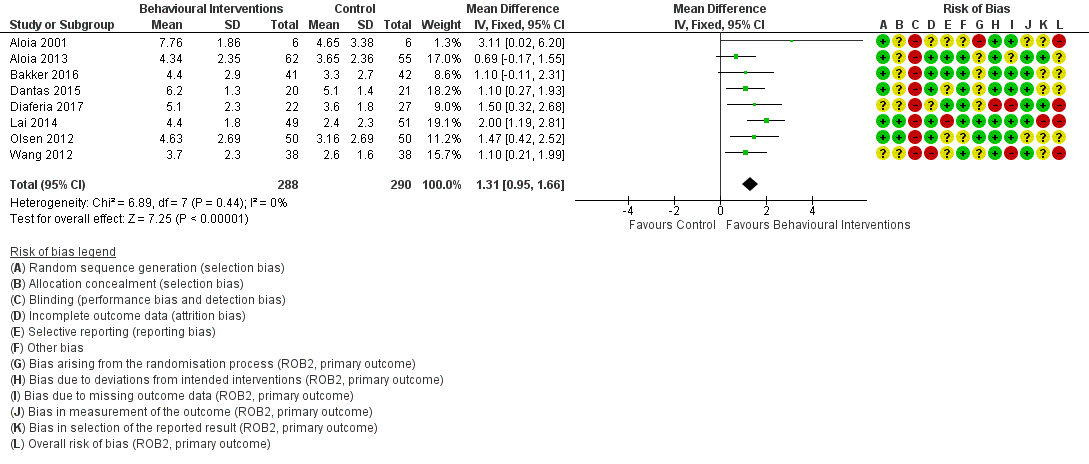
Forest plot of comparison: 3 Behavioural intervention versus control on primary outcome: CPAP Device Usage (hours/night).
A pre‐defined sensitivity analysis Analysis 3.2 was conducted to exclude studies where average CPAP adherence in the control group was more than four hours per night (excluded Aloia 2001; Dantas 2015). Moderate‐certainty evidence showed that behavioural interventions increased average hours of CPAP use (MD 1.32, 95% CI 0.93 to 1.72; participants = 525; studies = 6; I2 = 6%). Confidence in this effect estimate was downgraded by one level due to high risk of bias in studies accounting for 54.4% of estimate weight.
Mixed interventions
Very low‐certainty evidence showed that mixed interventions increased average hours of CPAP used (MD 0.82, 95% CI 0.20 to 1.43; participants = 4509; studies = 11; I2 = 92%) (Analysis 4.1; Figure 6). Substantial statistical heterogeneity was due to variability in direction of effect (Bartlett 2013 and Shapiro 2017 favoured the control group), variability in magnitude of effects, and poor overlap of CIs, warranting a downgrading of certainty by two levels. Studies in this comparison presented as having a "high" risk of bias, deriving from risk in randomisation procedures (Hui 2000; Meurice 2007), missing outcome data (Wang 2012), and selective reporting (Chen 2015; Sedkaoui 2015). The combined weight of these studies was 50.2%, warranting further downgrading of certainty in this domain.Therefore, the overall certainty of the evidence for this outcome was downgraded by three levels, yielding a 'very‐low ' rating.

Forest plot of comparison: 4 Mixed (SUP/EDU/BEH) intervention versus control on primary outcome: CPAP Device Usage (hours/night).
When excluding studies where average usage was greater than four hours per night in the control group (Bartlett 2013; Bouloukaki 2014; Chen 2015; Hui 2000; Meurice 2007; Sawyer 2017; Sedkaoui 2015; Shapiro 2017), the two remaining mixed interventions (Hwang 2017; Wang 2012) increased hours of use (MD 1.77, 95% CI 0.21 to 3.34; participants = 343; studies = 2; I2 = 90%), however this evidence was also very low in certainty due high heterogeneity (I2 = 90%, P = 0.002), warranting downgrading by two levels, as well as high risk associated with missing outcome data (Wang 2012, study weight = 48.3%), warranting downgrading by a further level.
Secondary outcomes
Data were not available for all of the secondary outcomes specified in the protocol. Those with available data are described below. For some secondary outcomes, some studies reported change‐from‐baseline measurements, whereas other studies reported endpoint values only. In these cases, values were combined in a single meta‐analysis using MD as the effect measure. In cases where a study reported both change‐from‐baseline with SD and endpoint values for a given outcome, only change‐from‐baseline data were used in the meta‐analysis. If an outcome was evaluated using different measures across studies, and, therefore, required use of standardised mean difference (SMD) as the effect measure, separate meta‐analyses were performed for studies reporting change‐from‐baseline and for those reporting only endpoint comparisons.
Number of participants deemed adherent (average CPAP usage ≥ 4 hours/night)
Very low‐certainty evidence from 7 studies and 1019 participants (summary of findings Table for the main comparison; Analysis 1.3) showed that educational interventions increased the number of people deemed adherent when compared to control (odds ratio (OR) 2.58, 95% CI 1.50 to 4.44, P = 0.003), translating to an absolute risk increase from 558 to 765 (95% CI: 654 to 849) people per 1000. Certainty of evidence in this comparison was downgraded by two levels due to high risk of bias in seven studies (Basoglu 2011; Falcone 2014; Sarac 2017; Soares‐Pires 2013; Wang 2012), deriving from randomisation procedures, missing outcome data and selective outcome reporting with a combined analysis weight of 68.1%. Further downgrading by one level was performed due detection of considerable statistical heterogeneity (I2= 76%). Therefore, the overall certainty of the evidence for this outcome was downgraded by three levels, yielding a 'very low ' rating.
Low‐certainty evidence from 2 studies and 376 participants (summary of findings Table 2; Analysis 2.3) showed that supportive interventions increased the number of people deemed adherent when compared to control (OR 1.68, 95% CI 1.08 to 2.60, P = 0.02), translating to an absolute risk increased from 601 to 717 (95% CI: 619 to 797) people per 1000. Evidence in this comparison was downgraded by one level due to the low sample size, as defined by GRADE's recommendations on optimal information size (OIS) (Schunemann 2013). Evidence was further downgraded by one level due to high risk of bias from one study (24.8% weight) and some risk concerns in the other study. Therefore, the overall certainty of the evidence was downgraded by two levels, yielding a 'low ' rating.
High‐certainty evidence from 6 studies and 549 participants (summary of findings Table 3; Analysis 3.3) indicated that behavioural interventions increased the number of people deemed adherent (based on author‐defined nightly CPAP use threshold) when compared to control (OR 1.70, 95% CI 1.20 to 2.41, P = 0.003). Based on average control group risk, this translates to an absolute risk increase from 371 to 501 (95% CI: 414 to 587) people per 1000.
Very low‐certainty evidence from 9 studies and 4015 participants (summary of findings Table 4; Analysis 4.3) indicated that mixed interventions increased the number of people deemed adherent when compared to control (OR 1.71, 95% CI 1.08 to 2.72, P < 0.001), translating to an absolute risk increased from 741 to 830 (95% CI: 755‐886) people per 1000. Evidence in this comparison was downgraded by one level as the combined weight of studies with high risk was 51.3%, and was downgraded another two levels level due to substantial heterogeneity (I2 = 79%, P < 0.001). Therefore, the overall certainty of the evidence was downgraded by three levels, yielding a 'very‐low' rating.
Withdrawals
One of our pre‐specified secondary outcomes was "study withdrawals." Generally, the primary objective in reporting study withdrawals, and conducting meta‐analysis on this outcome, is to assess the potential impact of attrition bias on reported effect estimates. Studies with lower attrition (and attrition bias) should produce more valid effect estimates. Across included studies in our review, trialists varied substantially in: a) whether study withdrawal was assessed/reported as an outcome, b) if "withdrawal" was explicitly defined (and the term applied by trialists – e.g. "drop‐outs," "withdrawal," "lost‐to‐follow‐up," "unable to make contact," etc....), and c) among those providing an explicit definition, how withdrawal (or other comparable term) was defined. Due to this substantial variability, we concluded that no single author‐employed term or definition would have permitted consistent accounting across studies. We therefore decided to employ a definition that permitted a common, objective measure that is not dependent on author definition and is less dependent on author reporting decisions: we counted as a withdrawal any participant who, subsequent to randomisation withdrew from the study, such that their actual CPAP device usage could not be determined. Participants who withdrew from participation in the intervention only (i.e. a) returned their CPAP device prior to the start of the intervention or at any subsequent point, or b) whose CPAP device usage was transmitted wirelessly; in both cases, device data for the period of the intervention were accessible to trialists for analysis) were not counted as study withdrawals because their CPAP usage data were not missing (i.e. CPAP usage of 0 hours/night was objectively evident).
A meta‐analysis examining rates of withdrawals in studies with educational interventions was not performed due to considerable difference in magnitude and direction of effect across the nine studies, preventing meaningful interpretation of study effects (as per section 9.1.4. of the Cochrane Handbook for Systematic Reviews of Intervention) (summary of findings Table for the main comparison).
Low‐certainty evidence (11 studies n = 1702) showed that participants in active supportive interventions were more likely to withdraw from studies when compared to control (OR 1.27, 95% CI 0.97 to 1.66, P = 0.08). This odds ratio translated to an absolute risk increase from 136 to 167 (95% CI: 133 to 208) people per 1000. Evidence in this comparison was downgraded by two levels for imprecision, as OIS criteria were not met, and because the estimate's confidence interval included null (summary of findings Table 2; Analysis 2.4). Therefore, the overall certainty of the evidence was downgraded by two levels, yielding a 'low' rating.
High‐certainty evidence (10 studies, n = 939) showed that participants in active behavioural interventions were less likely to withdraw from studies when compared to control (OR 0.66, 95% CI 0.44 to 0.98, P = 0.04), translating to an absolute risk reduction from 146 to 101 (95% CI: 70 to 143) people per 1000 (summary of findings Table 3; Analysis 3.4).
Very low‐certainty evidence (11 studies, n = 4956) showed that participants in active mixed interventions were less likely to withdraw from studies when compared to control (OR 0.61, 95% CI 0.28 to 1.30, P = 0.20). This translated to an absolute risk reduction from 129 to 83 (95% CI: 40 to 161) people per 1000. Evidence in this comparison was downgraded by three levels due to heterogeneity (I2 = 85%), imprecision (confidence interval includes null and potential for important benefit), and high risk of bias in six studies with a combined analysis weight of 52.0% (summary of findings Table 4;Analysis 4.4 ).
Daytime sleepiness
Low‐certainty evidence (5 studies, n = 470) demonstrated a non‐significant, decrease in ESS scores (endpoint versus baseline) for participants receiving supportive interventions when compared to control participants (MD ‐0.32, 95% CI ‐1.19 lower to 0.56, P = 0.48). Evidence in this comparison was downgraded by two levels due to high risk of bias associated with non‐masking and subjective outcome measures, in addition to imprecision (OIS criterion not met) (summary of findings Table 2; Analysis 2.5).
Low‐certainty evidence (5 studies, n = 272) demonstrated a reduction in ESS scores for participants receiving behavioural interventions when compared to control at study endpoints (MD ‐2.42, 95% CI ‐4.27 to ‐0.57, P = 0.01). Evidence in this comparison was downgraded by two levels due to the high risk of bias (associated with unmasked participants and assessors reporting/evaluating subjective outcome measures) and heterogeneity (I2 = 71%) (summary of findings Table 3; Analysis 3.5).
Meta‐analyses examining ESS scores in studies with educational and mixed interventions were not performed due to considerable difference in magnitude and direction of effect across eligible studies, preventing meaningful interpretation of study effects.
Quality of life
Meta‐analyses examining quality of life scores in studies with educational interventions were not performed as none of the studies included in this comparison used/measured quality of life as a primary or secondary outcome.
Very low‐certainty evidence (3 studies, n = 294) showed that supportive interventions had small positive effect on quality of life scores when measured with the Functional Outcomes of Sleep Questionnaire (FOSQ), FOSQ‐10, Short Form Survey (SF‐36) (change from baseline) (SMD 0.22, 95% CI ‐0.01 to 0.45, P = 0.06). Evidence in this comparison was downgraded by three levels due to high risk of bias associated with subjective outcomes in non‐masked studies, imprecision (OIS criterion not met), as well as due to suspicion of publication bias. (summary of findings Table 2; Analysis 2.7).
Moderate‐certainty evidence (3 studies, n = 228) demonstrated that behavioural interventions had no apparent effect on quality of life scores when measured with the FOSQ, or the physical health portion of the 36‐item Short Form Survey (SF‐36 (PH)) at study endpoints (SMD 0.00, 95% CI ‐0.26 to 0.26, P = 0.98) (summary of findings Table 3; Analysis 3.7). Evidence in this comparison was downgraded by one level due to high risk of bias associated with non‐masking and subjective outcome measures, yielding a 'moderate' rating.
Low‐certainty evidence (2 studies, n = 3012) also showed that mixed interventions had a small and positive effect on quality of life scores when measured with the FOSQ‐10 and SF‐36 (PH) (change from baseline) (SMD 0.45, 95% CI 0.12 to 0.78, P = 0.008). Similarly, when measuring quality of life with the same measures at endpoints only, very low‐quality evidence (4 studies, n = 3191) showed that mixed interventions had a small and positive effect (SMD 0.45, 95% CI 0.06 to 0.83, P = 0.02). Both of these outcomes were downgraded by two levels due to high risk of bias associated with subjective outcome measures in non‐masked studies as well as heterogeneity (I2 = 79%) (summary of findings Table 4; Analysis 4.5; Analysis 4.6 ).
Depressive and anxiety symptom measures
One study (Hoy 1999) showed that a supportive intervention with brief education, two nights of additional titration, and extended home visits decreased anxiety symptom scores when measured with the Hospital Anxiety and Depression Scale (HADS‐A) at six months against control participants (MD ‐1.1, 95% CI ‐2.95 to ‐0.75, P = 0.24). A GRADE assessment was not performed for this outcome as it is a single‐study estimate (summary of findings Table 2).
Meta‐analyses examining depressive or anxiety symptom scores were not performed for behavioural and educational interventions as none of the studies included in these comparisons reported depression or anxiety as a primary or secondary outcome.
Very low‐certainty evidence (3 studies, n = 333) demonstrated that mixed interventions slightly decreased anxiety scores when compared to control at endpoints when measured with the Depression‐Anxiety Stress Scale (DASS), the Beck Anxiety Inventory (BAI), and the State and Trait Anxiety Inventory (STAI) (SMD =‐0.19, 95% CI ‐0.47 to 0.09, P = 0.18). Evidence in this outcome was downgraded by two levels due to high risk of bias associated with subjective outcome measures in non‐masked studies, and also because a different anxiety symptom scale was used to measure different dimensions of anxiety (e.g. state versus trait). Certainty of evidence was further downgraded by one level due to sub OIS (summary of findings Table 4; Analysis 4.7). Therefore, the overall certainty of the evidence was downgraded by three levels, yielding a 'very low ' rating.
Apnoea hypopnoea index (AHI) on treatment
Two studies reported on AHI (events/hours) following treatment via behavioural interventions (Dantas 2015; Diaferia 2017). Very low‐certainty evidence found a reduction by just under one event per hour when compared to the control group (MD ‐0.95, 95% CI ‐2.25 to 0.34, P = 0.15). Evidence was downgraded by one level due to risk of bias arising from protocol deviation and missing outcome data. Evidence was downgraded by another two levels due to sub optimal information sizes (2 studies, n = 90) and because the estimate's confidence interval included null. No other studies included in this review reported on this outcome (summary of findings Table 3; Analysis 3.6). Therefore, the overall certainty of the evidence was downgraded by three levels, yielding a 'very low ' rating.
Discussion
Summary of main results
This review identified 41 studies assessing behavioural, educational, supportive or mixed strategies for improving continuous positive airway pressure (CPAP) use in 9005 adults with obstructive sleep apnoea (OSA). As a group, behavioural interventions yielded the largest improvements in average nightly CPAP usage when compared to the other intervention classes. Moreover, this class of intervention was the only class to suggest a high degree of certainty and confidence in the estimate, according to our GRADE assessments. Not surprisingly, the mixed interventions were most heterogeneous in design and in effect on CPAP device usage.
Overall completeness and applicability of evidence
Study sites, sample sizes, demographic and clinical characteristics
There was very little variation in participant age, baseline apnoea hypopnoea index (AHI) or baseline Epworth Sleepiness Scale (ESS) across intervention classes (Table 2). The distribution across these demographic and clinical measures likely reflects typical clinical populations.
The behavioural class had a slightly larger proportion of female participants (mean 34.4% female) compared to the other classes (range 24.7% for supportive to 32.4% for mixed). If 0% female assumed for the studies that did not report gender distribution, mean % female ranged from 20.9% (supportive) to 31.3% (behavioural). Importantly, while male gender is an oft‐noted risk factor for OSA and OSA severity, previous authors have suggested that differences in prevalence across genders may be overestimated, and these differences may actually reflect differences in reporting of symptoms across genders and unintentional bias in screening (which is often due to perception of vastly different prevalence rates in itself). Thus, it is difficult to determine an appropriate gender distribution for clinical trials and whether the studies included in this review are reflective of actual clinical populations likely to be targeted by adherence interventions.
It is plausible that interventions directed toward improving CPAP usage are less effective beyond a certain level of pre‐existing compliance. This is supported in part by our planned sensitivity analyses based on control group device usage for some intervention classes. Omitting studies in which average CPAP machine usage was high in control groups (mean ≥ 4 hours/night) had no effect on behavioural educational effect estimates (based on moderate‐ and very low‐quality evidence, respectively), more than doubled the pooled effect estimate for mixed intervention types (very low‐quality evidence), and improved the effect of supportive interventions more modestly, but based on high‐quality evidence. This pattern of findings may suggest that the impact of behavioural and educational interventions may be independent of baseline adherence levels, while mixed and supportive intervention types may be most useful for individuals with low background use. Alternatively, these findings may relate to some other unmeasured difference between studies, study populations or study environments among those with higher versus lower 'background' CPAP usage or may simply be spurious, reflecting the more limited number and lower quality of studies with low use among controls.
See Appendix 1 for further discussion of current evidence pertaining to the impact of CPAP treatment on cardiovascular, cerebrovascular and functional outcomes and the role of CPAP adherence in measuring that impact.
Study duration, intervention duration, contact episodes, contact time
The distribution of intervention duration within each class did not allow subgroup analysis. Therefore, we were not able to establish whether intervention duration is likely to impact CPAP adherence over the short or long term. This unanswered question is relevant to clinical practice, particularly when the cost‐effectiveness of these interventions is considered.
Class‐specific findings
Considerable differences in intervention duration, number of contact episodes, total contact time and study (follow‐up) duration were noted across intervention classes (See Table 3). Supportive and mixed interventions tended to be of longer duration. Number of contact episodes (interquartile range (IQR)) varied from 2 (1 to 5) for educational to 7 (5 to 10) for mixed. Median (IQR) contact time ranged from 45 (12 to 98) for educational to 90 (80 to 240) minutes for behavioural interventions. There was little variability in average study (follow‐up) duration across outcome classes.
There remains a need to assess the impact of intervention on long‐term adherence and outcomes, particularly for patients whose disease is sufficiently severe to warrant intervention but who struggle to persist with CPAP for a number of reasons. More specifically, in addition to assessing the differential impact of interventions based on their class or content, there is a need to better understand which aspects of the intervention structure are most important in assisting patients to initiate CPAP and to become active and engaged partners in their ongoing health care to facilitate long‐term maintenance of treatment. As we discuss in the following sections, it will be important for trialists to: thoughtfully select and report on critical aspects of intervention structure (e.g. duration, number, frequency and duration of clinical contact, timing and sequencing of intervention relative to diagnosis, CPAP titration and CPAP prescription/dispensing). This will improve overall completeness of our corpus of evidence and will permit users of the literature to more adequately assess applicability to their clinical population or setting. It will also enable better cost‐effectiveness estimates.
Qualitative research may assist in identifying common reasons for not persisting with CPAP (e.g. technical problems, insufficient knowledge or understanding of risk and treatment or issues related to motivation, self‐efficacy, or other psychological factors) and quantify their frequency in diverse populations. Such studies will enable better understanding of the mechanisms associated with non‐adherence, elucidate the relationship between initial motivation and ongoing perception of benefit and equip interventional researchers with the means to better determine whether targeting psychological and technical aspects of ongoing CPAP usage modifies long‐term morbidity. The multidimensional nature of CPAP adherence implies that one type of intervention is unlikely to suit all patients, and a personalised approach based on a patient's characteristic and identifiable factors predictive of adherence may be required for some patients. However, such studies may also suggest that a relatively finite set of common factors account for sizeable proportion of variability in adherence. Factors that are both predictive and modifiable represent an appealing target. With this knowledge and with the goal of providing the most cost‐effective treatment, a schedule of adherence interventions may be developed. At one end, low‐intensity, time‐limited, low‐cost and effective interventions may be incorporated into standard management while, at the more intensive end, well‐defined subgroups of non‐adherent patients could be targeted at the outset of CPAP therapy (e.g. after one week of standard care) for more comprehensive or sustained interventions. Between these extremes, more detailed mechanistic information might permit a rational selection of intervention type and duration based on demographic, community or individual clinical factors.
Some of our findings reflect those of previous systematic reviews (Haynes 1996; Haynes 2002a; Haynes 2002b; Haynes 2005; Haynes 2008; Nieuwlaat 2014) of interventions for medication adherence. That is, despite a substantial increase in the number of published studies related to CPAP adherence, the interventions are highly variable and increasingly complex, making it difficult to tease out and evaluate the individual components that may relate most directly to effectiveness. Additionally, the findings of the newer randomised controlled trials (RCTs) only slightly alter the conclusions of the previous version of our review (Wozniak 2014).
Reported endpoints
Interventions also varied substantially in the outcome endpoint measured/reported. Most (29) studies reported CPAP usage outcomes at several endpoints, and only seven studies explicitly identified a primary measurement endpoint. Reported endpoints ranged from one week to two years. A three‐month (or 90‐day) endpoint measurement was available for 20 studies. For the remaining studies, the following endpoints were either the only endpoint reported or the closest to three months: one month (Richards 2007; Shapiro 2017), "1‐2 months" (Chervin 1997), six weeks (Pengo 2018), two months (Dantas 2015; DeMolles 2004; Stepnowsky 2007;), four months (Mendelson 2014; Sedkaoui 2015; Smith 2006; Stepnowsky 2013; Wang 2012), six months (Bakker 2016; Bartlett 2013; Hoy 1999; Lewis 2006; Pepin 2019; Sarac 2017; Scala 2012; Soares‐Pires 2013; Sparrow 2010),and 24 months (Bouloukaki 2014).
Timing of intervention relative to CPAP titration
Not all study authors reported precise timing of CPAP initiation relative to first intervention. Moreover, among those reporting order of CPAP and intervention initiation, many did not specify duration of time between.
Secondary outcomes: health status
Although this review included a number of secondary outcomes related to health status, they were not assessed in the majority of included studies. The most commonly‐measured secondary outcome across intervention classes was daytime sleepiness using ESS. Due to heterogeneity in direction of effect for some classes (educational and mixed), meta‐analyses could not be performed. Among classes for which analysis was appropriate, meta‐analysis included: five behavioural interventions reporting baseline/endpoint scores (Dantas 2015; Diaferia 2017; Olsen 2012; Scala 2012; Wang 2012), and five supportive interventions reporting change from baseline scores (Fox 2012; Hwang 2017; Mendelson 2014; Munafo 2016; Parthasarathy 2013).
Quality of the evidence
Several issues affect the reliability of our findings and their applicability to the general OSA population. Across classes, we downgraded the evidence primarily for risk of bias (behavioural, educational, supportive, mixed) and inconsistency (educational, mixed) ('Summary of findings' tables 1 to 4). Performance bias due to lack of blinding is likely for subjective‐ and observer‐rated outcomes and is likely to affect all the studies in this review. Across all four classes, statistical variation between studies may be attributable to one or more plausible causes, including different populations recruited, variation in the modalities of interventions provided or differences in the timing or intensity of interventions.
Educational interventions were downgraded for both risk of bias and inconsistency across all outcomes. Among supportive interventions, most outcomes were downgraded for risk of bias and several (N deemed adherent, withdrawals, ESS, quality of life (QoL)) for imprecision. Among behavioural interventions, we downgraded the evidence primarily for high risk of bias. ESS was additionally downgraded for inconsistency and AHI for imprecision. Among mixed interventions, nearly all outcomes were downgraded for risk of bias and consistency and some for imprecision.
With the exception of behavioural interventions (where I2 = 0%), there was substantial statistical heterogeneity in CPAP usage effect estimates across studies within each class: I2 = 66% for educational, I2 = 42% for supportive and I2 = 92% among mixed interventions. In both supportive and educational interventions, heterogeneity was attributable to effects of one or two studies. In the supportive intervention class, heterogeneity derived from the single study with results favouring the control arm (Mendelson 2014). Among educational interventions, heterogeneity may be largely attributable to differences in magnitude of effect. Among mixed interventions, heterogeneity could not be easily accounted for, which is not surprising given the heterogeneous nature of the interventions within the 'mixed' category.
Post‐hoc subgroup analyses
Given the extensive variability observed in intervention duration, number of intervention episodes, and intervention contact time across studies, we conducted exploratory post hoc subgroup analyses comparing subgroups of studies based on these dimensions, which may collectively relate to intervention intensity. In post hoc exploration of results, we hypothesised that intervention intensity may help to predict effectiveness. Specifically, for the behavioural, educational, and mixed classes, we examined each of the following subgroups: intervention duration > 4 weeks, intervention episodes > 1 and intervention contact time > 60 minutes. For each, we observed any change in effect estimate and, where relevant, heterogeneity (I2). For supportive interventions, only intervention duration was consistently reported, but we also elected to examine another putative aspect of intensity for that class of intervention: the extent to which the supportive contacts were administered by computer/automated messaging (versus by human contact) and whether the contact frequency/interval was pre‐determined. As such, for the supportive intervention class, we examined a subgroup comprising interventions in which the intervention involved human (rather than purely automated) support and a subgroup comprising interventions that involved scheduled (as opposed to ad hoc) human support. Below, we report the effect estimates (95% CIs), heterogeneity (I2) values for each post hoc subgroup analysis, and tests for subgroup differences.
In summary, we did not find evidence of substantial and consistent effects of any proposed dimension of intervention intensity on CPAP usage across intervention classes in post hoc exploratory subgroup analyses. For behavioural interventions (Analysis 6.8) and educational interventions (Analysis 6.2), the difference between a single contact episode and more than one contact episode (irrespective of duration) was not substantial, while mixed interventions that included greater than one contact episode showed a larger estimated effect on CPAP usage (Analysis 6.11). Importantly though, only one mixed intervention study (Bartlett 2013) had a single contact episode (Hwang 2017 number of contact episodes unknown; Lewis 2006 did not report SDs), so this must be interpreted conservatively. The respective treatment effects were (MD 0.98, 95% CI 0.32 to 1.63; participants = 4036; studies = 9; I2 = 91%) for those with > 1 episode (Bouloukaki 2014; Chen 2015; Hui 2000; Lewis 2006; Meurice 2007; Sawyer 2017; Sedkaoui 2015; Shapiro 2017; Wang 2012) versus (MD ‐0.60, 95% CI ‐1.33 to 0.13; participants = 206; studies = 1; I2 = 0%) for the single study with only a single contact episode (Bartlett 2013), with a demonstrated subgroup difference (Chi² = 9.94, df = 1 (P = 0.002), I² = 89.9%).
Intervention duration > 4 weeks appeared to have similar effect to shorter (≤ 4 week) duration among behavioural interventions (Analysis 6.7). Educational interventions > 4 weeks (Hwang 2017; Pengo 2018; Wang 2012, mean 10 weeks) and supportive interventions > 12 weeks (Hoy 1999; Mendelson 2014; Parthasarathy 2013; Pepin 2019, mean 17.8 weeks) showed no certain improvements in adherence. Shorter duration subgroups in these classes appeared to have a larger effect estimates, however testing for subgroup differences in both intervention categories showed no certain difference; educational (Aloia 2013; Basoglu 2011; Chervin 1997; Falcone 2014; Richards 2007; Roecklein 2010; Sarac 2017, mean 1 week): (MD 1.20, 95% CI 0.39 to 2.01; participants = 675; studies = 7; I2 = 75%), (Chi² = 3.36, df = 1 (P = 0.07), I² = 70.2%) (Analysis 6.1), supportive (Chervin 1997; DeMolles 2004; Fox 2012; Hoet 2017; Hwang 2017; Munafo 2016; Stepnowsky 2007; Stepnowsky 2013; Turino 2017, mean 9.9 weeks): (MD 0.72, 95% CI 0.43 to 1.01; participants = 896; studies = 9; I2 = 0%), Chi² = 0.17, df = 1 (P = 0.68), I² = 0%) (Analysis 6.4). For mixed interventions, longer duration (Bouloukaki 2014; Chen 2015; Hui 2000; Hwang 2017; Lewis 2006 (not included in estimate); Meurice 2007; Sedkaoui 2015; Wang 2012) may have illicited a larger effect estimate (MD 1.22 (0.60‐1.83)), compared to shorter duration (Bartlett 2013; Sawyer 2017; Shapiro 2017) (MD ‐0.31, 95%CI ‐0.83 to 0.21; participants = 331), (Chi² = 13.79, df = 1 (P = 0.0002), I² = 92.7%) (Analysis 6.10).
While behavioural interventions with contact time > 60 minutes had lower effect estimates than those with shorter contact times, only two small studies were in the former subgroup and confidence intervals overlapped substantially (Analysis 6.9) . For educational interventions, three studies had > 60 minutes of contact time and the estimated effect for this subgroup appeared to be larger than interventions with ≤ 60 minutes of contact, however a subgroup difference was not shown (Analysis 6.3). For mixed interventions, there may be a difference between subgroups (Hwang 2017 excluded due to unknown contact time) (MD 1.45, 95% CI 0.73 to 2.16; participants = 3751; studies = 6; I2 = 91%) for those with > 60 minutes contact time (Bouloukaki 2014; Chen 2015; Sawyer 2017; Sedkaoui 2015; Wang 2012) versus (MD ‐0.15, 95% CI ‐0.56 to 0.27; participants = 491; studies = 4; I2 = 0%) for those with ≤ 60 minutes (Bartlett 2013; Hui 2000; Meurice 2007; Shapiro 2017), (Chi² = 14.14, df = 1 (P = 0.0002), I² = 92.9%) (Analysis 6.12).
Finally, our post hoc analysis examining differences in delivering supportive interventions through human interaction versus automated intervention demonstrated uncertain results (Analysis 6.5). It appeared however,supportive interventions prescheduled human support appeared to have a greater effect estimate (MD 1.43 (0.61 to 2.24) I2 = 0%) compared to interventions with no scheduled human support ( MD 0.58 (0.33 to 0.83) I2 = 45%), ( Chi² = 3.82, df = 1 (P = 0.05), I² = 73.8%) (Analysis 6.6.) Moreover, limiting to interventions involving human support substantially reduced the observed heterogeneity of effects among supportive interventions.
Post‐hoc sensitivity analyses
To assess effect of excluding studies with high risk of bias
We performed sensitivity analyses (Table 8), excluding studies with high risk of bias from each class to determine the extent to which our effect estimates may have been influenced by lower quality studies. Omission of studies with high risk of bias resulted in a reduction of the estimated improvement in CPAP usage for behavioural interventions, but statistical significance was retained (MD 1.05, 95% CI 0.57 to 1.53; participants = 340; studies = 4; I2 = 0%). Interestingly, for educational (MD 0.98, 95% CI 0.07 to 1.89; participants = 642; studies = 4; I2 = 86%) and supportive (MD 0.75, 95% CI 0.42 to 1.09; participants = 728; studies = 5; I2 = 34%) interventions, omission of high risk of bias improved effect estimates slightly while retaining statistical and clinical significance. Due to high heterogeneity and more pronounced differences in direction (two of five studies with mean differences favouring controls, I2 = 92%) and magnitude of effect, this sensitivity analysis was not performed for mixed intervention class.
To assess effect of differences in updated review intervention classification
We also performed sensitivity analyses (Table 11) to determine if the approach employed for classifying interventions in the current review update, relative to the original classification decisions (Wozniak 2014), substantially affected the results obtained for the original three intervention classes (i.e. behavioural, educational and supportive). To perform these sensitivity analyses, any study that was included in the original review was assigned to the class assigned in the original review. Any study that was new to the updated review retained the class assigned in the update. For behavioural interventions, three studies were differentially classified (Wang 2012 classified as behavioural in our update but as educational in original review; Richards 2007 and Roecklein 2010 classified as educational in our update but as behavioural in the original review). Results showed (MD 1.47, 95% CI 1.12 to 1.83; participants = 625; studies = 9; I2 = 48%) that the original classification schema would have improved the estimated effect relative to our reported results.
Sensitivity analysis of educational interventions according to the original class allocation (MD 0.48, 95% CI 0.21 to 0.76; participants = 1095; studies = 8; I2 = 0%) resulted in a reduction of the effect estimate, but retained significance. Relative to our classification, the original classification reduced the number of studies in the educational class from 10 to 8, entailed differential allocation of three studies and reduced the heterogeneity to 0%.
Classification of supportive interventions according to the original review (MD 0.58, 95% CI 0.36 to 0.81; participants = 1534; studies = 14; I2 = 45%) resulted in a reduction in the estimated effect and also retained significance, favouring the intervention. Heterogeneity was essentially unchanged.
To assess effect of endpoint selection
Sensitivity analyses to examine whether the endpoint measured/reported by study authors (closest endpoint to three months post‐intervention, the modal endpoint) affected the effect estimates. A summary of results is provided (Table 12).
Treatment fidelity
Treatment fidelity, which can be defined as strategies that monitor and enhance the accuracy and consistency of an intervention provided, is of particular importance in behavioural studies. Assessment of treatment fidelity is required to ensure validity of study outcomes. In the current review,six6 studies (Aloia 2013; Bakker 2016; Lai 2014; Sawyer 2017; Shapiro 2017; Olsen 2012) implemented treatment fidelity checks, and the lack of checks in other studies is a potential source of inconsistency between studies.
Potential biases in the review process
Two potential sources of bias have been identified in our review process. First, the categorisation of studies in this review is based on our assessment of the core attributes of the intervention, based on the authors' descriptions within Methods sections of the published reports, and how it differed from the control group (i.e. the 'net' intervention). It is possible that our classification of studies by intervention type is itself a crude mean of differentiating between the interventions or other differentiating features (e.g. intervention intensity) may ultimately prove more important in defining and comparing classes of interventions. Furthermore, the addition of a 'mixed' intervention type to this updated review reduced the imprecision of assigning interventions with mixed components to one class arbitrarily, but also introduced a new highly‐heterogeneous category. We found no evidence to suggest that our classification procedures biased our most important results in favour of the intervention. Sensitivity analysis examining results for behavioural interventions using the original versus our updated classification scheme showed that, if anything, our classification approach was more conservative for this outcome. Differences in classification for educational and supportive interventions did produce nominally more favourable results in the current review and does suggest that classification decisions can impact results. Overall, our classification procedures did not appear to impact heterogeneity. Relative to the allocation implied under original classification procedures, our behavioural class was less heterogeneous (0% versus 48%), our educational class was more heterogeneous (66% versus 0%) and our supportive class heterogeneity was essentially equivalent (42% versus 45%).
Second, we did not assess how 'active' components of control interventions may have confounded the results of some of the studies. Many of the control group interventions in the included studies attempted to inform participants about OSA and the importance of treatment through written materials, videos or sessions with specialist staff. However, what constitutes usual care varied between treatment centres. For example, the control groups of Hoy 1999 and Hui 2000 received education and support at least equivalent to that received by the intervention group in Chervin 1997. Some studies attempted to balance contact with participants between intervention and control groups or to provide 'placebo' in the control arms. In other studies, given the nature of the interventions, this was not practical. We did attempt to mitigate the effect of active controls by including only studies in which the intervention arm(s) received the same 'background' level of intervention as the control. However, the varied intensity of the background or control intervention, in addition to the 'net intervention' within the studies, could have influenced effect sizes in our analyses.
Agreements and disagreements with other studies or reviews
To our knowledge, other than the previous version of this review (Wozniak 2014), no other published reviews that meet the standard criteria of a systematic review have investigated the role of educational, supportive or behavioural interventions in improving adherence to CPAP.
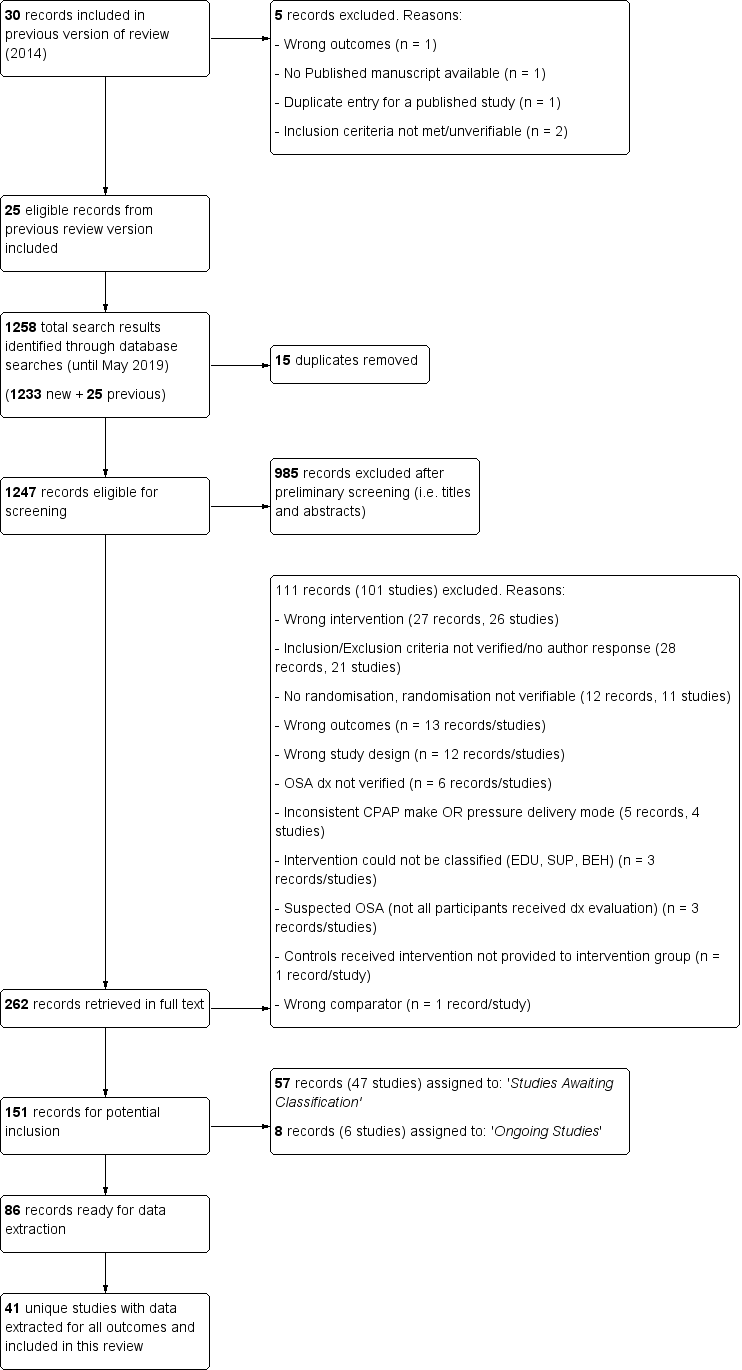
Study flow diagram.

'Risk of bias' summary: review authors' judgements about each risk of bias item for each included study.
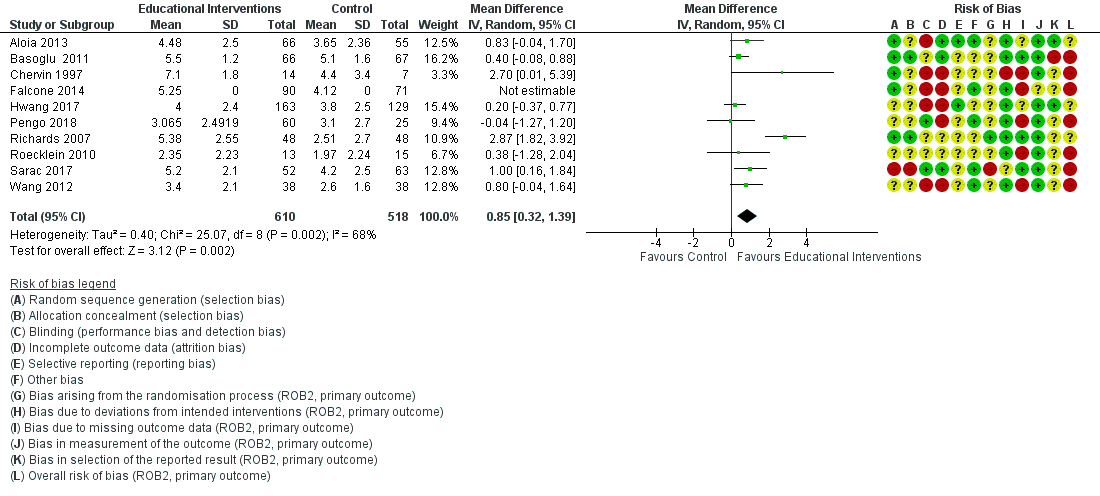
Forest plot of comparison: 1 Educational intervention versus control on primary outcome: CPAP Device Usage (hours/night).

Forest plot of comparison: 2 Supportive intervention versus control on primary outcome: CPAP Device Usage (hours/night).

Forest plot of comparison: 3 Behavioural intervention versus control on primary outcome: CPAP Device Usage (hours/night).

Forest plot of comparison: 4 Mixed (SUP/EDU/BEH) intervention versus control on primary outcome: CPAP Device Usage (hours/night).

Comparison 1 Educational intervention versus control, Outcome 1 CPAP Device Usage (hours/night).
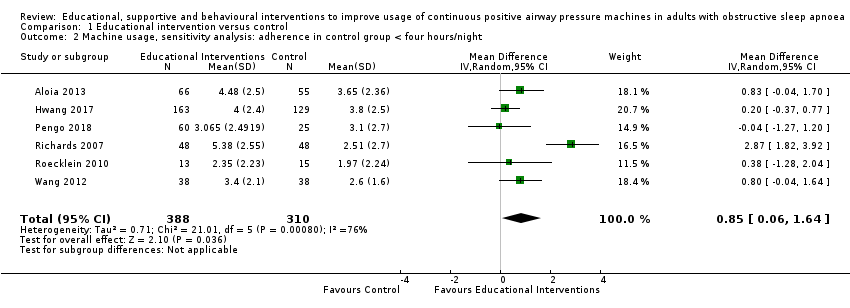
Comparison 1 Educational intervention versus control, Outcome 2 Machine usage, sensitivity analysis: adherence in control group < four hours/night.

Comparison 1 Educational intervention versus control, Outcome 3 N deemed adherent (≥ four hours/night).

Comparison 1 Educational intervention versus control, Outcome 4 Withdrawal.

Comparison 1 Educational intervention versus control, Outcome 5 Epworth Sleepiness Scale ‐ Comparison of Values at Endpoint.

Comparison 2 Supportive intervention versus control, Outcome 1 CPAP Device Usage (hours/night).
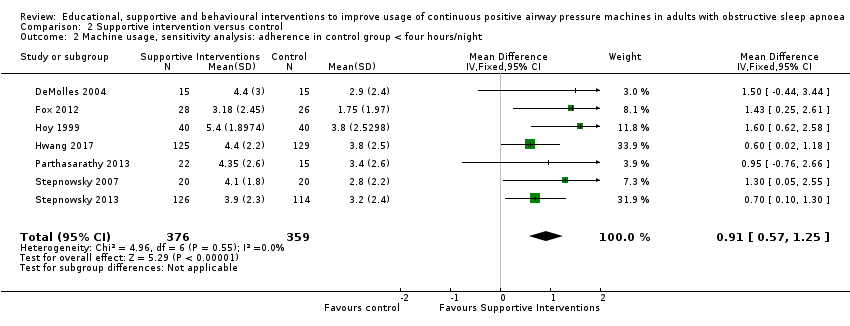
Comparison 2 Supportive intervention versus control, Outcome 2 Machine usage, sensitivity analysis: adherence in control group < four hours/night.

Comparison 2 Supportive intervention versus control, Outcome 3 N deemed adherent (≥ four hours/night).

Comparison 2 Supportive intervention versus control, Outcome 4 Withdrawals.
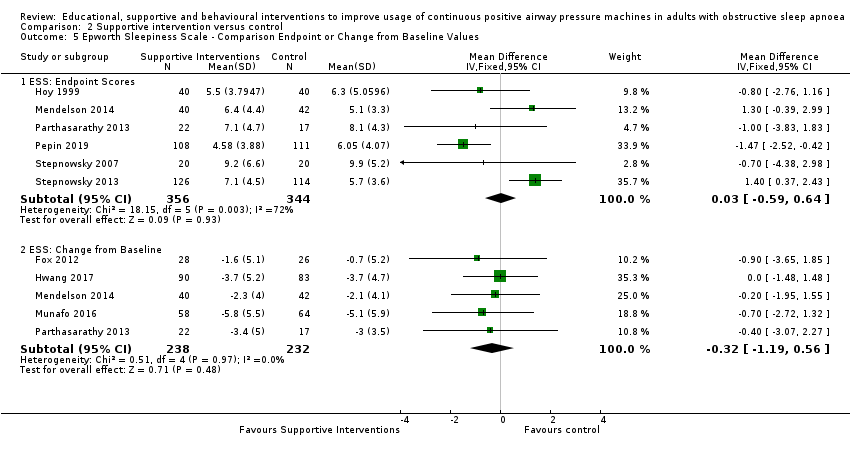
Comparison 2 Supportive intervention versus control, Outcome 5 Epworth Sleepiness Scale ‐ Comparison Endpoint or Change from Baseline Values.

Comparison 2 Supportive intervention versus control, Outcome 6 Quality of Life: Comparison of Values at Endpoint.

Comparison 2 Supportive intervention versus control, Outcome 7 Quality of LIfe: Comparison of Change from Baseline Values.

Comparison 2 Supportive intervention versus control, Outcome 8 Anxiety Symptom Rating (HADS‐A) ‐ Comparison of Values at Endpoint.
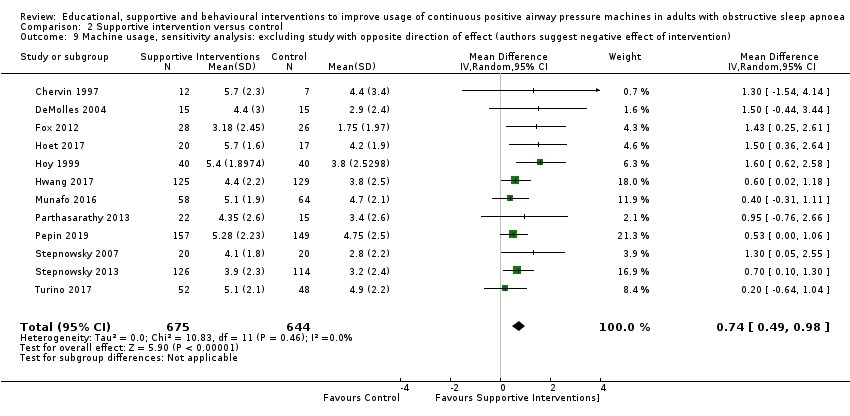
Comparison 2 Supportive intervention versus control, Outcome 9 Machine usage, sensitivity analysis: excluding study with opposite direction of effect (authors suggest negative effect of intervention).

Comparison 2 Supportive intervention versus control, Outcome 10 AHI on treatment ‐ Comparison of Values at Endpoint.
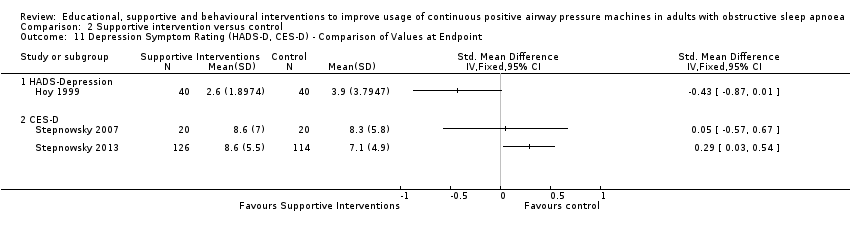
Comparison 2 Supportive intervention versus control, Outcome 11 Depression Symptom Rating (HADS‐D, CES‐D) ‐ Comparison of Values at Endpoint.
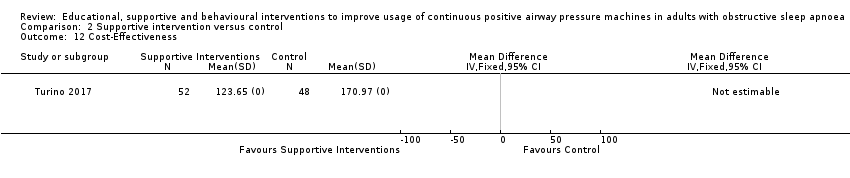
Comparison 2 Supportive intervention versus control, Outcome 12 Cost‐Effectiveness.
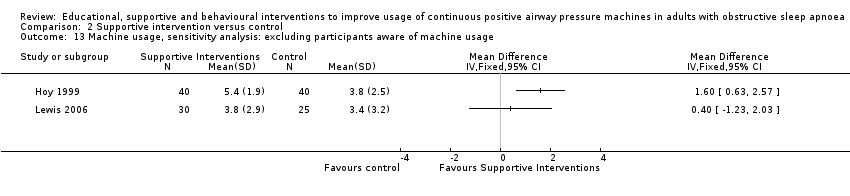
Comparison 2 Supportive intervention versus control, Outcome 13 Machine usage, sensitivity analysis: excluding participants aware of machine usage.

Comparison 3 Behavioural intervention versus control, Outcome 1 CPAP Device Usage (hours/night).

Comparison 3 Behavioural intervention versus control, Outcome 2 CPAP Device Usage (hours/night), sensitivity analysis: adherence in control group < four hours/night.
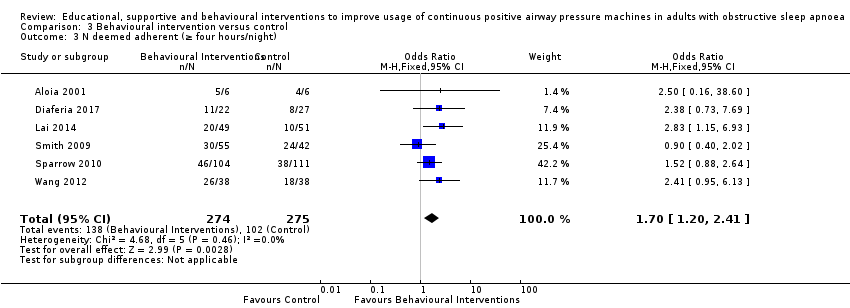
Comparison 3 Behavioural intervention versus control, Outcome 3 N deemed adherent (≥ four hours/night).
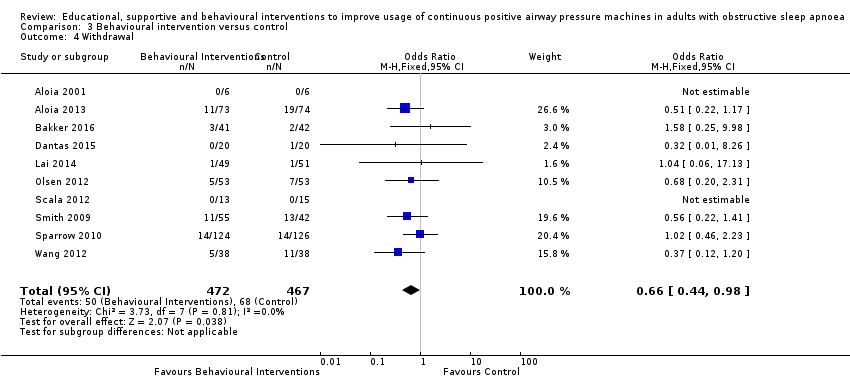
Comparison 3 Behavioural intervention versus control, Outcome 4 Withdrawal.

Comparison 3 Behavioural intervention versus control, Outcome 5 Epworth Sleepiness Scale (Endpoint scores).

Comparison 3 Behavioural intervention versus control, Outcome 6 AHI on treatment ‐ Endpoint.

Comparison 3 Behavioural intervention versus control, Outcome 7 Quality of Life ‐ Comparison of Values at Endpoint.
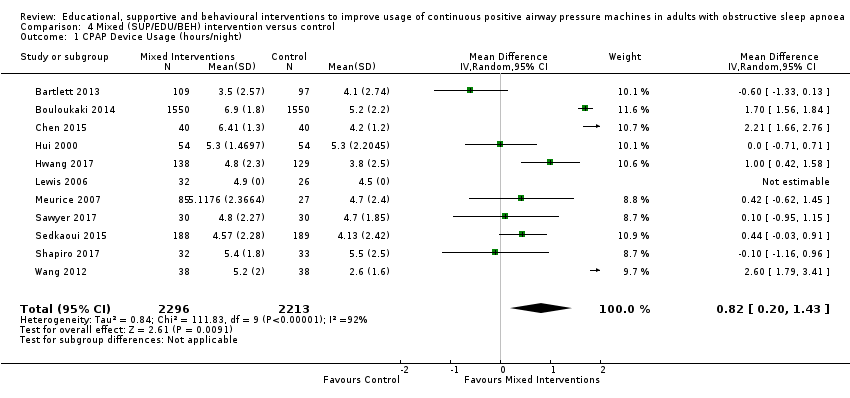
Comparison 4 Mixed (SUP/EDU/BEH) intervention versus control, Outcome 1 CPAP Device Usage (hours/night).

Comparison 4 Mixed (SUP/EDU/BEH) intervention versus control, Outcome 2 CPAP Device Usage, sensitivity analysis: adherence in control group < four hours/night.

Comparison 4 Mixed (SUP/EDU/BEH) intervention versus control, Outcome 3 N deemed adherent (≥ four hours/night).
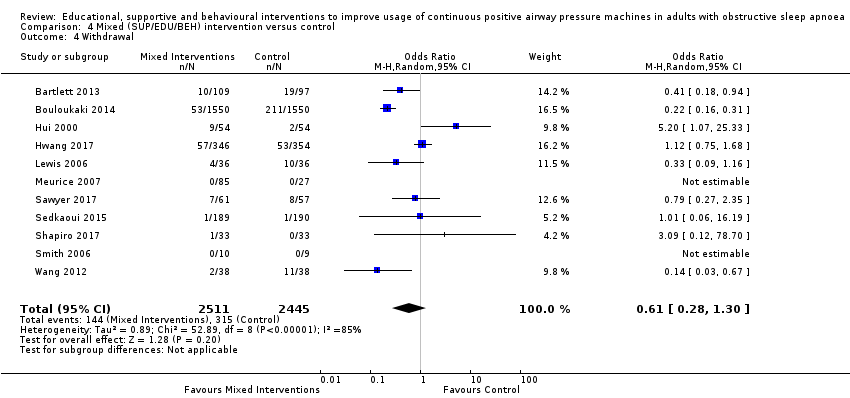
Comparison 4 Mixed (SUP/EDU/BEH) intervention versus control, Outcome 4 Withdrawal.

Comparison 4 Mixed (SUP/EDU/BEH) intervention versus control, Outcome 5 Quality of LIfe: Comparison of Change from Baseline Values.

Comparison 4 Mixed (SUP/EDU/BEH) intervention versus control, Outcome 6 Quality of Life: Comparison of Values at Endpoint.

Comparison 4 Mixed (SUP/EDU/BEH) intervention versus control, Outcome 7 Anxiety Symptom Rating ‐ Comparison of Values at Endpoint.

Comparison 4 Mixed (SUP/EDU/BEH) intervention versus control, Outcome 8 Depression Symptom Rating ‐ Comparison of Values at Endpoint.

Comparison 4 Mixed (SUP/EDU/BEH) intervention versus control, Outcome 9 Epworth Sleepiness Scale Score.

Comparison 5 Post‐hoc sensitivity analyses, Outcome 1 EDU: CPAP Device Usage (hours/night), original EDU study classification.
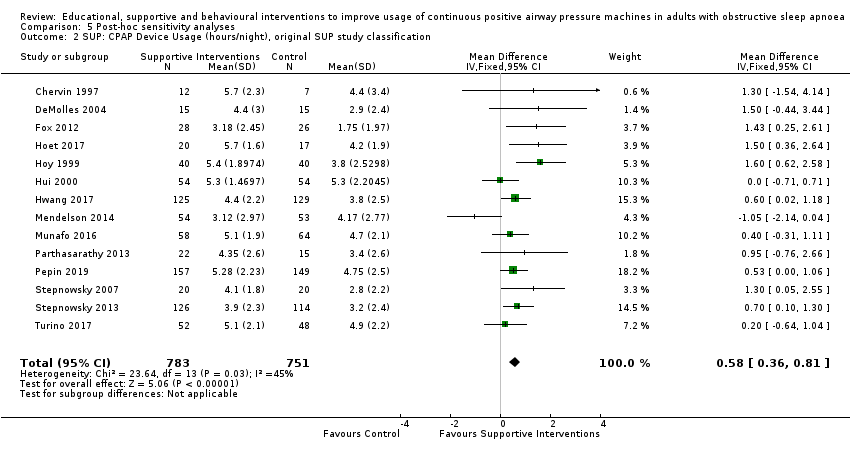
Comparison 5 Post‐hoc sensitivity analyses, Outcome 2 SUP: CPAP Device Usage (hours/night), original SUP study classification.

Comparison 5 Post‐hoc sensitivity analyses, Outcome 3 BEH: CPAP Device Usage (hours/night), original BEH study classification.

Comparison 5 Post‐hoc sensitivity analyses, Outcome 4 EDU: CPAP Device Usage (hours/night), exclude HIGH 'Risk of bias' studies.

Comparison 5 Post‐hoc sensitivity analyses, Outcome 5 SUP: CPAP Device Usage (hours/night), exclude HIGH 'Risk of bias' studies.

Comparison 5 Post‐hoc sensitivity analyses, Outcome 6 BEH: CPAP Device Usage (hours/night), exclude HIGH 'Risk of bias' studies.

Comparison 5 Post‐hoc sensitivity analyses, Outcome 7 MIX: CPAP Device Usage (hours/night), exclude HIGH 'Risk of bias' studies.

Comparison 6 Post‐hoc subgroup analyses (exploratory), Outcome 1 EDU: CPAP Device Usage (hours/night).
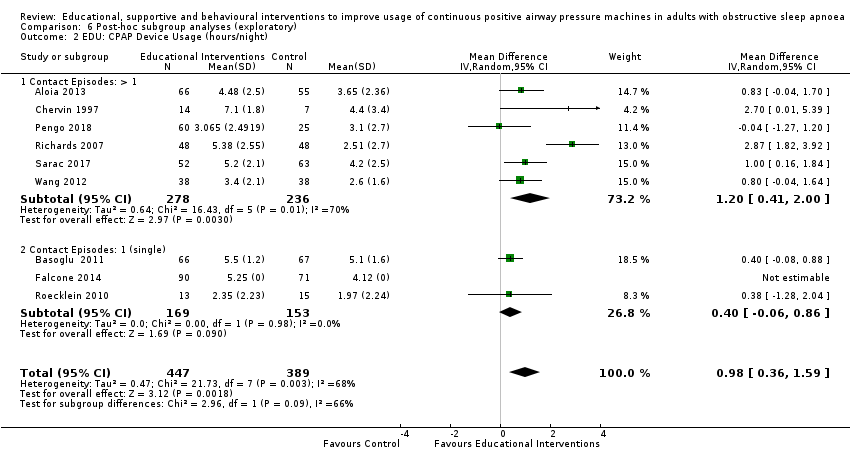
Comparison 6 Post‐hoc subgroup analyses (exploratory), Outcome 2 EDU: CPAP Device Usage (hours/night).

Comparison 6 Post‐hoc subgroup analyses (exploratory), Outcome 3 EDU: CPAP Device Usage (hours/night).

Comparison 6 Post‐hoc subgroup analyses (exploratory), Outcome 4 SUP: Subgroup Analysis ‐ CPAP Device Usage (hours/night).

Comparison 6 Post‐hoc subgroup analyses (exploratory), Outcome 5 SUP: Subgroup Analysis ‐ CPAP Device Usage (hours/night).

Comparison 6 Post‐hoc subgroup analyses (exploratory), Outcome 6 SUP: Subgroup Analysis ‐ CPAP Device Usage (hours/night).
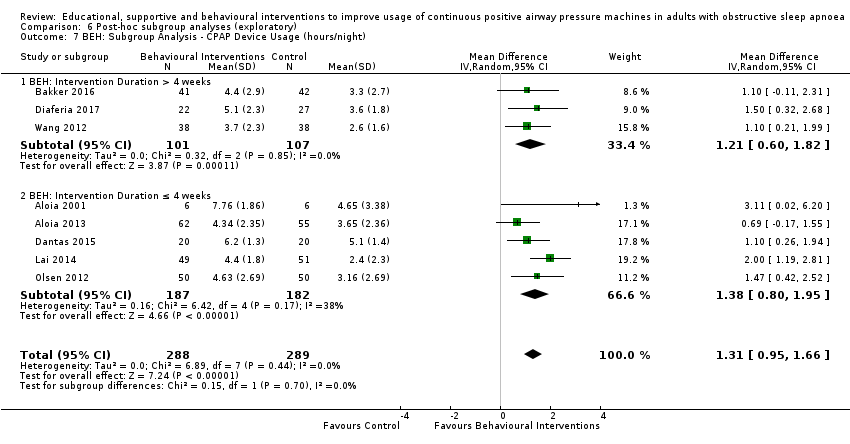
Comparison 6 Post‐hoc subgroup analyses (exploratory), Outcome 7 BEH: Subgroup Analysis ‐ CPAP Device Usage (hours/night).

Comparison 6 Post‐hoc subgroup analyses (exploratory), Outcome 8 BEH: Subgroup Analysis ‐ CPAP Device Usage (hours/night).
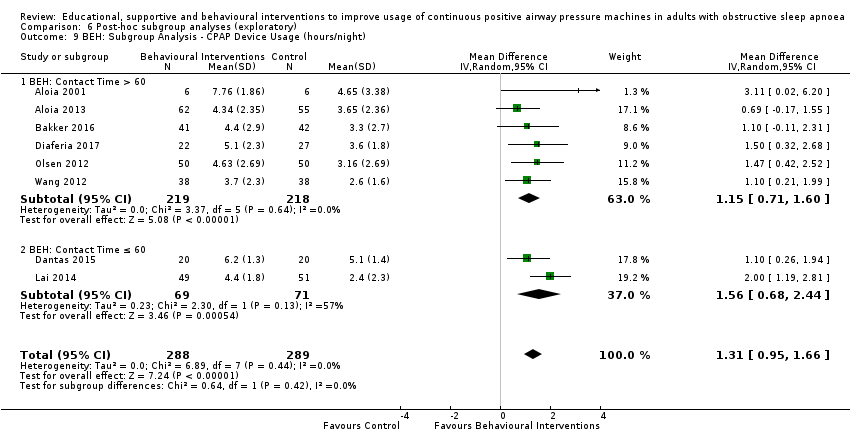
Comparison 6 Post‐hoc subgroup analyses (exploratory), Outcome 9 BEH: Subgroup Analysis ‐ CPAP Device Usage (hours/night).

Comparison 6 Post‐hoc subgroup analyses (exploratory), Outcome 10 MIX: Subgroup Analysis ‐ CPAP Device Usage (hours/night).

Comparison 6 Post‐hoc subgroup analyses (exploratory), Outcome 11 MIX: Subgroup Analysis ‐ CPAP Device Usage (hours/night).

Comparison 6 Post‐hoc subgroup analyses (exploratory), Outcome 12 MIX: Subgroup Analysis ‐ CPAP Device Usage (hours/night).
| Educational interventions + CPAP compared to usual care + CPAP in adults with obstructive sleep apnoea | ||||||
| Patient or population: adults with obstructive sleep apnoea | ||||||
| Outcomes | Anticipated absolute effects* (95% CI) | Relative effect | № of participants | Certainty of the evidence | Comments | |
| Risk with usual care + CPAP | Risk with Educational interventions + CPAP | |||||
| 1.1 CPAP device usage (hours/night) | The mean CPAP device usage ranged from 1.97 to 5.1 hours/night | MD 0.85 hours/night higher | ‐ | 1128 | ⊕⊝⊝⊝ | |
| 1.2 CPAP device usage (hours/night), sensitivity analysis: adherence in control group < four hours/night | The mean CPAP device usage , sensitivity analysis: adherence in control group < four hours/night ranged from 1.97 to 3.8 hours/night | MD 0.85 hours/night higher | ‐ | 698 | ⊕⊝⊝⊝ | |
| 1.3 N deemed adherent (≥ four hours/night) | 558 per 1,000 | 765 per 1,000 | OR 2.58 | 1019 | ⊕⊝⊝⊝ | |
| 1.4 Withdrawal ‐ NO META‐ANALYSIS PERFORMED | ‐ | 1745 | ‐ | |||
| 1.5 ESS ‐ Comparison of values at endpoint‐ NO META‐ANALYSIS PERFORMED | ‐ | ‐ | 355 | ‐ | ||
| *The risk in the intervention group (and its 95% confidence interval) is based on the assumed risk in the comparison group and the relative effect of the intervention (and its 95% CI). | ||||||
| GRADE Working Group grades of evidence | ||||||
| 1 Overall risk of bias for this comparison was 'High' for 7/10 and 'some concerns' for the remaining 3/10. In those with high risk, risk derived from randomisation (1), missing outcome data (5), protocol deviation (1) and selective reporting (1). The combined weight of the studies with high risk is 59.2%. Therefore, risk of bias for this comparison was downgraded by 2 levels to 'very serious.' 2 There was minimal or no variability in direction of effect, with all (or nearly all) studies favouring the intervention arm. Magnitude of effect varied substantially (4 studies with CIs excluding null). CIs have reasonable overlap. Substantial statistical heterogeneity P = 0.002, I2 = 66%. Therefore, inconsistency was downgraded by one level to 'serious.' 3 Studies retrieved and analysed for this review directly compare the population, interventions and outcomes of interest, as predefined, in our review protocol. 4 Performed optimal information size (OIS) (sample size) calculation, as per GRADE Handbook recommendations, which indicated OIS criterion was met for this outcome. Confidence interval does not include null and includes potential for important benefit. 5 There was minimal or no variability in direction of effect, with all (or nearly all) studies favouring the intervention arm. Magnitude of effect varied substantially (1 study with CI excluding null). Substantial statistical heterogeneity P = 0.0008, I2 = 76%. Therefore, inconsistency was downgraded by one level to 'serious.' 6 Overall risk of bias for this comparison was 'High' for 3/6 and 'some concerns' for the remaining 3/6. In those with high risk, risk derived from missing outcome data (3). The combined weight of the studies with high risk is 44.8%. Therefore, risk of bias for this comparison was downgraded by 2 levels to 'very serious.' 7 There was no variability in direction of effect, with all (or nearly all) studies favouring the intervention arm. Magnitude of effect varied substantially (3 studies with CI excluding null). Substantial statistical heterogeneity P = 0.003, I2 = 70%. Therefore, inconsistency was downgraded by one level to 'serious.' 8 Overall risk of bias for this comparison was 'High' for 5/7 and 'some concerns' for the remaining 2/7. In those with high risk, risk derived from randomisation (1), missing outcome data (3), and selective reporting (1). The combined weight of the studies with high risk is 68.2%.Therefore, risk of bias for this comparison was downgraded by 2 levels to 'very serious.' | ||||||
| Increased practical support and encouragement during follow‐up + CPAP compared to usual care + CPAP in adults with obstructive sleep apnoea | ||||||
| Patient or population: adults with obstructive sleep apnoea | ||||||
| Outcomes | Anticipated absolute effects* (95% CI) | Relative effect | № of participants | Certainty of the evidence | Comments | |
| Risk with usual care + CPAP | Risk with Increased practical support and encouragement during follow‐up + CPAP | |||||
| 2.1 CPAP device usage (hours/night) | The mean CPAP device usage ranged from 1.75 to 4.9 hours/night | MD 0.70 hours/night higher | ‐ | 1426 | ⊕⊕⊕⊝ | |
| 2.2 CPAP device usage, sensitivity analysis: adherence in control group < four hours/night | The mean CPAP device usage, sensitivity analysis: adherence in control group < four hours/night ranged from 1.75 to 3.8 hours/night | MD 0.91 hours/night higher | ‐ | 735 | ⊕⊕⊕⊕ | |
| 2.3 N deemed adherent (≥ four hours/night) | 601 per 1,000 | 717 per 1,000 | OR 1.68 | 376 | ⊕⊕⊝⊝ | |
| 2.4 Withdrawals | 136 per 1,000 | 167 per 1,000 | OR 1.27 | 1702 | ⊕⊕⊝⊝ | |
| 2.5.2 ESS: Comparison Endpoint or Change from Baseline Values ‐ ESS: Change from Baseline | The mean ESS ‐ Comparison Endpoint or Change from Baseline Values ‐ ESS: Change from Baseline ranged from ‐0.7 to ‐5.1 | MD 0.32 lower | ‐ | 470 | ⊕⊕⊝⊝ | |
| 2.7 Quality of lIfe: Comparison of Change from Baseline Values | The mean Quality of lIfe: Comparison of Change from Baseline Values was 0 | SMD 0.22 higher | ‐ | 294 | ⊕⊝⊝⊝ | |
| *The risk in the intervention group (and its 95% confidence interval) is based on the assumed risk in the comparison group and the relative effect of the intervention (and its 95% CI). | ||||||
| GRADE Working Group grades of evidence | ||||||
| 1 Overall risk of bias for this comparison was 'High' for 8/13 and 'some concerns' for the remaining 5/13. In those with high risk, risk derived from randomisation (1), missing outcome data (6), protocol deviation (1) and selective reporting (2). The combined weight of the studies with high risk is 51.2%. Therefore, risk of bias for this comparison was downgraded by 1 level to 'serious.' 2 Direction of effect had some variability (one study, weight = 6.8%, favoured control), while remaining studies favoured experimental arms. Magnitude of effect varied across studies and CIs had fair overlap. Heterogeneity P = 0.05, I2 = 42%. Heterogeneity explained: attributable to single study with opposite direction of effect (Mendelson 2014). See sensitivity analysis with this study excluded (Analysis 2.13). 3 Studies retrieved and analysed for this review directly compare the population, interventions and outcomes of interest, as predefined, in our review protocol. 4 Performed optimal information size (OIS) (sample size) calculation, as per GRADE Handbook recommendations, which indicated OIS criterion was met for this outcome. Confidence interval does not include null and includes potential for important benefit. 5 Overall risk of bias for this comparison was 'High' for 3/7 and 'some concerns' for the remaining 4/7. In those with high risk, risk derived from missing outcome data (1) and selective reporting (2). The combined weight of the studies with high risk is 14.2%. 6 Overall risk of bias for this comparison was 'High' for 1/2 and 'some concerns' for the remaining 1/2. Hisk risk derived from missing outcome data. The weight of high risk study is 24.8%. Therefore, risk of bias for this comparison was downgraded by 1 level to 'serious.' 7 OIS (sample size) calculation, as per GRADE Handbook recommendations, which indicated OIS criterion not met for this outcome. Therefore, Imprecision for this comparison was downgraded by 1 level to 'serious.' 8 Performed OIS (sample size) calculation, as per GRADE Handbook recommendations, which indicated OIS criterion not met for this outcome. Additionally, CI includes null and potential for important difference in withdrawals. Therefore, Imprecision for this comparison was downgraded by 2 levels to 'very serious.' 9 Overallrisk of bias for this outcome is 'high' for all, or nearly all, included studies because, for all or nearly all studies assessed for this outcome, the following were true: a) outcome assessors (whether participant or investigator) were aware of the intervention received by study participants, b) the outcome assessment could have been influenced by knowledge of the intervention received (because each involves some judgement by the assessor, whether participant or investigator) and c) we have no further information that would permit further adjudication of the likelihood that outcome assessment was influenced by knowledge of the intervention received. Therefore, risk of bias for this comparison was downgraded by 1 level to 'serious.' 10 OIS likely insufficient.Therefore, Imprecision for this comparison was downgraded by 1 level to 'serious.' 11 Our review included a comprehensive search for published reports conducted. All (or nearly all) studies, including all small studies, for this comparison found a benefit for the intervention. Thus, due to suspicion for publication bias, this outcome was downgraded by one level. 12 Overall risk of bias for this comparison was 'High' for 7/12 and 'some concerns' for the remaining 5/12. In those with high risk, risk derived from randomisation (1), missing outcome data (5), protocol deviation (1) and selective reporting (2). The combined weight of the studies with high risk is 46.1%. | ||||||
| Behavioural therapy + CPAP compared to control + CPAP in adults with obstructive sleep apnoea | ||||||
| Patient or population: adults with obstructive sleep apnoea | ||||||
| Outcomes | Anticipated absolute effects* (95% CI) | Relative effect | № of participants | Certainty of the evidence | Comments | |
| Risk with control + CPAP | Risk with Behavioural therapy + CPAP | |||||
| 3.1 CPAP Device Usage (hours/night) | The mean CPAP Device Usage ranged from 1.48 to 5.1 hours/night | MD 1.31 hours/night higher | ‐ | 578 | ⊕⊕⊕⊕ | |
| 3.2 CPAP Device Usage, sensitivity analysis: adherence in control group < four hours/night | The mean CPAP Device Usage, sensitivity analysis: adherence in control group < four hours/night ranged from 1.48 to 3.65 hours/night | MD 1.32 hours/night higher | ‐ | 525 | ⊕⊕⊕⊝ | |
| 3.3 N deemed adherent (≥ four hours/night) | Study population | OR 1.70 | 549 | ⊕⊕⊕⊕ | ||
| 371 per 1,000 | 501 per 1,000 | |||||
| 3.4 Withdrawal | 146 per 1,000 | 101 per 1,000 | OR 0.66 | 939 | ⊕⊕⊕⊕ | |
| 3.5 ESS (Endpoint scores) | The mean ESS (Endpoint scores) ranged from 7.1 to 12.5 | MD 2.42 lower | ‐ | 271 | ⊕⊕⊝⊝ | |
| 3.6 AHI on treatment ‐ Endpoint | The mean AHI at endpoint ranged from 3.7 to 4.3 events/hour | MD 0.95 events/hour lower | ‐ | 89 | ⊕⊝⊝⊝ | |
| 3.7 Quality of Life ‐ Comparison of Values at Endpoint | The mean Quality of Life ‐ Comparison of Values at Endpoint was 0 | SMD 0 | ‐ | 228 | ⊕⊕⊕⊝ | |
| 3.7.1 Quality of Life ‐ Comparison of Values at Endpoint ‐ QoL: FOSQ ‐ Endpoint | The mean Quality of Life ‐ Comparison of Values at Endpoint ‐ QoL: FOSQ ‐ Endpoint was 0 | SMD 0.01 higher | ‐ | 200 | ‐ | |
| *The risk in the intervention group (and its 95% confidence interval) is based on the assumed risk in the comparison group and the relative effect of the intervention (and its 95% CI). | ||||||
| GRADE Working Group grades of evidence | ||||||
| 1 Studies retrieved and analysed for this review directly compare the population, interventions and outcomes of interest, as predefined, in our review protocol. 2 Performed optimal information size (OIS) (sample size) calculation, as per GRADE Handbook recommendations, which indicated OIS criterion was met for this outcome. Confidence interval does not include null and includes potential for important benefit (1 hour more use/night). 3 Overall risk of bias for this comparison was 'Some concerns' for 4/8 and 'high' for the remaining 4/8. In those with high risk, risk derived from randomisation (1), missing outcome (1), protocol deviation/missing outcome data (1) and selective reporting (1). The combined weight of the four studies with high risk is 45.1%. 4 Overall risk of bias for this comparison was 'Some concerns' for 3/6 and 'high' for the remaining 3/6. In those with high risk, risk derived from missing outcome (1), protocol deviation/missing outcome data (1) and selective reporting (1). The combined weight of the two studies with high risk is 54.4%. Therefore, risk of bias for this comparison was downgraded by 1 level to 'serious.' 5 Direction of effect did not vary. Magnitude of effect varied somewhat and CIs had good overlap. Heterogeneity P = 0.38, I2 = 6%. 6 Overall risk of bias for this comparison was 'Some concerns' for 2/6 and 'high' for the remaining 4/6. In those with high risk, risk derived from randomisation process (1), missing outcome data (1), protocol deviation/missing outcome data (1) and selective reporting (1). The combined weight of the two studies with high risk is 32.4%. 7 One (second highest‐weighted) study found opposite direction of effect (favoured control). The remaining studies had similar magnitude of effect and showed reasonable overlap of CIs. Heterogeneity P = 0.46, I2 = 0%. 8 Overall risk of bias for this outcome is 'high' for all, or nearly all, included studies because, for all or nearly all studies assessed for this outcome, the following were true: a) outcome assessors (whether participant or investigator) were aware of the intervention received by study participants, b) the outcome assessment could have been influenced by knowledge of the intervention received (because each involves some judgement by the assessor, whether participant or investigator) and c) we have no further information that would permit further adjudication of the likelihood that outcome assessment was influenced by knowledge of the intervention received. Therefore, risk of bias for this comparison was downgraded by 1 level to 'serious.' 9 Direction of effect had some variability (one study, weight =17.9%, modestly favoured control), while remaining studies favoured experimental arms. Magnitude of effect varied significantly and CIs had moderate overlap. Heterogeneity P = 0.008, I2=71%.Therefore, inconsistency was downgraded by one level to 'serious.' 10 Only two studies provided information for this comparison. Overall risk of bias for this comparison was 'Some concerns' for 1/2 and 'high' for the remaining 1/2 (Diaferia 2017). High‐risk derived from protocol deviation/missing outcome data. Additionally, the other study (Dantas 2015) had 'some concerns' for domain 1 (study level), randomisation process. Therefore, risk of bias for this comparison was downgraded by 1 level to 'serious.' 11 Performed OIS (sample size) calculation, as per GRADE Handbook recommendations, which indicated OIS criterion not met for this outcome. Additionally, CI contained null effect and potential for important benefit.Therefore, Imprecision for this comparison was downgraded by 2 levels to 'very serious.' | ||||||
| Mixed (SUP/EDU/BEH) Intervention + CPAP compared to Usual Care + CPAP in adults with obstructive sleep apnoea | ||||||
| Patient or population: adults with obstructive sleep apnoea | ||||||
| Outcomes | Anticipated absolute effects* (95% CI) | Relative effect | № of participants | Certainty of the evidence | Comments | |
| Risk with Usual Care + CPAP | Risk with Mixed (SUP/EDU/BEH) Intervention + CPAP | |||||
| 4.1 CPAP Device Usage (hours/night) | The mean CPAP Device Usage ranged from 2.6 to 5.5 hours/night | MD 0.82 hours/night higher | ‐ | 4509 | ⊕⊝⊝⊝ | |
| 4.2 CPAP Device Usage, sensitivity analysis: adherence in control group < four hours/night | The mean CPAP Device Usage, sensitivity analysis: adherence in control group < four hours/night ranged from 2.6 to 3.8 hours/night | MD 1.77 hours/night higher | ‐ | 343 | ⊕⊝⊝⊝ | |
| 4.3 N deemed adherent (≥ four hours/night) | 741 per 1,000 | 830 per 1,000 | OR 1.71 | 4015 | ⊕⊝⊝⊝ | |
| 4.4 Withdrawal | 129 per 1,000 | 83 per 1,000 | OR 0.61 | 4956 | ⊕⊝⊝⊝ | |
| 4.5 Quality of LIfe: Comparison of Change from Baseline Values | The mean Quality of LIfe: Comparison of Change from Baseline Values was 0 | SMD 0.45 higher | ‐ | 3012 | ⊕⊕⊝⊝ | |
| 4.7 Anxiety Symptom Rating ‐ Comparison of Values at Endpoint | The mean Anxiety Symptom Rating ‐ Comparison of Values at Endpoint was 0 | SMD 0.19 lower | ‐ | 333 | ⊕⊝⊝⊝ | |
| *The risk in the intervention group (and its 95% confidence interval) is based on the assumed risk in the comparison group and the relative effect of the intervention (and its 95% CI). | ||||||
| GRADE Working Group grades of evidence | ||||||
| 1 Overall risk of bias for this comparison was 'Some concerns' for 4/11 and 'high' for the remaining 6/11. In those with high risk, risk derived from randomisation (2), missing outcome data (2), and selective reporting (3). The combined weight of the studies with high risk is 61.8%. (1 high risk study. Lewis 2006, has no weight contribution because mean difference not estimable.) Therefore, risk of bias for this comparison was downgraded by 1 level to 'serious.' 2 Direction of effect had some variability (two studies, combined weight =18.8%, favoured control), while remaining studies favoured experimental arms. Magnitude of effect varied significantly and CIs had relatively poor overlap. Heterogeneity P < 0.00001, I2 = 92% suggesting very substantial statistical heterogeneity of effect. Therefore, inconsistency was downgraded by two levels to 'very serious.' 3 Studies retrieved and analysed for this review directly compare the population, interventions and outcomes of interest, as predefined, in our review protocol. 4 Performed optimal information size (OIS) (sample size) calculation, as per GRADE Handbook recommendations, which indicated OIS criterion was met for this outcome. Confidence interval does not include null and includes potential for important benefit. 5 Overall risk of bias for this comparison was 'Some concerns' for 1/2 and 'high' for the remaining 1/2. In those with high risk, risk derived from missing outcome data. The weight of the high risk study is 48.3%.Because there were only two studies for this comparison and both were either high or 'some concerns,' risk of bias for this comparison was downgraded by 1 level to 'serious.' 6 There was no variability in direction of effect, both studies favoured experimental arms. Magnitude of effect varied substantially and CIs had no overlap. Heterogeneity P = 0.002, I2 = 90% suggesting very substantial statistical heterogeneity of effect. Therefore, inconsistency was downgraded by two levels to 'very serious.' 7 Overall risk of bias for this comparison was 'high' for 4/9. In those with high risk, risk derived from randomisation (1), missing outcome data (1), and selective reporting (2). The combined weight of the studies with high risk is 51.3%. Therefore, risk of bias for this comparison was downgraded by 1 level to 'serious.' 8 There was variability in direction of effect (three studies, combined weight=31,6%, favoured control), while remaining studies favoured experimental arms. Magnitude of effect varied substantially and CIs had modest overlap. Heterogeneity P < 0.00001, I2 = 79% suggesting very substantial statistical heterogeneity of effect.Therefore, inconsistency was downgraded by two levels to 'very serious.' 9 Performed OIS (sample size) calculation, as per GRADE Handbook recommendations, which indicated OIS criterion was met for this outcome. Confidence interval includes null and includes potential for important benefit.Therefore, imprecision was downgraded by 1 level to 'serious.' 10 There was variability in direction of effect (five studies, combined weight = 35.4%, favoured control), while remaining studies favoured experimental arms. Magnitude of effect varied substantially and CIs had modest overlap. Heterogeneity P < 0.00001, I2 = 85% suggesting very substantial statistical heterogeneity of effect.Therefore, inconsistency was downgraded by two levels to 'very serious.' 11 Overall risk of bias for this comparison was 'high' for 6/11 studies. In those with high risk, risk derived from randomisation (2), missing outcome data (2), and selective reporting (2). The combined weight of the studies with high risk is 52.80%. Therefore, risk of bias for this comparison was downgraded by 1 level to 'serious.' 12 Overall risk of bias for this outcome is 'high' for all, or nearly all, included studies because, for all or nearly all studies assessed for this outcome, the following were true: a) outcome assessors (whether participant or investigator) were aware of the intervention received by study participants, b) the outcome assessment could have been influenced by knowledge of the intervention received (because each involves some judgement by the assessor, whether participant or investigator) and c) we have no further information that would permit further adjudication of the likelihood that outcome assessment was influenced by knowledge of the intervention received.Therefore, risk of bias for this comparison was downgraded by 1 level to 'serious.' 13 There was no variability in direction of effect, both studies favoured experimental arms. Magnitude of effect varied substantially and CIs had minimal overlap. Heterogeneity P = 0.03, I2 = 79% suggesting considerable heterogeneity of effect.Therefore, inconsistency was downgraded by 1 level to 'serious.' 14 Sample size likely sufficient. Confidence interval does not include null, but also likely does not include potential for important benefit (i.e. standardised mean difference of at least 1). No downgrade. 15 Overall risk of bias for this outcome is 'high' for all, or nearly all, included studies because, for all or nearly all studies assessed for this outcome, the following were true: a) outcome assessors (whether participant or investigator) were aware of the intervention received by study participants, b) the outcome assessment could have been influenced by knowledge of the intervention received (because each involves some judgement by the assessor, whether participant or investigator) and c) we have no further information that would permit further adjudication of the likelihood that outcome assessment was influenced by knowledge of the intervention received. Additionally, a different anxiety symptom rating scale was used for each and they targeted different dimensions of anxiety (e.g. state vs. trait). Therefore, risk of bias for this comparison was downgraded by 2 levels to 'very serious.' 16 Sample size for this comparison relatively small, OIS probably not met (approximated based on comparison of means for study with highest weight). CI includes null but likely does not include important benefit/harm.Therefore, imprecision was downgraded by 1 level to 'serious.' | ||||||
| Study | N Screened | Entered | Completed | % Screened | % Entered |
| NA | 12 | 12 | NA | 100 | |
| 339 | 227 | 183 | 54 | 81 | |
| 479 (only 2 of 4 treatment arms included in this review) | 83 | 78 | 16 | 94 | |
| 294 | 206 | 177 | 60 | 86 | |
| 246 | 133 | 133 | 54 | 100 | |
| 5100 | 3100 | 2836 | 56 | 91 | |
| 85 | 80 | 80 | 94 | 100 | |
| NA (75% of those approached agreed to participate) | 33 | 33 | NA | 100 | |
| 61 | 41 | 40 | 66 | 98 | |
| NA | 30 | 30 | NA | 100 | |
| NA | 49 | 49 | NA | 100 | |
| 533 | 206 | 161 | 30 | 78 | |
| NA | 75 | 54 | NA | 72 | |
| 127 | 46 | 37 | 29 | 80 | |
| NA | 80 | 80 | NA | 100 | |
| NA | 108 | 97 | NA | 90 | |
| 1873 | 1455 | 1236 | 66 | 85 | |
| 212 | 100 | 98 | 46 | 98 | |
| 74 | 72 | 58 | 78 | 81 | |
| 107 | 107 | 82 | 77 | 76 | |
| 133 | 112 | 112 | 84 | 100 | |
| 140 | 140 | 122 | 87 | 87 | |
| 132 | 106 | 94 | 71 | 89 | |
| 49 | 39 | 37 | 76 | 95 | |
| NA | 112 | 85 | NA | 76 | |
| NA | 306 | 239 | NA | 78 | |
| 109 | 100 | 96 | 88 | 96 | |
| NA | 30 | 28 | NA | 93 | |
| 490 | 115 | 115 | 23 | 100 | |
| 431 | 118 | 103 | 24 | 87 | |
| NA | 28 | 28 | NA | 100 | |
| 391 | 379 | 377 | 96 | 99 | |
| NA | 66 | 65 | NA | 98 | |
| NA | 19 | 19 | NA | 100 | |
| NA | 97 | 73 | NA | 75 | |
| NA | 202 | 146 | NA | 72 | |
| 423 | 250 | 222 | 52 | 89 | |
| 91 | 45 | 40 | 44 | 89 | |
| NA | 241 | 240 | NA | 99 | |
| NA | 100 | 100 | NA | 100 | |
| NA | 152 | 130 | NA | 86 |
| Variable | Behavioural (BEH) | Educational (EDU) | Supportive (SUP) | Mixed (MIX) |
| N (total randomised) | 989 | 1878 | 1962 | 5041 |
| Age in years (Mean, SD) | 56.44 (5.76) | 52.73 (4.68) | 53.94 (4.88) | 52.55 (5.46) |
| BMI (Mean, SD) | 32.31 (2.90) | 34.19 (3.51) | 33.19 (2.02) | 33.73 (2.80) |
| Sex (% female)* | 34.38 | 29.98 | 24.68 | 32.44 |
| AHI (Mean, SD) | 38.08 (9.04) | 39.72 (12.25) | 41.11 (10.52) | 38.82 (10.62) |
| ESS (Mean, SD) | 12.80 (4.02) | 11.27 (1.29) | 10.47 (1.50) | 12.53 (1.92) |
| * Percentage female calculated based on studies reporting statistics on gender (those not reporting excluded from calculation). | ||||
| Intervention Details | Behavioural (BEH), (median, IQR) | Educational (EDU), (median, IQR) | Supportive (SUP), (median, IQR) | Mixed (MIX), (median, IQR) |
| Study duration (weeks) | 12 (12‐52) | 12 (6‐26) | 12 (12‐16) | 14 (12‐52) |
| Intervention duration (weeks) | 4 (2‐12) | 0 (0‐4.5)* | 12 (9‐13) | 12 (10‐25) |
| # of Intervention episodes | 3 (3‐14) | 2 (1‐6) | NR (MOST) | 7 (5‐10) |
| Contact time (minutes) | 90 (80‐240) | 21 (11‐105) | NR | 75 (33‐143) |
| * Educational interventions that took place in a single participant interaction (e.g., dispensing written material, single presentation) were assigned a duration of '0' weeks. Abbreviations: IQR: interquartile range; NR: not reported; NR (MOST): most studies did not report. | ||||
| Study | Studies employing Educational Intervention | Control | Study duration (weeks) | |
| Increased support and reinforcement components (if applicable) | Increased educational components | |||
| 2 x 45‐minute education sessions regarding pathophysiology of apnoea, medical and behavioral consequences, and the benefits of treatment; presented in standardised formats, with no tailoring to participant readiness, 1 booster call from sleep nurse | Usual care | 52 | ||
| One 10‐minute educational video session on OSA and CPAP | Usual care | 24 | ||
| Written information on OSA and CPAP | Usual care | 8 | ||
| Two consecutive PSG videos on the computer screen: the first recorded during a standard diagnostic overnight polysomnography, and the second during a full‐night polysomnography with nasal CPAP | Usual care | 52 | ||
| Education about OSA pathophysiology , health‐related risks, impact on daytime vigilance, introduction to CPAP therapy | Usual care | 12 | ||
| Positively or negatively framed messages in addition to CPAP. Patients were phoned weekly and read framed messages (≤ 6 phone calls per patient). | Usual care | 6 | ||
| Slide presentation and written information on OSA and CPAP and 2 x 1‐hour CBT sessions | Usual care | 4 | ||
| Personalised feedback report, including detailed information OSA and its associated risk and barriers to CPAP use and attitudes to change | Usual care | 12 | ||
| 1 x 20‐minute educational session by a sleep medicine physician, including: viewing his/her own PSG chart on morning post PAP‐titration, comparing PSG from diagnostic and CPAP titration studies with explanations that emphasized obstructive events and oxygen desaturations, and the disappearance of those signs on PAP treatment. | Usual care | 24 | ||
| 1 x 1‐hour educational session with information regarding OSA, its symptoms and risks, APAP treatment, the importance of good adherence, and different machine interfaces. | Usual care | 24 | ||
| Two additional nights of CPAP titration | 4‐hour group education session, written information, video CD | Usual care | 12 | |
| Abbreviations: CBT: Cognitive behavioural therapy; CD: compact disc; CPAP: continuous positive air pressure; OSA: obstructive sleep apnoea; PAP: positive air pressure; PSG: polysomnography | ||||
| Study | Studies employing Supportive Intervention | Control | Study duration (weeks) | |
| Increased support and reinforcement components | Increased educational components (if applicable) | |||
| Weekly telephone calls to monitor progress and troubleshoot | Usual care | 8 | ||
| Computer‐based telecommunication system allowing for monitoring and reinforcing compliance | Education via computer‐based telecommunication system | Usual care | 8 | |
| Telecomunication system for daily monitoring of CPAP usage, timely detection and troubleshooting of problems | Usual care | 12 | ||
| Telemonitoring device forair leaks, residual AHI > 10/h, or CPAP use less than 3 hours for 3 days | Usual care | 12 | ||
| 2 additional titration nights in hospital, 4 additional home visits by sleep nurses | Initial education at home with partner | Usual care | 24 | |
| Automatic processing of device data. Where CPAP usage thresholds met, automated message encouraged participant to improve use/positive reinforcement | Usual care | 12 | ||
| Participants equipped with smartphone for uploading BP, CPAP adherence, sleepiness, and QoL data. They received daily pictograms containing health‐related messages | Usualo care | 16 | ||
| Web‐based app used to monitor adherence and automatically message patients and providers when pre‐set conditions met | Usual care | 12 | ||
| 2 individual sessions and 8 telephone conversations with trained peer CPAP users providing support and sharing their positive experience with CPAP | Usual care | 12 | ||
| BP and physical activity recorded by multimodal telemonitoring device and electronic questionnaires completed by patients. Automatic algorithms constructed for prompt adjustment of CPAP treatment. | Usual care | 24 | ||
| Daily wireless telemonitoring of compliance and treatment efficacy and acting on the data via prespecified clinical pathways | Usual care | 8 | ||
| Telemonitoring device collecting daily CPAP adherence viewable by both patient and provider. Troubleshooting and feedback provided when necessary | Usual care | 16 | ||
| Daily CPAP adherence, CPAP pressures, mask leak and residual respiratory events transmitted into a web database. Case by case guidance provided by provider when signalled by automatic alarm in the web database | Usual care | 12 | ||
| Abbreviations: AHI: apnoea hypopnoea index; BP: Blood pressure; CPAP: continuous positive air pressure; QoL: quality of life. | ||||
| Study | Studies employing Behavioural Intervention | Control | Study duration (weeks) | ||
| Increased support and reinforcement components (if applicable) | Increased educational components (if applicable) | Behavioural therapy | |||
| Elements of education on consequences of OSA and efficacy of CPAP | 2 x 45‐minute sessions of CBT interventions | 2 x 45‐minute sessions on sleep architecture and sleep clinic | 12 | ||
| 2 x 45‐minute sessions of MET, one booster phone call | Usual care | 52 | |||
| Eight ‐ hour in person MET session | Usual care | 52 | |||
| 1 x 10‐minute MET session | Usual care | 8 | |||
| Thirty‐six myofunctional therapy sessions | Usual care | 36 | |||
| One brief MET session (video and patient interview), followed by a follow‐up phone call | Usual Care | 12 | |||
| 45‐Minute individual education session | Three 30‐minute sessions of MET | 45‐Minute educational session + usual care | 52 | ||
| 3 interactive sessions, video with discussion, focus group and role play, respectively 1, 2 and 3 months after receiving the CPAP device. | Usual Care | 52 | |||
| Audiotaped music and softly spoken directions on relaxation techniques and habit‐promoting instructions for using CPAP nightly. Information packet,including CPAP use reminder placard, handouts on benefits of CPAP adherence and health consequences of poor compliance, 4‐week diary for recording experience with CPAP | Audiotaped music with softly spoken information on vitamins, informational packet on vitamins and health. | 12 | |||
| Automated telephone‐linked communication system designed around the concept of Motivational Interviewing, which allowed one to assess and enhance CPAP compliance | Education on unrelated health topics via automated telephone‐linked communication system | 52 | |||
| One night of CPAP titration in the hospital | 12 x 40‐minute group PMR practice sessions over 12 weeks, one per week. Self‐practice of PMR before each CPAP treatment. Brochure and CD with a guide for PMR practice at home. | Usual care | 12 | ||
| Abbreviations: CBT: Cognitive behavioural therapy; CPAP: continuous positive air pressure; MET: Motivational Enhancement Therapy;OSA: obstructive sleep apnoea; PMR: progressive muscle relaxation; | |||||
| Study | Studies employing Mixed Intervention | Control | Study duration (weeks) | ||
| Increased support and reinforcement components | Increased educational components | Behavioural therapy | |||
| 1 x 30 minute group education session | 1 x 35‐minute intervention based on SCT , including perceived self‐efficacy, outcome expectations, and social support | Usual care + a 30‐minute group education session and social period matching the duration of the intervention | 24 | ||
| Two phone calls from study nurse to discuss CPAP use, 1 month of sleep diary review by sleep specialist, and 6 in‐person follow‐ups involving patient's family or spouse | 1 x 15 minute video education session covering OSA topics, followed by 10‐minute lecture to reinforce key topics | Usual care | 104 | ||
| Personalised guidance from a study nurse, home visits from a nurse discussing lifestyle management, mental well‐being, and 1 x 30‐minute consultation with a sleep physician | 1 x pre‐treatment OSA educational video | Usual care | 52 | ||
| 2 additional early reviews by sleep physician and frequent telephone calls by sleep nurses | Videotape and additional education session | Usual care | 12 | ||
| Intervention based on automatic processing of device data. If CPAP usage thresholds were met, a message was automatically sent to the patient providing encouragement to improve use or positively reinforcing successful adherence. | Education about pathophysiology of OSA, health‐related risks, impact on daytime vigilance, introduction to CPAP therapy | Usual care | 12 | ||
| 1 additional early review by sleep physician and 1 early telephone interview with sleep nurse | Educational video | Usual care | 52 | ||
| 4 additional home visits in the first 3 months by sleep practitioner for problem solving | Written information and detailed explanation by the prescriber, additional education during home visits | Written information and detailed explanation by the prescriber + usual care | 52 | ||
| Educational DVD on sleep apnoea and PSG review | 4 x 30‐60 minute sessions addressing cognitive perceptions of the OSA and CPAP, outcome expectancies with PAP treatment, and PAP treatment self‐efficacy, all domains of SCT | Usual care and an informational pamphlet about OSA, diagnosis and PAP prescription provided by sleep centre | 12 | ||
| 5 x standardised support sessions through telephone‐based counselling | Education addressing knowledge about OSA, disadvantage or obstacles to CPAP | Usual care | 16 | ||
| 2 x support calls with study investigator to promote the use of CPAP | 1 x educational session using an airway model along with a video and worksheet on OSA, and a report card to document OSA severity, CPAP setting and use and participant self‐evaluation | Usual care | 4 | ||
| Home video‐link sessions delivered by nurse, who guided correct CPAP use and provided problem solving | Nurse provided education on CPAP and OSA | Home video‐link sessions similar in form to intervention but directed activities in neutral health topics (vitamin intake) | 12 | ||
| Three nights of CPAP titration in the hospital | 4‐hout group education session, written information, video CD | 12 x 40 minute group PMR practice sessions over 12 weeks | Usual care | 12 | |
| Abbreviations: CPAP: continuous positive air pressure;DVD: Digital versatile disc; OSA: obstructive sleep apnoea; PAP: positive air pressure; PSG: polysomnography; SCT: social cognitive therapy | |||||
| Class | Full class effect estimate, MD (95% CI) | Sensitivity: excluding high RoB studies (MD, 95%CI) |
| Behavioural | 1.31 (0.95 to 1.66) I2 = 0% | 1.05 (0.57 to 1.53)1 I2 = 0% |
| Educational | 0.85 (0.32 to 1.39) I2 = 68% | 0.98 (0.07 to 1.89)2 I2 = 86% |
| Supportive | 0.70 (0.36 to 1.05) I2 = 42% | 0.75 (0.42 to 1.09)3 I2 = 34% |
| Mixed | 0.82 (0.20 to 1.43) I2 = 92% | NA |
| 1. Included in sensitivity analysis: Aloia 2013; Bakker 2016; Dantas 2015; Olsen 2012 2. Included in sensitivity analysis: Aloia 2013; Basoglu 2011; Hwang 2017; Richards 2007 3. Included in sensitivity analysis: Fox 2012; Hoy 1999; Hwang 2017; Stepnowsky 2013; Turino 2017 | ||
| Class | Full class effect estimate, MD (95%CI) | Intervention duration, MD (95%CI) | Contact episodes: 1 vs. > 1, MD (95%CI) | Total contact time: > vs. ≤ 60 minutes, MD (95%CI) |
| Behavioral | 1.31 (0.95 to1.66) I2 = 0% | > 4 weeks1: 1.21 (0.60 to 1.82) I2 = 0% ≤ 4 weeks2: 1.38 (0.80 to 1.95) I2 = 38% Test for subgroup differences: Chi² = 0.15, df = 1 (P = 0.70), I² = 0% | > 1 episode3: 1.35 (0.94 to 1.77) I2 = 9% 1 episode4: 1.10 (0.26 to1.94) I2 = 0% Test for subgroup differences: Chi² = 0.28, df = 1 (P = 0.60), I² = 0% | > 60 minutes5: 1.15 (0.71 to 1.60); I2 = 0% ≤ 60 minutes6: 1.56 (0.68 to 2.44); I2 = 57% Test for subgroup differences: Chi² = 0.64, df = 1 (P = 0.42), I² = 0% |
| Educational | 0.85 (0.32 to 1.39) I2 = 68% | > 4 weeks7: 0.33 (‐0.10 to 0.77); I2 = 0% ≤ 4 weeks8: 1.20 (0.39 to2.01); 12=75% Test for subgroup differences: Chi² = 3.36, df = 1 (P = 0.07), I² = 70.2% | > 1 episode9: 1.20 (0.41 to2.00); I2 = 70% 1 episode10: 0.40 (‐0.06 to 0.86); I2 = 0% Test for subgroup differences: Chi² = 2.96, df = 1 (P = 0.09), I² = 66.2% | > 60 minutes11: 1.46 (0.22 to 2.71); I2 = 82% ≤ 60 minutes12: 0.61 (0.00 to 1.22); I2 = 37% Test for subgroup differences: Chi² = 1.47, df = 1 (P = 0.23), I² = 31.9% |
| Supportive | 0.70 (0.36 to 1.05) I2 = 42% | > 12 weeks13: 0.49 (‐0.53 to 1.51); I2 = 77% ≤ 12 weeks14: 0.72 (0.43 to 1.01); I2 = 0% Test for subgroup differences: Chi² = 0.17, df = 1 (P = 0.68), I² = 0% | NA | NA |
| Mixed | 0.82 (0.20 to 1.43) I2 = 92% | > 4 weeks15: 1.22 (0.60 to 1.83); I2 = 91% ≤ 4 weeks16: ‐0.31 (‐0.83 to 0.21); I2 = 0% Test for subgroup differences: Chi² = 13.79, df = 1 (P = 0.0002), I² = 92.7% | > 1 episode17: 0.98 (0.32 to 1.62); I2 = 92% 1 episode18: ‐0.60 (‐1.33 to 0.13); I2 = 93% Test for subgroup differences: Chi² = 9.94, df = 1 (P = 0.002), I² = 89.9% | > 60 minutes19: 1.45 (0.73 to 2.16); I2 = 91% ≤ 60 minutes20: ‐0.15 (‐0.56 to 0.27); I2 = 0% Test for subgroup differences: Chi² = 14.14, df = 1 (P = 0.0002), I² = 92.9% |
| 1. Bakker 2016; Diaferia 2017; Wang 2012 2. Aloia 2001; Aloia 2013; Dantas 2015; Lai 2014; Olsen 2012 3. Aloia 2001; Aloia 2013; Bakker 2016; Diaferia 2017; Lai 2014; Olsen 2012; Wang 2012 4. Dantas 2015 5. Aloia 2001; Aloia 2013; Bakker 2016; Diaferia 2017; Olsen 2012; Wang 2012 6. Dantas 2015; Lai 2014 7. Hwang 2017; Pengo 2018; Wang 2012 8. Aloia 2013; Basoglu 2011; Chervin 1997; Falcone 2014; Richards 2007; Roecklein 2010; Sarac 2017 9. Aloia 2013; Chervin 1997; Richards 2007; Sarac 2017; Pengo 2018; Wang 2012 10. Basoglu 2011; Falcone 2014; Roecklein 2010 11. Aloia 2013; Richards 2007; Wang 2012 12. Basoglu 2011; Chervin 1997; Falcone 2014; Sarac 2017 13. Hoy 1999; Mendelson 2014; Parthasarathy 2013; Pepin 2019 14. Chervin 1997; DeMolles 2004; Fox 2012; Hoet 2017; Hwang 2017; Munafo 2016; Stepnowsky 2007; Stepnowsky 2013; Turino 2017 15. Bouloukaki 2014; Chen 2015; Hui 2000; Hwang 2017; Meurice 2007; Sedkaoui 2015; Wang 2012 16. Bartlett 2013; Sawyer 2017; Shapiro 2017 17. Bouloukaki 2014; Chen 2015; Hui 2000; Meurice 2007; Sawyer 2017; Sedkaoui 2015; Shapiro 2017; Wang 2012 18. Bartlett 2013 19. Bouloukaki 2014; Chen 2015; Sawyer 2017; Sedkaoui 2015; Wang 2012 | ||||
| Class | All supportive interventions, MD (95%CI) | Intervention involved human support, MD (95%CI) | Intervention involved scheduled human support, MD (95%CI) |
| Supportive | 0.70 (0.35 to 1.05) I2 = 42% | Any human support1: 0.84 (0.52 to 1.17) I2 = 10% Automated support only2: 0.26 (‐0.51 to 1.04) I2 = 64% Test for subgroup differences: Chi² = 1.85, df = 1 (P = 0.17), I² = 46.0% | Pre‐scheduled human support3: 1.43 (0.61 to 2.24) I2 = 0% No Scheduled human support4: 0.58 (0.33 to 0.83) I2 = 45% Test for subgroup differences: Chi² = 3.82, df = 1 (P = 0.05), I² = 73.8% |
| 1. Chervin 1997; Fox 2012; Hoet 2017; Hoy 1999; Parthasarathy 2013; Pepin 2019; Stepnowsky 2007; Stepnowsky 2013; Turino 2017 2. DeMolles 2004; Hwang 2017; Mendelson 2014; Munafo 2016 3. Chervin 1997; Hoy 1999; Parthasarathy 2013 4. DeMolles 2004; Fox 2012; Hoet 2017; Hwang 2017; Mendelson 2014; Munafo 2016; Pepin 2019; Stepnowsky 2007; Stepnowsky 2013; Turino 2017 | |||
| Class | Updated Review (Askland 2019) Classification Decision, MD (95%CI) | Sensitivity: Original (Wozniak 2014) Classification Decision, MD (95%CI) |
| Behavioral | 1.31 (0.95 to1.66) I2 = 0% | 1.47 (1.12 to 1.83) I2 = 48% |
| Educational | 0.85 (0.32 to 1.39) I2 = 68% | 0.48 (0.21 to 0.76) I2 = 0% |
| Supportive | 0.70 (0.36 to 1.05) I2 = 42% | 0.58 (0.36 to 0.81) I2 = 45% |
| Class | Full Class Effect Estimates | Exclude endpoints NOT 3 months |
| Behavioral | 1.31 (0.95 to 1.66) I2 = 0% | 1.38 (0.97 to 1.79) |
| Educational | 0.85 (0.32 to 1.39) I2 = 68% | 0.63 (0.26 to 1.00) |
| Supportive | 0.70 (0.36 to 1.05) I2 = 42% | 0.67 (0.29 to 1.04) |
| Mixed | 0.82 (0.20 to 1.43) I2 = 92% | 1.09 (0.21 to 1.97) |
| Full class effect estimates are those derived in our primary analyses, which includes the data from each included study closest to our primary 3‐month endpoint. That is, if no 3‐month endpoint data were available for a study, the endpoint closest to (and later than) 3 months was used. For example if a study reported data at 2 months and 4 months post‐intervention, the 4‐month endpoint data were used. If only a single endpoint was reported by authors (e.g. Bouloukaki 2014 reported only 2‐year endpoint), data for that endpoint was used. | ||
| Outcome or subgroup title | No. of studies | No. of participants | Statistical method | Effect size |
| 1 CPAP Device Usage (hours/night) Show forest plot | 10 | 1128 | Mean Difference (IV, Random, 95% CI) | 0.85 [0.32, 1.39] |
| 2 Machine usage, sensitivity analysis: adherence in control group < four hours/night Show forest plot | 6 | 698 | Mean Difference (IV, Random, 95% CI) | 0.85 [0.06, 1.64] |
| 3 N deemed adherent (≥ four hours/night) Show forest plot | 7 | 1019 | Odds Ratio (M‐H, Random, 95% CI) | 2.58 [1.50, 4.44] |
| 4 Withdrawal Show forest plot | 9 | Odds Ratio (M‐H, Random, 95% CI) | Totals not selected | |
| 5 Epworth Sleepiness Scale ‐ Comparison of Values at Endpoint Show forest plot | 3 | Mean Difference (IV, Random, 95% CI) | Totals not selected | |
| Outcome or subgroup title | No. of studies | No. of participants | Statistical method | Effect size |
| 1 CPAP Device Usage (hours/night) Show forest plot | 13 | 1426 | Mean Difference (IV, Random, 95% CI) | 0.70 [0.36, 1.05] |
| 2 Machine usage, sensitivity analysis: adherence in control group < four hours/night Show forest plot | 7 | 735 | Mean Difference (IV, Fixed, 95% CI) | 0.91 [0.57, 1.25] |
| 3 N deemed adherent (≥ four hours/night) Show forest plot | 2 | 376 | Odds Ratio (M‐H, Fixed, 95% CI) | 1.68 [1.08, 2.60] |
| 4 Withdrawals Show forest plot | 11 | 1702 | Odds Ratio (M‐H, Fixed, 95% CI) | 1.27 [0.97, 1.66] |
| 5 Epworth Sleepiness Scale ‐ Comparison Endpoint or Change from Baseline Values Show forest plot | 9 | Mean Difference (IV, Fixed, 95% CI) | Subtotals only | |
| 5.1 ESS: Endpoint Scores | 6 | 700 | Mean Difference (IV, Fixed, 95% CI) | 0.03 [‐0.59, 0.64] |
| 5.2 ESS: Change from Baseline | 5 | 470 | Mean Difference (IV, Fixed, 95% CI) | ‐0.32 [‐1.19, 0.56] |
| 6 Quality of Life: Comparison of Values at Endpoint Show forest plot | 7 | 683 | Std. Mean Difference (IV, Fixed, 95% CI) | 0.16 [0.01, 0.31] |
| 6.1 QoL: FOSQ ‐ Endpoint | 3 | 109 | Std. Mean Difference (IV, Fixed, 95% CI) | 0.15 [‐0.23, 0.53] |
| 6.2 QoL: SAQLI ‐ Endpoint | 1 | 240 | Std. Mean Difference (IV, Fixed, 95% CI) | 0.22 [‐0.04, 0.47] |
| 6.3 QoL: SF‐36 (PH) ‐ Endpoint | 3 | 334 | Std. Mean Difference (IV, Fixed, 95% CI) | 0.13 [‐0.09, 0.34] |
| 7 Quality of LIfe: Comparison of Change from Baseline Values Show forest plot | 3 | 294 | Std. Mean Difference (IV, Fixed, 95% CI) | 0.22 [‐0.01, 0.45] |
| 7.1 QoL: FOSQ ‐ Change from Baseline | 1 | 39 | Std. Mean Difference (IV, Fixed, 95% CI) | 0.24 [‐0.40, 0.87] |
| 7.2 QoL: SF‐36 (PH) ‐ Change from Baseline | 1 | 82 | Std. Mean Difference (IV, Fixed, 95% CI) | 0.04 [‐0.40, 0.47] |
| 7.3 QoL: FOSQ‐10 ‐ Change from Baseline | 1 | 173 | Std. Mean Difference (IV, Fixed, 95% CI) | 0.30 [0.00, 0.60] |
| 8 Anxiety Symptom Rating (HADS‐A) ‐ Comparison of Values at Endpoint Show forest plot | 1 | Mean Difference (IV, Fixed, 95% CI) | Totals not selected | |
| 9 Machine usage, sensitivity analysis: excluding study with opposite direction of effect (authors suggest negative effect of intervention) Show forest plot | 12 | 1319 | Mean Difference (IV, Random, 95% CI) | 0.74 [0.49, 0.98] |
| 10 AHI on treatment ‐ Comparison of Values at Endpoint Show forest plot | 2 | Mean Difference (IV, Fixed, 95% CI) | Totals not selected | |
| 11 Depression Symptom Rating (HADS‐D, CES‐D) ‐ Comparison of Values at Endpoint Show forest plot | 3 | Std. Mean Difference (IV, Fixed, 95% CI) | Totals not selected | |
| 11.1 HADS‐Depression | 1 | Std. Mean Difference (IV, Fixed, 95% CI) | 0.0 [0.0, 0.0] | |
| 11.2 CES‐D | 2 | Std. Mean Difference (IV, Fixed, 95% CI) | 0.0 [0.0, 0.0] | |
| 12 Cost‐Effectiveness Show forest plot | 1 | Mean Difference (IV, Fixed, 95% CI) | Totals not selected | |
| 13 Machine usage, sensitivity analysis: excluding participants aware of machine usage Show forest plot | 2 | Mean Difference (IV, Fixed, 95% CI) | Totals not selected | |
| Outcome or subgroup title | No. of studies | No. of participants | Statistical method | Effect size |
| 1 CPAP Device Usage (hours/night) Show forest plot | 8 | 578 | Mean Difference (IV, Fixed, 95% CI) | 1.31 [0.95, 1.66] |
| 2 CPAP Device Usage (hours/night), sensitivity analysis: adherence in control group < four hours/night Show forest plot | 6 | 525 | Mean Difference (IV, Fixed, 95% CI) | 1.32 [0.93, 1.72] |
| 3 N deemed adherent (≥ four hours/night) Show forest plot | 6 | 549 | Odds Ratio (M‐H, Fixed, 95% CI) | 1.70 [1.20, 2.41] |
| 4 Withdrawal Show forest plot | 10 | 939 | Odds Ratio (M‐H, Fixed, 95% CI) | 0.66 [0.44, 0.98] |
| 5 Epworth Sleepiness Scale (Endpoint scores) Show forest plot | 5 | 271 | Mean Difference (IV, Random, 95% CI) | ‐2.42 [‐4.27, ‐0.57] |
| 6 AHI on treatment ‐ Endpoint Show forest plot | 2 | 89 | Mean Difference (IV, Fixed, 95% CI) | ‐0.95 [‐2.25, 0.35] |
| 7 Quality of Life ‐ Comparison of Values at Endpoint Show forest plot | 3 | 228 | Std. Mean Difference (IV, Fixed, 95% CI) | 0.00 [‐0.26, 0.26] |
| 7.1 QoL: FOSQ ‐ Endpoint | 2 | 200 | Std. Mean Difference (IV, Fixed, 95% CI) | 0.01 [‐0.26, 0.29] |
| 7.2 QoL: SF‐36 (PH) ‐ Endpoint | 1 | 28 | Std. Mean Difference (IV, Fixed, 95% CI) | ‐0.07 [‐0.82, 0.67] |
| Outcome or subgroup title | No. of studies | No. of participants | Statistical method | Effect size |
| 1 CPAP Device Usage (hours/night) Show forest plot | 11 | 4509 | Mean Difference (IV, Random, 95% CI) | 0.82 [0.20, 1.43] |
| 2 CPAP Device Usage, sensitivity analysis: adherence in control group < four hours/night Show forest plot | 2 | 343 | Mean Difference (IV, Random, 95% CI) | 1.77 [0.21, 3.34] |
| 3 N deemed adherent (≥ four hours/night) Show forest plot | 9 | 4015 | Odds Ratio (M‐H, Random, 95% CI) | 1.71 [1.08, 2.72] |
| 4 Withdrawal Show forest plot | 11 | 4956 | Odds Ratio (M‐H, Random, 95% CI) | 0.61 [0.28, 1.30] |
| 5 Quality of LIfe: Comparison of Change from Baseline Values Show forest plot | 2 | 3012 | Std. Mean Difference (IV, Random, 95% CI) | 0.45 [0.12, 0.78] |
| 5.1 QoL: FOSQ‐10 ‐ Change from Baseline | 1 | 176 | Std. Mean Difference (IV, Random, 95% CI) | 0.25 [‐0.05, 0.54] |
| 5.2 QoL: SF‐36 (PH) ‐ Change from Baseline | 1 | 2836 | Std. Mean Difference (IV, Random, 95% CI) | 0.59 [0.52, 0.67] |
| 6 Quality of Life: Comparison of Values at Endpoint Show forest plot | 4 | 3191 | Std. Mean Difference (IV, Random, 95% CI) | 0.45 [0.06, 0.83] |
| 6.1 QoL: FOSQ ‐ Endpoint | 1 | 177 | Std. Mean Difference (IV, Random, 95% CI) | 0.10 [‐0.19, 0.40] |
| 6.2 QoL: SF‐36 (PH) ‐ Endpoint | 3 | 3014 | Std. Mean Difference (IV, Random, 95% CI) | 0.59 [‐0.01, 1.19] |
| 7 Anxiety Symptom Rating ‐ Comparison of Values at Endpoint Show forest plot | 3 | 333 | Std. Mean Difference (IV, Random, 95% CI) | ‐0.19 [‐0.47, 0.09] |
| 7.1 DASS ‐ Anxiety | 1 | 177 | Std. Mean Difference (IV, Random, 95% CI) | ‐0.03 [‐0.32, 0.27] |
| 7.2 BAI | 1 | 65 | Std. Mean Difference (IV, Random, 95% CI) | ‐0.15 [‐0.63, 0.34] |
| 7.3 STAI ‐ State | 1 | 91 | Std. Mean Difference (IV, Random, 95% CI) | ‐0.49 [‐0.92, ‐0.06] |
| 8 Depression Symptom Rating ‐ Comparison of Values at Endpoint Show forest plot | 4 | Std. Mean Difference (IV, Fixed, 95% CI) | Totals not selected | |
| 8.1 BDI | 1 | Std. Mean Difference (IV, Fixed, 95% CI) | 0.0 [0.0, 0.0] | |
| 8.2 HADS ‐ Depression | 2 | Std. Mean Difference (IV, Fixed, 95% CI) | 0.0 [0.0, 0.0] | |
| 8.3 DASS ‐ Depression | 1 | Std. Mean Difference (IV, Fixed, 95% CI) | 0.0 [0.0, 0.0] | |
| 9 Epworth Sleepiness Scale Score Show forest plot | 7 | Mean Difference (IV, Random, 95% CI) | Totals not selected | |
| 9.1 ESS: Endpoint Scores | 5 | Mean Difference (IV, Random, 95% CI) | 0.0 [0.0, 0.0] | |
| 9.2 ESS: Change from Baseline | 3 | Mean Difference (IV, Random, 95% CI) | 0.0 [0.0, 0.0] | |
| Outcome or subgroup title | No. of studies | No. of participants | Statistical method | Effect size |
| 1 EDU: CPAP Device Usage (hours/night), original EDU study classification Show forest plot | 8 | 1095 | Mean Difference (IV, Fixed, 95% CI) | 0.48 [0.21, 0.76] |
| 2 SUP: CPAP Device Usage (hours/night), original SUP study classification Show forest plot | 14 | 1534 | Mean Difference (IV, Fixed, 95% CI) | 0.58 [0.36, 0.81] |
| 3 BEH: CPAP Device Usage (hours/night), original BEH study classification Show forest plot | 9 | 625 | Mean Difference (IV, Fixed, 95% CI) | 1.47 [1.12, 1.83] |
| 4 EDU: CPAP Device Usage (hours/night), exclude HIGH 'Risk of bias' studies Show forest plot | 4 | 642 | Mean Difference (IV, Random, 95% CI) | 0.98 [0.07, 1.89] |
| 5 SUP: CPAP Device Usage (hours/night), exclude HIGH 'Risk of bias' studies Show forest plot | 5 | 728 | Mean Difference (IV, Fixed, 95% CI) | 0.75 [0.42, 1.09] |
| 6 BEH: CPAP Device Usage (hours/night), exclude HIGH 'Risk of bias' studies Show forest plot | 4 | 340 | Mean Difference (IV, Fixed, 95% CI) | 1.05 [0.57, 1.53] |
| 7 MIX: CPAP Device Usage (hours/night), exclude HIGH 'Risk of bias' studies Show forest plot | 5 | Mean Difference (IV, Random, 95% CI) | Totals not selected | |
| Outcome or subgroup title | No. of studies | No. of participants | Statistical method | Effect size |
| 1 EDU: CPAP Device Usage (hours/night) Show forest plot | 10 | 1128 | Mean Difference (IV, Random, 95% CI) | 0.85 [0.32, 1.39] |
| 1.1 Intervention Duration > 4 weeks | 3 | 453 | Mean Difference (IV, Random, 95% CI) | 0.33 [‐0.10, 0.77] |
| 1.2 Intervention Duration ≤ 4 weeks | 7 | 675 | Mean Difference (IV, Random, 95% CI) | 1.20 [0.39, 2.01] |
| 2 EDU: CPAP Device Usage (hours/night) Show forest plot | 9 | 836 | Mean Difference (IV, Random, 95% CI) | 0.98 [0.36, 1.59] |
| 2.1 Contact Episodes: > 1 | 6 | 514 | Mean Difference (IV, Random, 95% CI) | 1.20 [0.41, 2.00] |
| 2.2 Contact Episodes: 1 (single) | 3 | 322 | Mean Difference (IV, Random, 95% CI) | 0.40 [‐0.06, 0.86] |
| 3 EDU: CPAP Device Usage (hours/night) Show forest plot | 8 | 808 | Mean Difference (IV, Random, 95% CI) | 1.04 [0.37, 1.71] |
| 3.1 Contact Time > 60 min | 3 | 293 | Mean Difference (IV, Random, 95% CI) | 1.46 [0.22, 2.71] |
| 3.2 Contact Time ≤ 60 min | 5 | 515 | Mean Difference (IV, Random, 95% CI) | 0.61 [0.00, 1.22] |
| 4 SUP: Subgroup Analysis ‐ CPAP Device Usage (hours/night) Show forest plot | 13 | 1426 | Mean Difference (IV, Random, 95% CI) | 0.70 [0.36, 1.05] |
| 4.1 Intervention Duration > 12 weeks | 4 | 530 | Mean Difference (IV, Random, 95% CI) | 0.49 [‐0.53, 1.51] |
| 4.2 Intervention duration ≤12 weeks | 9 | 896 | Mean Difference (IV, Random, 95% CI) | 0.72 [0.43, 1.01] |
| 5 SUP: Subgroup Analysis ‐ CPAP Device Usage (hours/night) Show forest plot | 13 | 1426 | Mean Difference (IV, Random, 95% CI) | 0.70 [0.36, 1.05] |
| 5.1 Intervention entailed Automated Contact Only | 4 | 513 | Mean Difference (IV, Random, 95% CI) | 0.26 [‐0.51, 1.04] |
| 5.2 Intervention included Human Contact | 9 | 913 | Mean Difference (IV, Random, 95% CI) | 0.84 [0.52, 1.17] |
| 6 SUP: Subgroup Analysis ‐ CPAP Device Usage (hours/night) Show forest plot | 13 | 1426 | Mean Difference (IV, Fixed, 95% CI) | 0.65 [0.41, 0.89] |
| 6.1 Scheduled, Human Interaction | 3 | 136 | Mean Difference (IV, Fixed, 95% CI) | 1.43 [0.61, 2.24] |
| 6.2 Automated and/or Ad‐hoc Human Contact only | 10 | 1290 | Mean Difference (IV, Fixed, 95% CI) | 0.58 [0.33, 0.83] |
| 7 BEH: Subgroup Analysis ‐ CPAP Device Usage (hours/night) Show forest plot | 8 | 577 | Mean Difference (IV, Random, 95% CI) | 1.31 [0.95, 1.66] |
| 7.1 BEH: Intervention Duration > 4 weeks | 3 | 208 | Mean Difference (IV, Random, 95% CI) | 1.21 [0.60, 1.82] |
| 7.2 BEH: Intervention Duration ≤ 4 weeks | 5 | 369 | Mean Difference (IV, Random, 95% CI) | 1.38 [0.80, 1.95] |
| 8 BEH: Subgroup Analysis ‐ CPAP Device Usage (hours/night) Show forest plot | 8 | 577 | Mean Difference (IV, Random, 95% CI) | 1.31 [0.95, 1.66] |
| 8.1 BEH: Contact Episodes: > 1 | 7 | 537 | Mean Difference (IV, Random, 95% CI) | 1.35 [0.94, 1.77] |
| 8.2 BEH: Contact Episodes: 1 (single) | 1 | 40 | Mean Difference (IV, Random, 95% CI) | 1.10 [0.26, 1.94] |
| 9 BEH: Subgroup Analysis ‐ CPAP Device Usage (hours/night) Show forest plot | 8 | 577 | Mean Difference (IV, Random, 95% CI) | 1.31 [0.95, 1.66] |
| 9.1 BEH: Contact Time > 60 | 6 | 437 | Mean Difference (IV, Random, 95% CI) | 1.15 [0.71, 1.60] |
| 9.2 BEH: Contact Time ≤ 60 | 2 | 140 | Mean Difference (IV, Random, 95% CI) | 1.56 [0.68, 2.44] |
| 10 MIX: Subgroup Analysis ‐ CPAP Device Usage (hours/night) Show forest plot | 11 | 4509 | Mean Difference (IV, Random, 95% CI) | 0.82 [0.20, 1.43] |
| 10.1 Intervention Duration > 4 weeks | 8 | 4178 | Mean Difference (IV, Random, 95% CI) | 1.22 [0.60, 1.83] |
| 10.2 Intervention Duration ≤ 4 weeks | 3 | 331 | Mean Difference (IV, Random, 95% CI) | ‐0.31 [‐0.83, 0.21] |
| 11 MIX: Subgroup Analysis ‐ CPAP Device Usage (hours/night) Show forest plot | 10 | 4242 | Mean Difference (IV, Random, 95% CI) | 0.79 [0.10, 1.48] |
| 11.1 Contact Episodes: > 1 | 9 | 4036 | Mean Difference (IV, Random, 95% CI) | 0.98 [0.32, 1.63] |
| 11.2 Contact Episodes: 1 (single) | 1 | 206 | Mean Difference (IV, Random, 95% CI) | ‐0.60 [‐1.33, 0.13] |
| 12 MIX: Subgroup Analysis ‐ CPAP Device Usage (hours/night) Show forest plot | 10 | 4242 | Mean Difference (IV, Random, 95% CI) | 0.79 [0.10, 1.48] |
| 12.1 Contact Time > 60 min | 6 | 3751 | Mean Difference (IV, Random, 95% CI) | 1.45 [0.73, 2.16] |
| 12.2 Contact Time ≤ 60 min | 4 | 491 | Mean Difference (IV, Random, 95% CI) | ‐0.15 [‐0.56, 0.27] |