Educational, supportive and behavioural interventions to improve usage of continuous positive airway pressure machines in adults with obstructive sleep apnoea
Información
- DOI:
- https://doi.org/10.1002/14651858.CD007736.pub3Copiar DOI

- Base de datos:
-
- Cochrane Database of Systematic Reviews
- Versión publicada:
-
- 07 abril 2020see what's new
- Tipo:
-
- Intervention
- Etapa:
-
- Review
- Grupo Editorial Cochrane:
-
Grupo Cochrane de Vías respiratorias
- Copyright:
-
- Copyright © 2020 The Cochrane Collaboration. Published by John Wiley & Sons, Ltd.
Cifras del artículo
Altmetric:
Citado por:
Autores
Contributions of authors
KDA: review conception/development, study screening/assessment, data extraction, data entry and analysis, and preparation of report (2019)
LW: review conception/development, study screening/assessment, data extraction, data entry and analysis, and preparation of report (2019)
TE: data extraction, data entry and analysis, and preparation of report (2019)
JC: review conception/development, data extraction (2019).
DRW: review conception/development, study screening/assessment (2013); data extraction (2013), data entry and analysis (2013); and preparation of report (2013 and 2019).
IS: review conception/development, study screening/assessment (2013), data extraction (2013) and analysis (2013), and preparation of report (2009, 2013 and 2019).
Previous author(s) no longer contributing to this version of the review
TJL: Study assessment (2009); data extraction, data entry and analysis (2009); write‐up (2013).
Vidya Nadig (2009): study assessment; data extraction; write‐up.
Contributions of editorial team
Rebecca Fortescue (Co‐ordinating Editor): edited the review; advised on methodology, interpretation and content.
Chris Cates (Co‐ordinating Editor) checked the data entry prior to the full write up of the review; advised on methodology, interpretation and content, approved the final review prior to publication.
Emma Dennett (Managing Editor): co‐ordinated the editorial process; advised on interpretation and content; edited the review.
Emma Jackson (Assistant Managing Editor): conducted peer review; obtained translations; edited the Plain language summary and reference sections of the protocol and the review.
Elizabeth Stovold (Information Specialist): designed the search strategy; ran the searches; edited the search methods section.
Sources of support
Internal sources
-
Royal Papworth NHS Trust, UK.
-
Waypoint Research Institute, Waypoint Centre for Mental Health Care, Canada.
External sources
-
The authors declare that no such funding was received for this systematic review, Other.
Declarations of interest
K. Askland: none known.
L. Wright: is employed by AstraZeneca Canada. AstraZeneca Canada has no financial interest in the findings of this non‐pharmaceutical review, nor do they have business involvement with CPAP devices or any competing interventions for sleep apnoea.
D. Wozniak: none known.
T. Emmanuel: none known.
J. Caston: none known.
I. Smith: 2018 speakers fee at conference sponsored by Fisher and Paykel (topic aviation medicine). 2018 support for conference attendance Itamar Medical, manufacturer of sleep diagnostic equipment.
Acknowledgements
The Background and Methods section of this review are based on a standard template used by Cochrane Airways.
We are very grateful to the Cochrane Airways Group, Elizabeth Stovold, Christopher J. Cates, and Toby J. Lasserson for providing ongoing support with searching for and retrieving studies for inclusion in the review, statistical analysis, and 'Risk of bias' assessment processes. We are also grateful for to the study authors who responded to our requests for additional data and information for this version of the review: Jessie Bakker (Bakker 2016), Jean Louis Pépin (Mendelson 2014), Daniela Scala (Scala 2012), Vito Falcone (Falcone 2014), Amy Sawyer (Sawyer 2017), Delwyn Bartlett (Bartlett 2013), Ronald Chervin (Chervin 1997), and Carol Smith (Smith 2006). We additionally acknowledge Massimo Attanasio and Adolfo Tambella for their translation of non‐English study articles (Scala 2012). Lastly, we acknowledge the contribution of Vidya Nadig to a previous version of this review (Smith 2009b).
The authors and Cochrane Airways are grateful to the following peer and consumer reviewers for their time and comments:
Martino F. Pengo, IRCCS Istituto Auxologico Italiano, Italy;
John Fleetham, The University of British Columbia, Canada;
José‐Ramón Rueda, University of the Basque Country, Spain;
Euphrasia Ebai‐Atuh Ndi (consumer), Cameroon;
Ozen K Basoglu, Ege University Faculty of Medicine, Turkey; and
Keith Wong, The University of Sydney, Australia
This project was supported by the National Institute for Health Research (NIHR), via Cochrane Infrastructure funding to the Cochrane Airways Group. The views and opinions expressed therein are those of the authors and do not necessarily reflect those of the Systematic Reviews Programme, NIHR, NHS, or the Department of Health.
Version history
| Published | Title | Stage | Authors | Version |
| 2020 Apr 07 | Educational, supportive and behavioural interventions to improve usage of continuous positive airway pressure machines in adults with obstructive sleep apnoea | Review | Kathleen Askland, Lauren Wright, Dariusz R Wozniak, Talia Emmanuel, Jessica Caston, Ian Smith | |
| 2014 Jan 08 | Educational, supportive and behavioural interventions to improve usage of continuous positive airway pressure machines in adults with obstructive sleep apnoea | Review | Dariusz R Wozniak, Toby J Lasserson, Ian Smith | |
| 2009 Apr 15 | Educational, supportive and behavioural interventions to improve usage of continuous positive airway pressure machines for adults with obstructive sleep apnoea | Review | Ian Smith, Vidya Nadig, Toby J Lasserson | |
Differences between protocol and review
The inclusion criteria of the current review varied slightly from the last publication (Wozniak 2014). Studies explicitly recruiting participants with a diagnosis of central sleep apnoea were excluded, and we elected to allow studies that utilised different makes of CPAP devices provided that proper randomisation was apparent and disproportionate representation of any one CPAP device in a treatment arm was unlikely. Subjective participant reports of the CPAP machine usage were not analysed as studies that included this outcome were not of sufficient quality to be considered meaningfully.
Due to considerable variation in endpoints, we elected to use an endpoint of three months (or the measured endpoint closest to three months) as it was both the modal endpoint across studies and, in our judgement, the most clinically‐relevant among those commonly reported.
'Risk of bias' assessments were conducted using both the previous 'Risk of bias1 ' tool (Higgins 2011) and the newly revised 'Risk of bias 2' tool (Sterne 2019). The 'Risk of bias 2' tool was employed to give an outcome‐level assessment of bias for the review's main outcome of interest (CPAP machine usage). The 'Risk of bias 1' tool was used to give a study‐level assessment of overall bias for all outcomes of interest. These tools were used for all 41 included studies in this review. Information derived from the application of both 'Risk of bias' tools were used in conducting the GRADE assessments; details are provided within the Methods section under 'Summary of findings' tables.
Relative to outcomes, we elected to add proportion of people adherent to CPAP (four hours/night), oxygen desaturation index (ODI), and cost‐effectiveness as secondary outcomes. Due to finding very few, or no studies in the previous review (Wozniak 2014), we excluded the following outcomes from the present review: maintenance of wakefulness, cardiovascular outcomes and adverse events.
For subgroup analyses, we planned to adjust the categorisation of apnoea hypopnoea index (AHI) severity (now mild (AHI ≥ 5 to < 15), moderate (AHI ≥ 15 to < 30), severe (AHI ≥ 30)), and to complete an additional stratification by baseline Epworth Sleepiness Scale score.
Multiple post‐hoc analyses were conducted for the main outcome of CPAP usage that were not previously specified in the protocol. These analyses were conducted to explore the effects of:
-
intervention classification decisions (updated review versus previous review) (Analysis 5.1, Analysis 5.2, Analysis 5.3);
-
excluding "high" risk of bias studies, within each class (Analysis 5.4, Analysis 5.5, Analysis 5.6);
-
grouping studies (within each class) based on intervention duration, number of contact episodes, and total contact time (Analysis 6.1; Analysis 6.2; Analysis 6.3; Analysis 6.4, Analysis 6.7; Analysis 6.8; Analysis 6.9; Analysis 6.10; Analysis 6.11; Analysis 6.12);
-
grouping studies (within the supportive class) based on whether there was human versus automated‐only (Analysis 6.5), and scheduled versus non‐scheduled human support (Analysis 6.6);
-
our selection of the modal three‐month endpoint (Additional Table 12, summary of analyses).
Careful considerations were given regarding the effects of interventions on cardiovascular outcomes related to obstructive sleep apnoea (OSA); these considerations can be found in Appendix 1.
Keywords
MeSH
Medical Subject Headings (MeSH) Keywords
- Bias;
- Cognitive Behavioral Therapy [*methods];
- Continuous Positive Airway Pressure [instrumentation, *statistics & numerical data];
- Disorders of Excessive Somnolence [epidemiology];
- Motivation;
- Patient Compliance [*statistics & numerical data];
- Patient Education as Topic [*methods];
- Randomized Controlled Trials as Topic;
- Reinforcement, Psychology;
- Sleep Apnea, Obstructive [psychology, *therapy];
- Time Factors;
Medical Subject Headings Check Words
Adult; Humans;
PICO
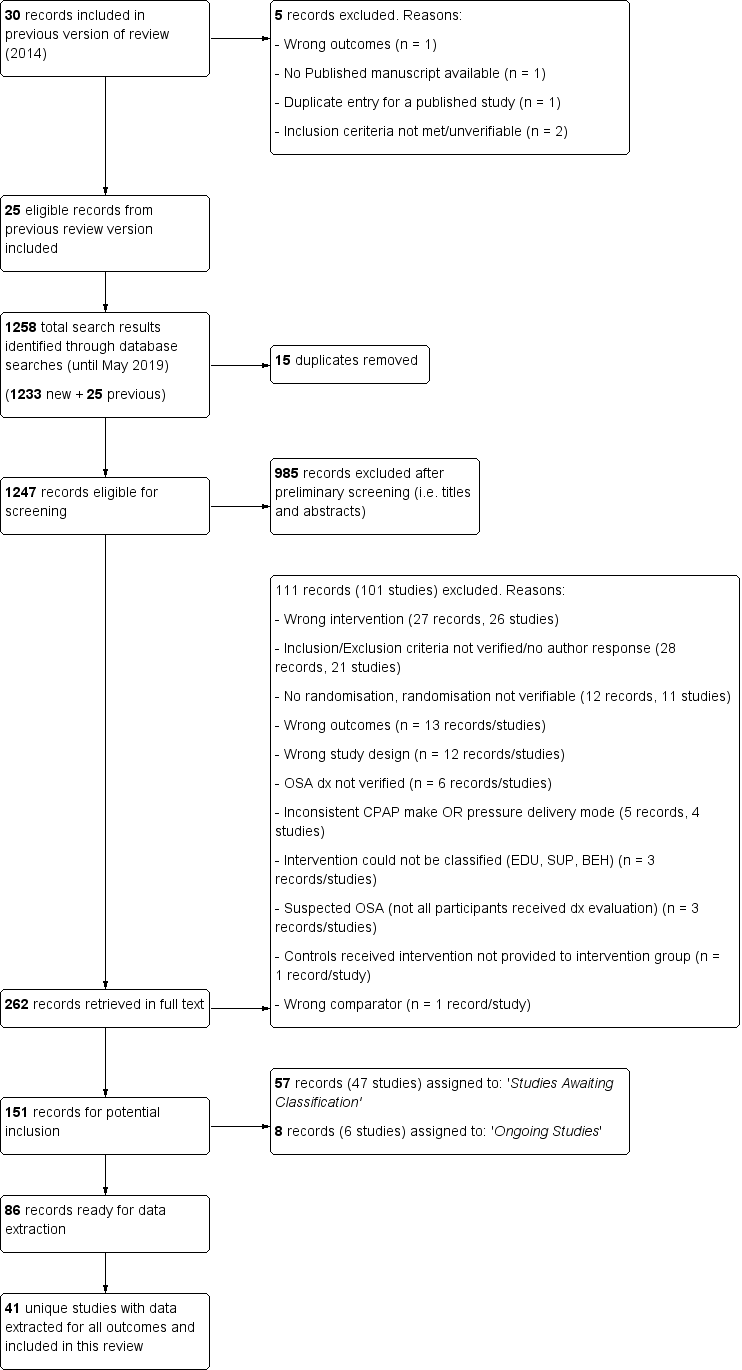
Study flow diagram.

'Risk of bias' summary: review authors' judgements about each risk of bias item for each included study.
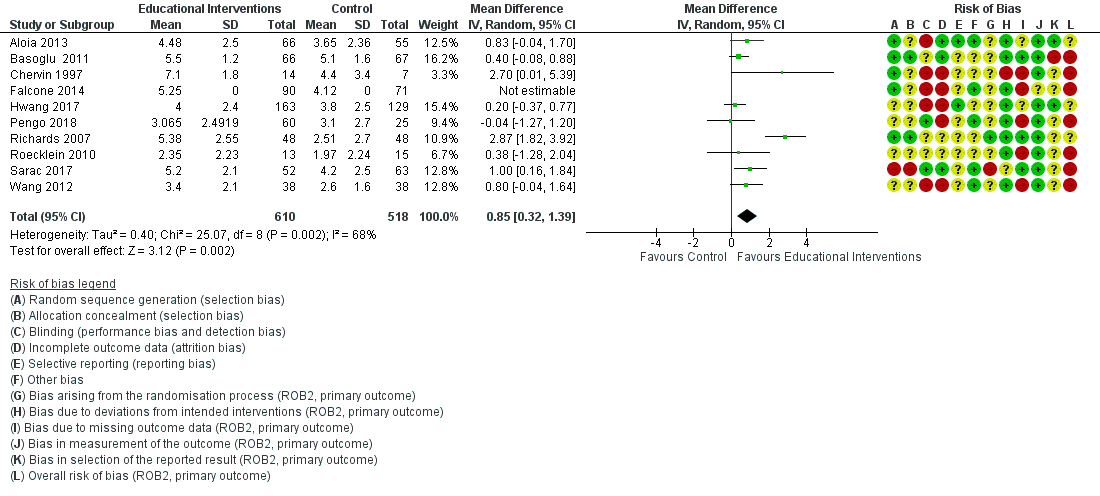
Forest plot of comparison: 1 Educational intervention versus control on primary outcome: CPAP Device Usage (hours/night).

Forest plot of comparison: 2 Supportive intervention versus control on primary outcome: CPAP Device Usage (hours/night).

Forest plot of comparison: 3 Behavioural intervention versus control on primary outcome: CPAP Device Usage (hours/night).

Forest plot of comparison: 4 Mixed (SUP/EDU/BEH) intervention versus control on primary outcome: CPAP Device Usage (hours/night).

Comparison 1 Educational intervention versus control, Outcome 1 CPAP Device Usage (hours/night).
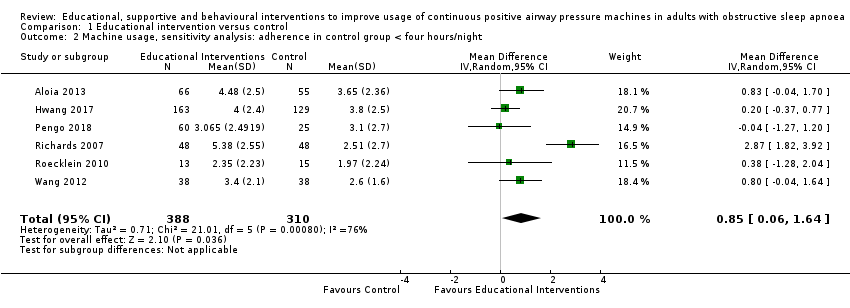
Comparison 1 Educational intervention versus control, Outcome 2 Machine usage, sensitivity analysis: adherence in control group < four hours/night.

Comparison 1 Educational intervention versus control, Outcome 3 N deemed adherent (≥ four hours/night).

Comparison 1 Educational intervention versus control, Outcome 4 Withdrawal.

Comparison 1 Educational intervention versus control, Outcome 5 Epworth Sleepiness Scale ‐ Comparison of Values at Endpoint.

Comparison 2 Supportive intervention versus control, Outcome 1 CPAP Device Usage (hours/night).
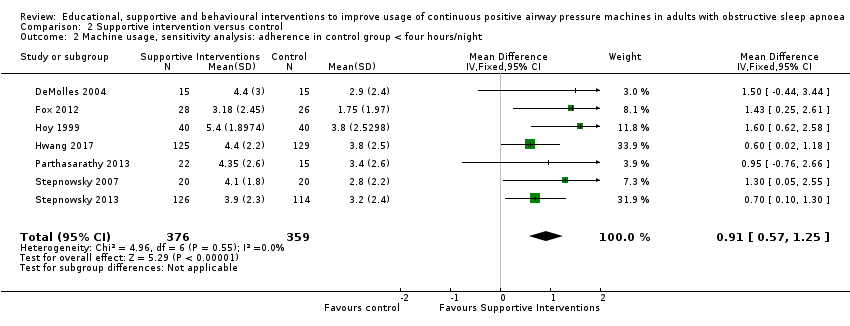
Comparison 2 Supportive intervention versus control, Outcome 2 Machine usage, sensitivity analysis: adherence in control group < four hours/night.

Comparison 2 Supportive intervention versus control, Outcome 3 N deemed adherent (≥ four hours/night).

Comparison 2 Supportive intervention versus control, Outcome 4 Withdrawals.
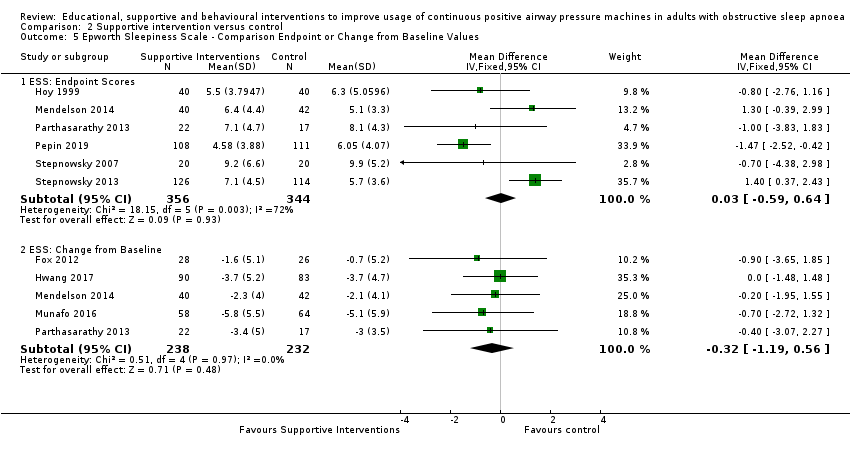
Comparison 2 Supportive intervention versus control, Outcome 5 Epworth Sleepiness Scale ‐ Comparison Endpoint or Change from Baseline Values.

Comparison 2 Supportive intervention versus control, Outcome 6 Quality of Life: Comparison of Values at Endpoint.

Comparison 2 Supportive intervention versus control, Outcome 7 Quality of LIfe: Comparison of Change from Baseline Values.

Comparison 2 Supportive intervention versus control, Outcome 8 Anxiety Symptom Rating (HADS‐A) ‐ Comparison of Values at Endpoint.
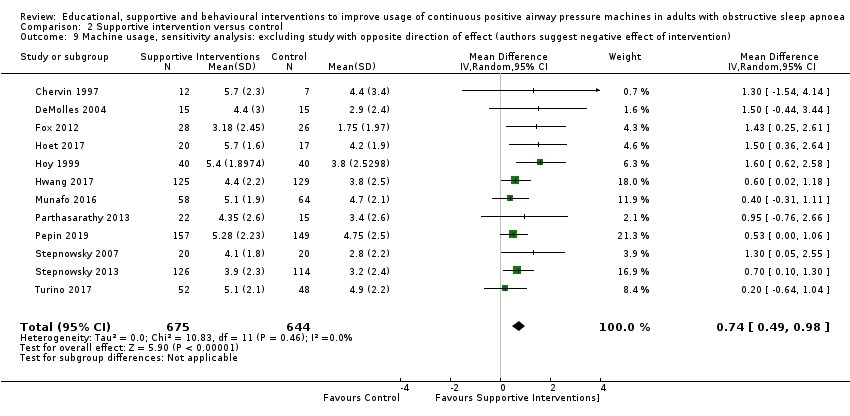
Comparison 2 Supportive intervention versus control, Outcome 9 Machine usage, sensitivity analysis: excluding study with opposite direction of effect (authors suggest negative effect of intervention).

Comparison 2 Supportive intervention versus control, Outcome 10 AHI on treatment ‐ Comparison of Values at Endpoint.
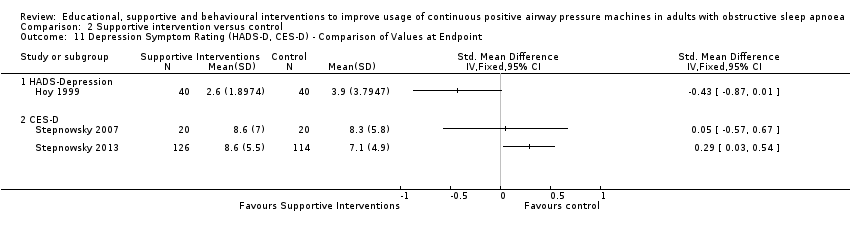
Comparison 2 Supportive intervention versus control, Outcome 11 Depression Symptom Rating (HADS‐D, CES‐D) ‐ Comparison of Values at Endpoint.
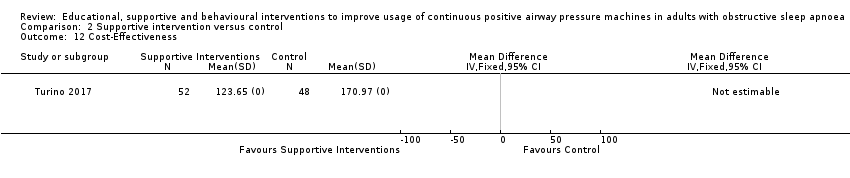
Comparison 2 Supportive intervention versus control, Outcome 12 Cost‐Effectiveness.
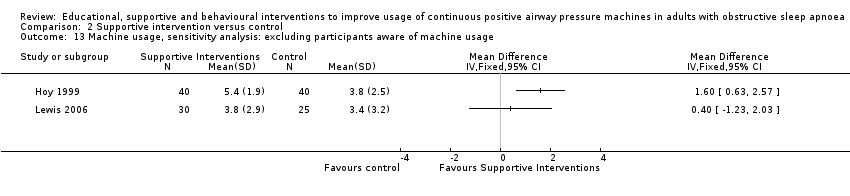
Comparison 2 Supportive intervention versus control, Outcome 13 Machine usage, sensitivity analysis: excluding participants aware of machine usage.

Comparison 3 Behavioural intervention versus control, Outcome 1 CPAP Device Usage (hours/night).

Comparison 3 Behavioural intervention versus control, Outcome 2 CPAP Device Usage (hours/night), sensitivity analysis: adherence in control group < four hours/night.
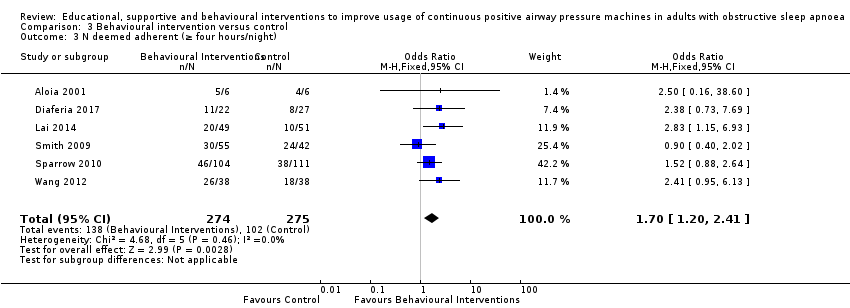
Comparison 3 Behavioural intervention versus control, Outcome 3 N deemed adherent (≥ four hours/night).
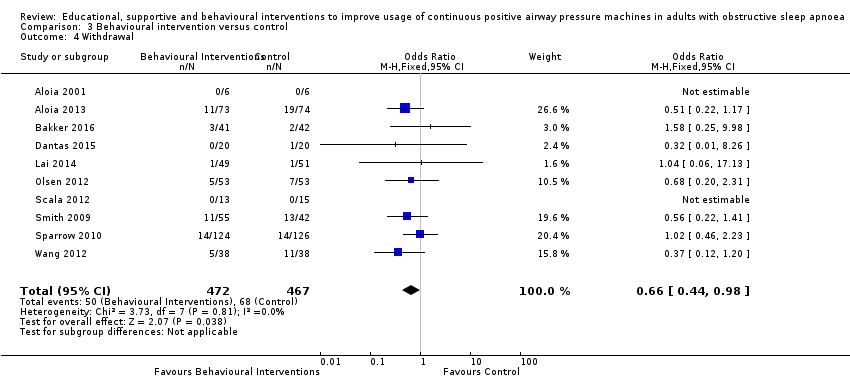
Comparison 3 Behavioural intervention versus control, Outcome 4 Withdrawal.

Comparison 3 Behavioural intervention versus control, Outcome 5 Epworth Sleepiness Scale (Endpoint scores).

Comparison 3 Behavioural intervention versus control, Outcome 6 AHI on treatment ‐ Endpoint.

Comparison 3 Behavioural intervention versus control, Outcome 7 Quality of Life ‐ Comparison of Values at Endpoint.
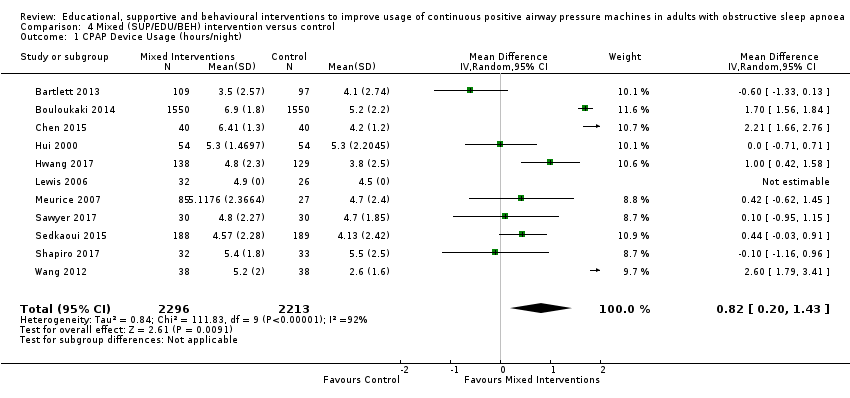
Comparison 4 Mixed (SUP/EDU/BEH) intervention versus control, Outcome 1 CPAP Device Usage (hours/night).

Comparison 4 Mixed (SUP/EDU/BEH) intervention versus control, Outcome 2 CPAP Device Usage, sensitivity analysis: adherence in control group < four hours/night.

Comparison 4 Mixed (SUP/EDU/BEH) intervention versus control, Outcome 3 N deemed adherent (≥ four hours/night).
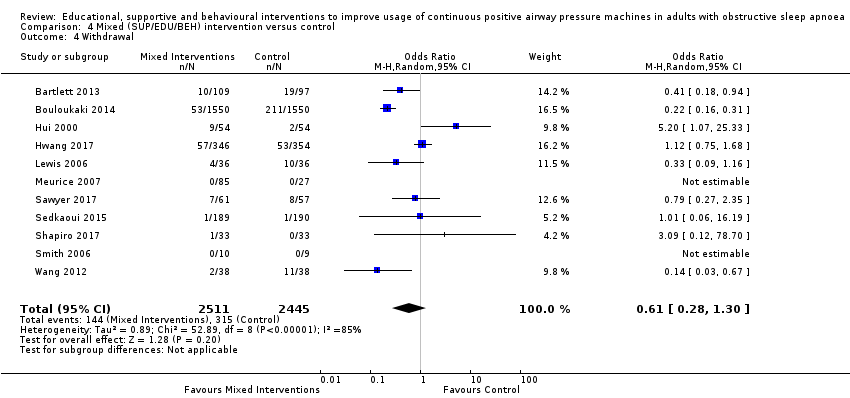
Comparison 4 Mixed (SUP/EDU/BEH) intervention versus control, Outcome 4 Withdrawal.

Comparison 4 Mixed (SUP/EDU/BEH) intervention versus control, Outcome 5 Quality of LIfe: Comparison of Change from Baseline Values.

Comparison 4 Mixed (SUP/EDU/BEH) intervention versus control, Outcome 6 Quality of Life: Comparison of Values at Endpoint.

Comparison 4 Mixed (SUP/EDU/BEH) intervention versus control, Outcome 7 Anxiety Symptom Rating ‐ Comparison of Values at Endpoint.

Comparison 4 Mixed (SUP/EDU/BEH) intervention versus control, Outcome 8 Depression Symptom Rating ‐ Comparison of Values at Endpoint.

Comparison 4 Mixed (SUP/EDU/BEH) intervention versus control, Outcome 9 Epworth Sleepiness Scale Score.

Comparison 5 Post‐hoc sensitivity analyses, Outcome 1 EDU: CPAP Device Usage (hours/night), original EDU study classification.
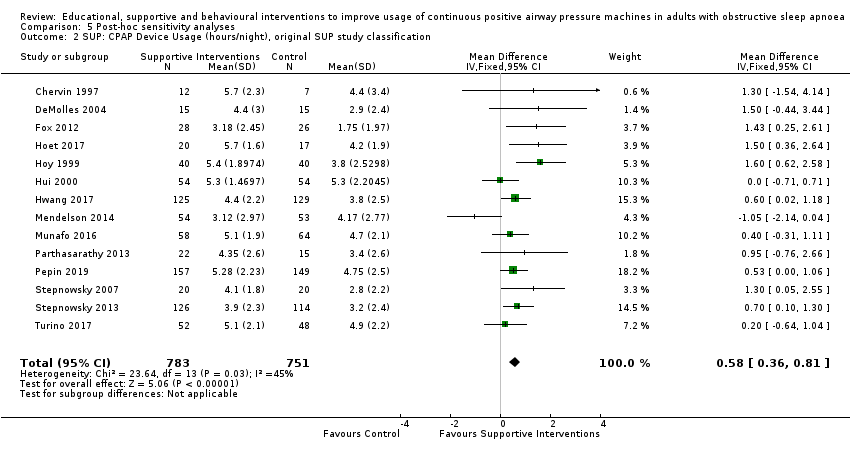
Comparison 5 Post‐hoc sensitivity analyses, Outcome 2 SUP: CPAP Device Usage (hours/night), original SUP study classification.

Comparison 5 Post‐hoc sensitivity analyses, Outcome 3 BEH: CPAP Device Usage (hours/night), original BEH study classification.

Comparison 5 Post‐hoc sensitivity analyses, Outcome 4 EDU: CPAP Device Usage (hours/night), exclude HIGH 'Risk of bias' studies.

Comparison 5 Post‐hoc sensitivity analyses, Outcome 5 SUP: CPAP Device Usage (hours/night), exclude HIGH 'Risk of bias' studies.

Comparison 5 Post‐hoc sensitivity analyses, Outcome 6 BEH: CPAP Device Usage (hours/night), exclude HIGH 'Risk of bias' studies.

Comparison 5 Post‐hoc sensitivity analyses, Outcome 7 MIX: CPAP Device Usage (hours/night), exclude HIGH 'Risk of bias' studies.

Comparison 6 Post‐hoc subgroup analyses (exploratory), Outcome 1 EDU: CPAP Device Usage (hours/night).
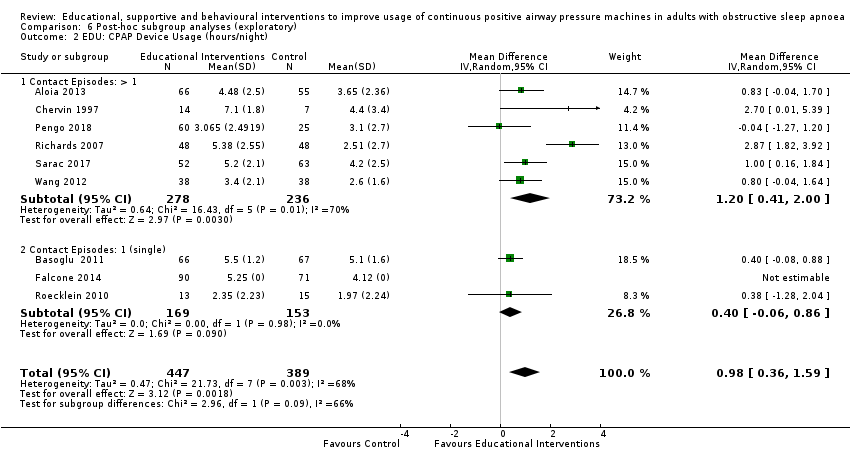
Comparison 6 Post‐hoc subgroup analyses (exploratory), Outcome 2 EDU: CPAP Device Usage (hours/night).

Comparison 6 Post‐hoc subgroup analyses (exploratory), Outcome 3 EDU: CPAP Device Usage (hours/night).

Comparison 6 Post‐hoc subgroup analyses (exploratory), Outcome 4 SUP: Subgroup Analysis ‐ CPAP Device Usage (hours/night).

Comparison 6 Post‐hoc subgroup analyses (exploratory), Outcome 5 SUP: Subgroup Analysis ‐ CPAP Device Usage (hours/night).

Comparison 6 Post‐hoc subgroup analyses (exploratory), Outcome 6 SUP: Subgroup Analysis ‐ CPAP Device Usage (hours/night).
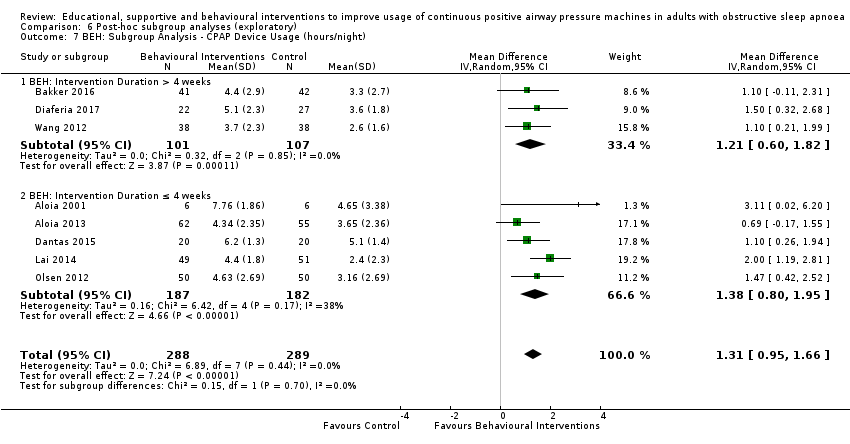
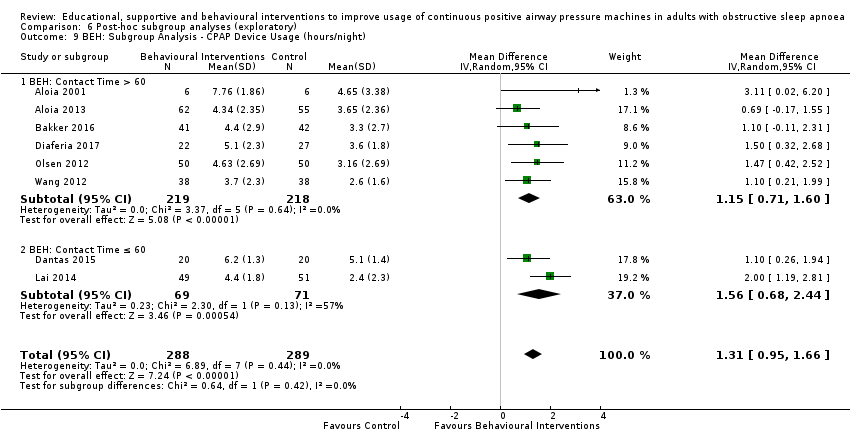
Comparison 6 Post‐hoc subgroup analyses (exploratory), Outcome 7 BEH: Subgroup Analysis ‐ CPAP Device Usage (hours/night).

Comparison 6 Post‐hoc subgroup analyses (exploratory), Outcome 8 BEH: Subgroup Analysis ‐ CPAP Device Usage (hours/night).
Comparison 6 Post‐hoc subgroup analyses (exploratory), Outcome 9 BEH: Subgroup Analysis ‐ CPAP Device Usage (hours/night).

Comparison 6 Post‐hoc subgroup analyses (exploratory), Outcome 10 MIX: Subgroup Analysis ‐ CPAP Device Usage (hours/night).

Comparison 6 Post‐hoc subgroup analyses (exploratory), Outcome 11 MIX: Subgroup Analysis ‐ CPAP Device Usage (hours/night).

Comparison 6 Post‐hoc subgroup analyses (exploratory), Outcome 12 MIX: Subgroup Analysis ‐ CPAP Device Usage (hours/night).
| Educational interventions + CPAP compared to usual care + CPAP in adults with obstructive sleep apnoea | ||||||
| Patient or population: adults with obstructive sleep apnoea | ||||||
| Outcomes | Anticipated absolute effects* (95% CI) | Relative effect | № of participants | Certainty of the evidence | Comments | |
| Risk with usual care + CPAP | Risk with Educational interventions + CPAP | |||||
| 1.1 CPAP device usage (hours/night) | The mean CPAP device usage ranged from 1.97 to 5.1 hours/night | MD 0.85 hours/night higher | ‐ | 1128 | ⊕⊝⊝⊝ | |
| 1.2 CPAP device usage (hours/night), sensitivity analysis: adherence in control group < four hours/night | The mean CPAP device usage , sensitivity analysis: adherence in control group < four hours/night ranged from 1.97 to 3.8 hours/night | MD 0.85 hours/night higher | ‐ | 698 | ⊕⊝⊝⊝ | |
| 1.3 N deemed adherent (≥ four hours/night) | 558 per 1,000 | 765 per 1,000 | OR 2.58 | 1019 | ⊕⊝⊝⊝ | |
| 1.4 Withdrawal ‐ NO META‐ANALYSIS PERFORMED | ‐ | 1745 | ‐ | |||
| 1.5 ESS ‐ Comparison of values at endpoint‐ NO META‐ANALYSIS PERFORMED | ‐ | ‐ | 355 | ‐ | ||
| *The risk in the intervention group (and its 95% confidence interval) is based on the assumed risk in the comparison group and the relative effect of the intervention (and its 95% CI). | ||||||
| GRADE Working Group grades of evidence | ||||||
| 1 Overall risk of bias for this comparison was 'High' for 7/10 and 'some concerns' for the remaining 3/10. In those with high risk, risk derived from randomisation (1), missing outcome data (5), protocol deviation (1) and selective reporting (1). The combined weight of the studies with high risk is 59.2%. Therefore, risk of bias for this comparison was downgraded by 2 levels to 'very serious.' 2 There was minimal or no variability in direction of effect, with all (or nearly all) studies favouring the intervention arm. Magnitude of effect varied substantially (4 studies with CIs excluding null). CIs have reasonable overlap. Substantial statistical heterogeneity P = 0.002, I2 = 66%. Therefore, inconsistency was downgraded by one level to 'serious.' 3 Studies retrieved and analysed for this review directly compare the population, interventions and outcomes of interest, as predefined, in our review protocol. 4 Performed optimal information size (OIS) (sample size) calculation, as per GRADE Handbook recommendations, which indicated OIS criterion was met for this outcome. Confidence interval does not include null and includes potential for important benefit. 5 There was minimal or no variability in direction of effect, with all (or nearly all) studies favouring the intervention arm. Magnitude of effect varied substantially (1 study with CI excluding null). Substantial statistical heterogeneity P = 0.0008, I2 = 76%. Therefore, inconsistency was downgraded by one level to 'serious.' 6 Overall risk of bias for this comparison was 'High' for 3/6 and 'some concerns' for the remaining 3/6. In those with high risk, risk derived from missing outcome data (3). The combined weight of the studies with high risk is 44.8%. Therefore, risk of bias for this comparison was downgraded by 2 levels to 'very serious.' 7 There was no variability in direction of effect, with all (or nearly all) studies favouring the intervention arm. Magnitude of effect varied substantially (3 studies with CI excluding null). Substantial statistical heterogeneity P = 0.003, I2 = 70%. Therefore, inconsistency was downgraded by one level to 'serious.' 8 Overall risk of bias for this comparison was 'High' for 5/7 and 'some concerns' for the remaining 2/7. In those with high risk, risk derived from randomisation (1), missing outcome data (3), and selective reporting (1). The combined weight of the studies with high risk is 68.2%.Therefore, risk of bias for this comparison was downgraded by 2 levels to 'very serious.' | ||||||
| Increased practical support and encouragement during follow‐up + CPAP compared to usual care + CPAP in adults with obstructive sleep apnoea | ||||||
| Patient or population: adults with obstructive sleep apnoea | ||||||
| Outcomes | Anticipated absolute effects* (95% CI) | Relative effect | № of participants | Certainty of the evidence | Comments | |
| Risk with usual care + CPAP | Risk with Increased practical support and encouragement during follow‐up + CPAP | |||||
| 2.1 CPAP device usage (hours/night) | The mean CPAP device usage ranged from 1.75 to 4.9 hours/night | MD 0.70 hours/night higher | ‐ | 1426 | ⊕⊕⊕⊝ | |
| 2.2 CPAP device usage, sensitivity analysis: adherence in control group < four hours/night | The mean CPAP device usage, sensitivity analysis: adherence in control group < four hours/night ranged from 1.75 to 3.8 hours/night | MD 0.91 hours/night higher | ‐ | 735 | ⊕⊕⊕⊕ | |
| 2.3 N deemed adherent (≥ four hours/night) | 601 per 1,000 | 717 per 1,000 | OR 1.68 | 376 | ⊕⊕⊝⊝ | |
| 2.4 Withdrawals | 136 per 1,000 | 167 per 1,000 | OR 1.27 | 1702 | ⊕⊕⊝⊝ | |
| 2.5.2 ESS: Comparison Endpoint or Change from Baseline Values ‐ ESS: Change from Baseline | The mean ESS ‐ Comparison Endpoint or Change from Baseline Values ‐ ESS: Change from Baseline ranged from ‐0.7 to ‐5.1 | MD 0.32 lower | ‐ | 470 | ⊕⊕⊝⊝ | |
| 2.7 Quality of lIfe: Comparison of Change from Baseline Values | The mean Quality of lIfe: Comparison of Change from Baseline Values was 0 | SMD 0.22 higher | ‐ | 294 | ⊕⊝⊝⊝ | |
| *The risk in the intervention group (and its 95% confidence interval) is based on the assumed risk in the comparison group and the relative effect of the intervention (and its 95% CI). | ||||||
| GRADE Working Group grades of evidence | ||||||
| 1 Overall risk of bias for this comparison was 'High' for 8/13 and 'some concerns' for the remaining 5/13. In those with high risk, risk derived from randomisation (1), missing outcome data (6), protocol deviation (1) and selective reporting (2). The combined weight of the studies with high risk is 51.2%. Therefore, risk of bias for this comparison was downgraded by 1 level to 'serious.' 2 Direction of effect had some variability (one study, weight = 6.8%, favoured control), while remaining studies favoured experimental arms. Magnitude of effect varied across studies and CIs had fair overlap. Heterogeneity P = 0.05, I2 = 42%. Heterogeneity explained: attributable to single study with opposite direction of effect (Mendelson 2014). See sensitivity analysis with this study excluded (Analysis 2.13). 3 Studies retrieved and analysed for this review directly compare the population, interventions and outcomes of interest, as predefined, in our review protocol. 4 Performed optimal information size (OIS) (sample size) calculation, as per GRADE Handbook recommendations, which indicated OIS criterion was met for this outcome. Confidence interval does not include null and includes potential for important benefit. 5 Overall risk of bias for this comparison was 'High' for 3/7 and 'some concerns' for the remaining 4/7. In those with high risk, risk derived from missing outcome data (1) and selective reporting (2). The combined weight of the studies with high risk is 14.2%. 6 Overall risk of bias for this comparison was 'High' for 1/2 and 'some concerns' for the remaining 1/2. Hisk risk derived from missing outcome data. The weight of high risk study is 24.8%. Therefore, risk of bias for this comparison was downgraded by 1 level to 'serious.' 7 OIS (sample size) calculation, as per GRADE Handbook recommendations, which indicated OIS criterion not met for this outcome. Therefore, Imprecision for this comparison was downgraded by 1 level to 'serious.' 8 Performed OIS (sample size) calculation, as per GRADE Handbook recommendations, which indicated OIS criterion not met for this outcome. Additionally, CI includes null and potential for important difference in withdrawals. Therefore, Imprecision for this comparison was downgraded by 2 levels to 'very serious.' 9 Overallrisk of bias for this outcome is 'high' for all, or nearly all, included studies because, for all or nearly all studies assessed for this outcome, the following were true: a) outcome assessors (whether participant or investigator) were aware of the intervention received by study participants, b) the outcome assessment could have been influenced by knowledge of the intervention received (because each involves some judgement by the assessor, whether participant or investigator) and c) we have no further information that would permit further adjudication of the likelihood that outcome assessment was influenced by knowledge of the intervention received. Therefore, risk of bias for this comparison was downgraded by 1 level to 'serious.' 10 OIS likely insufficient.Therefore, Imprecision for this comparison was downgraded by 1 level to 'serious.' 11 Our review included a comprehensive search for published reports conducted. All (or nearly all) studies, including all small studies, for this comparison found a benefit for the intervention. Thus, due to suspicion for publication bias, this outcome was downgraded by one level. 12 Overall risk of bias for this comparison was 'High' for 7/12 and 'some concerns' for the remaining 5/12. In those with high risk, risk derived from randomisation (1), missing outcome data (5), protocol deviation (1) and selective reporting (2). The combined weight of the studies with high risk is 46.1%. | ||||||
| Behavioural therapy + CPAP compared to control + CPAP in adults with obstructive sleep apnoea | ||||||
| Patient or population: adults with obstructive sleep apnoea | ||||||
| Outcomes | Anticipated absolute effects* (95% CI) | Relative effect | № of participants | Certainty of the evidence | Comments | |
| Risk with control + CPAP | Risk with Behavioural therapy + CPAP | |||||
| 3.1 CPAP Device Usage (hours/night) | The mean CPAP Device Usage ranged from 1.48 to 5.1 hours/night | MD 1.31 hours/night higher | ‐ | 578 | ⊕⊕⊕⊕ | |
| 3.2 CPAP Device Usage, sensitivity analysis: adherence in control group < four hours/night | The mean CPAP Device Usage, sensitivity analysis: adherence in control group < four hours/night ranged from 1.48 to 3.65 hours/night | MD 1.32 hours/night higher | ‐ | 525 | ⊕⊕⊕⊝ | |
| 3.3 N deemed adherent (≥ four hours/night) | Study population | OR 1.70 | 549 | ⊕⊕⊕⊕ | ||
| 371 per 1,000 | 501 per 1,000 | |||||
| 3.4 Withdrawal | 146 per 1,000 | 101 per 1,000 | OR 0.66 | 939 | ⊕⊕⊕⊕ | |
| 3.5 ESS (Endpoint scores) | The mean ESS (Endpoint scores) ranged from 7.1 to 12.5 | MD 2.42 lower | ‐ | 271 | ⊕⊕⊝⊝ | |
| 3.6 AHI on treatment ‐ Endpoint | The mean AHI at endpoint ranged from 3.7 to 4.3 events/hour | MD 0.95 events/hour lower | ‐ | 89 | ⊕⊝⊝⊝ | |
| 3.7 Quality of Life ‐ Comparison of Values at Endpoint | The mean Quality of Life ‐ Comparison of Values at Endpoint was 0 | SMD 0 | ‐ | 228 | ⊕⊕⊕⊝ | |
| 3.7.1 Quality of Life ‐ Comparison of Values at Endpoint ‐ QoL: FOSQ ‐ Endpoint | The mean Quality of Life ‐ Comparison of Values at Endpoint ‐ QoL: FOSQ ‐ Endpoint was 0 | SMD 0.01 higher | ‐ | 200 | ‐ | |
| *The risk in the intervention group (and its 95% confidence interval) is based on the assumed risk in the comparison group and the relative effect of the intervention (and its 95% CI). | ||||||
| GRADE Working Group grades of evidence | ||||||
| 1 Studies retrieved and analysed for this review directly compare the population, interventions and outcomes of interest, as predefined, in our review protocol. 2 Performed optimal information size (OIS) (sample size) calculation, as per GRADE Handbook recommendations, which indicated OIS criterion was met for this outcome. Confidence interval does not include null and includes potential for important benefit (1 hour more use/night). 3 Overall risk of bias for this comparison was 'Some concerns' for 4/8 and 'high' for the remaining 4/8. In those with high risk, risk derived from randomisation (1), missing outcome (1), protocol deviation/missing outcome data (1) and selective reporting (1). The combined weight of the four studies with high risk is 45.1%. 4 Overall risk of bias for this comparison was 'Some concerns' for 3/6 and 'high' for the remaining 3/6. In those with high risk, risk derived from missing outcome (1), protocol deviation/missing outcome data (1) and selective reporting (1). The combined weight of the two studies with high risk is 54.4%. Therefore, risk of bias for this comparison was downgraded by 1 level to 'serious.' 5 Direction of effect did not vary. Magnitude of effect varied somewhat and CIs had good overlap. Heterogeneity P = 0.38, I2 = 6%. 6 Overall risk of bias for this comparison was 'Some concerns' for 2/6 and 'high' for the remaining 4/6. In those with high risk, risk derived from randomisation process (1), missing outcome data (1), protocol deviation/missing outcome data (1) and selective reporting (1). The combined weight of the two studies with high risk is 32.4%. 7 One (second highest‐weighted) study found opposite direction of effect (favoured control). The remaining studies had similar magnitude of effect and showed reasonable overlap of CIs. Heterogeneity P = 0.46, I2 = 0%. 8 Overall risk of bias for this outcome is 'high' for all, or nearly all, included studies because, for all or nearly all studies assessed for this outcome, the following were true: a) outcome assessors (whether participant or investigator) were aware of the intervention received by study participants, b) the outcome assessment could have been influenced by knowledge of the intervention received (because each involves some judgement by the assessor, whether participant or investigator) and c) we have no further information that would permit further adjudication of the likelihood that outcome assessment was influenced by knowledge of the intervention received. Therefore, risk of bias for this comparison was downgraded by 1 level to 'serious.' 9 Direction of effect had some variability (one study, weight =17.9%, modestly favoured control), while remaining studies favoured experimental arms. Magnitude of effect varied significantly and CIs had moderate overlap. Heterogeneity P = 0.008, I2=71%.Therefore, inconsistency was downgraded by one level to 'serious.' 10 Only two studies provided information for this comparison. Overall risk of bias for this comparison was 'Some concerns' for 1/2 and 'high' for the remaining 1/2 (Diaferia 2017). High‐risk derived from protocol deviation/missing outcome data. Additionally, the other study (Dantas 2015) had 'some concerns' for domain 1 (study level), randomisation process. Therefore, risk of bias for this comparison was downgraded by 1 level to 'serious.' 11 Performed OIS (sample size) calculation, as per GRADE Handbook recommendations, which indicated OIS criterion not met for this outcome. Additionally, CI contained null effect and potential for important benefit.Therefore, Imprecision for this comparison was downgraded by 2 levels to 'very serious.' | ||||||
| Mixed (SUP/EDU/BEH) Intervention + CPAP compared to Usual Care + CPAP in adults with obstructive sleep apnoea | ||||||
| Patient or population: adults with obstructive sleep apnoea | ||||||
| Outcomes | Anticipated absolute effects* (95% CI) | Relative effect | № of participants | Certainty of the evidence | Comments | |
| Risk with Usual Care + CPAP | Risk with Mixed (SUP/EDU/BEH) Intervention + CPAP | |||||
| 4.1 CPAP Device Usage (hours/night) | The mean CPAP Device Usage ranged from 2.6 to 5.5 hours/night | MD 0.82 hours/night higher | ‐ | 4509 | ⊕⊝⊝⊝ | |
| 4.2 CPAP Device Usage, sensitivity analysis: adherence in control group < four hours/night | The mean CPAP Device Usage, sensitivity analysis: adherence in control group < four hours/night ranged from 2.6 to 3.8 hours/night | MD 1.77 hours/night higher | ‐ | 343 | ⊕⊝⊝⊝ | |
| 4.3 N deemed adherent (≥ four hours/night) | 741 per 1,000 | 830 per 1,000 | OR 1.71 | 4015 | ⊕⊝⊝⊝ | |
| 4.4 Withdrawal | 129 per 1,000 | 83 per 1,000 | OR 0.61 | 4956 | ⊕⊝⊝⊝ | |
| 4.5 Quality of LIfe: Comparison of Change from Baseline Values | The mean Quality of LIfe: Comparison of Change from Baseline Values was 0 | SMD 0.45 higher | ‐ | 3012 | ⊕⊕⊝⊝ | |
| 4.7 Anxiety Symptom Rating ‐ Comparison of Values at Endpoint | The mean Anxiety Symptom Rating ‐ Comparison of Values at Endpoint was 0 | SMD 0.19 lower | ‐ | 333 | ⊕⊝⊝⊝ | |
| *The risk in the intervention group (and its 95% confidence interval) is based on the assumed risk in the comparison group and the relative effect of the intervention (and its 95% CI). | ||||||
| GRADE Working Group grades of evidence | ||||||
| 1 Overall risk of bias for this comparison was 'Some concerns' for 4/11 and 'high' for the remaining 6/11. In those with high risk, risk derived from randomisation (2), missing outcome data (2), and selective reporting (3). The combined weight of the studies with high risk is 61.8%. (1 high risk study. Lewis 2006, has no weight contribution because mean difference not estimable.) Therefore, risk of bias for this comparison was downgraded by 1 level to 'serious.' 2 Direction of effect had some variability (two studies, combined weight =18.8%, favoured control), while remaining studies favoured experimental arms. Magnitude of effect varied significantly and CIs had relatively poor overlap. Heterogeneity P < 0.00001, I2 = 92% suggesting very substantial statistical heterogeneity of effect. Therefore, inconsistency was downgraded by two levels to 'very serious.' 3 Studies retrieved and analysed for this review directly compare the population, interventions and outcomes of interest, as predefined, in our review protocol. 4 Performed optimal information size (OIS) (sample size) calculation, as per GRADE Handbook recommendations, which indicated OIS criterion was met for this outcome. Confidence interval does not include null and includes potential for important benefit. 5 Overall risk of bias for this comparison was 'Some concerns' for 1/2 and 'high' for the remaining 1/2. In those with high risk, risk derived from missing outcome data. The weight of the high risk study is 48.3%.Because there were only two studies for this comparison and both were either high or 'some concerns,' risk of bias for this comparison was downgraded by 1 level to 'serious.' 6 There was no variability in direction of effect, both studies favoured experimental arms. Magnitude of effect varied substantially and CIs had no overlap. Heterogeneity P = 0.002, I2 = 90% suggesting very substantial statistical heterogeneity of effect. Therefore, inconsistency was downgraded by two levels to 'very serious.' 7 Overall risk of bias for this comparison was 'high' for 4/9. In those with high risk, risk derived from randomisation (1), missing outcome data (1), and selective reporting (2). The combined weight of the studies with high risk is 51.3%. Therefore, risk of bias for this comparison was downgraded by 1 level to 'serious.' 8 There was variability in direction of effect (three studies, combined weight=31,6%, favoured control), while remaining studies favoured experimental arms. Magnitude of effect varied substantially and CIs had modest overlap. Heterogeneity P < 0.00001, I2 = 79% suggesting very substantial statistical heterogeneity of effect.Therefore, inconsistency was downgraded by two levels to 'very serious.' 9 Performed OIS (sample size) calculation, as per GRADE Handbook recommendations, which indicated OIS criterion was met for this outcome. Confidence interval includes null and includes potential for important benefit.Therefore, imprecision was downgraded by 1 level to 'serious.' 10 There was variability in direction of effect (five studies, combined weight = 35.4%, favoured control), while remaining studies favoured experimental arms. Magnitude of effect varied substantially and CIs had modest overlap. Heterogeneity P < 0.00001, I2 = 85% suggesting very substantial statistical heterogeneity of effect.Therefore, inconsistency was downgraded by two levels to 'very serious.' 11 Overall risk of bias for this comparison was 'high' for 6/11 studies. In those with high risk, risk derived from randomisation (2), missing outcome data (2), and selective reporting (2). The combined weight of the studies with high risk is 52.80%. Therefore, risk of bias for this comparison was downgraded by 1 level to 'serious.' 12 Overall risk of bias for this outcome is 'high' for all, or nearly all, included studies because, for all or nearly all studies assessed for this outcome, the following were true: a) outcome assessors (whether participant or investigator) were aware of the intervention received by study participants, b) the outcome assessment could have been influenced by knowledge of the intervention received (because each involves some judgement by the assessor, whether participant or investigator) and c) we have no further information that would permit further adjudication of the likelihood that outcome assessment was influenced by knowledge of the intervention received.Therefore, risk of bias for this comparison was downgraded by 1 level to 'serious.' 13 There was no variability in direction of effect, both studies favoured experimental arms. Magnitude of effect varied substantially and CIs had minimal overlap. Heterogeneity P = 0.03, I2 = 79% suggesting considerable heterogeneity of effect.Therefore, inconsistency was downgraded by 1 level to 'serious.' 14 Sample size likely sufficient. Confidence interval does not include null, but also likely does not include potential for important benefit (i.e. standardised mean difference of at least 1). No downgrade. 15 Overall risk of bias for this outcome is 'high' for all, or nearly all, included studies because, for all or nearly all studies assessed for this outcome, the following were true: a) outcome assessors (whether participant or investigator) were aware of the intervention received by study participants, b) the outcome assessment could have been influenced by knowledge of the intervention received (because each involves some judgement by the assessor, whether participant or investigator) and c) we have no further information that would permit further adjudication of the likelihood that outcome assessment was influenced by knowledge of the intervention received. Additionally, a different anxiety symptom rating scale was used for each and they targeted different dimensions of anxiety (e.g. state vs. trait). Therefore, risk of bias for this comparison was downgraded by 2 levels to 'very serious.' 16 Sample size for this comparison relatively small, OIS probably not met (approximated based on comparison of means for study with highest weight). CI includes null but likely does not include important benefit/harm.Therefore, imprecision was downgraded by 1 level to 'serious.' | ||||||
| Study | N Screened | Entered | Completed | % Screened | % Entered |
| NA | 12 | 12 | NA | 100 | |
| 339 | 227 | 183 | 54 | 81 | |
| 479 (only 2 of 4 treatment arms included in this review) | 83 | 78 | 16 | 94 | |
| 294 | 206 | 177 | 60 | 86 | |
| 246 | 133 | 133 | 54 | 100 | |
| 5100 | 3100 | 2836 | 56 | 91 | |
| 85 | 80 | 80 | 94 | 100 | |
| NA (75% of those approached agreed to participate) | 33 | 33 | NA | 100 | |
| 61 | 41 | 40 | 66 | 98 | |
| NA | 30 | 30 | NA | 100 | |
| NA | 49 | 49 | NA | 100 | |
| 533 | 206 | 161 | 30 | 78 | |
| NA | 75 | 54 | NA | 72 | |
| 127 | 46 | 37 | 29 | 80 | |
| NA | 80 | 80 | NA | 100 | |
| NA | 108 | 97 | NA | 90 | |
| 1873 | 1455 | 1236 | 66 | 85 | |
| 212 | 100 | 98 | 46 | 98 | |
| 74 | 72 | 58 | 78 | 81 | |
| 107 | 107 | 82 | 77 | 76 | |
| 133 | 112 | 112 | 84 | 100 | |
| 140 | 140 | 122 | 87 | 87 | |
| 132 | 106 | 94 | 71 | 89 | |
| 49 | 39 | 37 | 76 | 95 | |
| NA | 112 | 85 | NA | 76 | |
| NA | 306 | 239 | NA | 78 | |
| 109 | 100 | 96 | 88 | 96 | |
| NA | 30 | 28 | NA | 93 | |
| 490 | 115 | 115 | 23 | 100 | |
| 431 | 118 | 103 | 24 | 87 | |
| NA | 28 | 28 | NA | 100 | |
| 391 | 379 | 377 | 96 | 99 | |
| NA | 66 | 65 | NA | 98 | |
| NA | 19 | 19 | NA | 100 | |
| NA | 97 | 73 | NA | 75 | |
| NA | 202 | 146 | NA | 72 | |
| 423 | 250 | 222 | 52 | 89 | |
| 91 | 45 | 40 | 44 | 89 | |
| NA | 241 | 240 | NA | 99 | |
| NA | 100 | 100 | NA | 100 | |
| NA | 152 | 130 | NA | 86 |
| Variable | Behavioural (BEH) | Educational (EDU) | Supportive (SUP) | Mixed (MIX) |
| N (total randomised) | 989 | 1878 | 1962 | 5041 |
| Age in years (Mean, SD) | 56.44 (5.76) | 52.73 (4.68) | 53.94 (4.88) | 52.55 (5.46) |
| BMI (Mean, SD) | 32.31 (2.90) | 34.19 (3.51) | 33.19 (2.02) | 33.73 (2.80) |
| Sex (% female)* | 34.38 | 29.98 | 24.68 | 32.44 |
| AHI (Mean, SD) | 38.08 (9.04) | 39.72 (12.25) | 41.11 (10.52) | 38.82 (10.62) |
| ESS (Mean, SD) | 12.80 (4.02) | 11.27 (1.29) | 10.47 (1.50) | 12.53 (1.92) |
| * Percentage female calculated based on studies reporting statistics on gender (those not reporting excluded from calculation). | ||||
| Intervention Details | Behavioural (BEH), (median, IQR) | Educational (EDU), (median, IQR) | Supportive (SUP), (median, IQR) | Mixed (MIX), (median, IQR) |
| Study duration (weeks) | 12 (12‐52) | 12 (6‐26) | 12 (12‐16) | 14 (12‐52) |
| Intervention duration (weeks) | 4 (2‐12) | 0 (0‐4.5)* | 12 (9‐13) | 12 (10‐25) |
| # of Intervention episodes | 3 (3‐14) | 2 (1‐6) | NR (MOST) | 7 (5‐10) |
| Contact time (minutes) | 90 (80‐240) | 21 (11‐105) | NR | 75 (33‐143) |
| * Educational interventions that took place in a single participant interaction (e.g., dispensing written material, single presentation) were assigned a duration of '0' weeks. Abbreviations: IQR: interquartile range; NR: not reported; NR (MOST): most studies did not report. | ||||
| Study | Studies employing Educational Intervention | Control | Study duration (weeks) | |
| Increased support and reinforcement components (if applicable) | Increased educational components | |||
| 2 x 45‐minute education sessions regarding pathophysiology of apnoea, medical and behavioral consequences, and the benefits of treatment; presented in standardised formats, with no tailoring to participant readiness, 1 booster call from sleep nurse | Usual care | 52 | ||
| One 10‐minute educational video session on OSA and CPAP | Usual care | 24 | ||
| Written information on OSA and CPAP | Usual care | 8 | ||
| Two consecutive PSG videos on the computer screen: the first recorded during a standard diagnostic overnight polysomnography, and the second during a full‐night polysomnography with nasal CPAP | Usual care | 52 | ||
| Education about OSA pathophysiology , health‐related risks, impact on daytime vigilance, introduction to CPAP therapy | Usual care | 12 | ||
| Positively or negatively framed messages in addition to CPAP. Patients were phoned weekly and read framed messages (≤ 6 phone calls per patient). | Usual care | 6 | ||
| Slide presentation and written information on OSA and CPAP and 2 x 1‐hour CBT sessions | Usual care | 4 | ||
| Personalised feedback report, including detailed information OSA and its associated risk and barriers to CPAP use and attitudes to change | Usual care | 12 | ||
| 1 x 20‐minute educational session by a sleep medicine physician, including: viewing his/her own PSG chart on morning post PAP‐titration, comparing PSG from diagnostic and CPAP titration studies with explanations that emphasized obstructive events and oxygen desaturations, and the disappearance of those signs on PAP treatment. | Usual care | 24 | ||
| 1 x 1‐hour educational session with information regarding OSA, its symptoms and risks, APAP treatment, the importance of good adherence, and different machine interfaces. | Usual care | 24 | ||
| Two additional nights of CPAP titration | 4‐hour group education session, written information, video CD | Usual care | 12 | |
| Abbreviations: CBT: Cognitive behavioural therapy; CD: compact disc; CPAP: continuous positive air pressure; OSA: obstructive sleep apnoea; PAP: positive air pressure; PSG: polysomnography | ||||
| Study | Studies employing Supportive Intervention | Control | Study duration (weeks) | |
| Increased support and reinforcement components | Increased educational components (if applicable) | |||
| Weekly telephone calls to monitor progress and troubleshoot | Usual care | 8 | ||
| Computer‐based telecommunication system allowing for monitoring and reinforcing compliance | Education via computer‐based telecommunication system | Usual care | 8 | |
| Telecomunication system for daily monitoring of CPAP usage, timely detection and troubleshooting of problems | Usual care | 12 | ||
| Telemonitoring device forair leaks, residual AHI > 10/h, or CPAP use less than 3 hours for 3 days | Usual care | 12 | ||
| 2 additional titration nights in hospital, 4 additional home visits by sleep nurses | Initial education at home with partner | Usual care | 24 | |
| Automatic processing of device data. Where CPAP usage thresholds met, automated message encouraged participant to improve use/positive reinforcement | Usual care | 12 | ||
| Participants equipped with smartphone for uploading BP, CPAP adherence, sleepiness, and QoL data. They received daily pictograms containing health‐related messages | Usualo care | 16 | ||
| Web‐based app used to monitor adherence and automatically message patients and providers when pre‐set conditions met | Usual care | 12 | ||
| 2 individual sessions and 8 telephone conversations with trained peer CPAP users providing support and sharing their positive experience with CPAP | Usual care | 12 | ||
| BP and physical activity recorded by multimodal telemonitoring device and electronic questionnaires completed by patients. Automatic algorithms constructed for prompt adjustment of CPAP treatment. | Usual care | 24 | ||
| Daily wireless telemonitoring of compliance and treatment efficacy and acting on the data via prespecified clinical pathways | Usual care | 8 | ||
| Telemonitoring device collecting daily CPAP adherence viewable by both patient and provider. Troubleshooting and feedback provided when necessary | Usual care | 16 | ||
| Daily CPAP adherence, CPAP pressures, mask leak and residual respiratory events transmitted into a web database. Case by case guidance provided by provider when signalled by automatic alarm in the web database | Usual care | 12 | ||
| Abbreviations: AHI: apnoea hypopnoea index; BP: Blood pressure; CPAP: continuous positive air pressure; QoL: quality of life. | ||||
| Study | Studies employing Behavioural Intervention | Control | Study duration (weeks) | ||
| Increased support and reinforcement components (if applicable) | Increased educational components (if applicable) | Behavioural therapy | |||
| Elements of education on consequences of OSA and efficacy of CPAP | 2 x 45‐minute sessions of CBT interventions | 2 x 45‐minute sessions on sleep architecture and sleep clinic | 12 | ||
| 2 x 45‐minute sessions of MET, one booster phone call | Usual care | 52 | |||
| Eight ‐ hour in person MET session | Usual care | 52 | |||
| 1 x 10‐minute MET session | Usual care | 8 | |||
| Thirty‐six myofunctional therapy sessions | Usual care | 36 | |||
| One brief MET session (video and patient interview), followed by a follow‐up phone call | Usual Care | 12 | |||
| 45‐Minute individual education session | Three 30‐minute sessions of MET | 45‐Minute educational session + usual care | 52 | ||
| 3 interactive sessions, video with discussion, focus group and role play, respectively 1, 2 and 3 months after receiving the CPAP device. | Usual Care | 52 | |||
| Audiotaped music and softly spoken directions on relaxation techniques and habit‐promoting instructions for using CPAP nightly. Information packet,including CPAP use reminder placard, handouts on benefits of CPAP adherence and health consequences of poor compliance, 4‐week diary for recording experience with CPAP | Audiotaped music with softly spoken information on vitamins, informational packet on vitamins and health. | 12 | |||
| Automated telephone‐linked communication system designed around the concept of Motivational Interviewing, which allowed one to assess and enhance CPAP compliance | Education on unrelated health topics via automated telephone‐linked communication system | 52 | |||
| One night of CPAP titration in the hospital | 12 x 40‐minute group PMR practice sessions over 12 weeks, one per week. Self‐practice of PMR before each CPAP treatment. Brochure and CD with a guide for PMR practice at home. | Usual care | 12 | ||
| Abbreviations: CBT: Cognitive behavioural therapy; CPAP: continuous positive air pressure; MET: Motivational Enhancement Therapy;OSA: obstructive sleep apnoea; PMR: progressive muscle relaxation; | |||||
| Study | Studies employing Mixed Intervention | Control | Study duration (weeks) | ||
| Increased support and reinforcement components | Increased educational components | Behavioural therapy | |||
| 1 x 30 minute group education session | 1 x 35‐minute intervention based on SCT , including perceived self‐efficacy, outcome expectations, and social support | Usual care + a 30‐minute group education session and social period matching the duration of the intervention | 24 | ||
| Two phone calls from study nurse to discuss CPAP use, 1 month of sleep diary review by sleep specialist, and 6 in‐person follow‐ups involving patient's family or spouse | 1 x 15 minute video education session covering OSA topics, followed by 10‐minute lecture to reinforce key topics | Usual care | 104 | ||
| Personalised guidance from a study nurse, home visits from a nurse discussing lifestyle management, mental well‐being, and 1 x 30‐minute consultation with a sleep physician | 1 x pre‐treatment OSA educational video | Usual care | 52 | ||
| 2 additional early reviews by sleep physician and frequent telephone calls by sleep nurses | Videotape and additional education session | Usual care | 12 | ||
| Intervention based on automatic processing of device data. If CPAP usage thresholds were met, a message was automatically sent to the patient providing encouragement to improve use or positively reinforcing successful adherence. | Education about pathophysiology of OSA, health‐related risks, impact on daytime vigilance, introduction to CPAP therapy | Usual care | 12 | ||
| 1 additional early review by sleep physician and 1 early telephone interview with sleep nurse | Educational video | Usual care | 52 | ||
| 4 additional home visits in the first 3 months by sleep practitioner for problem solving | Written information and detailed explanation by the prescriber, additional education during home visits | Written information and detailed explanation by the prescriber + usual care | 52 | ||
| Educational DVD on sleep apnoea and PSG review | 4 x 30‐60 minute sessions addressing cognitive perceptions of the OSA and CPAP, outcome expectancies with PAP treatment, and PAP treatment self‐efficacy, all domains of SCT | Usual care and an informational pamphlet about OSA, diagnosis and PAP prescription provided by sleep centre | 12 | ||
| 5 x standardised support sessions through telephone‐based counselling | Education addressing knowledge about OSA, disadvantage or obstacles to CPAP | Usual care | 16 | ||
| 2 x support calls with study investigator to promote the use of CPAP | 1 x educational session using an airway model along with a video and worksheet on OSA, and a report card to document OSA severity, CPAP setting and use and participant self‐evaluation | Usual care | 4 | ||
| Home video‐link sessions delivered by nurse, who guided correct CPAP use and provided problem solving | Nurse provided education on CPAP and OSA | Home video‐link sessions similar in form to intervention but directed activities in neutral health topics (vitamin intake) | 12 | ||
| Three nights of CPAP titration in the hospital | 4‐hout group education session, written information, video CD | 12 x 40 minute group PMR practice sessions over 12 weeks | Usual care | 12 | |
| Abbreviations: CPAP: continuous positive air pressure;DVD: Digital versatile disc; OSA: obstructive sleep apnoea; PAP: positive air pressure; PSG: polysomnography; SCT: social cognitive therapy | |||||
| Class | Full class effect estimate, MD (95% CI) | Sensitivity: excluding high RoB studies (MD, 95%CI) |
| Behavioural | 1.31 (0.95 to 1.66) I2 = 0% | 1.05 (0.57 to 1.53)1 I2 = 0% |
| Educational | 0.85 (0.32 to 1.39) I2 = 68% | 0.98 (0.07 to 1.89)2 I2 = 86% |
| Supportive | 0.70 (0.36 to 1.05) I2 = 42% | 0.75 (0.42 to 1.09)3 I2 = 34% |
| Mixed | 0.82 (0.20 to 1.43) I2 = 92% | NA |
| 1. Included in sensitivity analysis: Aloia 2013; Bakker 2016; Dantas 2015; Olsen 2012 2. Included in sensitivity analysis: Aloia 2013; Basoglu 2011; Hwang 2017; Richards 2007 3. Included in sensitivity analysis: Fox 2012; Hoy 1999; Hwang 2017; Stepnowsky 2013; Turino 2017 | ||
| Class | Full class effect estimate, MD (95%CI) | Intervention duration, MD (95%CI) | Contact episodes: 1 vs. > 1, MD (95%CI) | Total contact time: > vs. ≤ 60 minutes, MD (95%CI) |
| Behavioral | 1.31 (0.95 to1.66) I2 = 0% | > 4 weeks1: 1.21 (0.60 to 1.82) I2 = 0% ≤ 4 weeks2: 1.38 (0.80 to 1.95) I2 = 38% Test for subgroup differences: Chi² = 0.15, df = 1 (P = 0.70), I² = 0% | > 1 episode3: 1.35 (0.94 to 1.77) I2 = 9% 1 episode4: 1.10 (0.26 to1.94) I2 = 0% Test for subgroup differences: Chi² = 0.28, df = 1 (P = 0.60), I² = 0% | > 60 minutes5: 1.15 (0.71 to 1.60); I2 = 0% ≤ 60 minutes6: 1.56 (0.68 to 2.44); I2 = 57% Test for subgroup differences: Chi² = 0.64, df = 1 (P = 0.42), I² = 0% |
| Educational | 0.85 (0.32 to 1.39) I2 = 68% | > 4 weeks7: 0.33 (‐0.10 to 0.77); I2 = 0% ≤ 4 weeks8: 1.20 (0.39 to2.01); 12=75% Test for subgroup differences: Chi² = 3.36, df = 1 (P = 0.07), I² = 70.2% | > 1 episode9: 1.20 (0.41 to2.00); I2 = 70% 1 episode10: 0.40 (‐0.06 to 0.86); I2 = 0% Test for subgroup differences: Chi² = 2.96, df = 1 (P = 0.09), I² = 66.2% | > 60 minutes11: 1.46 (0.22 to 2.71); I2 = 82% ≤ 60 minutes12: 0.61 (0.00 to 1.22); I2 = 37% Test for subgroup differences: Chi² = 1.47, df = 1 (P = 0.23), I² = 31.9% |
| Supportive | 0.70 (0.36 to 1.05) I2 = 42% | > 12 weeks13: 0.49 (‐0.53 to 1.51); I2 = 77% ≤ 12 weeks14: 0.72 (0.43 to 1.01); I2 = 0% Test for subgroup differences: Chi² = 0.17, df = 1 (P = 0.68), I² = 0% | NA | NA |
| Mixed | 0.82 (0.20 to 1.43) I2 = 92% | > 4 weeks15: 1.22 (0.60 to 1.83); I2 = 91% ≤ 4 weeks16: ‐0.31 (‐0.83 to 0.21); I2 = 0% Test for subgroup differences: Chi² = 13.79, df = 1 (P = 0.0002), I² = 92.7% | > 1 episode17: 0.98 (0.32 to 1.62); I2 = 92% 1 episode18: ‐0.60 (‐1.33 to 0.13); I2 = 93% Test for subgroup differences: Chi² = 9.94, df = 1 (P = 0.002), I² = 89.9% | > 60 minutes19: 1.45 (0.73 to 2.16); I2 = 91% ≤ 60 minutes20: ‐0.15 (‐0.56 to 0.27); I2 = 0% Test for subgroup differences: Chi² = 14.14, df = 1 (P = 0.0002), I² = 92.9% |
| 1. Bakker 2016; Diaferia 2017; Wang 2012 2. Aloia 2001; Aloia 2013; Dantas 2015; Lai 2014; Olsen 2012 3. Aloia 2001; Aloia 2013; Bakker 2016; Diaferia 2017; Lai 2014; Olsen 2012; Wang 2012 4. Dantas 2015 5. Aloia 2001; Aloia 2013; Bakker 2016; Diaferia 2017; Olsen 2012; Wang 2012 6. Dantas 2015; Lai 2014 7. Hwang 2017; Pengo 2018; Wang 2012 8. Aloia 2013; Basoglu 2011; Chervin 1997; Falcone 2014; Richards 2007; Roecklein 2010; Sarac 2017 9. Aloia 2013; Chervin 1997; Richards 2007; Sarac 2017; Pengo 2018; Wang 2012 10. Basoglu 2011; Falcone 2014; Roecklein 2010 11. Aloia 2013; Richards 2007; Wang 2012 12. Basoglu 2011; Chervin 1997; Falcone 2014; Sarac 2017 13. Hoy 1999; Mendelson 2014; Parthasarathy 2013; Pepin 2019 14. Chervin 1997; DeMolles 2004; Fox 2012; Hoet 2017; Hwang 2017; Munafo 2016; Stepnowsky 2007; Stepnowsky 2013; Turino 2017 15. Bouloukaki 2014; Chen 2015; Hui 2000; Hwang 2017; Meurice 2007; Sedkaoui 2015; Wang 2012 16. Bartlett 2013; Sawyer 2017; Shapiro 2017 17. Bouloukaki 2014; Chen 2015; Hui 2000; Meurice 2007; Sawyer 2017; Sedkaoui 2015; Shapiro 2017; Wang 2012 18. Bartlett 2013 19. Bouloukaki 2014; Chen 2015; Sawyer 2017; Sedkaoui 2015; Wang 2012 | ||||
| Class | All supportive interventions, MD (95%CI) | Intervention involved human support, MD (95%CI) | Intervention involved scheduled human support, MD (95%CI) |
| Supportive | 0.70 (0.35 to 1.05) I2 = 42% | Any human support1: 0.84 (0.52 to 1.17) I2 = 10% Automated support only2: 0.26 (‐0.51 to 1.04) I2 = 64% Test for subgroup differences: Chi² = 1.85, df = 1 (P = 0.17), I² = 46.0% | Pre‐scheduled human support3: 1.43 (0.61 to 2.24) I2 = 0% No Scheduled human support4: 0.58 (0.33 to 0.83) I2 = 45% Test for subgroup differences: Chi² = 3.82, df = 1 (P = 0.05), I² = 73.8% |
| 1. Chervin 1997; Fox 2012; Hoet 2017; Hoy 1999; Parthasarathy 2013; Pepin 2019; Stepnowsky 2007; Stepnowsky 2013; Turino 2017 2. DeMolles 2004; Hwang 2017; Mendelson 2014; Munafo 2016 3. Chervin 1997; Hoy 1999; Parthasarathy 2013 4. DeMolles 2004; Fox 2012; Hoet 2017; Hwang 2017; Mendelson 2014; Munafo 2016; Pepin 2019; Stepnowsky 2007; Stepnowsky 2013; Turino 2017 | |||
| Class | Updated Review (Askland 2019) Classification Decision, MD (95%CI) | Sensitivity: Original (Wozniak 2014) Classification Decision, MD (95%CI) |
| Behavioral | 1.31 (0.95 to1.66) I2 = 0% | 1.47 (1.12 to 1.83) I2 = 48% |
| Educational | 0.85 (0.32 to 1.39) I2 = 68% | 0.48 (0.21 to 0.76) I2 = 0% |
| Supportive | 0.70 (0.36 to 1.05) I2 = 42% | 0.58 (0.36 to 0.81) I2 = 45% |
| Class | Full Class Effect Estimates | Exclude endpoints NOT 3 months |
| Behavioral | 1.31 (0.95 to 1.66) I2 = 0% | 1.38 (0.97 to 1.79) |
| Educational | 0.85 (0.32 to 1.39) I2 = 68% | 0.63 (0.26 to 1.00) |
| Supportive | 0.70 (0.36 to 1.05) I2 = 42% | 0.67 (0.29 to 1.04) |
| Mixed | 0.82 (0.20 to 1.43) I2 = 92% | 1.09 (0.21 to 1.97) |
| Full class effect estimates are those derived in our primary analyses, which includes the data from each included study closest to our primary 3‐month endpoint. That is, if no 3‐month endpoint data were available for a study, the endpoint closest to (and later than) 3 months was used. For example if a study reported data at 2 months and 4 months post‐intervention, the 4‐month endpoint data were used. If only a single endpoint was reported by authors (e.g. Bouloukaki 2014 reported only 2‐year endpoint), data for that endpoint was used. | ||
| Outcome or subgroup title | No. of studies | No. of participants | Statistical method | Effect size |
| 1 CPAP Device Usage (hours/night) Show forest plot | 10 | 1128 | Mean Difference (IV, Random, 95% CI) | 0.85 [0.32, 1.39] |
| 2 Machine usage, sensitivity analysis: adherence in control group < four hours/night Show forest plot | 6 | 698 | Mean Difference (IV, Random, 95% CI) | 0.85 [0.06, 1.64] |
| 3 N deemed adherent (≥ four hours/night) Show forest plot | 7 | 1019 | Odds Ratio (M‐H, Random, 95% CI) | 2.58 [1.50, 4.44] |
| 4 Withdrawal Show forest plot | 9 | Odds Ratio (M‐H, Random, 95% CI) | Totals not selected | |
| 5 Epworth Sleepiness Scale ‐ Comparison of Values at Endpoint Show forest plot | 3 | Mean Difference (IV, Random, 95% CI) | Totals not selected | |
| Outcome or subgroup title | No. of studies | No. of participants | Statistical method | Effect size |
| 1 CPAP Device Usage (hours/night) Show forest plot | 13 | 1426 | Mean Difference (IV, Random, 95% CI) | 0.70 [0.36, 1.05] |
| 2 Machine usage, sensitivity analysis: adherence in control group < four hours/night Show forest plot | 7 | 735 | Mean Difference (IV, Fixed, 95% CI) | 0.91 [0.57, 1.25] |
| 3 N deemed adherent (≥ four hours/night) Show forest plot | 2 | 376 | Odds Ratio (M‐H, Fixed, 95% CI) | 1.68 [1.08, 2.60] |
| 4 Withdrawals Show forest plot | 11 | 1702 | Odds Ratio (M‐H, Fixed, 95% CI) | 1.27 [0.97, 1.66] |
| 5 Epworth Sleepiness Scale ‐ Comparison Endpoint or Change from Baseline Values Show forest plot | 9 | Mean Difference (IV, Fixed, 95% CI) | Subtotals only | |
| 5.1 ESS: Endpoint Scores | 6 | 700 | Mean Difference (IV, Fixed, 95% CI) | 0.03 [‐0.59, 0.64] |
| 5.2 ESS: Change from Baseline | 5 | 470 | Mean Difference (IV, Fixed, 95% CI) | ‐0.32 [‐1.19, 0.56] |
| 6 Quality of Life: Comparison of Values at Endpoint Show forest plot | 7 | 683 | Std. Mean Difference (IV, Fixed, 95% CI) | 0.16 [0.01, 0.31] |
| 6.1 QoL: FOSQ ‐ Endpoint | 3 | 109 | Std. Mean Difference (IV, Fixed, 95% CI) | 0.15 [‐0.23, 0.53] |
| 6.2 QoL: SAQLI ‐ Endpoint | 1 | 240 | Std. Mean Difference (IV, Fixed, 95% CI) | 0.22 [‐0.04, 0.47] |
| 6.3 QoL: SF‐36 (PH) ‐ Endpoint | 3 | 334 | Std. Mean Difference (IV, Fixed, 95% CI) | 0.13 [‐0.09, 0.34] |
| 7 Quality of LIfe: Comparison of Change from Baseline Values Show forest plot | 3 | 294 | Std. Mean Difference (IV, Fixed, 95% CI) | 0.22 [‐0.01, 0.45] |
| 7.1 QoL: FOSQ ‐ Change from Baseline | 1 | 39 | Std. Mean Difference (IV, Fixed, 95% CI) | 0.24 [‐0.40, 0.87] |
| 7.2 QoL: SF‐36 (PH) ‐ Change from Baseline | 1 | 82 | Std. Mean Difference (IV, Fixed, 95% CI) | 0.04 [‐0.40, 0.47] |
| 7.3 QoL: FOSQ‐10 ‐ Change from Baseline | 1 | 173 | Std. Mean Difference (IV, Fixed, 95% CI) | 0.30 [0.00, 0.60] |
| 8 Anxiety Symptom Rating (HADS‐A) ‐ Comparison of Values at Endpoint Show forest plot | 1 | Mean Difference (IV, Fixed, 95% CI) | Totals not selected | |
| 9 Machine usage, sensitivity analysis: excluding study with opposite direction of effect (authors suggest negative effect of intervention) Show forest plot | 12 | 1319 | Mean Difference (IV, Random, 95% CI) | 0.74 [0.49, 0.98] |
| 10 AHI on treatment ‐ Comparison of Values at Endpoint Show forest plot | 2 | Mean Difference (IV, Fixed, 95% CI) | Totals not selected | |
| 11 Depression Symptom Rating (HADS‐D, CES‐D) ‐ Comparison of Values at Endpoint Show forest plot | 3 | Std. Mean Difference (IV, Fixed, 95% CI) | Totals not selected | |
| 11.1 HADS‐Depression | 1 | Std. Mean Difference (IV, Fixed, 95% CI) | 0.0 [0.0, 0.0] | |
| 11.2 CES‐D | 2 | Std. Mean Difference (IV, Fixed, 95% CI) | 0.0 [0.0, 0.0] | |
| 12 Cost‐Effectiveness Show forest plot | 1 | Mean Difference (IV, Fixed, 95% CI) | Totals not selected | |
| 13 Machine usage, sensitivity analysis: excluding participants aware of machine usage Show forest plot | 2 | Mean Difference (IV, Fixed, 95% CI) | Totals not selected | |
| Outcome or subgroup title | No. of studies | No. of participants | Statistical method | Effect size |
| 1 CPAP Device Usage (hours/night) Show forest plot | 8 | 578 | Mean Difference (IV, Fixed, 95% CI) | 1.31 [0.95, 1.66] |
| 2 CPAP Device Usage (hours/night), sensitivity analysis: adherence in control group < four hours/night Show forest plot | 6 | 525 | Mean Difference (IV, Fixed, 95% CI) | 1.32 [0.93, 1.72] |
| 3 N deemed adherent (≥ four hours/night) Show forest plot | 6 | 549 | Odds Ratio (M‐H, Fixed, 95% CI) | 1.70 [1.20, 2.41] |
| 4 Withdrawal Show forest plot | 10 | 939 | Odds Ratio (M‐H, Fixed, 95% CI) | 0.66 [0.44, 0.98] |
| 5 Epworth Sleepiness Scale (Endpoint scores) Show forest plot | 5 | 271 | Mean Difference (IV, Random, 95% CI) | ‐2.42 [‐4.27, ‐0.57] |
| 6 AHI on treatment ‐ Endpoint Show forest plot | 2 | 89 | Mean Difference (IV, Fixed, 95% CI) | ‐0.95 [‐2.25, 0.35] |
| 7 Quality of Life ‐ Comparison of Values at Endpoint Show forest plot | 3 | 228 | Std. Mean Difference (IV, Fixed, 95% CI) | 0.00 [‐0.26, 0.26] |
| 7.1 QoL: FOSQ ‐ Endpoint | 2 | 200 | Std. Mean Difference (IV, Fixed, 95% CI) | 0.01 [‐0.26, 0.29] |
| 7.2 QoL: SF‐36 (PH) ‐ Endpoint | 1 | 28 | Std. Mean Difference (IV, Fixed, 95% CI) | ‐0.07 [‐0.82, 0.67] |
| Outcome or subgroup title | No. of studies | No. of participants | Statistical method | Effect size |
| 1 CPAP Device Usage (hours/night) Show forest plot | 11 | 4509 | Mean Difference (IV, Random, 95% CI) | 0.82 [0.20, 1.43] |
| 2 CPAP Device Usage, sensitivity analysis: adherence in control group < four hours/night Show forest plot | 2 | 343 | Mean Difference (IV, Random, 95% CI) | 1.77 [0.21, 3.34] |
| 3 N deemed adherent (≥ four hours/night) Show forest plot | 9 | 4015 | Odds Ratio (M‐H, Random, 95% CI) | 1.71 [1.08, 2.72] |
| 4 Withdrawal Show forest plot | 11 | 4956 | Odds Ratio (M‐H, Random, 95% CI) | 0.61 [0.28, 1.30] |
| 5 Quality of LIfe: Comparison of Change from Baseline Values Show forest plot | 2 | 3012 | Std. Mean Difference (IV, Random, 95% CI) | 0.45 [0.12, 0.78] |
| 5.1 QoL: FOSQ‐10 ‐ Change from Baseline | 1 | 176 | Std. Mean Difference (IV, Random, 95% CI) | 0.25 [‐0.05, 0.54] |
| 5.2 QoL: SF‐36 (PH) ‐ Change from Baseline | 1 | 2836 | Std. Mean Difference (IV, Random, 95% CI) | 0.59 [0.52, 0.67] |
| 6 Quality of Life: Comparison of Values at Endpoint Show forest plot | 4 | 3191 | Std. Mean Difference (IV, Random, 95% CI) | 0.45 [0.06, 0.83] |
| 6.1 QoL: FOSQ ‐ Endpoint | 1 | 177 | Std. Mean Difference (IV, Random, 95% CI) | 0.10 [‐0.19, 0.40] |
| 6.2 QoL: SF‐36 (PH) ‐ Endpoint | 3 | 3014 | Std. Mean Difference (IV, Random, 95% CI) | 0.59 [‐0.01, 1.19] |
| 7 Anxiety Symptom Rating ‐ Comparison of Values at Endpoint Show forest plot | 3 | 333 | Std. Mean Difference (IV, Random, 95% CI) | ‐0.19 [‐0.47, 0.09] |
| 7.1 DASS ‐ Anxiety | 1 | 177 | Std. Mean Difference (IV, Random, 95% CI) | ‐0.03 [‐0.32, 0.27] |
| 7.2 BAI | 1 | 65 | Std. Mean Difference (IV, Random, 95% CI) | ‐0.15 [‐0.63, 0.34] |
| 7.3 STAI ‐ State | 1 | 91 | Std. Mean Difference (IV, Random, 95% CI) | ‐0.49 [‐0.92, ‐0.06] |
| 8 Depression Symptom Rating ‐ Comparison of Values at Endpoint Show forest plot | 4 | Std. Mean Difference (IV, Fixed, 95% CI) | Totals not selected | |
| 8.1 BDI | 1 | Std. Mean Difference (IV, Fixed, 95% CI) | 0.0 [0.0, 0.0] | |
| 8.2 HADS ‐ Depression | 2 | Std. Mean Difference (IV, Fixed, 95% CI) | 0.0 [0.0, 0.0] | |
| 8.3 DASS ‐ Depression | 1 | Std. Mean Difference (IV, Fixed, 95% CI) | 0.0 [0.0, 0.0] | |
| 9 Epworth Sleepiness Scale Score Show forest plot | 7 | Mean Difference (IV, Random, 95% CI) | Totals not selected | |
| 9.1 ESS: Endpoint Scores | 5 | Mean Difference (IV, Random, 95% CI) | 0.0 [0.0, 0.0] | |
| 9.2 ESS: Change from Baseline | 3 | Mean Difference (IV, Random, 95% CI) | 0.0 [0.0, 0.0] | |
| Outcome or subgroup title | No. of studies | No. of participants | Statistical method | Effect size |
| 1 EDU: CPAP Device Usage (hours/night), original EDU study classification Show forest plot | 8 | 1095 | Mean Difference (IV, Fixed, 95% CI) | 0.48 [0.21, 0.76] |
| 2 SUP: CPAP Device Usage (hours/night), original SUP study classification Show forest plot | 14 | 1534 | Mean Difference (IV, Fixed, 95% CI) | 0.58 [0.36, 0.81] |
| 3 BEH: CPAP Device Usage (hours/night), original BEH study classification Show forest plot | 9 | 625 | Mean Difference (IV, Fixed, 95% CI) | 1.47 [1.12, 1.83] |
| 4 EDU: CPAP Device Usage (hours/night), exclude HIGH 'Risk of bias' studies Show forest plot | 4 | 642 | Mean Difference (IV, Random, 95% CI) | 0.98 [0.07, 1.89] |
| 5 SUP: CPAP Device Usage (hours/night), exclude HIGH 'Risk of bias' studies Show forest plot | 5 | 728 | Mean Difference (IV, Fixed, 95% CI) | 0.75 [0.42, 1.09] |
| 6 BEH: CPAP Device Usage (hours/night), exclude HIGH 'Risk of bias' studies Show forest plot | 4 | 340 | Mean Difference (IV, Fixed, 95% CI) | 1.05 [0.57, 1.53] |
| 7 MIX: CPAP Device Usage (hours/night), exclude HIGH 'Risk of bias' studies Show forest plot | 5 | Mean Difference (IV, Random, 95% CI) | Totals not selected | |
| Outcome or subgroup title | No. of studies | No. of participants | Statistical method | Effect size |
| 1 EDU: CPAP Device Usage (hours/night) Show forest plot | 10 | 1128 | Mean Difference (IV, Random, 95% CI) | 0.85 [0.32, 1.39] |
| 1.1 Intervention Duration > 4 weeks | 3 | 453 | Mean Difference (IV, Random, 95% CI) | 0.33 [‐0.10, 0.77] |
| 1.2 Intervention Duration ≤ 4 weeks | 7 | 675 | Mean Difference (IV, Random, 95% CI) | 1.20 [0.39, 2.01] |
| 2 EDU: CPAP Device Usage (hours/night) Show forest plot | 9 | 836 | Mean Difference (IV, Random, 95% CI) | 0.98 [0.36, 1.59] |
| 2.1 Contact Episodes: > 1 | 6 | 514 | Mean Difference (IV, Random, 95% CI) | 1.20 [0.41, 2.00] |
| 2.2 Contact Episodes: 1 (single) | 3 | 322 | Mean Difference (IV, Random, 95% CI) | 0.40 [‐0.06, 0.86] |
| 3 EDU: CPAP Device Usage (hours/night) Show forest plot | 8 | 808 | Mean Difference (IV, Random, 95% CI) | 1.04 [0.37, 1.71] |
| 3.1 Contact Time > 60 min | 3 | 293 | Mean Difference (IV, Random, 95% CI) | 1.46 [0.22, 2.71] |
| 3.2 Contact Time ≤ 60 min | 5 | 515 | Mean Difference (IV, Random, 95% CI) | 0.61 [0.00, 1.22] |
| 4 SUP: Subgroup Analysis ‐ CPAP Device Usage (hours/night) Show forest plot | 13 | 1426 | Mean Difference (IV, Random, 95% CI) | 0.70 [0.36, 1.05] |
| 4.1 Intervention Duration > 12 weeks | 4 | 530 | Mean Difference (IV, Random, 95% CI) | 0.49 [‐0.53, 1.51] |
| 4.2 Intervention duration ≤12 weeks | 9 | 896 | Mean Difference (IV, Random, 95% CI) | 0.72 [0.43, 1.01] |
| 5 SUP: Subgroup Analysis ‐ CPAP Device Usage (hours/night) Show forest plot | 13 | 1426 | Mean Difference (IV, Random, 95% CI) | 0.70 [0.36, 1.05] |
| 5.1 Intervention entailed Automated Contact Only | 4 | 513 | Mean Difference (IV, Random, 95% CI) | 0.26 [‐0.51, 1.04] |
| 5.2 Intervention included Human Contact | 9 | 913 | Mean Difference (IV, Random, 95% CI) | 0.84 [0.52, 1.17] |
| 6 SUP: Subgroup Analysis ‐ CPAP Device Usage (hours/night) Show forest plot | 13 | 1426 | Mean Difference (IV, Fixed, 95% CI) | 0.65 [0.41, 0.89] |
| 6.1 Scheduled, Human Interaction | 3 | 136 | Mean Difference (IV, Fixed, 95% CI) | 1.43 [0.61, 2.24] |
| 6.2 Automated and/or Ad‐hoc Human Contact only | 10 | 1290 | Mean Difference (IV, Fixed, 95% CI) | 0.58 [0.33, 0.83] |
| 7 BEH: Subgroup Analysis ‐ CPAP Device Usage (hours/night) Show forest plot | 8 | 577 | Mean Difference (IV, Random, 95% CI) | 1.31 [0.95, 1.66] |
| 7.1 BEH: Intervention Duration > 4 weeks | 3 | 208 | Mean Difference (IV, Random, 95% CI) | 1.21 [0.60, 1.82] |
| 7.2 BEH: Intervention Duration ≤ 4 weeks | 5 | 369 | Mean Difference (IV, Random, 95% CI) | 1.38 [0.80, 1.95] |
| 8 BEH: Subgroup Analysis ‐ CPAP Device Usage (hours/night) Show forest plot | 8 | 577 | Mean Difference (IV, Random, 95% CI) | 1.31 [0.95, 1.66] |
| 8.1 BEH: Contact Episodes: > 1 | 7 | 537 | Mean Difference (IV, Random, 95% CI) | 1.35 [0.94, 1.77] |
| 8.2 BEH: Contact Episodes: 1 (single) | 1 | 40 | Mean Difference (IV, Random, 95% CI) | 1.10 [0.26, 1.94] |
| 9 BEH: Subgroup Analysis ‐ CPAP Device Usage (hours/night) Show forest plot | 8 | 577 | Mean Difference (IV, Random, 95% CI) | 1.31 [0.95, 1.66] |
| 9.1 BEH: Contact Time > 60 | 6 | 437 | Mean Difference (IV, Random, 95% CI) | 1.15 [0.71, 1.60] |
| 9.2 BEH: Contact Time ≤ 60 | 2 | 140 | Mean Difference (IV, Random, 95% CI) | 1.56 [0.68, 2.44] |
| 10 MIX: Subgroup Analysis ‐ CPAP Device Usage (hours/night) Show forest plot | 11 | 4509 | Mean Difference (IV, Random, 95% CI) | 0.82 [0.20, 1.43] |
| 10.1 Intervention Duration > 4 weeks | 8 | 4178 | Mean Difference (IV, Random, 95% CI) | 1.22 [0.60, 1.83] |
| 10.2 Intervention Duration ≤ 4 weeks | 3 | 331 | Mean Difference (IV, Random, 95% CI) | ‐0.31 [‐0.83, 0.21] |
| 11 MIX: Subgroup Analysis ‐ CPAP Device Usage (hours/night) Show forest plot | 10 | 4242 | Mean Difference (IV, Random, 95% CI) | 0.79 [0.10, 1.48] |
| 11.1 Contact Episodes: > 1 | 9 | 4036 | Mean Difference (IV, Random, 95% CI) | 0.98 [0.32, 1.63] |
| 11.2 Contact Episodes: 1 (single) | 1 | 206 | Mean Difference (IV, Random, 95% CI) | ‐0.60 [‐1.33, 0.13] |
| 12 MIX: Subgroup Analysis ‐ CPAP Device Usage (hours/night) Show forest plot | 10 | 4242 | Mean Difference (IV, Random, 95% CI) | 0.79 [0.10, 1.48] |
| 12.1 Contact Time > 60 min | 6 | 3751 | Mean Difference (IV, Random, 95% CI) | 1.45 [0.73, 2.16] |
| 12.2 Contact Time ≤ 60 min | 4 | 491 | Mean Difference (IV, Random, 95% CI) | ‐0.15 [‐0.56, 0.27] |