Scolaris Content Display Scolaris Content Display

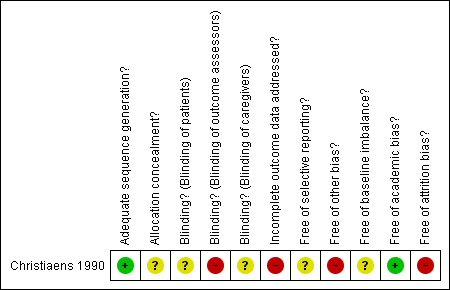
Methodological quality graph for Christiaens 1990.
Figuras y tablas -
Figure 1

Methodological quality graph for Christiaens 1990.

Methodological quality summary: review authors' judgements about each methodological quality item for Christiaens 1990.
Figuras y tablas -
Figure 2

Methodological quality summary: review authors' judgements about each methodological quality item for Christiaens 1990.

Comparison 1 Betamethasone versus no treatment, Outcome 1 Neonatal thrombocytopenia.
Figuras y tablas -
Analysis 1.1

Comparison 1 Betamethasone versus no treatment, Outcome 1 Neonatal thrombocytopenia.

Comparison 1 Betamethasone versus no treatment, Outcome 2 Neonatal bleeding.
Figuras y tablas -
Analysis 1.2

Comparison 1 Betamethasone versus no treatment, Outcome 2 Neonatal bleeding.

Comparison 2 Betamethasone versus no treatment (worse‐case scenario)., Outcome 1 Overall neonatal thrombocytopenia.
Figuras y tablas -
Analysis 2.1

Comparison 2 Betamethasone versus no treatment (worse‐case scenario)., Outcome 1 Overall neonatal thrombocytopenia.

Comparison 2 Betamethasone versus no treatment (worse‐case scenario)., Outcome 2 Neonatal Bleeding.
Figuras y tablas -
Analysis 2.2

Comparison 2 Betamethasone versus no treatment (worse‐case scenario)., Outcome 2 Neonatal Bleeding.

Comparison 3 Betamethasone versus no medication (Best‐case scenario), Outcome 1 Neonatal bleeding.
Figuras y tablas -
Analysis 3.1

Comparison 3 Betamethasone versus no medication (Best‐case scenario), Outcome 1 Neonatal bleeding.

Comparison 4 Betamethasone versus no treatment (Intention‐to treat analysis)., Outcome 1 Neonatal thrombocytopenia.
Figuras y tablas -
Analysis 4.1

Comparison 4 Betamethasone versus no treatment (Intention‐to treat analysis)., Outcome 1 Neonatal thrombocytopenia.

Comparison 4 Betamethasone versus no treatment (Intention‐to treat analysis)., Outcome 2 Neonatal bleeding.
Figuras y tablas -
Analysis 4.2

Comparison 4 Betamethasone versus no treatment (Intention‐to treat analysis)., Outcome 2 Neonatal bleeding.

Comparison 5 Bethamethasone versus no treatment (best‐case scenario), Outcome 1 Overall neonatal thrombocytopenia.
Figuras y tablas -
Analysis 5.1

Comparison 5 Bethamethasone versus no treatment (best‐case scenario), Outcome 1 Overall neonatal thrombocytopenia.

Comparison 1. Betamethasone versus no treatment

Outcome or subgroup title

No. of studies

No. of participants

Statistical method

Effect size

1 Neonatal thrombocytopenia Show forest plot

1

Risk Ratio (IV, Fixed, 95% CI)

Subtotals only

1.1 Overall

1

28

Risk Ratio (IV, Fixed, 95% CI)

1.13 [0.62, 2.05]

1.2 Severe

1

28

Risk Ratio (IV, Fixed, 95% CI)

1.0 [0.16, 6.14]

1.3 Mild

1

28

Risk Ratio (IV, Fixed, 95% CI)

1.17 [0.52, 2.60]

2 Neonatal bleeding Show forest plot

1

28

Risk Ratio (IV, Fixed, 95% CI)

1.0 [0.24, 4.13]

Figuras y tablas -
Comparison 1. Betamethasone versus no treatment
Comparison 2. Betamethasone versus no treatment (worse‐case scenario).

Outcome or subgroup title

No. of studies

No. of participants

Statistical method

Effect size

1 Overall neonatal thrombocytopenia Show forest plot

1

41

Risk Ratio (IV, Fixed, 95% CI)

1.97 [1.08, 3.59]

2 Neonatal Bleeding Show forest plot

1

41

Risk Ratio (IV, Fixed, 95% CI)

3.15 [0.99, 9.99]

Figuras y tablas -
Comparison 2. Betamethasone versus no treatment (worse‐case scenario).
Comparison 3. Betamethasone versus no medication (Best‐case scenario)

Outcome or subgroup title

No. of studies

No. of participants

Statistical method

Effect size

1 Neonatal bleeding Show forest plot

1

41

Risk Ratio (IV, Fixed, 95% CI)

0.32 [0.10, 0.98]

Figuras y tablas -
Comparison 3. Betamethasone versus no medication (Best‐case scenario)
Comparison 4. Betamethasone versus no treatment (Intention‐to treat analysis).

Outcome or subgroup title

No. of studies

No. of participants

Statistical method

Effect size

1 Neonatal thrombocytopenia Show forest plot

1

Risk Ratio (IV, Fixed, 95% CI)

Subtotals only

1.1 Overall

1

41

Risk Ratio (IV, Fixed, 95% CI)

1.18 [0.57, 2.45]

1.2 Severe

1

41

Risk Ratio (IV, Fixed, 95% CI)

1.05 [0.16, 6.76]

1.3 Mild

1

41

Risk Ratio (IV, Fixed, 95% CI)

1.23 [0.50, 3.02]

2 Neonatal bleeding Show forest plot

1

41

Risk Ratio (IV, Fixed, 95% CI)

1.05 [0.24, 4.61]

Figuras y tablas -
Comparison 4. Betamethasone versus no treatment (Intention‐to treat analysis).
Comparison 5. Bethamethasone versus no treatment (best‐case scenario)

Outcome or subgroup title

No. of studies

No. of participants

Statistical method

Effect size

1 Overall neonatal thrombocytopenia Show forest plot

1

41

Risk Ratio (IV, Fixed, 95% CI)

0.63 [0.36, 1.10]

Figuras y tablas -
Comparison 5. Bethamethasone versus no treatment (best‐case scenario)