Anticuerpos anti‐IL‐12/23p40 para la inducción de la remisión en la enfermedad de Crohn
Referencias
References to studies included in this review
References to studies excluded from this review
References to ongoing studies
Additional references
Characteristics of studies
Characteristics of included studies [ordered by study ID]
| Methods | Randomized, double‐blind, placebo‐controlled, multicenter trial | |
| Participants | Adult patients (> 18 years) with moderate to severe Crohn's disease who have failed TNF‐alpha antagonist therapy (N = 741) Patients must have received TNF‐alpha antagonists at approved doses and had documented primary non‐response, secondary non‐response or intolerance criteria | |
| Interventions | Group 1: placebo; i.v. (n = 245) Group 2: 130 mg of ustekinumab, i.v. (n = 246) Group 3: 6 mg/kg of ustekinumab; i.v. (n = 249) | |
| Outcomes | Primary outcome: Clinical response at week 6 (the number of patients in clinical response, as measured by a reduction in CDAI of > 100 points from baseline or CDAI < 150 at week 6) The primary outcome for the maintenance study was clinical remission at week 44 1. Clinical remission at week 8 (the number of patients in clinical remission, defined by CDAI < 150) 2. Clinical response at week 8 3. > 70 point CDAI decrease at weeks 3 and 6 4. Adverse events 5. Serious adverse events 6. Quality of Life 7. CRP | |
| Duration of follow‐up | Induction phase: 8 weeks (20 weeks for patients not entering maintenance phase) Maintenance phase: 44 weeks | |
| Notes | ||
| Risk of bias | ||
| Bias | Authors' judgement | Support for judgement |
| Random sequence generation (selection bias) | Low risk | Computer‐generated |
| Allocation concealment (selection bias) | Low risk | Centralized randomization using permuted blocks |
| Blinding (performance bias and detection bias) | Low risk | Double‐blind Identical placebo |
| Incomplete outcome data (attrition bias) | Low risk | Drop‐outs were balanced across interventions with similar reasons for withdrawal |
| Incomplete outcome data (attrition bias) | Low risk | Drop‐outs were balanced across interventions with similar reasons for withdrawal |
| Selective reporting (reporting bias) | Low risk | All expected outcomes were reported |
| Other bias | Low risk | The study appears to be free of other sources of bias |
| Methods | Randomized, double‐blind, placebo‐controlled, multicenter trial | |
| Participants | Adult patients (> 18 years) with moderate to severe Crohn's disease who have failed corticosteroids or immunosuppressants (azathioprine, 6‐mercaptopurine or methotrexate) or both (N = 628) Patients could have received TNF‐alpha antagonists without demonstration of inadequate response or intolerance | |
| Interventions | Group 1: Placebo; i.v. 9 (n = 210) Group 2: 130 mg of Ustekinumab; i.v. (n = 209) Group 3: 6 mg/kg of body weight of Ustekinumab; i.v. (n = 209) | |
| Outcomes | Primary outcome: Clinical response at week 6 1. Clinical remission at week 8 2. Clinical response through week 8 3. > 70 point CDAI decrease at weeks 3 and 6 4. Adverse events 5. Serious adverse events 6. Quality of Life 7. CRP | |
| Duration of follow‐up | Induction phase: 8 weeks (20 weeks for patients not entering maintenance phase) Maintenance phase: 44 weeks | |
| Notes | ||
| Risk of bias | ||
| Bias | Authors' judgement | Support for judgement |
| Random sequence generation (selection bias) | Low risk | Computer‐generated |
| Allocation concealment (selection bias) | Low risk | Centralized randomization using permuted blocks |
| Blinding (performance bias and detection bias) | Low risk | Double‐blind Identical placebo |
| Incomplete outcome data (attrition bias) | Low risk | Drop‐outs were balanced across interventions with similar reasons for withdrawal |
| Incomplete outcome data (attrition bias) | Low risk | Drop‐outs were balanced across interventions with similar reasons for withdrawal |
| Selective reporting (reporting bias) | Low risk | All expected outcomes were reported |
| Other bias | Low risk | The study appears to be free of other sources of bias |
| Methods | Randomized, double‐blind, placebo‐controlled, multi‐center trial in the USA, Germany, and the Netherlands Patients were randomized 1:2:2 to placebo or one of the two dosages of briakinumab | |
| Participants | Participants with clinically active Crohn's disease (N = 79) Inclusion criteria: CDAI 220‐450, age ≥18 years Exclusion criteria: recently started Crohn's related medication, infections, history of malignancies, moderate to severe asthma, pregnancy/lactation, intestinal obstruction, stricture, ostomy, short bowel syndrome or probable operation in the near future | |
| Interventions | Briakinumab was given at two different dosages: 1 mg/kg body weight subcutaneously (n = 31) or 3 mg/kg body weight subcutaneously (n = 32) Patients were enrolled into two cohorts with different dosing regimens (week 0, 4, 5, 6, 7, 8, 9 or week 0, 1, 2, 3, 4, 5, 6) with the first forty patients being enrolled in the former dosing regimen Each dosing cohort included a placebo group with 8 patients | |
| Outcomes | Primary outcome: adverse events Secondary outcomes: clinical response (CDAI decrease ≥ 100), clinical remission (CDAI < 150), anti‐drug antibodies, histologic response (subgroup, modified D'Haens score, only partially reported), cytokine secretion by lamina propria mononuclear cells (subgroup, only partially reported) Endoscopic relapse / remission and quality of life were not assessed | |
| Duration of follow‐up | ˜27 weeks after last injection (i.e. 5 to 6 months after randomisation) | |
| Notes | For the purpose of this review the two different dosing regimens were combined for each dosage of briakinumab Different dosages were assessed separately The respective control groups were split evenly | |
| Risk of bias | ||
| Bias | Authors' judgement | Support for judgement |
| Random sequence generation (selection bias) | Low risk | Computer generated randomization (as per investigator) |
| Allocation concealment (selection bias) | Low risk | Telephone interactive voice response system for treatment allocation (as per investigator) |
| Blinding (performance bias and detection bias) | Low risk | Blinding of patients and investigators: The placebo was the same isotonic solution as the antibody |
| Incomplete outcome data (attrition bias) | Low risk | Last observation carried forward for incomplete data Drop‐outs were balanced across interventions with similar reasons for withdrawal |
| Incomplete outcome data (attrition bias) | Low risk | Participants who discontinued the study were included in the safety analysis unless lost to follow‐up Drop‐outs were balanced across interventions with similar reasons for withdrawal |
| Selective reporting (reporting bias) | Unclear risk | Pre‐specified primary and secondary outcomes (safety and efficacy) were reported Histology and laboratory scores were only reported for the treatment group |
| Other bias | Low risk | The study appears to be free of other sources of bias |
| Methods | Double‐blind, randomized, placebo‐controlled trial | |
| Participants | Inclusion criteria: Adult patients with a diagnosis of CD for > 4 months, and a Crohn’s Disease Activity Index (CDAI) score ≥ 220 and ≤ 450 (N = 246) Previous exposure to approved anti‐TNF agents (including adalimumab, certolizumab, etanercept, infiximab, certain investigational drugs, and tumor necrosis factor receptor [IgG1]) was permitted if discontinued at least 8 weeks prior to baseline Secondary non responders and primary non‐responders to prior anti‐TNF agents were eligible Patients were allowed to continue azathioprine, 6‐mercaptopurine (6‐MP), or methotrexate (MTX) provided they had received these medications for at least 12 weeks with stable doses for at least 4 weeks prior to entry Corticosteroids were permitted provided doses were stable (e.g. prednisolone ≤ 40 mg/day or equivalent, or budesonide ≤ 9 mg/day) for at least 2 weeks prior to entry | |
| Interventions | I.V. infusions of briakinumab (200 mg, n = 16; 400 mg, n = 45; 700 mg, n = 139) or placebo (n = 46) administered at weeks 0, 4, and 8 and stratified at baseline (week 0) by prior TNF antagonist use (TNF antagonist naive vs TNF antagonist experienced) and TNF antagonist response (primary non‐response vs secondary loss of response or secondary non responders) | |
| Outcomes | Primary outcome: clinical remission (CDAI < 150) at week 6 Secondary outcomes: clinical remission at week 12, clinical response (CDAI decrease > 100) at week 6 and 12; IBDQ | |
| Duration of follow‐up | Induction: 12 weeks Maintenance: 20 weeks (not reported in review) | |
| Notes | 200 mg group was removed from efficacy analysis due to poor enrolment (included in safety analysis) Study was stopped by sponsor during the open‐label phase due to poor induction of remission results | |
| Risk of bias | ||
| Bias | Authors' judgement | Support for judgement |
| Random sequence generation (selection bias) | Low risk | Computer‐generated randomization |
| Allocation concealment (selection bias) | Low risk | Centralized allocation |
| Blinding (performance bias and detection bias) | Low risk | Double‐blind "The study sponsor, site personnel, and patients were unaware of the treatment assignments throughout both the induction and maintenance phases" |
| Incomplete outcome data (attrition bias) | Low risk | Drop‐outs were balanced across interventions with similar reasons for withdrawal |
| Incomplete outcome data (attrition bias) | Low risk | Drop‐outs were balanced across interventions with similar reasons for withdrawal |
| Selective reporting (reporting bias) | Low risk | Expected outcomes were reported |
| Other bias | Low risk | The study appears to be free of other sources of bias |
| Methods | Randomized, double‐blind, placebo‐controlled multi‐center trial with a cross‐over design in the USA Patients were randomized 1:1:1:1 to an intravenous or subcutaneous arm, each with a placebo group Within each arm patients crossed over to the treatment or control group after eight weeks | |
| Participants | Participants with clinically active Crohn's disease (N = 104) Inclusion criteria: CDAI 220‐450, age ≥ 18 years. Patients had received at least one of the following in the past: 5‐ASA, antibiotics, corticosteroids, azathioprine, 6‐mercaptopurine, methotrexate, submaximal infliximab doses or regimens, or other anti‐TNF‐α‐agents Exclusion criteria: > 20 mg prednisolone, recent treatment with any investigational agent or an anti‐TNF‐α‐agents, infections, cancer, short‐bowel syndrome, ostomy, obstructive symptoms with strictures | |
| Interventions | Ustekinumab was given at 90 mg s.c. per week over four weeks (n = 25) or 4.5 mg/kg body weight i.v. once (n = 26), each compared to s.c. placebo (n = 26) or i.v. placebo (n = 27) | |
| Outcomes | Primary outcome: Clinical response at week 8 (CDAI decrease ≥ 75 and ≥ 25%) Secondary outcomes: Clinical remission (CDAI < 150), laboratory results including CRP value, adverse events, anti‐drug antibodies, adherence to therapy. Endoscopic response / remission and quality of life were not assessed. | |
| Duration of follow‐up | 8 weeks until cross‐over and 20 weeks thereafter | |
| Notes | Only the first part of the cross‐over design was evaluated for this review The placebo controlled study was accompanied by an unblinded study with participants who were non‐responsive to infliximab The unblinded sub‐study was not included in this review since it was not a placebo‐controlled or active comparator study | |
| Risk of bias | ||
| Bias | Authors' judgement | Support for judgement |
| Random sequence generation (selection bias) | Low risk | Computer generated adaptive randomization stratified by investigative site |
| Allocation concealment (selection bias) | Low risk | Centralized randomization scheme |
| Blinding (performance bias and detection bias) | Low risk | Blinding of patients and investigators Identical placebo |
| Incomplete outcome data (attrition bias) | Low risk | Intention‐to‐treat analysis with worst case assumption Drop‐outs were balanced across interventions with similar reasons for withdrawal |
| Incomplete outcome data (attrition bias) | Low risk | Drop‐outs were balanced across interventions with similar reasons for withdrawal |
| Selective reporting (reporting bias) | Low risk | All assessed outcomes were reported |
| Other bias | Low risk | The study appears to be free of other sources of bias |
| Methods | Randomzed double‐blind, placebo‐controlled trial | |
| Participants | Inclusion criteria: Adults (> 18 years) at least a 3 month history of Crohn’s disease with a CDAI of 220 to 450 (N = 526) Patients had moderate to severe Crohn's disease that was resistant to TNF‐α antagonists Exclusion: Previous therapy specifically targeting interleukin‐12 or interleukin‐23 | |
| Interventions | Intravenous ustekinumab 1 mg/kg (n = 131), 3 mg/kg (n=132), 6 mg/kg (n = 131) or placebo (n = 132) | |
| Outcomes | The primary outcome: clinical response (≥ 100 point decrease in CDAI) at week 6 Secondary outcomes: clinical remission (CDAI score, < 150 points) at week 6, clinical response at week 4, and clinical remission at week 22 among patients with a response to ustekinumab at week 6 | |
| Duration of follow‐up | Induction phase: 8 weeks Maintenance phase: 36 weeks (not included) | |
| Notes | ||
| Risk of bias | ||
| Bias | Authors' judgement | Support for judgement |
| Random sequence generation (selection bias) | Low risk | Computer generated adaptive randomization stratified by investigative site and the initial response to a TNFalpha antagonist |
| Allocation concealment (selection bias) | Low risk | Centrally generated randomization scheme |
| Blinding (performance bias and detection bias) | Low risk | Double blind Identical placebo |
| Incomplete outcome data (attrition bias) | Low risk | Intention‐to‐treat analysis and all subjects who began the study are accounted for in the results Drop‐outs were balanced across interventions with similar reasons for withdrawal |
| Incomplete outcome data (attrition bias) | Low risk | Drop‐outs were balanced across interventions with similar reasons for withdrawal |
| Selective reporting (reporting bias) | Low risk | All expected outcomes were reported |
| Other bias | Low risk | The study appears to be free of other sources of bias |
CDAI = Crohn's disease activity index
Characteristics of excluded studies [ordered by study ID]
| Study | Reason for exclusion |
| This pharmacokinetic study compared intravenous ustekinumab at a dose of 4.5 mg/kg to subcutaneously administered ustekinumab (90 mg) | |
| Oral study drug (different route of administration) and drug is not a monoclonal antibody (different mechanism of action) |
Characteristics of ongoing studies [ordered by study ID]
| Trial name or title | A phase 3, randomized, double‐blind, placebo‐controlled, parallel‐group, multicenter study to evaluate the safety and efficacy of ustekinumab induction therapy in subjects with moderately to severely active Crohn's disease who have failed or are intolerant to TNF antagonist therapy (UNITI‐1) |
| Methods | Double‐blind, randomized, placebo‐controlled study; single i.v infusion of placebo or ustekinumab; safety and efficacy assessed through 8 weeks in subjects that had previously failed TNFa therapy |
| Participants | ˜ 703 subjects Inclusion Criteria:
|
| Interventions | Group 1: placebo; i.v. Group 2: 130 mg of ustekinumab, i.v. Group 3: 6 mg/kg of ustekinumab; i.v. |
| Outcomes | Primary outcome: Clinical response at week 6 (the number of patients in clinical response, as measured by reduction in CDAI from baseline) 2. Clinical response through week 8 (the number of patients experiencing clinical response as measured by reduction in CDAI from baseline) |
| Starting date | July 2011 |
| Contact information | Janssen Research & Development, LLC |
| Notes | This study has been completed There are no published results as of 31 March 2015 |
| Trial name or title | A phase 3, randomized, double‐blind, placebo‐controlled, parallel‐group, multicenter study to evaluate the safety and efficacy of ustekinumab induction therapy in subjects with moderately to severely active Crohn's disease (UNITI‐2) |
| Methods | Double‐blind, randomized, placebo‐controlled study; single injection of ustekinumab or placebo; safety and efficacy assessed over an 8 week period |
| Participants | ˜ 612 subjects Inclusion Criteria:
|
| Interventions |
|
| Outcomes | Primary outcome: Clinical response at week 6 1. Clinical remission at week 8 2. Clinical response through week 8 |
| Starting date | July 2011 |
| Contact information | Janssen Research & Development, LLC |
| Notes | This study has been completed There are no published results as of 31 March 2015 |
| Trial name or title | A phase 3, randomized, double‐blind, placebo‐controlled, parallel‐group, multicenter study to evaluate the safety and efficacy of ustekinumab maintenance therapy in subjects with moderately to severely active Crohn's disease |
| Methods | Double‐blind, randomized, placebo‐controlled, parallel‐group design to assess whether additional subcutaneous (SC) ustekinumab treatment is beneficial in patients showing a clinical response to intravenous (IV) ustekinumab in the initial 2 induction studies |
| Participants | Estimated Enrolment is 1310 subjects Inclusion Criteria: Patients who received study agent at the start of study CNTO1275CRD3001 or CNTO1275CRD3002 and completed the Week 8 visit |
| Interventions | Group 1: Patients in response to IV ustekinumab will be randomized to receive either placebo, Group 2: Ustekinumab 90 mg SC every 12 weeks Group 3: Ustekinumab 90 mg SC every 8 weeks If patients in Groups 1 or 2 lose response, they will cross over to receive ustekinumab 90 mg every 8 weeks Other populations (nonresponders to prior IV ustekinumab or IV placebo) will receive ustekinumab at week 0 (either 90 mg SC or 130 mg IV, respectively) and continue SC ustekinumab if in response at week 8 |
| Outcomes | Primary outcome: Clinical remission at week 44 Secondary outcomes: 1. Remission in patient subgroups such as those in remission at Week 0 or those who previously failed TNF‐antagonists at week 44 2. Clinical response at week 44 3. Corticosteroid‐free remission at week 44 |
| Starting date | September 2011 |
| Contact information | |
| Notes | The estimated completion date is September 2018 |
Data and analyses
| Outcome or subgroup title | No. of studies | No. of participants | Statistical method | Effect size |
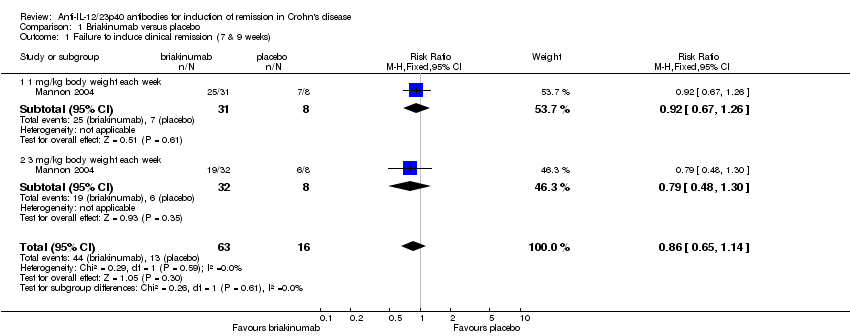
| 1 Failure to induce clinical remission (7 & 9 weeks) Show forest plot | 1 | 79 | Risk Ratio (M‐H, Fixed, 95% CI) | 0.86 [0.65, 1.14] |
| Analysis 1.1  Comparison 1 Briakinumab versus placebo, Outcome 1 Failure to induce clinical remission (7 & 9 weeks). | ||||
| 1.1 1 mg/kg body weight each week | 1 | 39 | Risk Ratio (M‐H, Fixed, 95% CI) | 0.92 [0.67, 1.26] |
| 1.2 3 mg/kg body weight each week | 1 | 40 | Risk Ratio (M‐H, Fixed, 95% CI) | 0.79 [0.48, 1.30] |
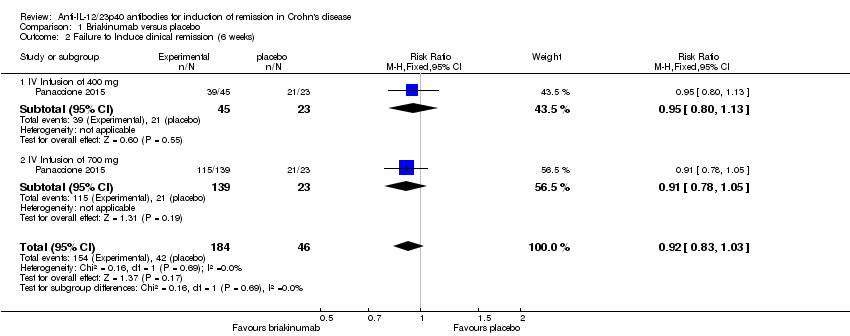
| 2 Failure to Induce clinical remission (6 weeks) Show forest plot | 1 | 230 | Risk Ratio (M‐H, Fixed, 95% CI) | 0.92 [0.83, 1.03] |
| Analysis 1.2  Comparison 1 Briakinumab versus placebo, Outcome 2 Failure to Induce clinical remission (6 weeks). | ||||
| 2.1 IV Infusion of 400 mg | 1 | 68 | Risk Ratio (M‐H, Fixed, 95% CI) | 0.95 [0.80, 1.13] |
| 2.2 IV Infusion of 700 mg | 1 | 162 | Risk Ratio (M‐H, Fixed, 95% CI) | 0.91 [0.78, 1.05] |
| 3 Failure to induce clinical response (>= 100 points; 7 & 9 weeks) Show forest plot | 1 | 79 | Risk Ratio (M‐H, Fixed, 95% CI) | 0.65 [0.42, 0.99] |
| Analysis 1.3  Comparison 1 Briakinumab versus placebo, Outcome 3 Failure to induce clinical response (>= 100 points; 7 & 9 weeks). | ||||
| 3.1 1 mg/kg body weight each week | 1 | 39 | Risk Ratio (M‐H, Fixed, 95% CI) | 0.73 [0.44, 1.22] |
| 3.2 3 mg/kg body weight each week | 1 | 40 | Risk Ratio (M‐H, Fixed, 95% CI) | 0.55 [0.27, 1.13] |
| 4 Failure to induce clinical response (>= 100 points; 6 weeks) Show forest plot | 1 | 230 | Risk Ratio (M‐H, Fixed, 95% CI) | 0.82 [0.67, 0.99] |
| Analysis 1.4 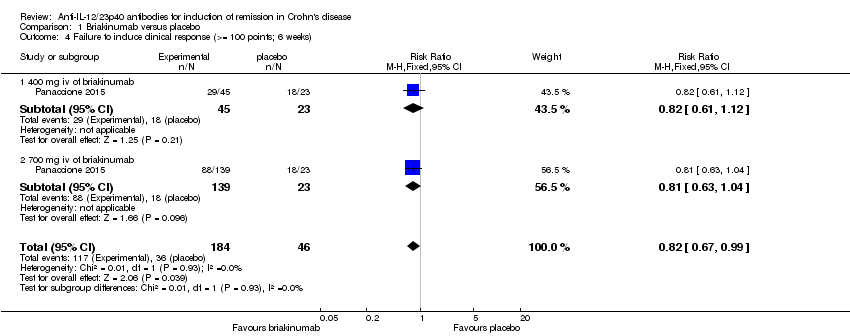 Comparison 1 Briakinumab versus placebo, Outcome 4 Failure to induce clinical response (>= 100 points; 6 weeks). | ||||
| 4.1 400 mg iv of briakinumab | 1 | 68 | Risk Ratio (M‐H, Fixed, 95% CI) | 0.82 [0.61, 1.12] |
| 4.2 700 mg iv of briakinumab | 1 | 162 | Risk Ratio (M‐H, Fixed, 95% CI) | 0.81 [0.63, 1.04] |
| 5 Adverse events Show forest plot | 1 | Risk Ratio (M‐H, Fixed, 95% CI) | Totals not selected | |
| Analysis 1.5 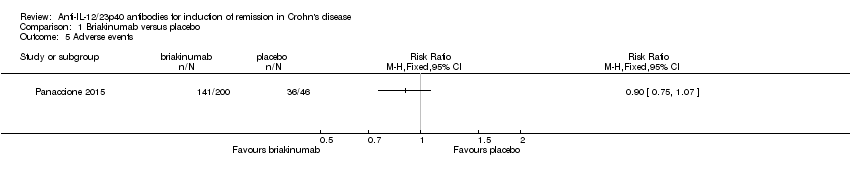 Comparison 1 Briakinumab versus placebo, Outcome 5 Adverse events. | ||||
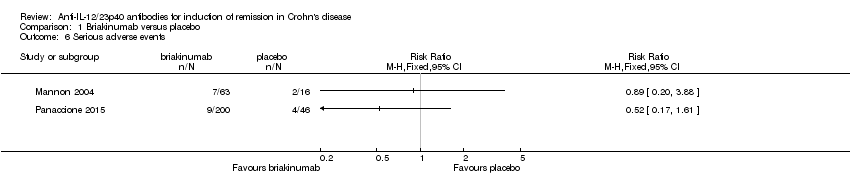
| 6 Serious adverse events Show forest plot | 2 | Risk Ratio (M‐H, Fixed, 95% CI) | Totals not selected | |
| Analysis 1.6  Comparison 1 Briakinumab versus placebo, Outcome 6 Serious adverse events. | ||||
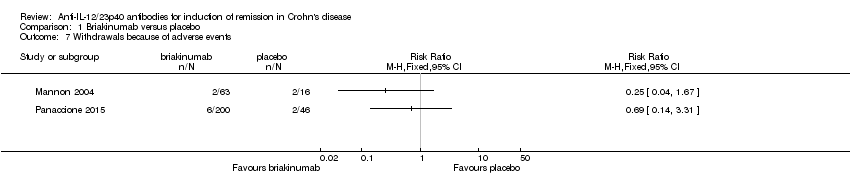
| 7 Withdrawals because of adverse events Show forest plot | 2 | Risk Ratio (M‐H, Fixed, 95% CI) | Totals not selected | |
| Analysis 1.7  Comparison 1 Briakinumab versus placebo, Outcome 7 Withdrawals because of adverse events. | ||||
| Outcome or subgroup title | No. of studies | No. of participants | Statistical method | Effect size |
| 1 Failure to induce clinical remission (6 weeks) Show forest plot | 4 | 1947 | Risk Ratio (M‐H, Random, 95% CI) | 0.91 [0.86, 0.95] |
| Analysis 2.1  Comparison 2 Ustekinumab versus placebo, Outcome 1 Failure to induce clinical remission (6 weeks). | ||||
| 1.1 1.0 mg/kg IV | 1 | 175 | Risk Ratio (M‐H, Random, 95% CI) | 0.92 [0.82, 1.04] |
| 1.2 3.0 mg/kg IV | 1 | 176 | Risk Ratio (M‐H, Random, 95% CI) | 0.95 [0.83, 1.08] |
| 1.3 4.5 mg/kg IV | 1 | 53 | Risk Ratio (M‐H, Random, 95% CI) | 0.87 [0.67, 1.11] |
| 1.4 6.0 mg/kg IV | 3 | 1543 | Risk Ratio (M‐H, Random, 95% CI) | 0.90 [0.82, 0.98] |
| 2 Failure to induce clinical remission (6 weeks; sensitivity analysis) Show forest plot | 3 | 1320 | Risk Ratio (M‐H, Fixed, 95% CI) | 0.92 [0.88, 0.96] |
| Analysis 2.2 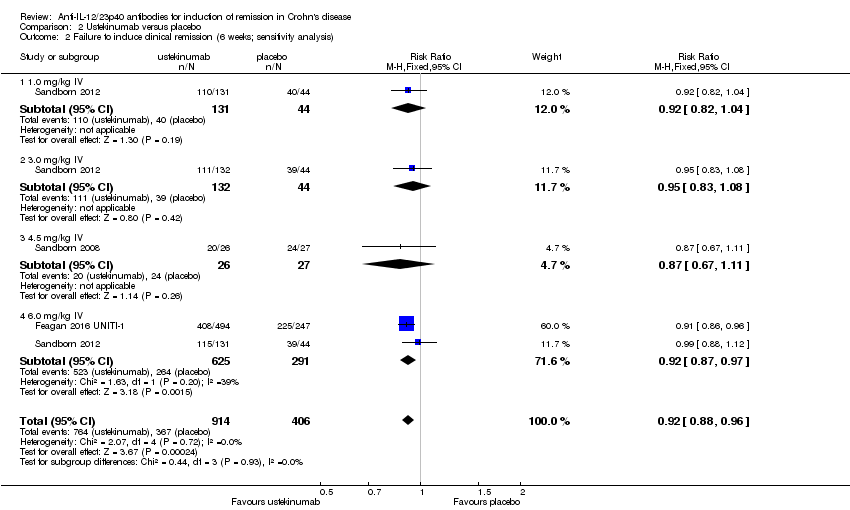 Comparison 2 Ustekinumab versus placebo, Outcome 2 Failure to induce clinical remission (6 weeks; sensitivity analysis). | ||||
| 2.1 1.0 mg/kg IV | 1 | 175 | Risk Ratio (M‐H, Fixed, 95% CI) | 0.92 [0.82, 1.04] |
| 2.2 3.0 mg/kg IV | 1 | 176 | Risk Ratio (M‐H, Fixed, 95% CI) | 0.95 [0.83, 1.08] |
| 2.3 4.5 mg/kg IV | 1 | 53 | Risk Ratio (M‐H, Fixed, 95% CI) | 0.87 [0.67, 1.11] |
| 2.4 6.0 mg/kg IV | 2 | 916 | Risk Ratio (M‐H, Fixed, 95% CI) | 0.92 [0.87, 0.97] |
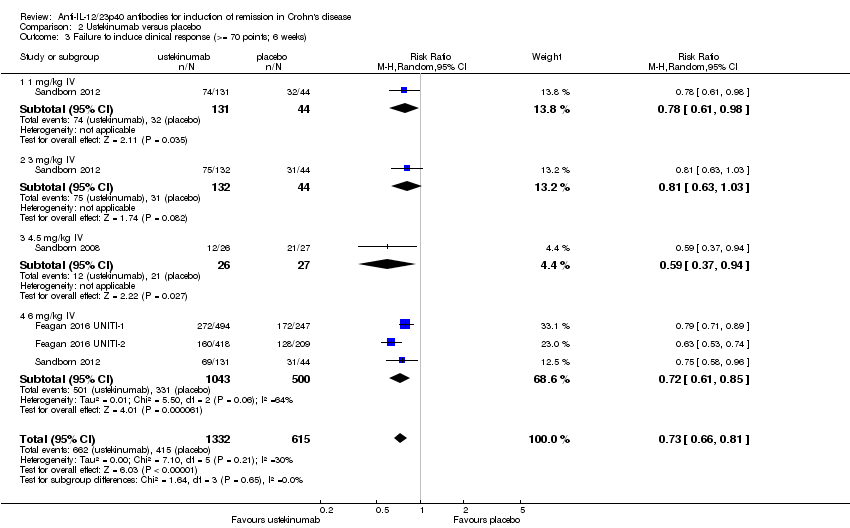
| 3 Failure to induce clinical response (>= 70 points; 6 weeks) Show forest plot | 4 | 1947 | Risk Ratio (M‐H, Random, 95% CI) | 0.73 [0.66, 0.81] |
| Analysis 2.3  Comparison 2 Ustekinumab versus placebo, Outcome 3 Failure to induce clinical response (>= 70 points; 6 weeks). | ||||
| 3.1 1 mg/kg IV | 1 | 175 | Risk Ratio (M‐H, Random, 95% CI) | 0.78 [0.61, 0.98] |
| 3.2 3 mg/kg IV | 1 | 176 | Risk Ratio (M‐H, Random, 95% CI) | 0.81 [0.63, 1.03] |
| 3.3 4.5 mg/kg IV | 1 | 53 | Risk Ratio (M‐H, Random, 95% CI) | 0.59 [0.37, 0.94] |
| 3.4 6 mg/kg IV | 3 | 1543 | Risk Ratio (M‐H, Random, 95% CI) | 0.72 [0.61, 0.85] |
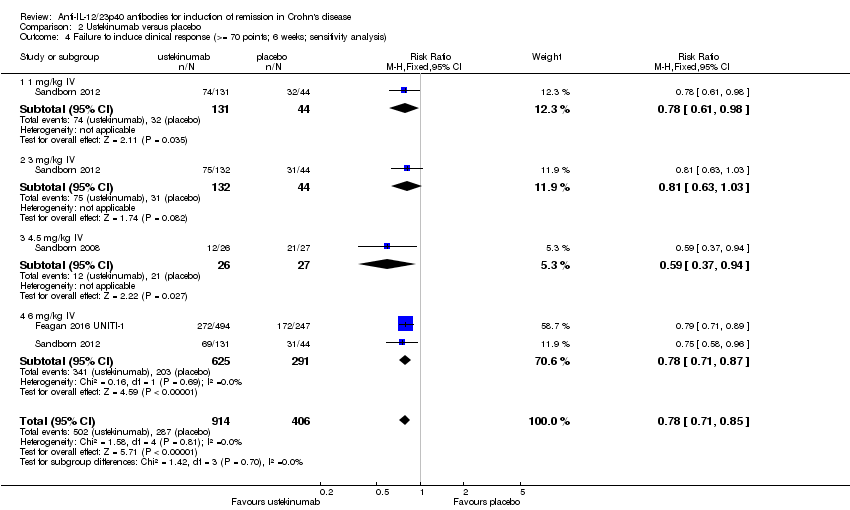
| 4 Failure to induce clinical response (>= 70 points; 6 weeks; sensitivity analysis) Show forest plot | 3 | 1320 | Risk Ratio (M‐H, Fixed, 95% CI) | 0.78 [0.71, 0.85] |
| Analysis 2.4  Comparison 2 Ustekinumab versus placebo, Outcome 4 Failure to induce clinical response (>= 70 points; 6 weeks; sensitivity analysis). | ||||
| 4.1 1 mg/kg IV | 1 | 175 | Risk Ratio (M‐H, Fixed, 95% CI) | 0.78 [0.61, 0.98] |
| 4.2 3 mg/kg IV | 1 | 176 | Risk Ratio (M‐H, Fixed, 95% CI) | 0.81 [0.63, 1.03] |
| 4.3 4.5 mg/kg IV | 1 | 53 | Risk Ratio (M‐H, Fixed, 95% CI) | 0.59 [0.37, 0.94] |
| 4.4 6 mg/kg IV | 2 | 916 | Risk Ratio (M‐H, Fixed, 95% CI) | 0.78 [0.71, 0.87] |
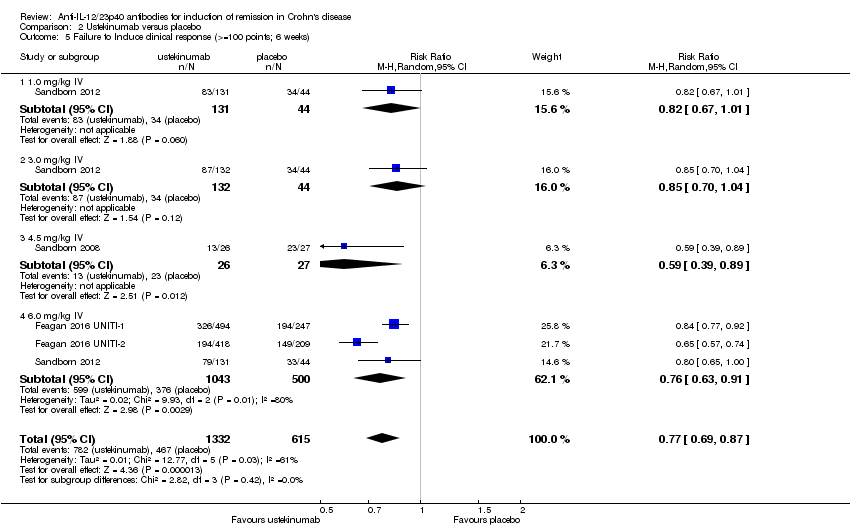
| 5 Failure to Induce clinical response (>=100 points; 6 weeks) Show forest plot | 4 | 1947 | Risk Ratio (M‐H, Random, 95% CI) | 0.77 [0.69, 0.87] |
| Analysis 2.5  Comparison 2 Ustekinumab versus placebo, Outcome 5 Failure to Induce clinical response (>=100 points; 6 weeks). | ||||
| 5.1 1.0 mg/kg IV | 1 | 175 | Risk Ratio (M‐H, Random, 95% CI) | 0.82 [0.67, 1.01] |
| 5.2 3.0 mg/kg IV | 1 | 176 | Risk Ratio (M‐H, Random, 95% CI) | 0.85 [0.70, 1.04] |
| 5.3 4.5 mg/kg IV | 1 | 53 | Risk Ratio (M‐H, Random, 95% CI) | 0.59 [0.39, 0.89] |
| 5.4 6.0 mg/kg IV | 3 | 1543 | Risk Ratio (M‐H, Random, 95% CI) | 0.76 [0.63, 0.91] |
| 6 Failure to Induce clinical response (>=100 points; 6 weeks; sensitivity analysis) Show forest plot | 3 | 1320 | Risk Ratio (M‐H, Fixed, 95% CI) | 0.82 [0.77, 0.88] |
| Analysis 2.6 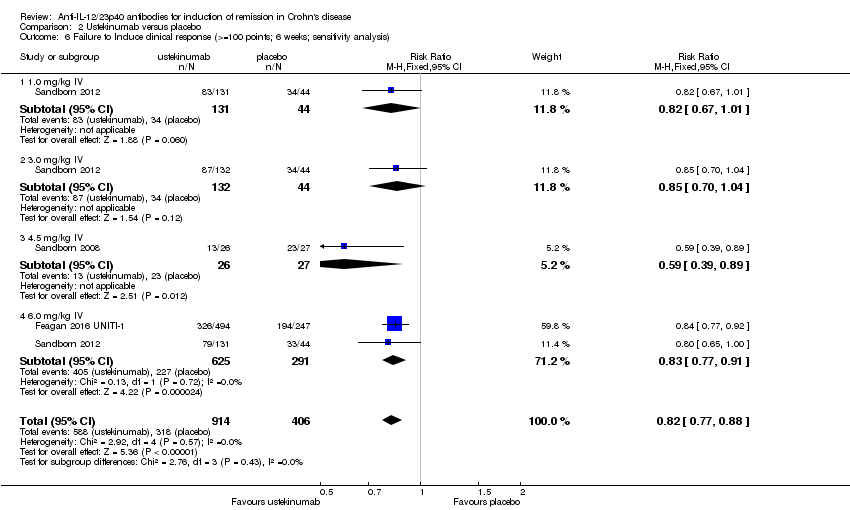 Comparison 2 Ustekinumab versus placebo, Outcome 6 Failure to Induce clinical response (>=100 points; 6 weeks; sensitivity analysis). | ||||
| 6.1 1.0 mg/kg IV | 1 | 175 | Risk Ratio (M‐H, Fixed, 95% CI) | 0.82 [0.67, 1.01] |
| 6.2 3.0 mg/kg IV | 1 | 176 | Risk Ratio (M‐H, Fixed, 95% CI) | 0.85 [0.70, 1.04] |
| 6.3 4.5 mg/kg IV | 1 | 53 | Risk Ratio (M‐H, Fixed, 95% CI) | 0.59 [0.39, 0.89] |
| 6.4 6.0 mg/kg IV | 2 | 916 | Risk Ratio (M‐H, Fixed, 95% CI) | 0.83 [0.77, 0.91] |
| 7 Failure to induce clinical remission ‐ 90 mg, s.c. (6 weeks) Show forest plot | 1 | Risk Ratio (M‐H, Fixed, 95% CI) | Totals not selected | |
| Analysis 2.7  Comparison 2 Ustekinumab versus placebo, Outcome 7 Failure to induce clinical remission ‐ 90 mg, s.c. (6 weeks). | ||||
| 8 Failure to induce clinical response 90 mg s.c. (>= 70 points; 6 weeks) Show forest plot | 1 | Risk Ratio (M‐H, Fixed, 95% CI) | Totals not selected | |
| Analysis 2.8  Comparison 2 Ustekinumab versus placebo, Outcome 8 Failure to induce clinical response 90 mg s.c. (>= 70 points; 6 weeks). | ||||
| 9 Failure to induce clinical response 90 mg s.c. (>=100 points; 6 weeks) Show forest plot | 1 | Risk Ratio (M‐H, Fixed, 95% CI) | Totals not selected | |
| Analysis 2.9  Comparison 2 Ustekinumab versus placebo, Outcome 9 Failure to induce clinical response 90 mg s.c. (>=100 points; 6 weeks). | ||||
| 10 Adverse events Show forest plot | 4 | 2023 | Risk Ratio (M‐H, Fixed, 95% CI) | 0.97 [0.90, 1.04] |
| Analysis 2.10 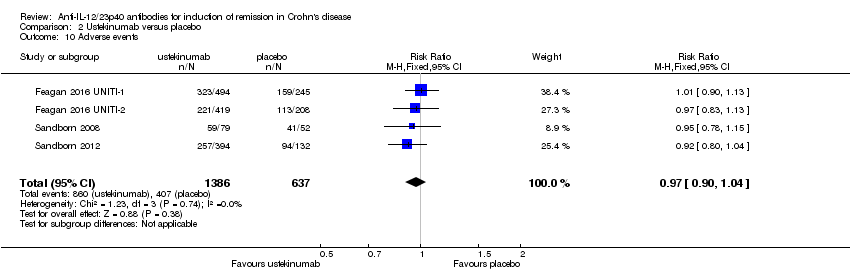 Comparison 2 Ustekinumab versus placebo, Outcome 10 Adverse events. | ||||
| 11 Serious adverse events Show forest plot | 4 | 2023 | Risk Ratio (M‐H, Fixed, 95% CI) | 0.83 [0.58, 1.20] |
| Analysis 2.11 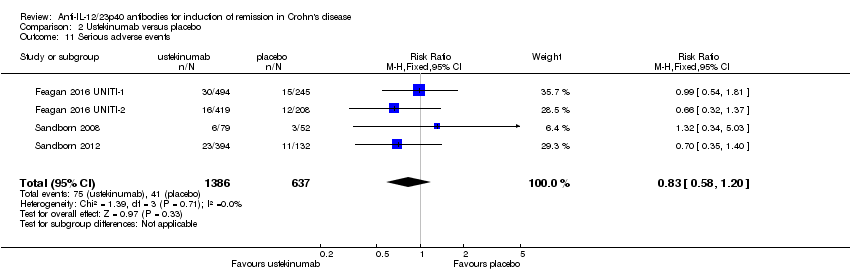 Comparison 2 Ustekinumab versus placebo, Outcome 11 Serious adverse events. | ||||
| 12 Withdrawals because of adverse events Show forest plot | 2 | 657 | Risk Ratio (M‐H, Fixed, 95% CI) | 0.44 [0.18, 1.05] |
| Analysis 2.12  Comparison 2 Ustekinumab versus placebo, Outcome 12 Withdrawals because of adverse events. | ||||

Study flow diagram.
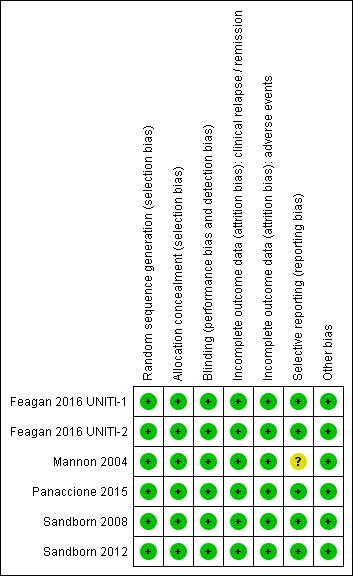
Risk of bias summary: reviewers' judgements about each risk of bias item for each included study.
Comparison 1 Briakinumab versus placebo, Outcome 1 Failure to induce clinical remission (7 & 9 weeks).
Comparison 1 Briakinumab versus placebo, Outcome 2 Failure to Induce clinical remission (6 weeks).

Comparison 1 Briakinumab versus placebo, Outcome 3 Failure to induce clinical response (>= 100 points; 7 & 9 weeks).

Comparison 1 Briakinumab versus placebo, Outcome 4 Failure to induce clinical response (>= 100 points; 6 weeks).

Comparison 1 Briakinumab versus placebo, Outcome 5 Adverse events.
Comparison 1 Briakinumab versus placebo, Outcome 6 Serious adverse events.
Comparison 1 Briakinumab versus placebo, Outcome 7 Withdrawals because of adverse events.

Comparison 2 Ustekinumab versus placebo, Outcome 1 Failure to induce clinical remission (6 weeks).

Comparison 2 Ustekinumab versus placebo, Outcome 2 Failure to induce clinical remission (6 weeks; sensitivity analysis).
Comparison 2 Ustekinumab versus placebo, Outcome 3 Failure to induce clinical response (>= 70 points; 6 weeks).
Comparison 2 Ustekinumab versus placebo, Outcome 4 Failure to induce clinical response (>= 70 points; 6 weeks; sensitivity analysis).
Comparison 2 Ustekinumab versus placebo, Outcome 5 Failure to Induce clinical response (>=100 points; 6 weeks).

Comparison 2 Ustekinumab versus placebo, Outcome 6 Failure to Induce clinical response (>=100 points; 6 weeks; sensitivity analysis).

Comparison 2 Ustekinumab versus placebo, Outcome 7 Failure to induce clinical remission ‐ 90 mg, s.c. (6 weeks).

Comparison 2 Ustekinumab versus placebo, Outcome 8 Failure to induce clinical response 90 mg s.c. (>= 70 points; 6 weeks).

Comparison 2 Ustekinumab versus placebo, Outcome 9 Failure to induce clinical response 90 mg s.c. (>=100 points; 6 weeks).

Comparison 2 Ustekinumab versus placebo, Outcome 10 Adverse events.

Comparison 2 Ustekinumab versus placebo, Outcome 11 Serious adverse events.

Comparison 2 Ustekinumab versus placebo, Outcome 12 Withdrawals because of adverse events.
| Briakinumab compared to placebo for induction of remission in Crohn's disease | ||||||
| Patient or population: induction of remission in Crohn's disease | ||||||
| Outcomes | Illustrative comparative risks* (95% CI) | Relative effect | No of Participants | Quality of the evidence | Comments | |
| Assumed risk | Corresponding risk | |||||
| placebo | Briakinumab | |||||
| Failure to induce clinical remission (Mannon 2004) | 812 per 10001 | 699 per 1000 | RR 0.86 | 79 | ⊕⊕⊝⊝ | |
| Failure to induce clinical remission (Panaccione 2010) | 913 per 10001 | 840 per 1000 (758 to 940) | RR 0.92 (0.83 to 1.03) | 230 (1 study) | ⊕⊕⊝⊝ | |
| Failure to induce clinical response CDAI ‐ (≥100 point reduction) | 688 per 10001 | 447 per 1000 | RR 0.65 | 79 | ⊕⊕⊝⊝ | |
| Failure to induce clinical response CDAI ‐ (≥100 point reduction) | 783 per 10001 | 642 per 1000 (525 to 775) | RR 0.82 (0.67 to 0.99) | 230 (1 study) | ⊕⊕⊕⊝ | |
| Adverse events (Panaccione 2010) Follow‐up: 12 weeks | 783 per 10001 | 705 per 1000 (587 to 838) | RR 0.90 (0.75 to 1.07) | 230 (1 study) | ⊕⊕⊕⊝ | |
| Serious adverse events (Panaccione 2010) | 87 per 10001 | 45 per 1000 | RR 0.52 | 246 | ⊕⊕⊝⊝ | |
| Withdrawals due to adverse event** (Pannaccione 2010) | 44 per 10001 | 30 per 1000 | RR 0.69 | 246 | ⊕⊕⊝⊝ | |
| *The basis for the assumed risk (e.g. the median control group risk across studies) is provided in footnotes. The corresponding risk (and its 95% confidence interval) is based on the assumed risk in the comparison group and the relative effect of the intervention (and its 95% CI). **Subject numbers are higher than those reported for the efficacy analyses of the individual studies due to the 200 mg, i.v. experimental group discontinuing enrolment during the induction phase due to poor patient enrolment (Panaccione, 2010). These patients were not included in the efficacy analyses, but were included in the safety analyses. | ||||||
| GRADE Working Group grades of evidence | ||||||
| 1 Control group risk estimates come from control arm of meta‐analysis, based on included trials | ||||||
| Ustekinumab compared to placebo for induction of remission in Crohn's disease | ||||||
| Patient or population: patients with induction of remission in Crohn's disease | ||||||
| Outcomes | Illustrative comparative risks* (95% CI) | Relative effect | No of Participants | Quality of the evidence | Comments | |
| Assumed risk | Corresponding risk | |||||
| placebo | Ustekinumab | |||||
| Failure to induce clinical remission | 904 per 10001 | 832 per 1000 | RR 0.92 | 1320 | ⊕⊕⊕⊕ | Sensitivity analysis excluding UNITI‐2 trial. These patients had more severe disease at study entry |
| Failure to induce clinical remission (6 mg/kg subgroup) | 907 per 10001 | 835 per 1000 | RR 0.92 | 916 | ⊕⊕⊕⊝ | |
| Failure to induce clinical response | 783 per 10001 | 642 per 1000 | RR 0.82 | 1320 | ⊕⊕⊕⊕ | Sensitivity analysis excluding UNITI‐2 trial. These patients had more severe disease at study entry |
| Failure to induce clinical response (6 mg/kg subgroup) | 780 per 10001 | 647 per 1000 | RR 0.83 | 916 | ⊕⊕⊕⊕ | |
| Adverse events Follow‐up: 8 weeks | 639 per 10001 | 620 per 1000 | RR 0.97 | 2023 | ⊕⊕⊕⊕ | |
| Serious adverse events | 64 per 10001 | 53 per 1000 | RR 0.83 | 2023 | ⊕⊕⊕⊝ | |
| Withdrawals due to adverse event | 54 per 10001 | 24 per 1000 | RR 0.44 | 657 | ⊕⊕⊝⊝ | |
| *The basis for the assumed risk (e.g. the median control group risk across studies) is provided in footnotes. The corresponding risk (and its 95% confidence interval) is based on the assumed risk in the comparison group and the relative effect of the intervention (and its 95% CI). **Subject numbers are higher than those reported for the efficacy analyses of the individual studies due to the omission of efficacy results for subjects receiving subcutaneous placebo and 90 mg ustekinumab, as well as subjects receiving 90mg s.c. and 4.5 mg/kg of ustekinumab in the open‐label arm of the study by Sandborn (2008). The results of these subjects were included in the safety analyses. | ||||||
| GRADE Working Group grades of evidence | ||||||
| 1 Control group risk estimates come from control arm of meta‐analysis, based on included trials | ||||||
| Outcome | Fixed Effects Modelling | Random Effects Modelling |
| Briakinumab /Remission (Mannon 2004) | RR 0.86 [0.65, 1.14] | RR 0.88 [0.68, 1.15] |
| Briakinumab /Remission (Panaccione 2015) | RR 1.05 [0.90, 1.22] | RR 0.92 [0.83, 1.03] |
| Ustekinumab /Remission | RR 0.94 [0.88, 1.01] | RR 0.95 [0.89, 1.02] |
| Briakinumab /Response (Mannon 2004) | RR 0.65 [0.42, 0.99] | RR 0.66 [0.44, 1.01] |
| Briakinumab /Response (Panaccione 2015) | RR 0.82 [0,67, 0.99] | RR 0.81 [0.67, 0.99] |
| Ustekinumab /Response | RR 0.79 [0.71, 0.89] | RR 0.80 [0.72, 0.90] |
| Outcome or subgroup title | No. of studies | No. of participants | Statistical method | Effect size |
| 1 Failure to induce clinical remission (7 & 9 weeks) Show forest plot | 1 | 79 | Risk Ratio (M‐H, Fixed, 95% CI) | 0.86 [0.65, 1.14] |
| 1.1 1 mg/kg body weight each week | 1 | 39 | Risk Ratio (M‐H, Fixed, 95% CI) | 0.92 [0.67, 1.26] |
| 1.2 3 mg/kg body weight each week | 1 | 40 | Risk Ratio (M‐H, Fixed, 95% CI) | 0.79 [0.48, 1.30] |
| 2 Failure to Induce clinical remission (6 weeks) Show forest plot | 1 | 230 | Risk Ratio (M‐H, Fixed, 95% CI) | 0.92 [0.83, 1.03] |
| 2.1 IV Infusion of 400 mg | 1 | 68 | Risk Ratio (M‐H, Fixed, 95% CI) | 0.95 [0.80, 1.13] |
| 2.2 IV Infusion of 700 mg | 1 | 162 | Risk Ratio (M‐H, Fixed, 95% CI) | 0.91 [0.78, 1.05] |
| 3 Failure to induce clinical response (>= 100 points; 7 & 9 weeks) Show forest plot | 1 | 79 | Risk Ratio (M‐H, Fixed, 95% CI) | 0.65 [0.42, 0.99] |
| 3.1 1 mg/kg body weight each week | 1 | 39 | Risk Ratio (M‐H, Fixed, 95% CI) | 0.73 [0.44, 1.22] |
| 3.2 3 mg/kg body weight each week | 1 | 40 | Risk Ratio (M‐H, Fixed, 95% CI) | 0.55 [0.27, 1.13] |
| 4 Failure to induce clinical response (>= 100 points; 6 weeks) Show forest plot | 1 | 230 | Risk Ratio (M‐H, Fixed, 95% CI) | 0.82 [0.67, 0.99] |
| 4.1 400 mg iv of briakinumab | 1 | 68 | Risk Ratio (M‐H, Fixed, 95% CI) | 0.82 [0.61, 1.12] |
| 4.2 700 mg iv of briakinumab | 1 | 162 | Risk Ratio (M‐H, Fixed, 95% CI) | 0.81 [0.63, 1.04] |
| 5 Adverse events Show forest plot | 1 | Risk Ratio (M‐H, Fixed, 95% CI) | Totals not selected | |
| 6 Serious adverse events Show forest plot | 2 | Risk Ratio (M‐H, Fixed, 95% CI) | Totals not selected | |
| 7 Withdrawals because of adverse events Show forest plot | 2 | Risk Ratio (M‐H, Fixed, 95% CI) | Totals not selected | |
| Outcome or subgroup title | No. of studies | No. of participants | Statistical method | Effect size |
| 1 Failure to induce clinical remission (6 weeks) Show forest plot | 4 | 1947 | Risk Ratio (M‐H, Random, 95% CI) | 0.91 [0.86, 0.95] |
| 1.1 1.0 mg/kg IV | 1 | 175 | Risk Ratio (M‐H, Random, 95% CI) | 0.92 [0.82, 1.04] |
| 1.2 3.0 mg/kg IV | 1 | 176 | Risk Ratio (M‐H, Random, 95% CI) | 0.95 [0.83, 1.08] |
| 1.3 4.5 mg/kg IV | 1 | 53 | Risk Ratio (M‐H, Random, 95% CI) | 0.87 [0.67, 1.11] |
| 1.4 6.0 mg/kg IV | 3 | 1543 | Risk Ratio (M‐H, Random, 95% CI) | 0.90 [0.82, 0.98] |
| 2 Failure to induce clinical remission (6 weeks; sensitivity analysis) Show forest plot | 3 | 1320 | Risk Ratio (M‐H, Fixed, 95% CI) | 0.92 [0.88, 0.96] |
| 2.1 1.0 mg/kg IV | 1 | 175 | Risk Ratio (M‐H, Fixed, 95% CI) | 0.92 [0.82, 1.04] |
| 2.2 3.0 mg/kg IV | 1 | 176 | Risk Ratio (M‐H, Fixed, 95% CI) | 0.95 [0.83, 1.08] |
| 2.3 4.5 mg/kg IV | 1 | 53 | Risk Ratio (M‐H, Fixed, 95% CI) | 0.87 [0.67, 1.11] |
| 2.4 6.0 mg/kg IV | 2 | 916 | Risk Ratio (M‐H, Fixed, 95% CI) | 0.92 [0.87, 0.97] |
| 3 Failure to induce clinical response (>= 70 points; 6 weeks) Show forest plot | 4 | 1947 | Risk Ratio (M‐H, Random, 95% CI) | 0.73 [0.66, 0.81] |
| 3.1 1 mg/kg IV | 1 | 175 | Risk Ratio (M‐H, Random, 95% CI) | 0.78 [0.61, 0.98] |
| 3.2 3 mg/kg IV | 1 | 176 | Risk Ratio (M‐H, Random, 95% CI) | 0.81 [0.63, 1.03] |
| 3.3 4.5 mg/kg IV | 1 | 53 | Risk Ratio (M‐H, Random, 95% CI) | 0.59 [0.37, 0.94] |
| 3.4 6 mg/kg IV | 3 | 1543 | Risk Ratio (M‐H, Random, 95% CI) | 0.72 [0.61, 0.85] |
| 4 Failure to induce clinical response (>= 70 points; 6 weeks; sensitivity analysis) Show forest plot | 3 | 1320 | Risk Ratio (M‐H, Fixed, 95% CI) | 0.78 [0.71, 0.85] |
| 4.1 1 mg/kg IV | 1 | 175 | Risk Ratio (M‐H, Fixed, 95% CI) | 0.78 [0.61, 0.98] |
| 4.2 3 mg/kg IV | 1 | 176 | Risk Ratio (M‐H, Fixed, 95% CI) | 0.81 [0.63, 1.03] |
| 4.3 4.5 mg/kg IV | 1 | 53 | Risk Ratio (M‐H, Fixed, 95% CI) | 0.59 [0.37, 0.94] |
| 4.4 6 mg/kg IV | 2 | 916 | Risk Ratio (M‐H, Fixed, 95% CI) | 0.78 [0.71, 0.87] |
| 5 Failure to Induce clinical response (>=100 points; 6 weeks) Show forest plot | 4 | 1947 | Risk Ratio (M‐H, Random, 95% CI) | 0.77 [0.69, 0.87] |
| 5.1 1.0 mg/kg IV | 1 | 175 | Risk Ratio (M‐H, Random, 95% CI) | 0.82 [0.67, 1.01] |
| 5.2 3.0 mg/kg IV | 1 | 176 | Risk Ratio (M‐H, Random, 95% CI) | 0.85 [0.70, 1.04] |
| 5.3 4.5 mg/kg IV | 1 | 53 | Risk Ratio (M‐H, Random, 95% CI) | 0.59 [0.39, 0.89] |
| 5.4 6.0 mg/kg IV | 3 | 1543 | Risk Ratio (M‐H, Random, 95% CI) | 0.76 [0.63, 0.91] |
| 6 Failure to Induce clinical response (>=100 points; 6 weeks; sensitivity analysis) Show forest plot | 3 | 1320 | Risk Ratio (M‐H, Fixed, 95% CI) | 0.82 [0.77, 0.88] |
| 6.1 1.0 mg/kg IV | 1 | 175 | Risk Ratio (M‐H, Fixed, 95% CI) | 0.82 [0.67, 1.01] |
| 6.2 3.0 mg/kg IV | 1 | 176 | Risk Ratio (M‐H, Fixed, 95% CI) | 0.85 [0.70, 1.04] |
| 6.3 4.5 mg/kg IV | 1 | 53 | Risk Ratio (M‐H, Fixed, 95% CI) | 0.59 [0.39, 0.89] |
| 6.4 6.0 mg/kg IV | 2 | 916 | Risk Ratio (M‐H, Fixed, 95% CI) | 0.83 [0.77, 0.91] |
| 7 Failure to induce clinical remission ‐ 90 mg, s.c. (6 weeks) Show forest plot | 1 | Risk Ratio (M‐H, Fixed, 95% CI) | Totals not selected | |
| 8 Failure to induce clinical response 90 mg s.c. (>= 70 points; 6 weeks) Show forest plot | 1 | Risk Ratio (M‐H, Fixed, 95% CI) | Totals not selected | |
| 9 Failure to induce clinical response 90 mg s.c. (>=100 points; 6 weeks) Show forest plot | 1 | Risk Ratio (M‐H, Fixed, 95% CI) | Totals not selected | |
| 10 Adverse events Show forest plot | 4 | 2023 | Risk Ratio (M‐H, Fixed, 95% CI) | 0.97 [0.90, 1.04] |
| 11 Serious adverse events Show forest plot | 4 | 2023 | Risk Ratio (M‐H, Fixed, 95% CI) | 0.83 [0.58, 1.20] |
| 12 Withdrawals because of adverse events Show forest plot | 2 | 657 | Risk Ratio (M‐H, Fixed, 95% CI) | 0.44 [0.18, 1.05] |