Anticuerpos anti‐IL‐12/23p40 para la inducción de la remisión en la enfermedad de Crohn
Resumen
Antecedentes
Ustekinumab (CNTO 1275) y briakinumab (ABT‐874) son anticuerpos monoclonales dirigidos a la subunidad p40 estándar de las citoquinas interleucina‐12 e interleucina‐23 (IL‐12/23p40), que están involucradas en la patogenia de la enfermedad de Crohn.
Objetivos
Los objetivos de esta revisión fueron evaluar la eficacia y la seguridad de los anticuerpos anti‐IL‐12/23p40 para la inducción de la remisión en la enfermedad de Crohn.
Métodos de búsqueda
Se hicieron búsquedas en las siguientes bases de datos, desde su inicio hasta 12 septiembre 2016: PubMed, MEDLINE, EMBASE y en the Cochrane Library (CENTRAL). Se hicieron búsquedas en las referencias y resúmenes de congresos para identificar estudios adicionales.
Criterios de selección
Se incluyeron los ensayos controlados aleatorios (ECA) en los que se compararon los anticuerpos monoclonales contra IL‐12/23p40 con placebo u otro comparador activo en pacientes con enfermedad de Crohn activa.
Obtención y análisis de los datos
Dos autores de la revisión examinaron los estudios para su inclusión y extrajeron los datos de forma independiente. La calidad metodológica se evaluó mediante la herramienta Cochrane del riesgo de sesgo. El resultado primario fue el fracaso para inducir la remisión clínica, definida como el índice de actividad de enfermedad de Crohn (CDAI por sus siglas en inglés) < 150 puntos. Los resultados secundarios fueron: fracaso para inducir la mejoría clínica, eventos adversos, eventos adversos graves y retiros debido a los eventos adversos. La mejoría clínica se definió como la disminución de 70 o 100 puntos en el CDAI inicial. Para cada resultado se calculó el cociente de riesgos (CR) y los intervalos de confianza del 95% (IC del 95%). Los datos se analizaron por intención de tratar. La calidad general de las pruebas que apoyan los resultados se evaluó mediante los criterios GRADE.
Resultados principales
Seis ECA (n = 2324 pacientes) cumplieron los criterios de inclusión. Se asignó un bajo riesgo de sesgo a todos los estudios. Los dos ensayos de briakinumab no se agruparon para el análisis debido a las diferencias en las dosis y los puntos temporales.En ambos estudios no hubo diferencias estadísticamente significativas en las tasas de remisión. Un estudio (n = 79) comparó dosis de 1 mg/kg y 3 mg/kg con placebo. En el grupo de briakinumab el 70% (44/63) de los pacientes no logró entrar en fase de remisión clínica a las seis o nueve semanas en comparación con el 81% (13/16) de los pacientes con placebo (CR 0,86; IC del 95%: 0,65 a 1,14). El análisis de subgrupos no mostró diferencias significativas por dosis. El otro estudio de briakinumab (n = 230) comparó dosis intravenosas de 200 mg, 400 mg y 700 mg con placebo. El 84% (154/184) de los pacientes con briakinumab no logró entrar en la fase de remisión clínica a las seis semanas en comparación con el 91% (42/46) de los pacientes con placebo (CR 0,92; IC del 95%: 0,83 a 1,03). El análisis de subgrupos no mostró diferencias significativas por dosis. Los análisis GRADE de los estudios de briakinumab calificaron la calidad general de las pruebas para el resultado remisión clínica como baja. Sobre la base de los resultados de estos dos estudios los fabricantes de briakinumab interrumpieron la producción de esta medicación. Los dos estudios de ustekinumab se agruparon a pesar de las diferencias en las dosis intravenosas (es decir, 1 mg/kg, 3 mg/kg, 4,5 mg/kg y 6 mg/kg); sin embargo, el grupo de dosis subcutánea no se incluyó en el análisis porque no estuvo claro si la dosis subcutánea fue equivalente a la intravenosa. Hubo una diferencia estadísticamente significativa en las tasas de remisión. A la semana seis, el 84% (764/914) de los pacientes con ustekinumab no logró entrar en la fase de remisión en comparación con el 90% (367/406) de los pacientes con placebo (CR 0,92; IC del 95%: 0,88 a 0,96; tres estudios; pruebas de alta calidad). En los análisis de subgrupos se demostró una diferencia estadísticamente significativa para el grupo de dosis de 6,0 mg/kg (pruebas de calidad moderada). Hubo diferencias estadísticamente significativas en la mejoría clínica entre los pacientes tratados con ustekinumab y con placebo. En el grupo de ustekinumab, el 55% (502/914) de los pacientes no logró mejorar clínicamente (es decir, una disminución de 70 puntos en la puntuación CDAI), en comparación con el 71% (287/406) de los pacientes con placebo (CR 0,78; IC del 95%: 0,71 a 0,85; tres estudios). El análisis de subgrupos mostró diferencias significativas en comparación con placebo para los subgrupos de dosis de 1 mg/kg, 4,5 mg/kg y 6 mg/kg. De manera similar, para una disminución de 100 puntos en el CDAI, el 64% (588/914) de los pacientes en el grupo de ustekinumab no logró mejorar clínicamente en comparación con el 78% (318/406) de los pacientes con placebo (CR 0,82; IC del 95%: 0,77 a 0,88; tres estudios; pruebas de alta calidad). El análisis de subgrupos demostró una diferencia significativa comparada con el placebo para los grupos de dosis de 4,5 mg/kg y de 6,0 mg/kg (pruebas de alta calidad). No hubo diferencias estadísticamente significativas en la incidencia de eventos adversos, eventos adversos graves ni retiros debido a los eventos adversos. El 62% (860/1386) de los pacientes tratados con ustekinumab desarrollaron al menos un evento adverso en comparación con el 64% (407/637) de los pacientes con placebo (CR 0,97; IC del 95%: 0,90 a 1,04; cuatro estudios; pruebas de alta calidad). El 5% (75/1386) de los pacientes tratados con ustekinumab presentaron un evento adverso grave en comparación con el 6% (41/637) de los pacientes con placebo (CR 0,83; IC del 95%: 0,58 a 1,20; cuatro estudios; pruebas de calidad moderada). Los eventos adversos más frecuentes en los pacientes tratados con briakinumab fueron las reacciones en el sitio de inyección y las infecciones. Las infecciones fueron el evento adverso más frecuente en los pacientes con ustekinumab. El empeoramiento de la enfermedad de Crohn y las infecciones graves fueron los eventos adversos graves más frecuentes.
Conclusiones de los autores
Las pruebas de alta calidad indican que el ustekinumab es efectivo para la inducción de la remisión clínica y la mejoría clínica en los pacientes con enfermedad de Crohn moderada a severa. Las pruebas de moderada a alta calidad sugieren que la dosis óptima de ustekinumab es de 6 mg/kg. Briakinumab y ustekinumab parecen ser seguros. Las pruebas de calidad moderada no indican un mayor riesgo de eventos adversos graves. Se necesitan estudios adicionales para determinar la eficacia y la seguridad a largo plazo de ustekinumab en los pacientes con enfermedad de Crohn moderada a severa.
PICOs
Resumen en términos sencillos
Ustekinumab y briakinumab para el tratamiento de la enfermedad de Crohn activa
¿Qué es la enfermedad de Crohn?
La enfermedad de Crohn es una enfermedad intestinal inflamatoria a largo plazo (crónica) que puede afectar cualquier parte del aparato digestivo de la boca al ano. Los síntomas incluyen: dolor abdominal, diarrea no sanguinolenta y pérdida de peso.
¿Qué son ustekinumab y briakinumab?
Ustekinumab y briakinumab son fármacos biológicos. Estos fármacos se pueden inyectar bajo la piel mediante una jeringuilla o infundirse directamente en una vena (intravenoso). Los productos biológicos suprimen el sistema inmunológico y reducen la inflamación asociada con la enfermedad de Crohn. Cuando los pacientes con enfermedad de Crohn presentan síntomas de la enfermedad, se dice que está "activa"; al período en el cual los síntomas se detienen se le llama "remisión".
¿Qué examinaron los investigadores?
Los investigadores analizaron si los productos ustekinumab o briakinumab producen remisión en los pacientes con enfermedad de Crohn activa; y si estos fármacos provocan algún efecto perjudicial (efectos secundarios). Los investigadores buscaron en la literatura médica hasta el 12 de setiembre de 2016.
¿Qué encontraron los investigadores?
Los investigadores identificaron seis estudios que incluyeron un total de 2324 participantes. Dos estudios compararon briakinumab con placebo (una medicina falsa), y dos estudios compararon ustekinumab con placebo. Todos los estudios eran de calidad elevada.
No hubo diferencias en la proporción de participantes con briakinumab y con placebo que lograron remisión. No se observó un aumento de los efectos secundarios ni los efectos secundarios graves con briakinumab en comparación con placebo. Los efectos secundarios más frecuentes en los participantes tratados con briakinumab fueron las reacciones en el sitio de inyección y las infecciones. Sobre la base de los resultados de estos dos estudios los fabricantes de briakinumab interrumpieron la producción de esta medicación.
Las pruebas de alta calidad indican que el ustekinumab es mejor que el placebo para ayudar a los pacientes a que logren la remisión y para reducir los síntomas de la enfermedad de Crohn activa. Se investigaron diferentes dosis de ustekinumab, y las pruebas de calidad moderada a alta sugieren que la dosis de 6,0 mg/kg es la más efectiva. No se observó un aumento de los efectos secundarios ni los efectos secundarios graves con ustekinumab en comparación con placebo. Las infecciones fueron el evento adverso más frecuente en los pacientes con ustekinumab. El empeoramiento de la enfermedad de Crohn y las infecciones graves fueron los efectos secundarios graves más frecuentes en los estudios de ustekinumab. El ustekinumab es un tratamiento alentador para inducir la remisión y mejorar los síntomas en los pacientes con enfermedad de Crohn. Se necesitan estudios adicionales para determinar la efectividad y la seguridad a largo plazo de ustekinumab en los pacientes con enfermedad de Crohn moderada a severa. La dosis ideal de ustekinumab también debe determinarse.
Authors' conclusions
Summary of findings
| Briakinumab compared to placebo for induction of remission in Crohn's disease | ||||||
| Patient or population: induction of remission in Crohn's disease | ||||||
| Outcomes | Illustrative comparative risks* (95% CI) | Relative effect | No of Participants | Quality of the evidence | Comments | |
| Assumed risk | Corresponding risk | |||||
| placebo | Briakinumab | |||||
| Failure to induce clinical remission (Mannon 2004) | 812 per 10001 | 699 per 1000 | RR 0.86 | 79 | ⊕⊕⊝⊝ | |
| Failure to induce clinical remission (Panaccione 2010) | 913 per 10001 | 840 per 1000 (758 to 940) | RR 0.92 (0.83 to 1.03) | 230 (1 study) | ⊕⊕⊝⊝ | |
| Failure to induce clinical response CDAI ‐ (≥100 point reduction) | 688 per 10001 | 447 per 1000 | RR 0.65 | 79 | ⊕⊕⊝⊝ | |
| Failure to induce clinical response CDAI ‐ (≥100 point reduction) | 783 per 10001 | 642 per 1000 (525 to 775) | RR 0.82 (0.67 to 0.99) | 230 (1 study) | ⊕⊕⊕⊝ | |
| Adverse events (Panaccione 2010) Follow‐up: 12 weeks | 783 per 10001 | 705 per 1000 (587 to 838) | RR 0.90 (0.75 to 1.07) | 230 (1 study) | ⊕⊕⊕⊝ | |
| Serious adverse events (Panaccione 2010) | 87 per 10001 | 45 per 1000 | RR 0.52 | 246 | ⊕⊕⊝⊝ | |
| Withdrawals due to adverse event** (Pannaccione 2010) | 44 per 10001 | 30 per 1000 | RR 0.69 | 246 | ⊕⊕⊝⊝ | |
| *The basis for the assumed risk (e.g. the median control group risk across studies) is provided in footnotes. The corresponding risk (and its 95% confidence interval) is based on the assumed risk in the comparison group and the relative effect of the intervention (and its 95% CI). **Subject numbers are higher than those reported for the efficacy analyses of the individual studies due to the 200 mg, i.v. experimental group discontinuing enrolment during the induction phase due to poor patient enrolment (Panaccione, 2010). These patients were not included in the efficacy analyses, but were included in the safety analyses. | ||||||
| GRADE Working Group grades of evidence | ||||||
| 1 Control group risk estimates come from control arm of meta‐analysis, based on included trials | ||||||
| Ustekinumab compared to placebo for induction of remission in Crohn's disease | ||||||
| Patient or population: patients with induction of remission in Crohn's disease | ||||||
| Outcomes | Illustrative comparative risks* (95% CI) | Relative effect | No of Participants | Quality of the evidence | Comments | |
| Assumed risk | Corresponding risk | |||||
| placebo | Ustekinumab | |||||
| Failure to induce clinical remission | 904 per 10001 | 832 per 1000 | RR 0.92 | 1320 | ⊕⊕⊕⊕ | Sensitivity analysis excluding UNITI‐2 trial. These patients had more severe disease at study entry |
| Failure to induce clinical remission (6 mg/kg subgroup) | 907 per 10001 | 835 per 1000 | RR 0.92 | 916 | ⊕⊕⊕⊝ | |
| Failure to induce clinical response | 783 per 10001 | 642 per 1000 | RR 0.82 | 1320 | ⊕⊕⊕⊕ | Sensitivity analysis excluding UNITI‐2 trial. These patients had more severe disease at study entry |
| Failure to induce clinical response (6 mg/kg subgroup) | 780 per 10001 | 647 per 1000 | RR 0.83 | 916 | ⊕⊕⊕⊕ | |
| Adverse events Follow‐up: 8 weeks | 639 per 10001 | 620 per 1000 | RR 0.97 | 2023 | ⊕⊕⊕⊕ | |
| Serious adverse events | 64 per 10001 | 53 per 1000 | RR 0.83 | 2023 | ⊕⊕⊕⊝ | |
| Withdrawals due to adverse event | 54 per 10001 | 24 per 1000 | RR 0.44 | 657 | ⊕⊕⊝⊝ | |
| *The basis for the assumed risk (e.g. the median control group risk across studies) is provided in footnotes. The corresponding risk (and its 95% confidence interval) is based on the assumed risk in the comparison group and the relative effect of the intervention (and its 95% CI). **Subject numbers are higher than those reported for the efficacy analyses of the individual studies due to the omission of efficacy results for subjects receiving subcutaneous placebo and 90 mg ustekinumab, as well as subjects receiving 90mg s.c. and 4.5 mg/kg of ustekinumab in the open‐label arm of the study by Sandborn (2008). The results of these subjects were included in the safety analyses. | ||||||
| GRADE Working Group grades of evidence | ||||||
| 1 Control group risk estimates come from control arm of meta‐analysis, based on included trials | ||||||
Background
Description of the condition
Crohn's disease is a chronic inflammatory disease of the gastrointestinal tract that typically presents with abdominal pain, diarrhoea, and weight loss. In North America and Northern Europe, Crohn's disease affects up to 320 people per 100,000 (Molodecky 2012). Long‐term transmural inflammation can result in complications including stenoses and fistulas that require surgical management in up to a third of patients (Solberg 2007). Therapy is aimed at inducing and maintaining remission and preventing complications.
Corticosteroids were among the first available therapies for induction of remission in Crohn's disease (Summers 1979; Rutgeerts 1994). However, persistent remission (Faubion 2001) and mucosal healing (Modigliani 1990) have not been observed with corticosteroid therapy. Moreover, these drugs cause multiple adverse effects (Ford 2011; Yang 2002).
The immunosuppressives azathioprine, 6‐mercaptopurine and methotrexate have been widely used as corticosteroid‐sparing agents in the treatment of Crohn’s disease (McDonald 2012; Chande 2013). Although azathioprine is not effective for inducing remission (Chande 2013), it is beneficial when used in combination with infliximab therapy (Colombel 2010; Chande 2013). However, azathioprine requires careful monitoring for adverse events including pancreatitis, liver toxicity, and neutropenia (Raj 2010).
Due to the limited efficacy and potential toxicities of those drugs, monoclonal antibodies directed against tumor necrosis factor alpha (TNF‐α) were developed as more selective therapeutic agents. TNF‐α antagonists, which include infliximab, adalimumab, and certolizumab pegol, are effective for both induction and maintenance of remission in Crohn’s disease (Targan 1997; Hanauer 2002; Akobeng 2003; Hanauer 2006; Lawson 2006; Sandborn 2007; Schreiber 2007). However, concerns regarding infection (Colombel 2004; Colombel 2007; Schreiber 2007; Singh 2011) and a potentially increased risk of certain types of cancer such as non‐Hodgkin's lymphoma and non‐melanoma skin cancer exists (Burmester 2013; Hudesman 2013). Furthermore, primary and secondary failure of TNF‐α antagonists occurs in approximately 30 and 40% of patients, respectively (Targan 1997; Hanauer 2002; Hanauer 2006; Danese 2011). These limitations provided the impetus to investigate drugs that target different inflammatory pathways.
Description of the intervention
Ustekinumab (CNTO 1275) and briakinumab (ABT‐874) are fully human IgG1 monoclonal antibodies that target the common p40 subunit of the cytokines interleukin‐12 and interleukin‐23 (IL‐12/23p40). Ustekinumab and briakinumab are effective for the treatment of psoriasis (Papp 2008; Gottlieb 2009; Reich 2011), and early Phase I and II clinical trials of ustekinumab suggest a similar benefit in Crohn's disease (Mannon 2004; Sandborn 2008; Sandborn 2012).
How the intervention might work
Crohn's disease is characterized by dysregulated T‐cell activity. Interleukin‐12 (IL‐12) and IL‐23 are released by antigen presenting cells to trigger an acquired immune response (Watanabe 2004; Peluso 2006; Benson 2011; Duvallet 2011). Specifically, IL‐12 production stimulates a Th1 response, that culminates in the secretion of the pro‐inflammatory cytokines IFN‐ɣ and TNF‐α (Peluso 2006; Benson 2011; Cingoz 2011). Similarly, IL‐23 stimulates proliferation of Th17 lymphocytes which play a role in many chronic inflammatory conditions (Duvallet 2011). At a cellular level inhibition of IL‐12/23p40 leads to apoptosis of T cells in the gut mucosa (Fuss 1999). Furthermore, blockade IL‐12 and IL‐23, results in disease improvement in murine models of colitis (Neurath 1995). Collectively, these data suggest a possible therapeutic role for IL‐12/23p40 antibodies for the treatment of Crohn’s disease.
Why it is important to do this review
Ustekinumab, a humanized monoclonal antibody directed against the p40 subunit of IL‐12 and IL‐23, has been more thoroughly investigated in the treatment of psoriasis where it appears to be safe and effective (Gottlieb 2014; Papp 2013). This systematic review summarizes the current evidence regarding the use of anti IL‐12/23p40 antibodies for induction of remission in Crohn's disease.
Objectives
The objectives of this review were to determine the efficacy and safety of anti‐IL‐12/23p40 antibodies for induction of remission in Crohn's disease.
Methods
Criteria for considering studies for this review
Types of studies
Randomized controlled trials (RCTs) that assessed the efficacy and safety of antibodies directed against the p40 subunit of IL‐12 and IL‐23 compared to placebo or other active treatments for induction of remission in Crohn's disease were considered for inclusion.
Types of participants
Participants were required to have active Crohn's disease defined by conventional clinical, radiological or endoscopic criteria. No age restrictions were applied.
Types of interventions
Interventions that involved the administration of an antibody directed against the p40 subunit of IL‐12 and IL‐23 were considered for inclusion. Interventions that altered IL‐12 or IL‐23 by another strategy, such as direct inhibition of transcription were not included (Sands 2010).
Types of outcome measures
Primary outcomes
The primary outcome measure was the proportion of patients who failed to enter clinical remission, as defined by the original studies (e.g. a Crohn's Disease Activity Index (CDAI) score of < 150)). An intention‐to‐treat analysis was used.
Secondary outcomes
Secondary outcome measures included:
-
clinical response;
-
endoscopic remission;
-
steroid withdrawal;
-
adverse events;
-
serious adverse events; and
-
withdrawal due to adverse events.
Search methods for identification of studies
Electronic searches
We searched PubMed, MEDLINE (OvidSP), EMBASE (Ovid SP), and the Cochrane Library (CENTRAL) from inception to 12 September 2016. The search strategies are listed in Appendix 1. Conference abstracts from Digestive Disease Week and the United European Gastoenterology Week were also searched to identify abstract publications.
Searching other resources
Reference lists
Manual searches of reference lists from potentially relevant papers were performed in order to identify additional studies that may have been missed using the computer‐assisted search strategy.
Correspondence
Leaders in the field (W. Strober, P. Mannon, W. Sandborn) were contacted to identify other studies, which may not be published. The manufacturers of briakinumab and ustekinumab (Abbott Laboratories, Abbott Park, IL, USA and Centocor, Horsham, PA, USA) were contacted for additional data.
Trial databases
The trial databases clinicaltrials.gov, clinicaltrials.ifpma.org and the meta register of controlled trials at controlled‐trials.com were searched to identify other studies that had not been reported.
Data collection and analysis
Selection of studies
All publications identified by the search strategy were assessed independently by two authors (TN and JKM), and relevant studies were selected according to the inclusion criteria. Disagreements were resolved by consensus.
Data extraction and management
Data were extracted independently by two authors (TN and JKM) using standardized extraction sheets. Information was extracted on data source; participants (age range, exclusion criteria, pre‐treatment medication, co‐medication, disease entity, activity); details of intervention (type of antibody, frequency and duration of treatment) and comparison treatment; outcomes studied and duration of follow up; study design features (including method of allocation, concealment, where applicable; intention‐to‐treat analysis); and results, including adverse events and loss to follow up. Discrepancies in the data extractions were resolved by consensus. Investigators were contacted for additional information when data were not available or unclear.
Assessment of risk of bias in included studies
We used the Cochrane risk of bias tool to assess the methodological quality of the included studies (HIggins 2011a). Two authors independently assessed the risk of bias (TN and JKM). The following study characteristics were assessed:
-
Randomization sequence generation;
-
Allocation concealment;
-
Blinding of participants, outcome assessors and investigators;
-
Incomplete outcome reporting (i.e. there was an acceptable method of dealing with attrition);
-
Selective outcome reporting (i.e. all outcomes described in the methods were included in the analysis); and
-
Other potential sources of bias.
Based on these characteristics, studies were judged to have a high, low or unclear risk of bias.
We used the GRADE approach to assess the overall quality of evidence for the primary outcome and secondary outcomes including clinical response, adverse events, serious adverse events and withdrawal due to adverse events. Outcomes from pooling of randomized trials start as high quality evidence, but may be downgraded due to: (1) risk of bias, (2) indirectness of evidence, (3) inconsistency (unexplained heterogeneity), (4) imprecision (sparse data), and (5) reporting bias (publication bias). The overall quality of evidence for each outcome was determined after considering each of these elements, and categorized as high quality (i.e. further research is very unlikely to change our confidence in the estimate of effect); moderate quality (i.e. further research is likely to have an important impact on our confidence in the estimate of effect and may change the estimate); low quality (i.e. further research is very likely to have an important impact on our confidence in the estimate of effect and is likely to change the estimate); or very low quality (i.e. we are very uncertain about the estimate) (Guyatt 2008; Schünemann 2011).
Measures of treatment effect
Data were analysed using Review Manager 5 (RevMan 5). Data were extracted from the original research articles and converted into 2×2 tables. The definitions of treatment success, remission and clinical improvement were set by the authors of each paper, and the data were combined for analysis only if these definitions were sufficiently similar (determined by consensus). All relevant outcomes in the identified studies were reported as dichotomous data so results were all pooled based on the relative risk (RR), with RR < 1.0 denoting superiority of the experimental treatment. Results were presented with 95% confidence intervals (CI). The 'Rule of Three' was used to estimate the 95% confidence interval for the frequency of rare, undetected adverse events, i.e. if no events were detected in n trial participants, the upper limit of the 95% confidence interval for the probability of the adverse event is 3/n (Loke 2007).
Unit of analysis issues
For three arm trials with a single placebo group and two treatment dose groups we split the placebo group in half to avoid a unit of analysis error (Higgins 2011b). In the case of an odd number of patients the groups were split in a way that led to a larger patient number in the placebo group for the lower dose arm in order to avoid overestimating effects in the higher dose arm, which was assumed to be more effective a priori. In order to avoid carry‐over effects we only included the first part of the study (i.e. before the cross‐over) for any cross‐over studies (Higgins 2011b).
Dealing with missing data
Missing outcome data were presented using the conservative intention‐to‐treat approach (i.e. all loss to follow up were considered treatment failures).
Assessment of heterogeneity
Statistical heterogeneity was examined by calculating the I2 statistic and the Chi2 test. Subgroup analysis (see below) was applied to explore clinical and methodological sources of heterogeneity.
Assessment of reporting biases
For future updates of this review, if there are a sufficient number of included studies (i.e. ≥ 10), we will investigate publication bias by means of a funnel plot (Egger 1997). Publication bias was not investigated for the current version of this review due to an insufficient number of studies.
Data synthesis
Results for the different antibodies were not combined. Also studies were not combined, if subgroup analysis suggested significant heterogeneity. A fixed‐effect model was applied when no heterogeneity was detected. Otherwise, a random‐effects model was calculated. Data were not pooled when I2 suggested considerable heterogeneity.
Subgroup analysis and investigation of heterogeneity
Preplanned subgroup analyses included:
-
studies investigating children and studies investigating adults;
-
different drug doses and/or routes of administration;
-
studies investigating patients with high disease activity; and
-
studies investigating only patients who failed anti‐TNF‐α therapy.
Due to the low number of studies identified subgroup analyses could only be performed for different drug doses.
Sensitivity analysis
Sensitivity analyses examined the impact of the following variables on the pooled effect:
-
random‐effects versus fixed‐effect modelling;
-
low risk of bias only versus unclear or high risk of bias; and
-
relevant loss to follow up (> 10%): Best‐case versus worst‐case scenario.
Sensitivity analysis could only be performed for random‐effects versus fixed‐effect modelling. No publication allowed for the simulation of best‐case and worst‐case scenarios.
Results
Description of studies
Results of the search
The literature search conducted on 12 September 2016 identified 183 records. After duplicates were removed, a total of 139 records were screened for inclusion. Of these, 16 studies were selected for full text review. Two studies were excluded leaving 27 reports of 6 trials (total 2324 patients) that met the pre‐defined inclusion criteria (See Figure 1). Leaders in the field and the manufacturers of briakinumab and ustekinumab were contacted and no additional studies were identified.

Study flow diagram.
Included studies
All studies were multicenter randomized placebo‐controlled trials investigating patients with active Crohn's disease. The six studies investigated different anti‐IL12/23 antibodies. Mannon 2004 and Panaccione 2015 investigated briakinumab and four studies investigated ustekinumab (Sandborn 2008; Sandborn 2012; Feagan 2016 UNITI‐1; Feagan 2016 UNITI‐2). See Characteristics of included studies for further details.
Mannon 2004 investigated two different doses (1.0 mg and 3.0 mg/kg body weight) of briakinumab administered as 7 weekly subcutaneous injections against placebo. Each group was further randomized to uninterrupted therapy or a 4 week interval between the first and second doses. Follow‐up in this study was between 24 and 27 weeks. As the different dosing regimens differed only slightly, the treatment arms were combined for analysis. The two doses differed markedly with respect to effectiveness and were analysed as separate studies as described in the methods section.
Sandborn 2008 was a Phase IIa study of ustekinumab that compared 4 regimens of ustekinumab to placebo in 104 patients with active CD in both TNF‐α antagonist naive patients and those who had previously failed therapy with one or more of these agents. A sub‐study compared intravenous to subcutaneous therapy for the induction of clinical remission, however this portion of the trial was not included as it was not placebo‐controlled. Sandborn 2008 utilized a blinded cross‐over design that compared four groups: subcutaneous placebo at weeks 0–3, followed by 90 mg ustekinumab at weeks 8–11; subcutaneous 90 mg ustekinumab at weeks 0–3, then placebo at weeks 8–11; intravenous placebo at week 0, followed by 4.5 mg/kg ustekinumab at week 8; or intravenous 4.5 mg/kg ustekinumab at week 0, then placebo at week 8. Cross‐over to the alternate therapy occurred at week 8. The first part of the cross‐over trial was eligible for inclusion in this review. The subcutaneous doses were not included in the pooled analyses, as it was not clear that this was equivalent to intravenous dosing.
Panaccione 2015 was a double‐blind, placebo‐controlled Phase IIb trial in which 246 patients with moderate to severe Crohn’s disease were randomized (1:1:1:3) to placebo, 200 mg briakinumab, 400 mg briakinumab, or 700 mg briakinumab at weeks 0, 4, and 8 weeks. These patients were stratified by prior TNF‐α antagonist use and response to anti‐TNF‐α therapy. Patients that achieved clinical response at week 12 in the placebo and 400 mg briakinumab groups continued these treatment regimens at weeks 12, 16, 20 in the maintenance phase. Patients with clinical response in the 700 mg briakinumab group were re‐randomized (1:1:1) to placebo, 200 mg IV briakinumab, or 700 mg IV briakinumab for the maintenance phase. The maintenance data were not considered for this systematic review.
Sandborn 2012 was a double‐blind, placebo‐controlled Phase 2b trial of ustekinumab that randomized 526 patients, of which 524 had previously failed TNF‐α antagonist treatment (99.6%), to receive a single dose of 1, 3, or 6 mg/kg of intravenous ustekinumab or placebo. Patients that responded to ustekinumab were re‐randomized to receive maintenance therapy with 90 mg of subcutaneous ustekinumab or placebo at weeks 8 and 16. The maintenance data were not considered for this systematic review.
Feagan 2016 UNITI‐1 was a double‐blind, placebo‐controlled phase III trial of ustekinumab that randomized 741 patients with moderate to severe Crohn's disease, who had failed TNF‐α antagonist therapy, to a single dose of 130 mg or 6mg/kg of ustekinumab or placebo. Patients who responded to ustekinumab were randomized to receive maintenance therapy with 90 mg of subcutaneous ustekinumab (every 8 weeks or every 12 weeks) or placebo through week 40. The maintenance data were not considered for this systematic review.
Feagan 2016 UNITI‐2 was a double‐blind, placebo‐controlled phase III trial of ustekinumab that randomized 628 patients with moderate to severe Crohn's disease, who had failed corticosteroids or immunosuppressants or both, to a single dose of 130 mg or 6 mg/kg of ustekinumab or placebo. Patients who responded to ustekinumab were randomized to receive maintenance therapy with 90 mg of subcutaneous ustekinumab (every 8 weeks or every 12 weeks) or placebo through week 40. The maintenance data were not utilized for this systematic review.
Excluded studies
We excluded two studies (See Characteristics of excluded studies). Fasanmade 2008 was a pharmacokinetics study that compared intravenous ustekinumab at a dose of 4.5 mg/kg to subcutaneously administered ustekinumab at a dose of 90 mg. The active drug assessed in the Sands 2010 study was not an antibody directed against the p40 subunit of Il‐12 and IL‐23 (i.e. different mechanism of action than briakinumab and ustekinumab).
Risk of bias in included studies
The risk of bias analysis is summarized in Figure 2.

Risk of bias summary: reviewers' judgements about each risk of bias item for each included study.
Allocation
All six studies utilized computer generated randomization and were rated as low risk of bias for random sequence generation. Five studies used a centralized randomization scheme and were rated as low risk of bias for allocation concealment (Feagan 2016 UNITI‐1; Feagan 2016 UNITI‐2; Panaccione 2015; Sandborn 2008; Sandborn 2012). The Mannon 2004 study allocated patients using a telephone based interactive voice response system and was rated as low risk of bias for allocation concealment.
Blinding
Five studies utilized an identical placebo and were rated as low risk of bias for blinding (Feagan 2016 UNITI‐1; Feagan 2016 UNITI‐2; Mannon 2004; Sandborn 2008; Sandborn 2012). Panaccione 2015 utilized a double‐blind design and reported that, "The study sponsor, site personnel, and patients were unaware of the treatment assignments throughout both the induction and maintenance phases." As a result we rated this study as low risk of bias for blinding.
Incomplete outcome data
All of the studies were rated as low risk for incomplete outcome data. Drop‐outs were generally balanced across treatment groups with similar reasons for withdrawal.
Selective reporting
Five studies were rated as low risk for selective reporting (Feagan 2016 UNITI‐1; Feagan 2016 UNITI‐2; Panaccione 2015; Sandborn 2008; Sandborn 2012). Mannon 2004 reported on pre‐specified primary and secondary outcomes (safety and efficacy) but only reported on histology and laboratory scores for the treatment group. This study was rated as unclear for selective reporting.
Other potential sources of bias
All of the studies appear to be free of other sources of bias and were rated as low risk of bias for this item.
Effects of interventions
See: Summary of findings for the main comparison Briakinumab compared to placebo for induction of remission in Crohn's disease; Summary of findings 2 Ustekinumab compared to placebo for induction of remission in Crohn's disease
The two trials of briakinumab were not pooled due to differences in doses and time points for analysis (Mannon 2004; Panaccione 2015). However in both trials briakinumab was not statistically different than placebo for failure to induce remission. In the Mannon 2004 (N = 79) study 70% (44/63) of briakinumab patients failed to enter clinical remission at weeks 7 or 9 compared to 81% (13/16) of placebo patients (RR 0.86, 95% CI 0.65 to 1.14). Subgroup analysis showed no statistically significant differences by briakinumab dose (1 mg/kg or 3 mg/kg). No heterogeneity was detected for the dosage subgroup comparison (I2 = 0%). A GRADE analysis indicated that the quality of evidence supporting the primary outcome was low (See summary of findings Table for the main comparison). There was a statistically significant difference in the proportion of patients who failed to have a clinical response (> 100 point improvement in CDAI from baseline) favouring briakinumab over placebo. Forty‐four per cent (28/63) briakinumab patients failed to respond to treatment compared to 69% (11/16) of placebo patients (RR 0.65, 95% CI 0.42 to 0.99). Subgroup analysis showed no statistically significant differences by briakinumab dose (1 mg/kg or 3 mg/kg). No heterogeneity was detected for this comparison (I2 = 0%). Sensitivity analyses utilizing a random‐effects model found similar results for induction of remission and clinical response (See Table 1). A GRADE analysis indicated that the quality of evidence supporting the outcome clinical response was low (See summary of findings Table for the main comparison).
| Outcome | Fixed Effects Modelling | Random Effects Modelling |
| Briakinumab /Remission (Mannon 2004) | RR 0.86 [0.65, 1.14] | RR 0.88 [0.68, 1.15] |
| Briakinumab /Remission (Panaccione 2015) | RR 1.05 [0.90, 1.22] | RR 0.92 [0.83, 1.03] |
| Ustekinumab /Remission | RR 0.94 [0.88, 1.01] | RR 0.95 [0.89, 1.02] |
| Briakinumab /Response (Mannon 2004) | RR 0.65 [0.42, 0.99] | RR 0.66 [0.44, 1.01] |
| Briakinumab /Response (Panaccione 2015) | RR 0.82 [0,67, 0.99] | RR 0.81 [0.67, 0.99] |
| Ustekinumab /Response | RR 0.79 [0.71, 0.89] | RR 0.80 [0.72, 0.90] |
In the Panaccione 2015 (N = 230) study 84% (154/184) of briakinumab patients failed to enter clinical remission compared to 91% (42/46) of placebo patients (RR 0.92, 95% CI 0.83 to 1.03). Subgroup analysis showed no differences by briakinumab dose (400 mg or 700 mg). No heterogeneity was detected for the dosage subgroup comparison (I2 = 0%). A GRADE analysis indicated that the quality of evidence supporting the primary outcome was low (See summary of findings Table for the main comparison). There was a difference in clinical response rates (> 100 point improvement in CDAI from baseline) between briakinumab and placebo patients at six weeks. Sixty‐four per cent (117/184) of briakinumab patients failed to respond compared to 78% of placebo patients (RR 0.82 95% CI 0.67 to 0.99). Subgroup analysis showed no differences by briakinumab dose (400 mg or 700 mg). No heterogeneity was detected for this comparison (I2 = 0%). A GRADE analysis indicated that the quality of evidence supporting this outcome was moderate (See summary of findings Table for the main comparison). Although all patients completed the induction phase of this study, the sponsor ended the study during the maintenance phase because the primary endpoint was not achieved. Sensitivity analyses utilizing a random‐effects model found similar results for induction of remission and clinical response (See Table 1).
The ustekinumab trials (Feagan 2016 UNITI‐1; Feagan 2016 UNITI‐2; Sandborn 2008; Sandborn 2012), were pooled despite differences in intravenous doses (i.e. 1mg/kg, 3 mg/kg, 4.5 mg/kg, and 6 mg/kg), however the subcutaneous dose group was not included in the analysis, as it was unclear if subcutaneous was equivalent to intravenous dosing. In the pooled analysis (4 studies, 1947 patients), ustekinumab was statistically different than placebo for failure to induce remission. At week six, 79% (1049/1332) of ustekinumab patients failed to enter remission compared to 88% (539/615) of placebo patients (RR 0.91, 95% CI 0.86 to 0.95; I2 = 27%). Subgroup analysis showed a difference for the ustekinumab 6.0 mg/kg dose. However a moderate amount of heterogeneity was detected for this subgroup comparison (I2 = 66%). A visual inspection of the forest plot indicated that the heterogeneity appeared to be a result of the inclusion of the Feagan 2016 UNITI‐2 study in the pooled analysis. The Feagan 2016 UNITI‐2 study differed from the other studies in the pooled analysis because it required objective evidence of active Crohn's disease (e.g. elevated serum C‐reactive protein or fecal calprotectin concentrations or endoscopic ulcerations) for study entry whereas the other studies in the pooled analysis did not. This may be a plausible explanation for the higher response rates seen in the UNITI‐2 patients compared to the other studies in the pooled analysis. To investigate if this study was the source of the heterogeneity the analysis was repeated excluding this trial. The pooled analysis now included 3 studies and 1320 participants. No heterogeneity was detected for the overall comparison (P = 0.72; I2 = 0%) or for the 6.0 mg/kg subgroup (P 0.20; I2 = 39%). Eighty‐four per cent (764/914) of ustekinumab patients failed to enter remission at week 6 compared to 90% (367/406) of placebo patients (RR 0.92, 95% CI 0.88 to 0.96). A GRADE analysis indicated that the quality of evidence supporting the primary outcome was high (See summary of findings Table 2). Subgroup analysis showed a difference in remission rates for the ustekinumab 6.0 mg/kg dose. Eighty‐four per cent (523/625) of ustekinumab 6.0 mg/kg patients failed to enter remission at week 6 compared to 91% (264/291) of placebo patients (RR 0.92, 95% CI 0.88 to 0.96).
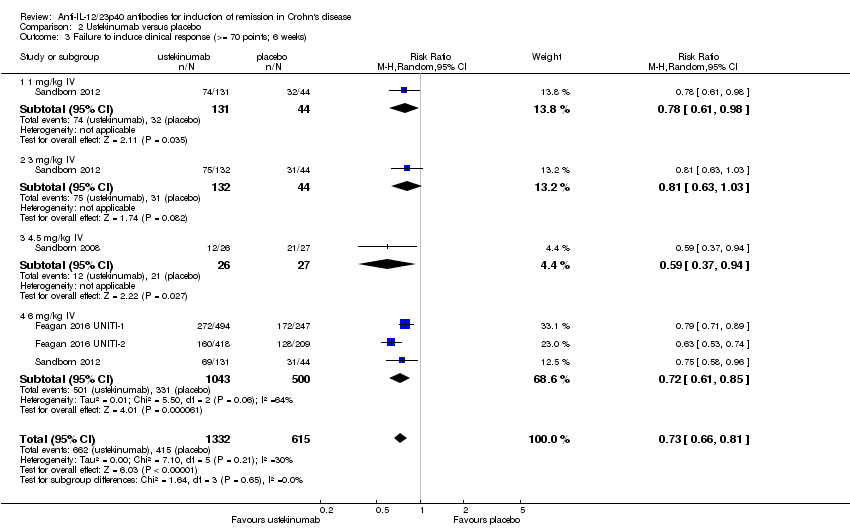
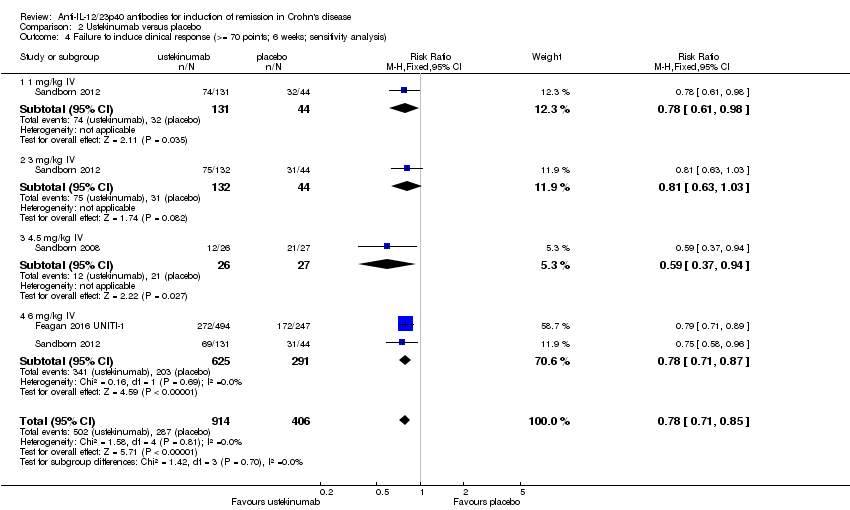
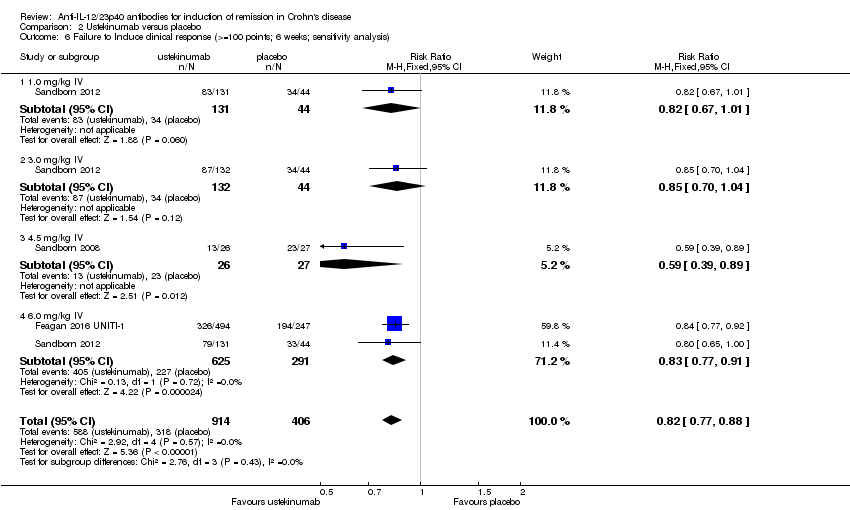
There were differences in clinical improvement between ustekinumab and placebo treated patients. In the ustekinumab group, 50% (662/1332) of patients failed to achieve a 70‐point decrease in CDAI score, compared to 68% (415/615) of placebo patients (RR 0.73, 95% CI 0.66 to 0.81; I2 = 30%). Subgroup analysis showed differences in failure to respond for the 1mg/kg, 4.5 mg/kg, and 6 mg/kg dosage subgroups. However, moderate heterogeneity was detected for the 6.0 mg/kg subgroup (I2 = 64%%). A visual inspection of the forest plot indicated that the heterogeneity appeared to be a result of the inclusion of the Feagan 2016 UNITI‐2 study in the pooled analysis. To investigate if this study was the source of the heterogeneity the analysis was repeated excluding this trial. The pooled analysis now included 3 studies and 1320 participants. No statistically significant heterogeneity was detected for the overall comparison (P = 0.81; I2 = 0%) or for the 6.0 mg/kg subgroup (P 0.69; I2 = 0%). Fifty‐five per cent (502/914) of ustekinumab patients failed to achieve a 70‐point decrease in CDAI score at week 6 compared to 71% (287/406) of placebo patients (RR 0.78, 95% CI 0.71 to 0.85). Subgroup analysis showed differences in failure to respond for the 1 mg/kg (RR 0.78, 95% CI 0.61 to 0.98), 4.5 mg/kg (RR 0.59, 95% CI 0.37 to 0.94), and 6 mg/kg (0.78, 95% CI 0.71 to 0.87) dosage subgroups. Similarly for a 100‐point decline in CDAI, 59% (782/1332) of patients in the ustekinumab group failed to have a 100‐point clinical response compared to 76% (467/615) of placebo patients (RR 0.77, 95% CI 0.69 to 0.87; I2 = 61%). Subgroup analysis showed a difference in failure to respond for the 4.5 mg/kg and 6.0 mg/kg dosage subgroups. However, a high degree of heterogeneity was detected for the 6.0 mg/kg subgroup comparison (I2 = 80%). A visual inspection of the forest plot indicated that the Feagan 2016 UNITI‐2 study could be the cause of this heterogeneity. To investigate if this study was the source of the heterogeneity the analysis was repeated excluding this trial. The pooled analysis now included 3 studies and 1320 participants. No heterogeneity was detected for the overall comparison (P = 0.57; I2 = 0%) or for the 6.0 mg/kg subgroup (P 0.72; I2 = 0%). Sixty‐four per cent (588/914) of ustekinumab patients failed to achieve a 100‐point decrease in CDAI score at week 6 compared to 78% (318/406) of placebo patients (RR 0.82, 95% CI 0.77 to 0.88). A GRADE analysis indicated that the quality of evidence supporting the outcome 100‐point clinical response was high (See summary of findings Table 2). Subgroup analysis showed a differences in failure to respond for the 4.5 mg/kg (RR 0.59, 95% CI 0.39 to 0.89), and 6 mg/kg (RR 0.83, 95% CI 0.77 to 0.91) dosage subgroups.
There were no differences in remission or clinical improvement rates in patients who received subcutaneous ustekinumab or placebo. Seventy‐two per cent (18/25) of patients in the subcutaneous ustekinumab group failed to enter remission at six weeks compared to 77% (20/26) of placebo patients (RR 0.94, 95% CI 0.68 to 1.29). Forty‐eight per cent (12/25) of patients in the subcutaneous ustekinumab group failed to achieve a 70‐point decrease in CDAI at six weeks compared to 62% (16/26) of placebo patients (RR 0.78, 95% CI 0.47 to 1.30). Fifty‐two per cent (13/25) of patients in the subcutaneous ustekinumab group failed to achieve a 100‐point decrease in CDAI at six weeks compared to 65% of placebo patients (RR 0.80, 95% CI 0.50 to 1.27). Sensitivity analyses utilizing a random‐effects model found similar results for induction of remission and clinical response.
Endoscopic remission was not assessed in any of the included studies. Steroid withdrawal following treatment was not assessed in any of the included induction studies. Sandborn 2012 evaluated corticosteroid‐free remission at 22 weeks during the maintenance phase.
There was no difference in the proportion of patients who experienced at least one adverse event in the Panaccione 2015 study. Seventy‐one per cent (141/200) of briakinumab patients experienced at least one adverse event compared to 78% (36/46) of placebo patients (RR 0.90, 95% CI 0.75 to 1.07). A GRADE analysis indicated that the overall quality of the evidence supporting this outcome was moderate (See summary of findings Table for the main comparison). Mannon 2004 did not report on the proportion of patients who had at least one adverse event. Mannon 2004 reported that injection site reactions were the most common adverse event. Injection site reactions occurred more frequently in the briakinumab groups (77% in the 1mg/kg group and 88% in the 3 mg/kg group) than the placebo group (25%). The majority of these injection site reactions were considered mild (88%). Panaccione 2015 reported infections as the most common adverse event. Thirty‐three per cent of briakinumab patients had an infection compared to 35% of placebo patients. There was no difference in either study in the proportion of patients who developed a serious adverse event or withdrew due to an adverse event. In the Mannon 2004 study, 11% (7/63) of briakinumab patients had a serious adverse event compared to 12% (2/16) of placebo patients (RR 0.89, 95% CI 0.20 to 3.88). In the Panaccione 2015 study 4% (9/200) of briakinumab patients had a serious adverse event compared to 9% (4/46) placebo patients (RR 0.52, 95% CI 0.17 to 1.61). Three per cent (2/63) of briakinumab patients in the Mannon 2004 study withdrew due to an adverse event compared to 12% (2/16) placebo patients (RR 0.25, 95% CI 0.04 to 1.67). Three per cent (6/200) of briakinumab patients in the Panaccione 2015 study withdrew due to an adverse event compared to 4% (2/46) of placebo patients (RR 0.69, 95% CI 0.14 to 3.31). GRADE analyses indicated that the overall quality of the evidence supporting the outcomes serious adverse events and withdrawal due to adverse events was low (See summary of findings Table for the main comparison).
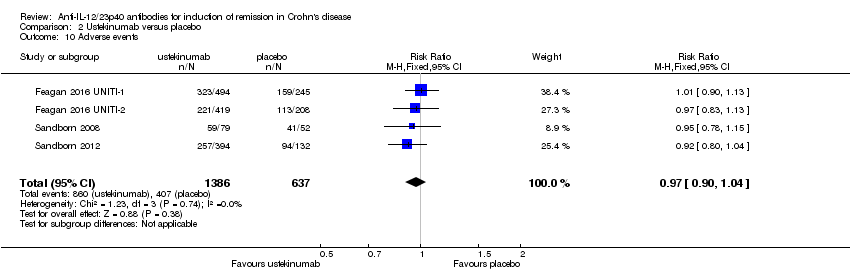
In the ustekinumab studies there was no difference in the proportion of patients who experienced at least one adverse event. Sixty‐two per cent (860/1386) of ustekinumab patients experienced at least one adverse event compared to 64% (407/637) of placebo patients (RR 0.97, 95% CI 0.90 to 1.04; participants = 2023; studies = 4; I2 = 0%). A GRADE analysis indicated that the overall quality of the evidence supporting this outcome was high (See summary of findings Table 2). Infections were the most commonly reported adverse event in the ustekinumab studies. Other common adverse events included nasopharyngitis (Feagan 2016 UNITI‐1; Feagan 2016 UNITI‐2; Sandborn 2008; Sandborn 2012), abdominal pain (Feagan 2016 UNITI‐1; Feagan 2016 UNITI‐2; Sandborn 2008; Sandborn 2012), nausea (Feagan 2016 UNITI‐1; Feagan 2016 UNITI‐2; Sandborn 2008; Sandborn 2012), worsening Crohn's disease (Feagan 2016 UNITI‐1; Feagan 2016 UNITI‐2; Sandborn 2008; Sandborn 2012), arthralgia (Feagan 2016 UNITI‐1; Feagan 2016 UNITI‐2; Sandborn 2008; Sandborn 2012), headache (Feagan 2016 UNITI‐1; Feagan 2016 UNITI‐2; Sandborn 2008; Sandborn 2012), and dyspepsia (Sandborn 2008).
There was no difference in the incidence of serious adverse events. Serious adverse events occurred in 5% (75/1386) of ustekinumab patients compared to 6% (41/637) of patients in the placebo group (RR 0.83, 95% CI 0.58 to 1.20; participants = 2023; studies = 4; I2 = 0%). A GRADE analysis indicated that the overall quality of the evidence supporting this outcome was moderate (See summary of findings Table 2). Worsening of CD and serious infections were the most common serious adverse events. Although the difference was not statistically significant, more placebo patients withdrew due to adverse events than ustekinumab patients. Five per cent (10/184) of placebo patients withdrew due to adverse events compared to 2% (10/473) of ustekinumab patients (RR 0.44, 95% CI 0.18 to 1.05; participants = 657; studies = 2; I2 = 0%).
Discussion
Summary of main results
Briakinumab (ABT‐874) and ustekinumab (CNTO 1275) are monoclonal antibodies that target the shared p40 subunit of IL‐12 and IL‐23, that have been studied for induction of remission in CD. Neither Mannon 2004 or Panaccione 2015 found briakinumab to be superior to placebo for induction of remission in CD. Grade analyses indicated that the overall quality of the evidence supporting this outcome was low due mostly to sparse data. Both Mannon 2004 and Panaccione 2015 found briakinumab to be superior to placebo for induction of clinical improvement. Grade analyses indicated that the overall quality of the evidence supporting this outcome was low due mostly to sparse data. Subgroup analysis did not identify any significant differences by dose. The Panaccione 2015 trial was terminated during the open‐label maintenance phase by the sponsor because the primary endpoint for induction of remission was not achieved, leaving to our knowledge ustekinumab as the only IL‐12/23p40 antagonist currently being investigated for the treatment of CD.
Ustekinumab patients were significantly more likely than placebo patients to achieve clinical remission and clinical improvement. Subgroup analysis identified a difference for the 6.0 mg/kg dose group for induction of remission. Clinical improvement results were consistent for both a 70 and 100 point reduction in CDAI scores. Subgroup analysis identified significant differences by dose for 70 (i.e. 1mg/kg, 4.5 mg/kg, and 6 mg/kg dosage subgroups) and 100 point reduction (i.e. 4.5 mg/kg and 6.0 mg/kg subgroups) in CDAI scores. The results of the GRADE analysis indicate that overall quality of the evidence supporting the outcomes clinical remission and 100‐point reduction in CDAI was high. Moderate to high quality evidence suggests that 6.0 mg/kg is the optimal dose for induction of remission and clinical response. Overall these results suggest a therapeutic benefit for ustekinumab in patients with moderate to severe CD.
With respect to safety, neither antibody led to an increase in adverse events or serious adverse events. Fewer patients that received anti‐IL‐12/23 monoclonal antibody treatment withdrew due to adverse events than placebo. However, these differences were not statistically significant. This may have been due to greater withdrawal of patients in the placebo group due to recurrence of CD symptoms. Although both drugs demonstrated an acceptable safety profile in these studies, the number of patients investigated did not allow for the assessment of rare adverse events. Studies with long term follow‐up are required to assess the risk of rare adverse events.
Overall completeness and applicability of evidence
The results of this review are applicable to patients with moderate to severe Crohn's disease and patients with moderate to severe Crohn's disease who have failed TNF‐alpha antagonists. High quality evidence suggests that ustekinumab is effective for induction of clinical remission and improvement in patients with moderate to severe Crohn's disease. Ustekinumab offers an out‐of‐class option for patients who fail currently available TNF‐α antagonists.
Quality of the evidence
All of the included studies were judged to be at low risk of bias. GRADE analyses indicated that the overall quality of the evidence supporting the primary and secondary outcomes from the briakinumab studies was moderate to low due mostly to sparse data. GRADE analyses indicated that the overall quality of evidence supporting the primary outcome from the ustekinumab studies was rated as high quality. The secondary outcome clinical response was rated as high quality. Moderate to high quality evidence suggests that 6.0 mg/kg is the optimal dose of ustekinumab for induction of remission and clinical improvement. The outcome adverse events was rated as high quality. The outcome serious adverse events was rated as moderate quality. The outcome withdrawal due to adverse events was rated as low quality due to very sparse data.
Potential biases in the review process
To reduce potential bias in the review process we performed a comprehensive literature search to identify all eligible studies. In addition, two review authors independently assessed studies for inclusion, extracted data and assessed study quality. There are several limitations to this review. The studies that investigated briakinumab were small, thus they were only able to detect large effects and frequent adverse events.
Agreements and disagreements with other studies or reviews
The results of our review agree with other published reviews on ustekinumab and briakinumab (Khanna 2013; Niederreiter 2013; Singh 2014). Our review is the only systematic review to include a pooled analysis for the ustekinumab studies.
Risk of bias summary: reviewers' judgements about each risk of bias item for each included study.

Comparison 1 Briakinumab versus placebo, Outcome 1 Failure to induce clinical remission (7 & 9 weeks).

Comparison 1 Briakinumab versus placebo, Outcome 2 Failure to Induce clinical remission (6 weeks).

Comparison 1 Briakinumab versus placebo, Outcome 3 Failure to induce clinical response (>= 100 points; 7 & 9 weeks).
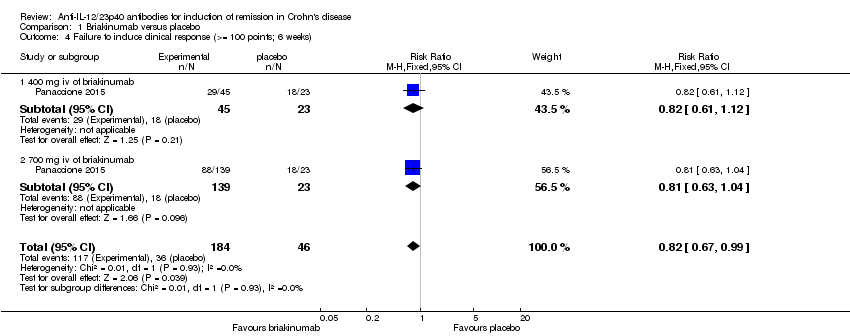
Comparison 1 Briakinumab versus placebo, Outcome 4 Failure to induce clinical response (>= 100 points; 6 weeks).
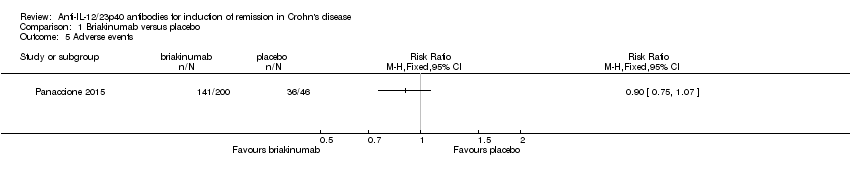
Comparison 1 Briakinumab versus placebo, Outcome 5 Adverse events.
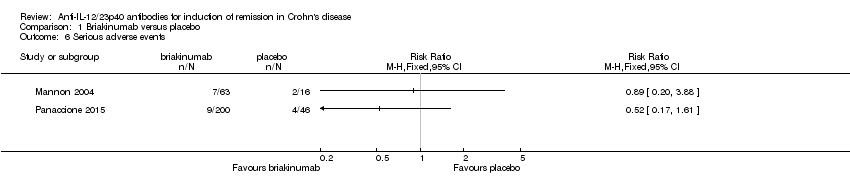
Comparison 1 Briakinumab versus placebo, Outcome 6 Serious adverse events.

Comparison 1 Briakinumab versus placebo, Outcome 7 Withdrawals because of adverse events.

Comparison 2 Ustekinumab versus placebo, Outcome 1 Failure to induce clinical remission (6 weeks).
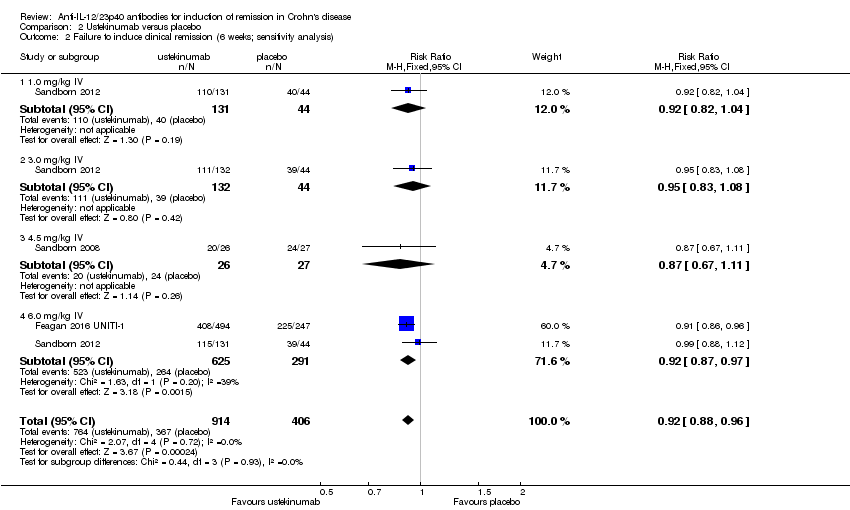
Comparison 2 Ustekinumab versus placebo, Outcome 2 Failure to induce clinical remission (6 weeks; sensitivity analysis).
Comparison 2 Ustekinumab versus placebo, Outcome 3 Failure to induce clinical response (>= 70 points; 6 weeks).
Comparison 2 Ustekinumab versus placebo, Outcome 4 Failure to induce clinical response (>= 70 points; 6 weeks; sensitivity analysis).

Comparison 2 Ustekinumab versus placebo, Outcome 5 Failure to Induce clinical response (>=100 points; 6 weeks).
Comparison 2 Ustekinumab versus placebo, Outcome 6 Failure to Induce clinical response (>=100 points; 6 weeks; sensitivity analysis).

Comparison 2 Ustekinumab versus placebo, Outcome 7 Failure to induce clinical remission ‐ 90 mg, s.c. (6 weeks).

Comparison 2 Ustekinumab versus placebo, Outcome 8 Failure to induce clinical response 90 mg s.c. (>= 70 points; 6 weeks).

Comparison 2 Ustekinumab versus placebo, Outcome 9 Failure to induce clinical response 90 mg s.c. (>=100 points; 6 weeks).
Comparison 2 Ustekinumab versus placebo, Outcome 10 Adverse events.
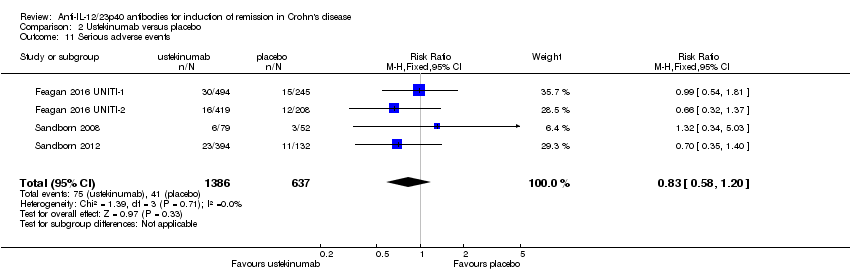
Comparison 2 Ustekinumab versus placebo, Outcome 11 Serious adverse events.

Comparison 2 Ustekinumab versus placebo, Outcome 12 Withdrawals because of adverse events.
| Briakinumab compared to placebo for induction of remission in Crohn's disease | ||||||
| Patient or population: induction of remission in Crohn's disease | ||||||
| Outcomes | Illustrative comparative risks* (95% CI) | Relative effect | No of Participants | Quality of the evidence | Comments | |
| Assumed risk | Corresponding risk | |||||
| placebo | Briakinumab | |||||
| Failure to induce clinical remission (Mannon 2004) | 812 per 10001 | 699 per 1000 | RR 0.86 | 79 | ⊕⊕⊝⊝ | |
| Failure to induce clinical remission (Panaccione 2010) | 913 per 10001 | 840 per 1000 (758 to 940) | RR 0.92 (0.83 to 1.03) | 230 (1 study) | ⊕⊕⊝⊝ | |
| Failure to induce clinical response CDAI ‐ (≥100 point reduction) | 688 per 10001 | 447 per 1000 | RR 0.65 | 79 | ⊕⊕⊝⊝ | |
| Failure to induce clinical response CDAI ‐ (≥100 point reduction) | 783 per 10001 | 642 per 1000 (525 to 775) | RR 0.82 (0.67 to 0.99) | 230 (1 study) | ⊕⊕⊕⊝ | |
| Adverse events (Panaccione 2010) Follow‐up: 12 weeks | 783 per 10001 | 705 per 1000 (587 to 838) | RR 0.90 (0.75 to 1.07) | 230 (1 study) | ⊕⊕⊕⊝ | |
| Serious adverse events (Panaccione 2010) | 87 per 10001 | 45 per 1000 | RR 0.52 | 246 | ⊕⊕⊝⊝ | |
| Withdrawals due to adverse event** (Pannaccione 2010) | 44 per 10001 | 30 per 1000 | RR 0.69 | 246 | ⊕⊕⊝⊝ | |
| *The basis for the assumed risk (e.g. the median control group risk across studies) is provided in footnotes. The corresponding risk (and its 95% confidence interval) is based on the assumed risk in the comparison group and the relative effect of the intervention (and its 95% CI). **Subject numbers are higher than those reported for the efficacy analyses of the individual studies due to the 200 mg, i.v. experimental group discontinuing enrolment during the induction phase due to poor patient enrolment (Panaccione, 2010). These patients were not included in the efficacy analyses, but were included in the safety analyses. | ||||||
| GRADE Working Group grades of evidence | ||||||
| 1 Control group risk estimates come from control arm of meta‐analysis, based on included trials | ||||||
| Ustekinumab compared to placebo for induction of remission in Crohn's disease | ||||||
| Patient or population: patients with induction of remission in Crohn's disease | ||||||
| Outcomes | Illustrative comparative risks* (95% CI) | Relative effect | No of Participants | Quality of the evidence | Comments | |
| Assumed risk | Corresponding risk | |||||
| placebo | Ustekinumab | |||||
| Failure to induce clinical remission | 904 per 10001 | 832 per 1000 | RR 0.92 | 1320 | ⊕⊕⊕⊕ | Sensitivity analysis excluding UNITI‐2 trial. These patients had more severe disease at study entry |
| Failure to induce clinical remission (6 mg/kg subgroup) | 907 per 10001 | 835 per 1000 | RR 0.92 | 916 | ⊕⊕⊕⊝ | |
| Failure to induce clinical response | 783 per 10001 | 642 per 1000 | RR 0.82 | 1320 | ⊕⊕⊕⊕ | Sensitivity analysis excluding UNITI‐2 trial. These patients had more severe disease at study entry |
| Failure to induce clinical response (6 mg/kg subgroup) | 780 per 10001 | 647 per 1000 | RR 0.83 | 916 | ⊕⊕⊕⊕ | |
| Adverse events Follow‐up: 8 weeks | 639 per 10001 | 620 per 1000 | RR 0.97 | 2023 | ⊕⊕⊕⊕ | |
| Serious adverse events | 64 per 10001 | 53 per 1000 | RR 0.83 | 2023 | ⊕⊕⊕⊝ | |
| Withdrawals due to adverse event | 54 per 10001 | 24 per 1000 | RR 0.44 | 657 | ⊕⊕⊝⊝ | |
| *The basis for the assumed risk (e.g. the median control group risk across studies) is provided in footnotes. The corresponding risk (and its 95% confidence interval) is based on the assumed risk in the comparison group and the relative effect of the intervention (and its 95% CI). **Subject numbers are higher than those reported for the efficacy analyses of the individual studies due to the omission of efficacy results for subjects receiving subcutaneous placebo and 90 mg ustekinumab, as well as subjects receiving 90mg s.c. and 4.5 mg/kg of ustekinumab in the open‐label arm of the study by Sandborn (2008). The results of these subjects were included in the safety analyses. | ||||||
| GRADE Working Group grades of evidence | ||||||
| 1 Control group risk estimates come from control arm of meta‐analysis, based on included trials | ||||||
| Outcome | Fixed Effects Modelling | Random Effects Modelling |
| Briakinumab /Remission (Mannon 2004) | RR 0.86 [0.65, 1.14] | RR 0.88 [0.68, 1.15] |
| Briakinumab /Remission (Panaccione 2015) | RR 1.05 [0.90, 1.22] | RR 0.92 [0.83, 1.03] |
| Ustekinumab /Remission | RR 0.94 [0.88, 1.01] | RR 0.95 [0.89, 1.02] |
| Briakinumab /Response (Mannon 2004) | RR 0.65 [0.42, 0.99] | RR 0.66 [0.44, 1.01] |
| Briakinumab /Response (Panaccione 2015) | RR 0.82 [0,67, 0.99] | RR 0.81 [0.67, 0.99] |
| Ustekinumab /Response | RR 0.79 [0.71, 0.89] | RR 0.80 [0.72, 0.90] |
| Outcome or subgroup title | No. of studies | No. of participants | Statistical method | Effect size |
| 1 Failure to induce clinical remission (7 & 9 weeks) Show forest plot | 1 | 79 | Risk Ratio (M‐H, Fixed, 95% CI) | 0.86 [0.65, 1.14] |
| 1.1 1 mg/kg body weight each week | 1 | 39 | Risk Ratio (M‐H, Fixed, 95% CI) | 0.92 [0.67, 1.26] |
| 1.2 3 mg/kg body weight each week | 1 | 40 | Risk Ratio (M‐H, Fixed, 95% CI) | 0.79 [0.48, 1.30] |
| 2 Failure to Induce clinical remission (6 weeks) Show forest plot | 1 | 230 | Risk Ratio (M‐H, Fixed, 95% CI) | 0.92 [0.83, 1.03] |
| 2.1 IV Infusion of 400 mg | 1 | 68 | Risk Ratio (M‐H, Fixed, 95% CI) | 0.95 [0.80, 1.13] |
| 2.2 IV Infusion of 700 mg | 1 | 162 | Risk Ratio (M‐H, Fixed, 95% CI) | 0.91 [0.78, 1.05] |
| 3 Failure to induce clinical response (>= 100 points; 7 & 9 weeks) Show forest plot | 1 | 79 | Risk Ratio (M‐H, Fixed, 95% CI) | 0.65 [0.42, 0.99] |
| 3.1 1 mg/kg body weight each week | 1 | 39 | Risk Ratio (M‐H, Fixed, 95% CI) | 0.73 [0.44, 1.22] |
| 3.2 3 mg/kg body weight each week | 1 | 40 | Risk Ratio (M‐H, Fixed, 95% CI) | 0.55 [0.27, 1.13] |
| 4 Failure to induce clinical response (>= 100 points; 6 weeks) Show forest plot | 1 | 230 | Risk Ratio (M‐H, Fixed, 95% CI) | 0.82 [0.67, 0.99] |
| 4.1 400 mg iv of briakinumab | 1 | 68 | Risk Ratio (M‐H, Fixed, 95% CI) | 0.82 [0.61, 1.12] |
| 4.2 700 mg iv of briakinumab | 1 | 162 | Risk Ratio (M‐H, Fixed, 95% CI) | 0.81 [0.63, 1.04] |
| 5 Adverse events Show forest plot | 1 | Risk Ratio (M‐H, Fixed, 95% CI) | Totals not selected | |
| 6 Serious adverse events Show forest plot | 2 | Risk Ratio (M‐H, Fixed, 95% CI) | Totals not selected | |
| 7 Withdrawals because of adverse events Show forest plot | 2 | Risk Ratio (M‐H, Fixed, 95% CI) | Totals not selected | |
| Outcome or subgroup title | No. of studies | No. of participants | Statistical method | Effect size |
| 1 Failure to induce clinical remission (6 weeks) Show forest plot | 4 | 1947 | Risk Ratio (M‐H, Random, 95% CI) | 0.91 [0.86, 0.95] |
| 1.1 1.0 mg/kg IV | 1 | 175 | Risk Ratio (M‐H, Random, 95% CI) | 0.92 [0.82, 1.04] |
| 1.2 3.0 mg/kg IV | 1 | 176 | Risk Ratio (M‐H, Random, 95% CI) | 0.95 [0.83, 1.08] |
| 1.3 4.5 mg/kg IV | 1 | 53 | Risk Ratio (M‐H, Random, 95% CI) | 0.87 [0.67, 1.11] |
| 1.4 6.0 mg/kg IV | 3 | 1543 | Risk Ratio (M‐H, Random, 95% CI) | 0.90 [0.82, 0.98] |
| 2 Failure to induce clinical remission (6 weeks; sensitivity analysis) Show forest plot | 3 | 1320 | Risk Ratio (M‐H, Fixed, 95% CI) | 0.92 [0.88, 0.96] |
| 2.1 1.0 mg/kg IV | 1 | 175 | Risk Ratio (M‐H, Fixed, 95% CI) | 0.92 [0.82, 1.04] |
| 2.2 3.0 mg/kg IV | 1 | 176 | Risk Ratio (M‐H, Fixed, 95% CI) | 0.95 [0.83, 1.08] |
| 2.3 4.5 mg/kg IV | 1 | 53 | Risk Ratio (M‐H, Fixed, 95% CI) | 0.87 [0.67, 1.11] |
| 2.4 6.0 mg/kg IV | 2 | 916 | Risk Ratio (M‐H, Fixed, 95% CI) | 0.92 [0.87, 0.97] |
| 3 Failure to induce clinical response (>= 70 points; 6 weeks) Show forest plot | 4 | 1947 | Risk Ratio (M‐H, Random, 95% CI) | 0.73 [0.66, 0.81] |
| 3.1 1 mg/kg IV | 1 | 175 | Risk Ratio (M‐H, Random, 95% CI) | 0.78 [0.61, 0.98] |
| 3.2 3 mg/kg IV | 1 | 176 | Risk Ratio (M‐H, Random, 95% CI) | 0.81 [0.63, 1.03] |
| 3.3 4.5 mg/kg IV | 1 | 53 | Risk Ratio (M‐H, Random, 95% CI) | 0.59 [0.37, 0.94] |
| 3.4 6 mg/kg IV | 3 | 1543 | Risk Ratio (M‐H, Random, 95% CI) | 0.72 [0.61, 0.85] |
| 4 Failure to induce clinical response (>= 70 points; 6 weeks; sensitivity analysis) Show forest plot | 3 | 1320 | Risk Ratio (M‐H, Fixed, 95% CI) | 0.78 [0.71, 0.85] |
| 4.1 1 mg/kg IV | 1 | 175 | Risk Ratio (M‐H, Fixed, 95% CI) | 0.78 [0.61, 0.98] |
| 4.2 3 mg/kg IV | 1 | 176 | Risk Ratio (M‐H, Fixed, 95% CI) | 0.81 [0.63, 1.03] |
| 4.3 4.5 mg/kg IV | 1 | 53 | Risk Ratio (M‐H, Fixed, 95% CI) | 0.59 [0.37, 0.94] |
| 4.4 6 mg/kg IV | 2 | 916 | Risk Ratio (M‐H, Fixed, 95% CI) | 0.78 [0.71, 0.87] |
| 5 Failure to Induce clinical response (>=100 points; 6 weeks) Show forest plot | 4 | 1947 | Risk Ratio (M‐H, Random, 95% CI) | 0.77 [0.69, 0.87] |
| 5.1 1.0 mg/kg IV | 1 | 175 | Risk Ratio (M‐H, Random, 95% CI) | 0.82 [0.67, 1.01] |
| 5.2 3.0 mg/kg IV | 1 | 176 | Risk Ratio (M‐H, Random, 95% CI) | 0.85 [0.70, 1.04] |
| 5.3 4.5 mg/kg IV | 1 | 53 | Risk Ratio (M‐H, Random, 95% CI) | 0.59 [0.39, 0.89] |
| 5.4 6.0 mg/kg IV | 3 | 1543 | Risk Ratio (M‐H, Random, 95% CI) | 0.76 [0.63, 0.91] |
| 6 Failure to Induce clinical response (>=100 points; 6 weeks; sensitivity analysis) Show forest plot | 3 | 1320 | Risk Ratio (M‐H, Fixed, 95% CI) | 0.82 [0.77, 0.88] |
| 6.1 1.0 mg/kg IV | 1 | 175 | Risk Ratio (M‐H, Fixed, 95% CI) | 0.82 [0.67, 1.01] |
| 6.2 3.0 mg/kg IV | 1 | 176 | Risk Ratio (M‐H, Fixed, 95% CI) | 0.85 [0.70, 1.04] |
| 6.3 4.5 mg/kg IV | 1 | 53 | Risk Ratio (M‐H, Fixed, 95% CI) | 0.59 [0.39, 0.89] |
| 6.4 6.0 mg/kg IV | 2 | 916 | Risk Ratio (M‐H, Fixed, 95% CI) | 0.83 [0.77, 0.91] |
| 7 Failure to induce clinical remission ‐ 90 mg, s.c. (6 weeks) Show forest plot | 1 | Risk Ratio (M‐H, Fixed, 95% CI) | Totals not selected | |
| 8 Failure to induce clinical response 90 mg s.c. (>= 70 points; 6 weeks) Show forest plot | 1 | Risk Ratio (M‐H, Fixed, 95% CI) | Totals not selected | |
| 9 Failure to induce clinical response 90 mg s.c. (>=100 points; 6 weeks) Show forest plot | 1 | Risk Ratio (M‐H, Fixed, 95% CI) | Totals not selected | |
| 10 Adverse events Show forest plot | 4 | 2023 | Risk Ratio (M‐H, Fixed, 95% CI) | 0.97 [0.90, 1.04] |
| 11 Serious adverse events Show forest plot | 4 | 2023 | Risk Ratio (M‐H, Fixed, 95% CI) | 0.83 [0.58, 1.20] |
| 12 Withdrawals because of adverse events Show forest plot | 2 | 657 | Risk Ratio (M‐H, Fixed, 95% CI) | 0.44 [0.18, 1.05] |