| 1 Failure to induce clinical remission (6 weeks) Show forest plot | 4 | 1947 | Risk Ratio (M‐H, Random, 95% CI) | 0.91 [0.86, 0.95] |
|
| 1.1 1.0 mg/kg IV | 1 | 175 | Risk Ratio (M‐H, Random, 95% CI) | 0.92 [0.82, 1.04] |
| 1.2 3.0 mg/kg IV | 1 | 176 | Risk Ratio (M‐H, Random, 95% CI) | 0.95 [0.83, 1.08] |
| 1.3 4.5 mg/kg IV | 1 | 53 | Risk Ratio (M‐H, Random, 95% CI) | 0.87 [0.67, 1.11] |
| 1.4 6.0 mg/kg IV | 3 | 1543 | Risk Ratio (M‐H, Random, 95% CI) | 0.90 [0.82, 0.98] |
| 2 Failure to induce clinical remission (6 weeks; sensitivity analysis) Show forest plot | 3 | 1320 | Risk Ratio (M‐H, Fixed, 95% CI) | 0.92 [0.88, 0.96] |
|
| 2.1 1.0 mg/kg IV | 1 | 175 | Risk Ratio (M‐H, Fixed, 95% CI) | 0.92 [0.82, 1.04] |
| 2.2 3.0 mg/kg IV | 1 | 176 | Risk Ratio (M‐H, Fixed, 95% CI) | 0.95 [0.83, 1.08] |
| 2.3 4.5 mg/kg IV | 1 | 53 | Risk Ratio (M‐H, Fixed, 95% CI) | 0.87 [0.67, 1.11] |
| 2.4 6.0 mg/kg IV | 2 | 916 | Risk Ratio (M‐H, Fixed, 95% CI) | 0.92 [0.87, 0.97] |
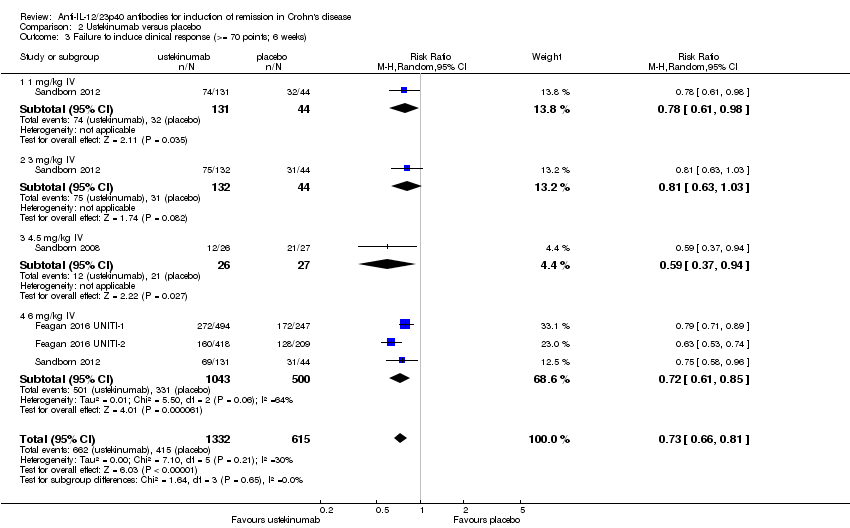
| 3 Failure to induce clinical response (>= 70 points; 6 weeks) Show forest plot | 4 | 1947 | Risk Ratio (M‐H, Random, 95% CI) | 0.73 [0.66, 0.81] |
|
| 3.1 1 mg/kg IV | 1 | 175 | Risk Ratio (M‐H, Random, 95% CI) | 0.78 [0.61, 0.98] |
| 3.2 3 mg/kg IV | 1 | 176 | Risk Ratio (M‐H, Random, 95% CI) | 0.81 [0.63, 1.03] |
| 3.3 4.5 mg/kg IV | 1 | 53 | Risk Ratio (M‐H, Random, 95% CI) | 0.59 [0.37, 0.94] |
| 3.4 6 mg/kg IV | 3 | 1543 | Risk Ratio (M‐H, Random, 95% CI) | 0.72 [0.61, 0.85] |
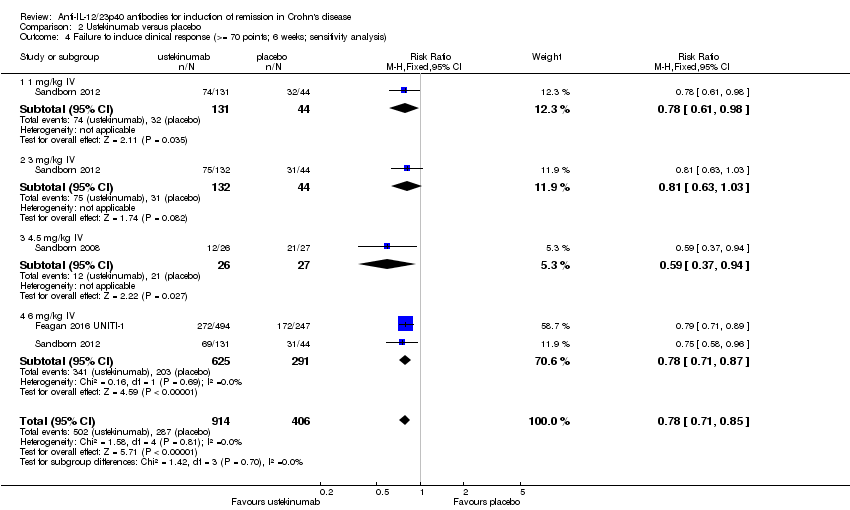
| 4 Failure to induce clinical response (>= 70 points; 6 weeks; sensitivity analysis) Show forest plot | 3 | 1320 | Risk Ratio (M‐H, Fixed, 95% CI) | 0.78 [0.71, 0.85] |
|
| 4.1 1 mg/kg IV | 1 | 175 | Risk Ratio (M‐H, Fixed, 95% CI) | 0.78 [0.61, 0.98] |
| 4.2 3 mg/kg IV | 1 | 176 | Risk Ratio (M‐H, Fixed, 95% CI) | 0.81 [0.63, 1.03] |
| 4.3 4.5 mg/kg IV | 1 | 53 | Risk Ratio (M‐H, Fixed, 95% CI) | 0.59 [0.37, 0.94] |
| 4.4 6 mg/kg IV | 2 | 916 | Risk Ratio (M‐H, Fixed, 95% CI) | 0.78 [0.71, 0.87] |
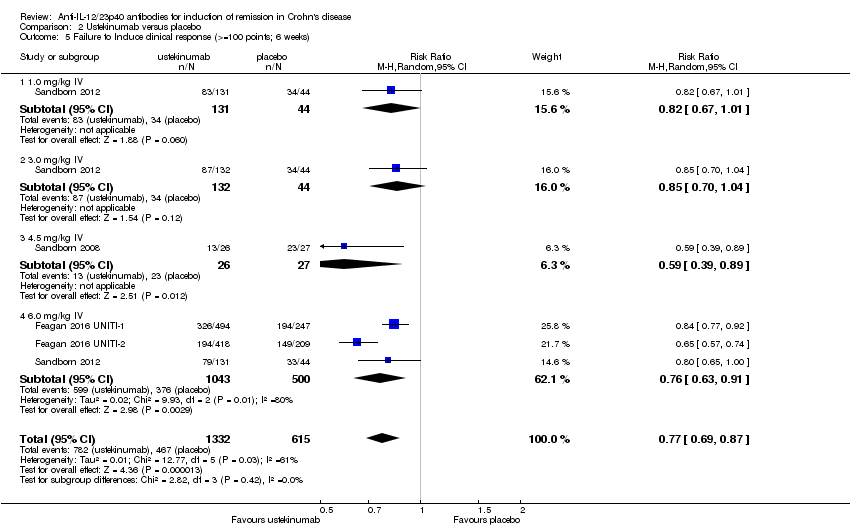
| 5 Failure to Induce clinical response (>=100 points; 6 weeks) Show forest plot | 4 | 1947 | Risk Ratio (M‐H, Random, 95% CI) | 0.77 [0.69, 0.87] |
|
| 5.1 1.0 mg/kg IV | 1 | 175 | Risk Ratio (M‐H, Random, 95% CI) | 0.82 [0.67, 1.01] |
| 5.2 3.0 mg/kg IV | 1 | 176 | Risk Ratio (M‐H, Random, 95% CI) | 0.85 [0.70, 1.04] |
| 5.3 4.5 mg/kg IV | 1 | 53 | Risk Ratio (M‐H, Random, 95% CI) | 0.59 [0.39, 0.89] |
| 5.4 6.0 mg/kg IV | 3 | 1543 | Risk Ratio (M‐H, Random, 95% CI) | 0.76 [0.63, 0.91] |
| 6 Failure to Induce clinical response (>=100 points; 6 weeks; sensitivity analysis) Show forest plot | 3 | 1320 | Risk Ratio (M‐H, Fixed, 95% CI) | 0.82 [0.77, 0.88] |
|
| 6.1 1.0 mg/kg IV | 1 | 175 | Risk Ratio (M‐H, Fixed, 95% CI) | 0.82 [0.67, 1.01] |
| 6.2 3.0 mg/kg IV | 1 | 176 | Risk Ratio (M‐H, Fixed, 95% CI) | 0.85 [0.70, 1.04] |
| 6.3 4.5 mg/kg IV | 1 | 53 | Risk Ratio (M‐H, Fixed, 95% CI) | 0.59 [0.39, 0.89] |
| 6.4 6.0 mg/kg IV | 2 | 916 | Risk Ratio (M‐H, Fixed, 95% CI) | 0.83 [0.77, 0.91] |
| 7 Failure to induce clinical remission ‐ 90 mg, s.c. (6 weeks) Show forest plot | 1 | | Risk Ratio (M‐H, Fixed, 95% CI) | Totals not selected |
|
| 8 Failure to induce clinical response 90 mg s.c. (>= 70 points; 6 weeks) Show forest plot | 1 | | Risk Ratio (M‐H, Fixed, 95% CI) | Totals not selected |
|
| 9 Failure to induce clinical response 90 mg s.c. (>=100 points; 6 weeks) Show forest plot | 1 | | Risk Ratio (M‐H, Fixed, 95% CI) | Totals not selected |
|
| 10 Adverse events Show forest plot | 4 | 2023 | Risk Ratio (M‐H, Fixed, 95% CI) | 0.97 [0.90, 1.04] |
|
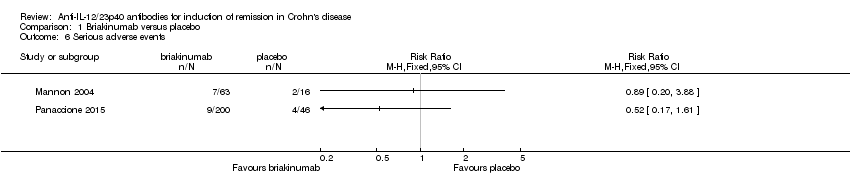
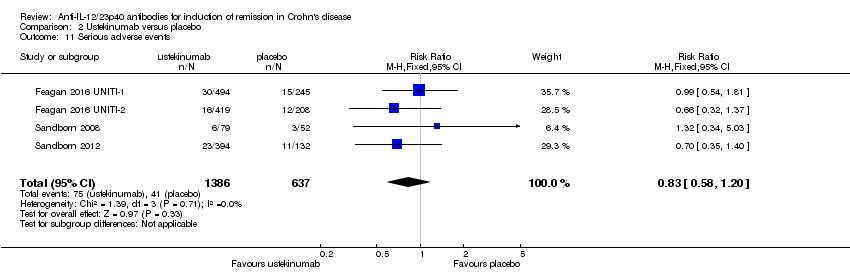
| 11 Serious adverse events Show forest plot | 4 | 2023 | Risk Ratio (M‐H, Fixed, 95% CI) | 0.83 [0.58, 1.20] |
|
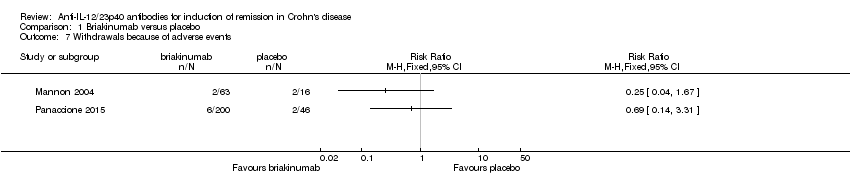
| 12 Withdrawals because of adverse events Show forest plot | 2 | 657 | Risk Ratio (M‐H, Fixed, 95% CI) | 0.44 [0.18, 1.05] |
|