Anticuerpos anti‐IL‐12/23p40 para la inducción de la remisión en la enfermedad de Crohn
Información
- DOI:
- https://doi.org/10.1002/14651858.CD007572.pub3Copiar DOI

- Base de datos:
-
- Cochrane Database of Systematic Reviews
- Versión publicada:
-
- 25 noviembre 2016see what's new
- Tipo:
-
- Intervention
- Etapa:
-
- Review
- Grupo Editorial Cochrane:
-
Grupo Cochrane de Salud digestiva
- Copyright:
-
- Copyright © 2016 The Cochrane Collaboration. Published by John Wiley & Sons, Ltd.
Cifras del artículo
Altmetric:
Citado por:
Autores
Contributions of authors
All authors contributed to planning the study, identification of relevant studies, assessment of methodological quality, data extraction, and manuscript preparation.
Sources of support
Internal sources
-
Charité ‐ Universitätsmedizin Berlin, Germany.
External sources
-
No sources of support supplied
Declarations of interest
John MacDonald: None known.
Tran Nguyen: None known
Reena Khanna has received honoraria from AbbVie, Jansen, Pfizer, Shire, and Takeda for consultancy. All of these activities are outside the submitted work.
Antje Timmer received grants (paid to institution) from Sanofi‐Aventis, Bayer, Takeda, Celgene, and Novartis for pharmacoepidemiological studies; and payment for lectures from The Falk Foundation, and MSD Sharp. All of these activities are outside the submitted work.
Acknowledgements
Partial funding for the Cochrane IBD Group (April 1, 2016 ‐ March 31, 2018) has been provided by Crohn's and Colitis Canada (CCC).
Version history
| Published | Title | Stage | Authors | Version |
| 2016 Nov 25 | Anti‐IL‐12/23p40 antibodies for induction of remission in Crohn's disease | Review | John K MacDonald, Tran M Nguyen, Reena Khanna, Antje Timmer | |
| 2015 May 05 | Anti‐IL‐12/23p40 antibodies for induction of remission in Crohn's disease | Review | Reena Khanna, Jan C Preiss, John K MacDonald, Antje Timmer | |
| 2009 Jan 21 | Anti‐IL‐12/23p40 antibodies for induction of remission in Crohn's disease | Protocol | Jan C Preiss, Antje Timmer | |
Differences between protocol and review
We would like to acknowledge some differences between the protocol and review:
-
Primary and secondary outcomes: The primary and secondary outcomes were not well defined in the protocol. The primary outcome should have been defined as the proportion of patients who failed to enter clinical remission as defined by the included studies. The secondary efficacy outcomes should have been defined in a similar manner. The secondary outcome 'adverse events' was added after the protocol was published.
-
GRADE was added to the methods section. Please see MECIR C76.
-
We added a section on 'Unit of analysis issues' to the Methods section to explain how we would deal with these issues. This was not predefined in the protocol.
-
We added a section on 'Assessment of reporting biases' to the Methods section to explain how we would deal with issue for future updates of this review.This was not predefined in the protocol.
Keywords
MeSH
Medical Subject Headings (MeSH) Keywords
- Antibodies, Monoclonal [administration & dosage, *therapeutic use];
- Antibodies, Monoclonal, Humanized [administration & dosage, *therapeutic use];
- Crohn Disease [*therapy];
- Injections, Intravenous;
- Interleukin‐12 [*antagonists & inhibitors, immunology];
- Interleukin‐23 [*antagonists & inhibitors, immunology];
- Randomized Controlled Trials as Topic;
- Remission Induction [methods];
- Ustekinumab [administration & dosage, *therapeutic use];
Medical Subject Headings Check Words
Humans;
PICO

Study flow diagram.
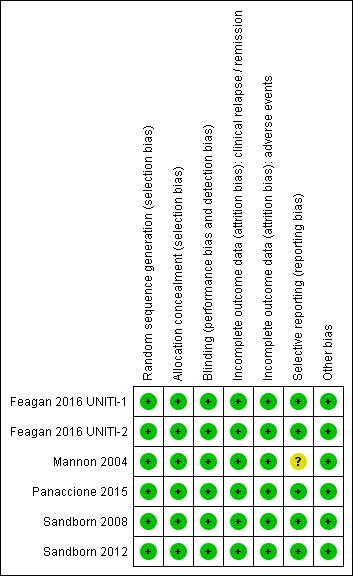
Risk of bias summary: reviewers' judgements about each risk of bias item for each included study.
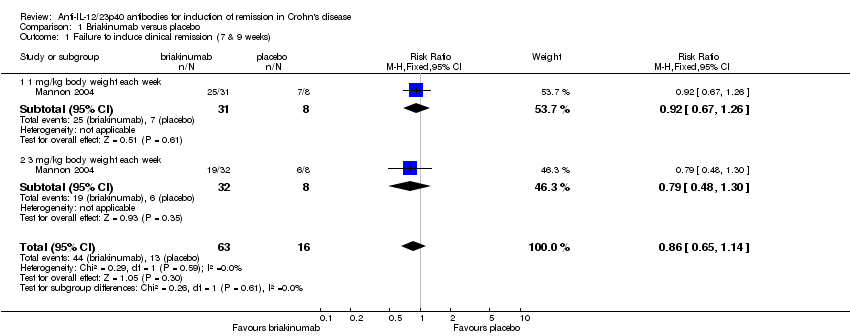
Comparison 1 Briakinumab versus placebo, Outcome 1 Failure to induce clinical remission (7 & 9 weeks).
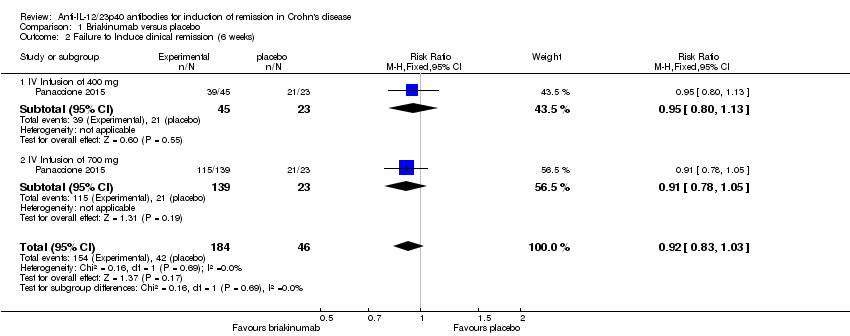
Comparison 1 Briakinumab versus placebo, Outcome 2 Failure to Induce clinical remission (6 weeks).

Comparison 1 Briakinumab versus placebo, Outcome 3 Failure to induce clinical response (>= 100 points; 7 & 9 weeks).

Comparison 1 Briakinumab versus placebo, Outcome 4 Failure to induce clinical response (>= 100 points; 6 weeks).

Comparison 1 Briakinumab versus placebo, Outcome 5 Adverse events.
Comparison 1 Briakinumab versus placebo, Outcome 6 Serious adverse events.
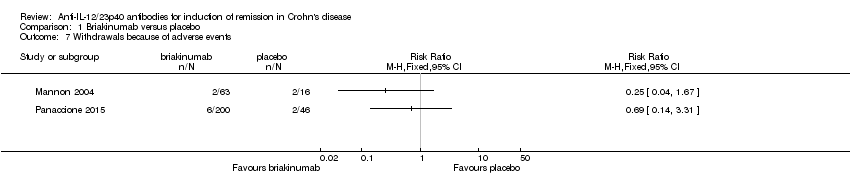
Comparison 1 Briakinumab versus placebo, Outcome 7 Withdrawals because of adverse events.

Comparison 2 Ustekinumab versus placebo, Outcome 1 Failure to induce clinical remission (6 weeks).

Comparison 2 Ustekinumab versus placebo, Outcome 2 Failure to induce clinical remission (6 weeks; sensitivity analysis).
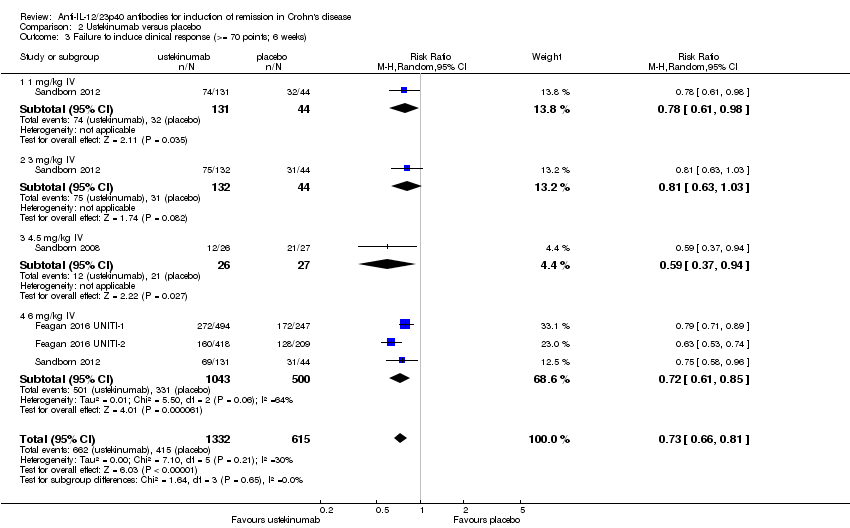
Comparison 2 Ustekinumab versus placebo, Outcome 3 Failure to induce clinical response (>= 70 points; 6 weeks).
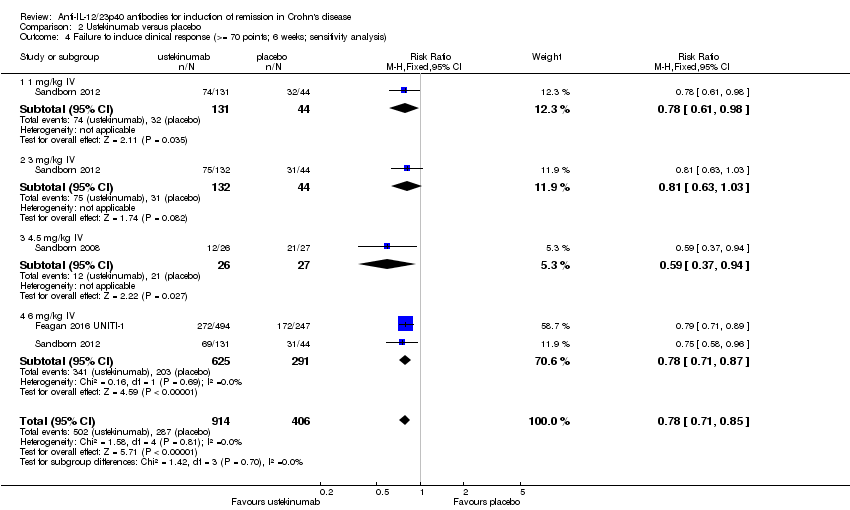
Comparison 2 Ustekinumab versus placebo, Outcome 4 Failure to induce clinical response (>= 70 points; 6 weeks; sensitivity analysis).
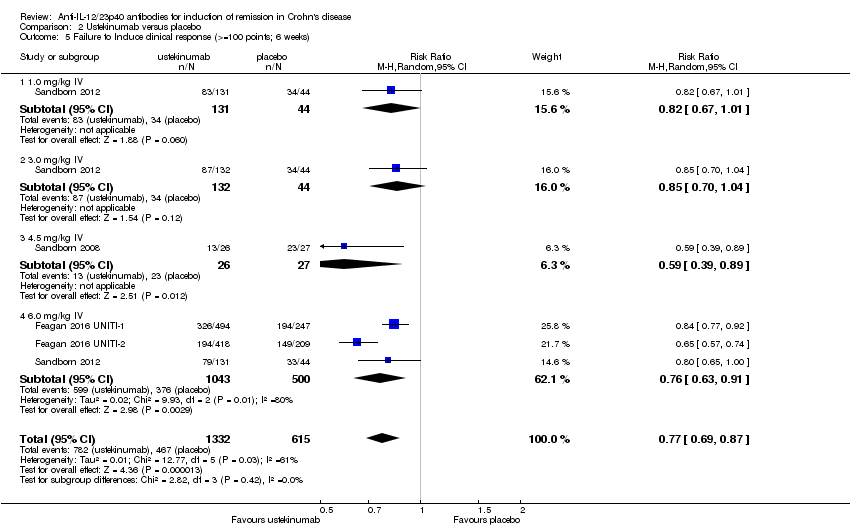
Comparison 2 Ustekinumab versus placebo, Outcome 5 Failure to Induce clinical response (>=100 points; 6 weeks).

Comparison 2 Ustekinumab versus placebo, Outcome 6 Failure to Induce clinical response (>=100 points; 6 weeks; sensitivity analysis).

Comparison 2 Ustekinumab versus placebo, Outcome 7 Failure to induce clinical remission ‐ 90 mg, s.c. (6 weeks).

Comparison 2 Ustekinumab versus placebo, Outcome 8 Failure to induce clinical response 90 mg s.c. (>= 70 points; 6 weeks).

Comparison 2 Ustekinumab versus placebo, Outcome 9 Failure to induce clinical response 90 mg s.c. (>=100 points; 6 weeks).

Comparison 2 Ustekinumab versus placebo, Outcome 10 Adverse events.
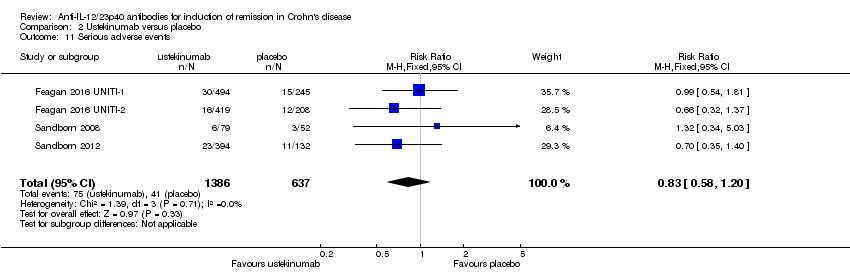
Comparison 2 Ustekinumab versus placebo, Outcome 11 Serious adverse events.

Comparison 2 Ustekinumab versus placebo, Outcome 12 Withdrawals because of adverse events.
| Briakinumab compared to placebo for induction of remission in Crohn's disease | ||||||
| Patient or population: induction of remission in Crohn's disease | ||||||
| Outcomes | Illustrative comparative risks* (95% CI) | Relative effect | No of Participants | Quality of the evidence | Comments | |
| Assumed risk | Corresponding risk | |||||
| placebo | Briakinumab | |||||
| Failure to induce clinical remission (Mannon 2004) | 812 per 10001 | 699 per 1000 | RR 0.86 | 79 | ⊕⊕⊝⊝ | |
| Failure to induce clinical remission (Panaccione 2010) | 913 per 10001 | 840 per 1000 (758 to 940) | RR 0.92 (0.83 to 1.03) | 230 (1 study) | ⊕⊕⊝⊝ | |
| Failure to induce clinical response CDAI ‐ (≥100 point reduction) | 688 per 10001 | 447 per 1000 | RR 0.65 | 79 | ⊕⊕⊝⊝ | |
| Failure to induce clinical response CDAI ‐ (≥100 point reduction) | 783 per 10001 | 642 per 1000 (525 to 775) | RR 0.82 (0.67 to 0.99) | 230 (1 study) | ⊕⊕⊕⊝ | |
| Adverse events (Panaccione 2010) Follow‐up: 12 weeks | 783 per 10001 | 705 per 1000 (587 to 838) | RR 0.90 (0.75 to 1.07) | 230 (1 study) | ⊕⊕⊕⊝ | |
| Serious adverse events (Panaccione 2010) | 87 per 10001 | 45 per 1000 | RR 0.52 | 246 | ⊕⊕⊝⊝ | |
| Withdrawals due to adverse event** (Pannaccione 2010) | 44 per 10001 | 30 per 1000 | RR 0.69 | 246 | ⊕⊕⊝⊝ | |
| *The basis for the assumed risk (e.g. the median control group risk across studies) is provided in footnotes. The corresponding risk (and its 95% confidence interval) is based on the assumed risk in the comparison group and the relative effect of the intervention (and its 95% CI). **Subject numbers are higher than those reported for the efficacy analyses of the individual studies due to the 200 mg, i.v. experimental group discontinuing enrolment during the induction phase due to poor patient enrolment (Panaccione, 2010). These patients were not included in the efficacy analyses, but were included in the safety analyses. | ||||||
| GRADE Working Group grades of evidence | ||||||
| 1 Control group risk estimates come from control arm of meta‐analysis, based on included trials | ||||||
| Ustekinumab compared to placebo for induction of remission in Crohn's disease | ||||||
| Patient or population: patients with induction of remission in Crohn's disease | ||||||
| Outcomes | Illustrative comparative risks* (95% CI) | Relative effect | No of Participants | Quality of the evidence | Comments | |
| Assumed risk | Corresponding risk | |||||
| placebo | Ustekinumab | |||||
| Failure to induce clinical remission | 904 per 10001 | 832 per 1000 | RR 0.92 | 1320 | ⊕⊕⊕⊕ | Sensitivity analysis excluding UNITI‐2 trial. These patients had more severe disease at study entry |
| Failure to induce clinical remission (6 mg/kg subgroup) | 907 per 10001 | 835 per 1000 | RR 0.92 | 916 | ⊕⊕⊕⊝ | |
| Failure to induce clinical response | 783 per 10001 | 642 per 1000 | RR 0.82 | 1320 | ⊕⊕⊕⊕ | Sensitivity analysis excluding UNITI‐2 trial. These patients had more severe disease at study entry |
| Failure to induce clinical response (6 mg/kg subgroup) | 780 per 10001 | 647 per 1000 | RR 0.83 | 916 | ⊕⊕⊕⊕ | |
| Adverse events Follow‐up: 8 weeks | 639 per 10001 | 620 per 1000 | RR 0.97 | 2023 | ⊕⊕⊕⊕ | |
| Serious adverse events | 64 per 10001 | 53 per 1000 | RR 0.83 | 2023 | ⊕⊕⊕⊝ | |
| Withdrawals due to adverse event | 54 per 10001 | 24 per 1000 | RR 0.44 | 657 | ⊕⊕⊝⊝ | |
| *The basis for the assumed risk (e.g. the median control group risk across studies) is provided in footnotes. The corresponding risk (and its 95% confidence interval) is based on the assumed risk in the comparison group and the relative effect of the intervention (and its 95% CI). **Subject numbers are higher than those reported for the efficacy analyses of the individual studies due to the omission of efficacy results for subjects receiving subcutaneous placebo and 90 mg ustekinumab, as well as subjects receiving 90mg s.c. and 4.5 mg/kg of ustekinumab in the open‐label arm of the study by Sandborn (2008). The results of these subjects were included in the safety analyses. | ||||||
| GRADE Working Group grades of evidence | ||||||
| 1 Control group risk estimates come from control arm of meta‐analysis, based on included trials | ||||||
| Outcome | Fixed Effects Modelling | Random Effects Modelling |
| Briakinumab /Remission (Mannon 2004) | RR 0.86 [0.65, 1.14] | RR 0.88 [0.68, 1.15] |
| Briakinumab /Remission (Panaccione 2015) | RR 1.05 [0.90, 1.22] | RR 0.92 [0.83, 1.03] |
| Ustekinumab /Remission | RR 0.94 [0.88, 1.01] | RR 0.95 [0.89, 1.02] |
| Briakinumab /Response (Mannon 2004) | RR 0.65 [0.42, 0.99] | RR 0.66 [0.44, 1.01] |
| Briakinumab /Response (Panaccione 2015) | RR 0.82 [0,67, 0.99] | RR 0.81 [0.67, 0.99] |
| Ustekinumab /Response | RR 0.79 [0.71, 0.89] | RR 0.80 [0.72, 0.90] |
| Outcome or subgroup title | No. of studies | No. of participants | Statistical method | Effect size |
| 1 Failure to induce clinical remission (7 & 9 weeks) Show forest plot | 1 | 79 | Risk Ratio (M‐H, Fixed, 95% CI) | 0.86 [0.65, 1.14] |
| 1.1 1 mg/kg body weight each week | 1 | 39 | Risk Ratio (M‐H, Fixed, 95% CI) | 0.92 [0.67, 1.26] |
| 1.2 3 mg/kg body weight each week | 1 | 40 | Risk Ratio (M‐H, Fixed, 95% CI) | 0.79 [0.48, 1.30] |
| 2 Failure to Induce clinical remission (6 weeks) Show forest plot | 1 | 230 | Risk Ratio (M‐H, Fixed, 95% CI) | 0.92 [0.83, 1.03] |
| 2.1 IV Infusion of 400 mg | 1 | 68 | Risk Ratio (M‐H, Fixed, 95% CI) | 0.95 [0.80, 1.13] |
| 2.2 IV Infusion of 700 mg | 1 | 162 | Risk Ratio (M‐H, Fixed, 95% CI) | 0.91 [0.78, 1.05] |
| 3 Failure to induce clinical response (>= 100 points; 7 & 9 weeks) Show forest plot | 1 | 79 | Risk Ratio (M‐H, Fixed, 95% CI) | 0.65 [0.42, 0.99] |
| 3.1 1 mg/kg body weight each week | 1 | 39 | Risk Ratio (M‐H, Fixed, 95% CI) | 0.73 [0.44, 1.22] |
| 3.2 3 mg/kg body weight each week | 1 | 40 | Risk Ratio (M‐H, Fixed, 95% CI) | 0.55 [0.27, 1.13] |
| 4 Failure to induce clinical response (>= 100 points; 6 weeks) Show forest plot | 1 | 230 | Risk Ratio (M‐H, Fixed, 95% CI) | 0.82 [0.67, 0.99] |
| 4.1 400 mg iv of briakinumab | 1 | 68 | Risk Ratio (M‐H, Fixed, 95% CI) | 0.82 [0.61, 1.12] |
| 4.2 700 mg iv of briakinumab | 1 | 162 | Risk Ratio (M‐H, Fixed, 95% CI) | 0.81 [0.63, 1.04] |
| 5 Adverse events Show forest plot | 1 | Risk Ratio (M‐H, Fixed, 95% CI) | Totals not selected | |
| 6 Serious adverse events Show forest plot | 2 | Risk Ratio (M‐H, Fixed, 95% CI) | Totals not selected | |
| 7 Withdrawals because of adverse events Show forest plot | 2 | Risk Ratio (M‐H, Fixed, 95% CI) | Totals not selected | |
| Outcome or subgroup title | No. of studies | No. of participants | Statistical method | Effect size |
| 1 Failure to induce clinical remission (6 weeks) Show forest plot | 4 | 1947 | Risk Ratio (M‐H, Random, 95% CI) | 0.91 [0.86, 0.95] |
| 1.1 1.0 mg/kg IV | 1 | 175 | Risk Ratio (M‐H, Random, 95% CI) | 0.92 [0.82, 1.04] |
| 1.2 3.0 mg/kg IV | 1 | 176 | Risk Ratio (M‐H, Random, 95% CI) | 0.95 [0.83, 1.08] |
| 1.3 4.5 mg/kg IV | 1 | 53 | Risk Ratio (M‐H, Random, 95% CI) | 0.87 [0.67, 1.11] |
| 1.4 6.0 mg/kg IV | 3 | 1543 | Risk Ratio (M‐H, Random, 95% CI) | 0.90 [0.82, 0.98] |
| 2 Failure to induce clinical remission (6 weeks; sensitivity analysis) Show forest plot | 3 | 1320 | Risk Ratio (M‐H, Fixed, 95% CI) | 0.92 [0.88, 0.96] |
| 2.1 1.0 mg/kg IV | 1 | 175 | Risk Ratio (M‐H, Fixed, 95% CI) | 0.92 [0.82, 1.04] |
| 2.2 3.0 mg/kg IV | 1 | 176 | Risk Ratio (M‐H, Fixed, 95% CI) | 0.95 [0.83, 1.08] |
| 2.3 4.5 mg/kg IV | 1 | 53 | Risk Ratio (M‐H, Fixed, 95% CI) | 0.87 [0.67, 1.11] |
| 2.4 6.0 mg/kg IV | 2 | 916 | Risk Ratio (M‐H, Fixed, 95% CI) | 0.92 [0.87, 0.97] |
| 3 Failure to induce clinical response (>= 70 points; 6 weeks) Show forest plot | 4 | 1947 | Risk Ratio (M‐H, Random, 95% CI) | 0.73 [0.66, 0.81] |
| 3.1 1 mg/kg IV | 1 | 175 | Risk Ratio (M‐H, Random, 95% CI) | 0.78 [0.61, 0.98] |
| 3.2 3 mg/kg IV | 1 | 176 | Risk Ratio (M‐H, Random, 95% CI) | 0.81 [0.63, 1.03] |
| 3.3 4.5 mg/kg IV | 1 | 53 | Risk Ratio (M‐H, Random, 95% CI) | 0.59 [0.37, 0.94] |
| 3.4 6 mg/kg IV | 3 | 1543 | Risk Ratio (M‐H, Random, 95% CI) | 0.72 [0.61, 0.85] |
| 4 Failure to induce clinical response (>= 70 points; 6 weeks; sensitivity analysis) Show forest plot | 3 | 1320 | Risk Ratio (M‐H, Fixed, 95% CI) | 0.78 [0.71, 0.85] |
| 4.1 1 mg/kg IV | 1 | 175 | Risk Ratio (M‐H, Fixed, 95% CI) | 0.78 [0.61, 0.98] |
| 4.2 3 mg/kg IV | 1 | 176 | Risk Ratio (M‐H, Fixed, 95% CI) | 0.81 [0.63, 1.03] |
| 4.3 4.5 mg/kg IV | 1 | 53 | Risk Ratio (M‐H, Fixed, 95% CI) | 0.59 [0.37, 0.94] |
| 4.4 6 mg/kg IV | 2 | 916 | Risk Ratio (M‐H, Fixed, 95% CI) | 0.78 [0.71, 0.87] |
| 5 Failure to Induce clinical response (>=100 points; 6 weeks) Show forest plot | 4 | 1947 | Risk Ratio (M‐H, Random, 95% CI) | 0.77 [0.69, 0.87] |
| 5.1 1.0 mg/kg IV | 1 | 175 | Risk Ratio (M‐H, Random, 95% CI) | 0.82 [0.67, 1.01] |
| 5.2 3.0 mg/kg IV | 1 | 176 | Risk Ratio (M‐H, Random, 95% CI) | 0.85 [0.70, 1.04] |
| 5.3 4.5 mg/kg IV | 1 | 53 | Risk Ratio (M‐H, Random, 95% CI) | 0.59 [0.39, 0.89] |
| 5.4 6.0 mg/kg IV | 3 | 1543 | Risk Ratio (M‐H, Random, 95% CI) | 0.76 [0.63, 0.91] |
| 6 Failure to Induce clinical response (>=100 points; 6 weeks; sensitivity analysis) Show forest plot | 3 | 1320 | Risk Ratio (M‐H, Fixed, 95% CI) | 0.82 [0.77, 0.88] |
| 6.1 1.0 mg/kg IV | 1 | 175 | Risk Ratio (M‐H, Fixed, 95% CI) | 0.82 [0.67, 1.01] |
| 6.2 3.0 mg/kg IV | 1 | 176 | Risk Ratio (M‐H, Fixed, 95% CI) | 0.85 [0.70, 1.04] |
| 6.3 4.5 mg/kg IV | 1 | 53 | Risk Ratio (M‐H, Fixed, 95% CI) | 0.59 [0.39, 0.89] |
| 6.4 6.0 mg/kg IV | 2 | 916 | Risk Ratio (M‐H, Fixed, 95% CI) | 0.83 [0.77, 0.91] |
| 7 Failure to induce clinical remission ‐ 90 mg, s.c. (6 weeks) Show forest plot | 1 | Risk Ratio (M‐H, Fixed, 95% CI) | Totals not selected | |
| 8 Failure to induce clinical response 90 mg s.c. (>= 70 points; 6 weeks) Show forest plot | 1 | Risk Ratio (M‐H, Fixed, 95% CI) | Totals not selected | |
| 9 Failure to induce clinical response 90 mg s.c. (>=100 points; 6 weeks) Show forest plot | 1 | Risk Ratio (M‐H, Fixed, 95% CI) | Totals not selected | |
| 10 Adverse events Show forest plot | 4 | 2023 | Risk Ratio (M‐H, Fixed, 95% CI) | 0.97 [0.90, 1.04] |
| 11 Serious adverse events Show forest plot | 4 | 2023 | Risk Ratio (M‐H, Fixed, 95% CI) | 0.83 [0.58, 1.20] |
| 12 Withdrawals because of adverse events Show forest plot | 2 | 657 | Risk Ratio (M‐H, Fixed, 95% CI) | 0.44 [0.18, 1.05] |