مداخلات حرفهای برای پزشکان عمومی به منظور مدیریت بالینی بیماریهای عضلانیاسکلتی
چکیده
پیشینه
بیماریهای عضلانیاسکلتی نیاز به مهارتهای مدیریتی ویژهای دارند. شناسایی مداخلاتی که در تجهیز پزشکان عمومی (general practitioner; GP) به این مهارتهای ضروری موثر باشند، میتواند منجر به بهبود پیامد سلامت برای بیماران و کاهش هزینههای اجتماعی و مراقبتهای سلامت شود.
اهداف
تعیین اثربخشی مداخلات حرفهای برای GP با هدف بهبود مدیریت بیماریهای عضلانیاسکلتی در سطح مراقبتهای اولیه.
روشهای جستوجو
پایگاه مرکزی ثبت کارآزماییهای کنترل شده کاکرین (CENTRAL)، شماره 2، 2010؛ MEDLINE, Ovid (1950 تا اکتبر 2013)؛ EMBASE, Ovid (1980 تا اکتبر 2013)؛ CINAHL, EbscoHost (1980 تا نوامبر 2013) و مرکز ثبت تخصصی EPOC را جستوجو کردیم. با استفاده از ISI Web of Knowledge و Google Scholar، منابع مورد استناد را جستوجو کرده، و همچنین برخی شمارههای Arthritis and Rheumatism و Primary Care‐Clinics in Office Practice را به صورت دستی جستوجو کردیم. آخرین جستوجو در نوامبر 2013 انجام شد.
معیارهای انتخاب
کارآزماییهای تصادفیسازی و کنترل شده (randomised controlled trials; RCTs)، کارآزماییهای غیر تصادفیسازی شده و کنترل شده (NRCTs)، مطالعات کنترل شده قبل‐و‐بعد (before‐and‐after; CBAs) و سریهای زمانی منقطع شده (interrupted time series) را مربوط به مداخلات حرفهای برای GP وارد کردیم، که در سطح جامعه، به منظور بهبود مدیریت درمانی (شامل تشخیص و درمان) بیماریهای عضلانیاسکلتی و ارائه گزارش از هرگونه معیار عینی از رفتار GP، بیمار یا پیامدهای اقتصادی، انجام شدند. مداخلات حرفهای را با هر طول دوره، مدت، شدت و پیچیدگی، در مقایسه با کنترلهای فعال یا غیر فعال در نظر گرفتیم.
گردآوری و تجزیهوتحلیل دادهها
دو نویسنده مرور بهطور مستقل از هم تمام دادهها را استخراج کردند. تفاوت خطر (risk difference) و خطر نسبی (RR) را از انطباق با عملکرد مطلوب برای پیامدهای دو حالتی (dichotomous outcome)، و تفاوت میانگین (MD) و تفاوت میانگین استاندارد شده (SMD) را برای پیامدهای پیوسته (continuous outcome) محاسبه کردیم. ما بررسی کردیم که جهت تغییر هدفمند رفتاری بر اثربخشی مداخلات تاثیر میگذارد یا خیر.
نتایج اصلی
سی مطالعه دارای معیارهای ورود به مطالعه بودند.
از 11 مطالعه درباره استئوپوروز، متاآنالیز پنج مطالعه (شواهد با قطعیت بالا) نشان داد که ترکیب سیستم هشدار GP نسبت به افزایش خطر ابتلا به استئوپوروز در بیمار و مداخله بیمار‐محور (شامل آموزش بیمار و فرستادن یک یادآور برای ملاقات با GP)، رفتار GP را از نظر آزمایشهای تشخیصی تراکم مواد معدنی استخوان (BMD) و تجویز داروهای استئوپوروز بهبود میبخشد (RR: 4.44؛ 95% فاصله اطمینان (CI)؛ 3.54 تا 5.55؛ 3 مطالعه؛ 3,386 شرکتکننده، برای BMD، و RR: 1.71؛ 95% CI؛ 1.50 تا 1.94؛ 5 مطالعه؛ 4,223 شرکتکننده، برای تجویز داروهای استئوپوروز). متاآنالیز دو مطالعه نشان داد که آگاه کردن GP بهنوبهخود نیز احتمالا رفتار GP را در سازگار شدن با گایدلاینهای درمان استئوپوروز بهبود میدهد (RR: 4.75؛ 95% CI؛ 3.62 تا 6.24؛ 3,047 شرکتکننده برای BMD، و RR؛ 1.52؛ 95% CI؛ 1.26 تا 1.84؛ 3,047 شرکتکننده، برای تجویز داروهای استئوپوروز). این امر با افزودن بخشهای بیمار‐محور احتمالا منجر به تاثیر بیشتر مداخله نمیشود (RR: 0.94؛ 95% CI؛ 0.81 تا 1.09؛ 2,995 شرکتکننده، برای BMD، و RR؛ 0.93؛ 95% CI؛ 0.79 تا 1.10؛ 2,995 شرکتکننده برای تجویز داروهای استئوپوروز).
از 10 مطالعه پیرامون کمردرد، هفت مورد نشان دادند که انتشار گایدلاین و ایجاد فرصتهای آموزشی برای GP ممکن است منجر به بهبودی اندک یا عدم بهبودی در سازگاری رفتار GP در استفاده از گایدلاینها شود. دو مطالعه نشان دادند که ترکیبی از گایدلاینها و بازخورد GP بر تعداد کل بررسیهای درخواست شده میتواند بر رفتار GP تاثیر داشته باشد و باعث کاهش اندک در تعداد تستها شود، در حالی که یکی از این مطالعات نشان داد ترکیبی از گایدلاینها و یادآورهای GP متصل به گزارشهای رادیولوژی ممکن است منجر به کاهش کم اما پایدار در تعداد درخواستهای بررسی شود.
از چهار مطالعه انجام شده درباره استئوآرتریت، یک مطالعه نشان داد که استفاده از پزشکان تاثیرگذار از نظر آموزشی میتواند منجر به بهبود سازگاری رفتار GP در استفاده از گایدلاین شود. مطالعه دیگری نشان دهنده بهبودی جزئی در پیامدهای بیمار (کنترل درد) پس از آموزش GP درباره کنترل درد بود.
از سه مطالعه مربوط به درد شانه، یک مطالعه گزارش داد که ممکن است بهبودی اندک یا عدم بهبودی در پیامدهای بیمار (ظرفیت عملکردی) پس از آموزش GP درباره درد شانه و آموزش تزریق حاصل شود.
از دو مطالعه در مورد دیگر بیماریهای عضلانیاسکلتی، یک مطالعه پیرامون مدیریت درد نشان داد که امکان دارد پیامدهای بیمار (کنترل درد) پس از آموزش GP برای استفاده از مقیاسهای معتبر سنجش، بدتر شود.
نتایج 12 مطالعه باقیمانده از همه بیماریهای عضلانیاسکلتی حاکی از بهبودی اندک یا عدم بهبودی در رفتار GP و پیامدهای بیمار بودند.
به نظر نمیرسد جهت رفتار هدفمند (یعنی افزایش یا کاهش یک رفتار) بر اثربخشی مداخله تاثیر بگذارد. اکثر مطالعات عوارض جانبی بالقوه مداخلات را بررسی نکرده و فقط سه مطالعه شامل تجزیهوتحلیل هزینه‐اثربخشی مداخله بودند.
بهطور کلی، محدودیتهای روششناسی (methodology) مهمی در مجموعه شواهد وجود داشتند. فقط یک سوم از مطالعات، پنهانسازی تخصیص (allocation concealment) و ارزیابی کورسازی شده پیامد را به میزان کافی گزارش کردند. در حالی که اعتماد ما به تخمین اثرگذاری تجمعی مداخلات برای بهبود تستهای تشخیصی و تجویز دارو در استئوپوروز بالا است، اعتماد ما به تخمین اثرگذاری گزارش شده در مطالعات باقیمانده پائین است.
نتیجهگیریهای نویسندگان
شواهدی با کیفیت خوب وجود دارند که اعمال یک سیستم یادآور برای GP با یا بدون آموزش بیمار‐محور درباره استئوپوروز، سازگاری رفتار GP را برای استفاده از گایدلاین بهبود بخشیده و منجر به میزان بالاتر تشخیص و درمان میشود.
در کمردرد، مداخلاتی مانند ارسال پیامهای یادآور برای GP و بازخورد GP درباره عملکرد همراه با انتشار گایدلاین ممکن است به پیشرفتهای اندکی در رفتار سازگار GP در استفاده از گایدلاین منجر شود، در حالی که آموزش GP پیرامون درد ناشی از استئوآرتریت و استفاده از پزشکان تاثیرگذار از لحاظ آموزشی میتواند به ترتیب باعث بهبود کمی در نتایج بیمار و رفتار سازگار با گایدلاین شود. با این حال، انجام مطالعات بیشتری نیاز است تا تاثیر چنین مداخلاتی بر بهبود رفتار GP و پیامدهای بیمار مشخص شود.
PICO
خلاصه به زبان ساده
مداخلات حرفهای برای پزشکان عمومی (GP) به منظور مدیریت بالینی بیماریهای عضلانیاسکلتی
سی مطالعه دارای معیارهای ورود به مطالعه بودند.
یازده مطالعه، مداخلات را با هدف بهبود مدیریت استئوپوروز توسط GP بررسی کردند. پنج مورد از این مطالعات به اندازه کافی مشابه بودند که قادر به ترکیب نتایج آنها باشیم. یافتههای ما نشان میدهند که آگاه کردن GP درباره در معرض خطر استئوپوروز بودن یک بیمار و آموزش بیمار، که به آنها یادآوری کند به ملاقات GP خود بروند، منجر به بهبود رفتار GP (آزمون تشخیصی و تجویز دارو) میشوند. ما مشخص کردیم که کیفیت یا قطعیت شواهد مطالعات در سطح بالا است، بنابراین به این نتایج اطمینان داریم. با توجه به نتایج دو مطالعه، آگاهی GP بهنوبهخود، احتمالا موثر است و اضافه کردن بخش بیمار‐محور احتمالا منجر به تاثیر بیشتر مداخله نمیشود.
از ده مطالعه انجام شده درباره کمردرد، هفت مطالعه نشان دادند که آموزش GP و انتشار گایدلاینها ممکن است باعث پیشرفت اندک یا عدم پیشرفت در رفتار بالینی GP شوند. دو مطالعه نشان دادند که تهیه گایدلاینها و اطلاعات درباره تعداد کل تستهای درخواستی آنان، میتواند رفتار GP را تحت تاثیر قرار دهد (و منجر به کاهش اندک تعداد تستها شود). یک مطالعه نشان داد که استفاده از ترکیبی از گایدلاینها و یادآورهای GP متصل به گزارشهای تستها ممکن است باعث کاهش اندک اما پایدار در تعداد تستهای درخواستی شود.
از چهار مطالعه درباره استئوآرتریت، یک مورد نشان داد هنگامی که GP حرفهای برای آموزش به همکاران خود استخدام شد، ممکن است رفتار GP بهبود یابد. مطالعه دوم نشان دهنده بهبود جزئی در پیامدهای بیمار (کنترل درد) پس از آموزش GP درباره کنترل درد بود.
از سه مطالعه پیرامون درد شانه، یک مطالعه نشان داد که ممکن است بهبودی اندک یا عدم بهبودی در پیامدهای بیمار (ظرفیت عملکردی) پس از آموزش GP درباره درد شانه و تمرین تزریق رخ دهد.
از دو مطالعه در مورد دیگر بیماریهای عضلانیاسکلتی، یک مطالعه پیرامون مدیریت درد نشان دهنده بدتر شدن پیامدهای بیمار (کنترل درد) پس از آموزش GP برای استفاده از ابزارهای اندازهگیری درد بود.
نتایج 12 مطالعه باقیمانده از همه بیماریهای عضلانیاسکلتی حاکی از بهبودی اندک یا عدم بهبودی در رفتار GP و پیامدهای بیمار بودند. اکثر مطالعات عوارض جانبی بالقوه مداخلات را بررسی نکرده و فقط سه مطالعه شامل تجزیهوتحلیل هزینه‐اثربخشی مداخله بودند.
به نظر نمیرسد جهت رفتار هدفمند (یعنی افزایش یا کاهش یک رفتار) بر اثربخشی مداخله تاثیر بگذارد.
سطح قطعیت شواهد مطالعاتی که اثربخشی مداخلات را به منظور بهبود مدیریت استئوپوروز توسط GP بررسی کردند، بالا بود، بنابراین به این یافتهها اعتماد داریم. محدودیتهای مهمی در مورد نحوه انجام یا گزارشدهی بسیاری از مطالعات باقیمانده وجود دارد، و ما کمتر از تاثیرات احتمالی این مداخلات به منظور بهبود مدیریت بیماریهای عضلانیاسکلتی مطمئن هستیم.
Authors' conclusions
Summary of findings
| Primary care physician alerting system and a patient‐directed intervention (education and reminder to see their primary care physician) compared to usual care for osteoporosis management | ||||||
| Patient or population: General practitioners/family doctors involved in the management of patients with osteoporosis | ||||||
| Outcomes | Illustrative comparative risks* (95% CI) | Relative effect | No of Participants | Certainty of the evidence | Comments | |
| Assumed risk | Corresponding risk | |||||
| Usual care | A physician alerting system and a patient‐directed intervention (education and reminder to see their primary care physician) | |||||
| Bone Mineral Density 1 | Study population | RR 4.44 | 3386 | ⊕⊕⊕⊕ | ||
| 49 per 1000 | 220 per 1000 | |||||
| Moderate | ||||||
| 39 per 1000 | 176 per 1000 | |||||
| Osteoporosis medication 2 | Study population | RR 1.71 | 4223 | ⊕⊕⊕⊕ | ||
| 131 per 1000 | 241 per 1000 3 | |||||
| Moderate | ||||||
| 106 per 1000 | 195 per 1000 3 | |||||
| *The basis for the assumed risk (e.g. the median control group risk across studies) is provided in footnotes. The corresponding risk (and its 95% confidence interval) is based on the assumed risk in the comparison group and the relative effect of the intervention (and its 95% CI). | ||||||
| GRADE Working Group grades of evidence | ||||||
| 1 Bone mineral density (BMD) testing is an important outcome for osteoporosis because it leads to the diagnosis of the condition. This is one of the GP behaviour‐related outcomes (primary outcome) 2 Osteoporosis medication prescribing is an important outcome for osteoporosis management as it is the main aspect of treatment. This is one of the GP behaviour‐related outcomes (primary outcome) 3 One of the five studies (Roux 2013) had two intervention comparison groups which were combined to create a single pair‐wise comparison as recommended in chapter 16.5.4 of the Cochrane Handbook. | ||||||
| Primary care physician alerting system compared to usual care for osteoporosis management | ||||||
| Patient or population: General practitioners/family doctors involved in the management of patients with osteoporosis | ||||||
| Outcomes | Illustrative comparative risks* (95% CI) | Relative effect | No of Participants | Certainty of the evidence | Comments | |
| Assumed risk | Corresponding risk | |||||
| Usual care | Primary care physician alerting system | |||||
| Bone mineral density1 | Study population | RR 4.75 | 3047 | ⊕⊕⊕⊖ | ||
| 38 per 1000 | 302 per 1000 | |||||
| Moderate | ||||||
| 29 per 1000 | 231 per 1000 | |||||
| Osteoporosis medication2 | Study population | RR 1.52 | 3047 | ⊕⊕⊕⊖ | ||
| 102 per 1000 | 268 per 1000 | |||||
| Moderate | ||||||
| 77 per 1000 | 202 per 1000 | |||||
| *The basis for the assumed risk (e.g. the median control group risk across studies) is provided in footnotes. The corresponding risk (and its 95% confidence interval) is based on the assumed risk in the comparison group and the relative effect of the intervention (and its 95% CI). | ||||||
| GRADE Working Group grades of evidence | ||||||
| 1 Bone mineral density (BMD) testing is an important outcome for osteoporosis because it leads to the diagnosis of the condition. This is one of the GP behaviour‐related outcomes (primary outcome) 2 Osteoporosis medication prescribing is an important outcome for osteoporosis management as it is the main aspect of treatment. This is one of the GP behaviour‐related outcomes (primary outcome) 3 The quality of evidence was downgraded because only two studies were included, one of which had a small number of participants and events, and in view of the considerable statistical heterogeneity observed. | ||||||
| Primary care physician alerting system compared to Primary care physician alerting system and a patient‐directed intervention (education and reminder to see their primary care physician) for osteoporosis management | ||||||
| Patient or population: General practitioners/family doctors involved in the management of patients with osteoporosis | ||||||
| Outcomes | Illustrative comparative risks* (95% CI) | Relative effect | No of Participants | Certainty of the evidence | Comments | |
| Assumed risk | Corresponding risk | |||||
| Primary care physician alerting system and a patient‐directed intervention (education and reminder to see their primary care physician) | Primary care physician alerting system | |||||
| Bone mineral density1 | Study population | RR 0.94 (0.81 to 1.09) | 2995 | ⊕⊕⊕⊖ | ||
| 192 per 1000 | 194 per 1000 | |||||
| Moderate | ||||||
| 254 per 1000 | 257 per 1000 | |||||
| Medication2 Follow‐up: 6‐12 months | Study population | RR 0.93 | 2995 | ⊕⊕⊕⊖ moderate3 | ||
| 167 per 1000 | 176 per 1000 | |||||
| Moderate | ||||||
| 182 per 1000 | 191 per 1000 | |||||
| *The basis for the assumed risk (e.g. the median control group risk across studies) is provided in footnotes. The corresponding risk (and its 95% confidence interval) is based on the assumed risk in the comparison group and the relative effect of the intervention (and its 95% CI). | ||||||
| GRADE Working Group grades of evidence | ||||||
| 1 Bone mineral density (BMD) testing is an important outcome for osteoporosis because it leads to the diagnosis of the condition. This is one of the GP behaviour‐related outcomes (primary outcome) 2 Osteoporosis medication prescribing is an important outcome for osteoporosis management as it is the main aspect of treatment. This is one of the GP behaviour‐related outcomes (primary outcome) 3 The quality of evidence was downgraded because only two studies were included, one of which had a small number of participants and events. | ||||||
| Professional interventions for GPs on the management of osteoporosis compared to usual care | ||||
| Patient or population: General practitioners/family doctors involved in the management of patients with osteoporosis Settings: Primary care Intervention: Professional interventions (targeting physician‐only) Comparison: Usual care | ||||
| Outcomes | Impact (including effect sizes wherever available) | Number of Participants | Certainty of the evidence | Comments |
| Health professional (GP) behaviour‐related outcomes
|
|
|
| |
| Patient outcomes
| None of the included studies assessed these outcomes | |||
| Economic outcomes
| Majumdar 2007, assessed the cost effectiveness of the study Majumdar 2008, and concluded that the intervention led to a per patient cost saving of CAD 13 (USD 9) and a gain of 0.012 quality‐adjusted life years. | 272 participants (1 study) | ⊕⊕⊖⊖ low2 | |
| *The basis for the assumed risk (e.g. the median control group risk across studies) is provided in footnotes. The corresponding risk (and its 95% confidence interval) is based on the assumed risk in the comparison group and the relative effect of the intervention (and its 95% CI). | ||||
| GRADE Working Group grades of evidence | ||||
| 1The quality of evidence was downgraded because only two studies were included, one of which had a small number of participants and events, and in view of the considerable statistical heterogeneity observed. 2 The quality of evidence was downgraded because only one study was included which had some risk of bias. | ||||
| Professional interventions for GPs on the management of low back pain compared to usual care | ||||
| Patient or population: General practitioners/family doctors involved in the management of patients with low back pain Settings: Primary care Intervention: Professional interventions (targeting physician‐only) Comparison: Usual care | ||||
| Outcomes | Impact (including effect sizes wherever available) | No of studies | Certainty of the evidence | Comments |
| H ealth professional (GP) behaviour‐related outcomes | ||||
| Guideline‐consistent advice during consultation | Bishop 2006 showed that the intervention may result in little or no improvements (RD < 10%) with regard to guideline‐consistent advice about exercise, return to work and education and reassurance. Dey 2004 showed that the intervention probably results in a small reduction of sickness certification (RD 1.3). Engers 2005 showed that the intervention may lead to no improvement of GP behaviour with regards to patient education and advice during the consultation (RD range (‐1.3 to 12.8), authors reported OR ranging between 0.4 and 2.9). | 3 | ⊕⊕⊖⊖ low1 | |
| Guideline‐consistent prescribing of medication | Bishop 2006 showed that the intervention may lead to little improvements (RD < 10%) with regards to guideline‐consistent medication prescribing. Dey 2004 showed that the intervention probably results in no difference on prescribing rates of opioids (RD ‐1.3). Engers 2005 showed that the intervention may result in no improvement of GP behaviour with regard to prescribing (RD=2.8, OR=1, 95% CI (0.3 to 3), reported as not statistically significant). | 3 | ⊕⊕⊖⊖ low1 | |
| Guideline‐consistent referrals for investigations (e.g.. x‐rays) | Schectman 2003 showed that the intervention may result in little or no change in GP behaviour with regards to the number of guideline‐consistent referrals for lumbar spine x‐rays and CT scans (RD <5%). | 1 | ⊕⊕⊖⊖ low2 | |
| Guideline‐consistent referrals to other services | Bishop 2006 showed that the intervention may lead to little or no improvements (RD < 5%) with regards to guideline‐consistent referral to other services (such as physiotherapy). Schectman 2003 showed that the intervention may result in little or no difference with regards to the number of guideline‐consistent specialist or physiotherapy referrals (RD <5%). | 2 | ⊕⊕⊖⊖ low3 | |
| Number of investigations | Dey 2004 showed that the intervention probably results in a small increase in the ordering of x‐rays (RD 1.4). French 2013 showed that the intervention may lead to little or no difference in the number of x‐ray and CT requests (RD ‐0.2% and 0.0% respectively). Kerry 2000 showed that the intervention probably results in a cluster‐adjusted reduction of spinal x‐ray requests of 20% between the intervention and control groups (95% CI 4 to 36, P<0.05). Schectman 2003 showed that the intervention may result in little or no change in GP behaviour with regards to referrals for lumbar spine x‐rays and CT scans (RD <5%). | 4 | ⊕⊕⊖⊖low4 | |
| Number of referrals to other services | Dey 2004 showed that the intervention probably results in increased referrals to fast‐track physiotherapy and a back‐pain triage service (RD 12.6%). Engers 2005 showed that the intervention may lead to little reduction of onward referrals to a therapist (RD 4.6, 23% in the intervention group versus 28% in the control group, clustered adjusted OR 0.8, 95% CI (0.5 to 1.4)). Schectman 2003 showed that the intervention may result in little or no difference with regards to the number of specialist or physiotherapy referrals (RD <5%). | 3 | ⊕⊕⊖⊖ low4 | |
| Patient outcomes | ||||
| Functional capacity/activity scores | 0 | None of the included studies assessed this outcome | ||
| Pain control | 0 | None of the included studies assessed this outcome | ||
| Work absence | Hazard 1997 showed that the intervention may result in no improvement with respect to days of sick leave compared to the control group (RD ‐4.6%). | 1 | ⊕⊕⊖⊖ low2 | The study by Hazard 1997 was very small (just 53 participants) |
| Quality of life | 0 | None of the included studies assessed this outcome | ||
| Economic outcomes
| 0 | None of the included studies assessed these outcomes | ||
| *The basis for the assumed risk (e.g. the median control group risk across studies) is provided in footnotes. The corresponding risk (and its 95% confidence interval) is based on the assumed risk in the comparison group and the relative effect of the intervention (and its 95% CI). | ||||
| GRADE Working Group grades of evidence | ||||
| 1 The quality of evidence was downgraded because the studies have a high risk of bias and high heterogeneity in terms of the types of interventions evaluated. Additionally the effect sizes are small. 2 The quality of evidence was downgraded because the results are based only on one study with high risk of bias. 3 The quality of evidence was downgraded because the results are based on just two studies with high risk of bias. 4 The quality of evidence was downgraded because the studies have a high risk of bias and high heterogeneity in terms of the types of interventions evaluated. Additionally there is high inconsistency in the direction of effects across the studies. | ||||
| Professional interventions for GPs on the management of osteoarthritis compared to usual care | ||||
| Patient or population: General practitioners/family doctors involved in the management of patients with osteoarthritis Settings: Primary care Intervention: Professional interventions (targeting physician‐only) Comparison: Usual care | ||||
| Outcomes | Impact (including effect sizes wherever available) | No of studies | Certainty of the evidence | Comments |
| Health professional (GP) behaviour‐related outcomes | ||||
| Guideline‐consistent advice during consultation | Stross 1985 showed that the intervention may increase the use of intra‐articular corticosteroids (RD large at 29%). | ⊕⊕⊖⊖ low1 | ||
| Guideline‐consistent prescribing of medication | Rahme 2005 showed that the intervention may result in a slight improvement in osteoarthritis guideline‐consistent GP prescribing of medication (acetaminophen, NSAIDs and COX‐2 inhibitors) 5 months afterwards (RD 5% after dissemination of educational material, RD 7% after a workshop and RD 13% for the combined intervention) Rosemann 2007 showed that prescriptions for painkillers may slightly increase following the intervention (RDs between ‐2.2% and 11.1%). Stross 1985 showed that the intervention may reduce the use of systemic corticosteroids according to the guidelines (RD moderate at 19%). | ⊕⊕⊖⊖ low1 | ||
| Guideline‐consistent referrals for investigations (e.g.. x‐rays) | None of the included studies assessed this outcome | |||
| Guideline‐consistent referrals to other services | Stross 1985 showed that the intervention may increase the utilisation of physical therapy pre‐operatively (RD large at 57%). | ⊕⊕⊖⊖ low1 | ||
| Number of investigations | Rosemann 2007 showed that the intervention may result in some small reduction in the number of GP referrals for radiographs (SMD 0.2‐0.4). | ⊕⊕⊖⊖low3 | ||
| Number of referrals to other services | Rosemann 2007 showed that the intervention may result in a reduction in the number of GP referrals to orthopaedics (SMD 0.8 for the educational intervention and 0.2 for the combined intervention after adding nurse case management). | ⊕⊕⊖⊖ low4 | ||
| Patient outcomes | ||||
| Functional capacity/activity scores | Chassany 2006 showed that the intervention may result in small improvements with regard to physical function scores (WOMAC index physical function score) (SMD 0.3, P<0.05). | ⊕⊕⊖⊖ low5 | Results were assessed within two weeks of the Chassany 2006 trial, so it is unclear whether the positive patient outcomes persisted. | |
| Pain control | Chassany 2006 showed that the intervention may result in small improvements with regard to pain scores (VAS score, Pain relief (SPID), WOMAC index pain score) (SMD 0.2, P<0.05 across all outcomes). | ⊕⊕⊖⊖ low5 | Results were assessed within two weeks of the Chassany 2006 trial, so it is unclear whether the positive patient outcomes persisted. | |
| Work absence | None of the included studies assessed this outcome | |||
| Quality of life | Rosemann 2007 showed that the intervention may result in small or no improvement with regard to patient related outcomes (SMD <0.40). | ⊕⊕⊖⊖ low3 | ||
| Economic outcomes
| None of the included studies assessed these outcomes | |||
| *The basis for the assumed risk (e.g. the median control group risk across studies) is provided in footnotes. The corresponding risk (and its 95% confidence interval) is based on the assumed risk in the comparison group and the relative effect of the intervention (and its 95% CI). | ||||
| GRADE Working Group grades of evidence | ||||
| 1 The quality of evidence was downgraded because the results are based on one study only with high risk of bias and a small number of participants (114). 2 The quality of evidence was downgraded because the studies have high heterogeneity in terms of the types of interventions and the types of medications prescribed. 3 The quality of evidence was downgraded because the results are based on just one study and the effect size was small. 4 The quality of evidence was downgraded because the results are based on just one study and the effect size varies considerably between the two intervention groups. 5 The quality of evidence was downgraded because the results are based on just one study and were assessed just 2 weeks following the intervention. NSAIDs: Non steroidal anti‐inflammatory drugs, COX‐2 inhibitors: Cyclo‐oxygenase 2 inhibitors, WOMAC: Western Ontario and McMaster Universities Osteoarthritis Index, VAS: Visual analogue scale, SPID: sum of pain intensity differences. | ||||
| Professional interventions for GPs on the management of shoulder pain compared to usual care | ||||
| Patient or population: General practitioners/family doctors involved in the management of patients with shoulder pain Settings: Primary care Intervention: Professional interventions (targeting physician‐only) Comparison: Usual care | ||||
| Outcomes | Impact (including effect sizes wherever available) | Number of studies | Certainty of the evidence | Comments |
| Health professional (GP) behaviour‐related outcomes | ||||
| Guideline‐consistent advice during consultation | None of the included studies assessed this outcome | |||
| Guideline‐consistent prescribing of medication | None of the included studies assessed this outcome | |||
| Guideline‐consistent referrals for investigations (e.g.. x‐rays) | None of the included studies assessed this outcome | |||
| Guideline‐consistent referrals to other services | None of the included studies assessed this outcome | |||
| Number of investigations | Broadhurst 2007 showed that the intervention may result in a temporary, slight reduction in ultrasound requests, but little or no change in the x‐ray requests. | ⊕⊕⊖⊖ low1 | ||
| Number of referrals to other services | None of the included studies assessed this outcome | |||
| Patient outcomes | ||||
| Functional capacity/activity scores | Watson 2008 showed that the intervention may result in little or no improvement in function a year later (BSDQ SMD 0.2, SF‐36 for physical component SMD 0 and SF‐36 mental component SMD 0.1) | ⊕⊕⊖⊖ low2 | ||
| Pain control | None of the included studies assessed this outcome | |||
| Work absence | None of the included studies assessed this outcome | |||
| Quality of life | None of the included studies assessed this outcome | |||
| Economic outcomes
| McKenna 2009 assessed the cost effectiveness of providing practical training to GPs in the SAPPHIRE study by Watson 2008. It reported an incremental cost‐effectiveness ratio of GBP 2,813 per QALY gained for trained GPs. | ⊕⊕⊖⊖ low2 | ||
| *The basis for the assumed risk (e.g. the median control group risk across studies) is provided in footnotes. The corresponding risk (and its 95% confidence interval) is based on the assumed risk in the comparison group and the relative effect of the intervention (and its 95% CI). | ||||
| GRADE Working Group grades of evidence | ||||
| 1 The quality of evidence was downgraded because the results are based on just one study (CBA) with high risk of bias. 2 The quality of evidence was downgraded because the results are based on just one study and the effect size was small. BSDQ: British Shoulder Disability questionnaire, SF‐36: Short‐form 36 item Health Survey, GBP: Great Britain Pound | ||||
| Professional interventions for GPs on the management of shoulder pain compared to usual care | ||||
| Patient or population: General practitioners/family doctors involved in the management of patients with other musculoskeletal conditions Settings: Primary care Intervention: Professional interventions (targeting physician‐only) Comparison: Usual care | ||||
| Outcomes | Impact (including effect sizes wherever available) | No of studies | Certainty of the evidence | Comments |
| Health professional (GP) behaviour‐related outcomes | ||||
| Guideline‐consistent advice during consultation | None of the included studies assessed this outcome | |||
| Guideline‐consistent prescribing of medication | Huas 2006 showed that the intervention may result in increased level 3 (WHO classification) analgesic prescribing (SMD 1.2, P=0.02) | ⊕⊕⊖⊖ low1 | ||
| Guideline‐consistent referrals for investigations (e.g.. x‐rays) | None of the included studies assessed this outcome | |||
| Guideline‐consistent referrals to other services | None of the included studies assessed this outcome | |||
| Number of investigations | Kerry 2000 showed that the intervention may result in little or no reduction in GP knee radiology requests (relative change 10%, not statistically significant). | ⊕⊕⊖⊖ low2 | ||
| Number of referrals to other services | None of the included studies assessed this outcome | |||
| Patient outcomes | ||||
| Functional capacity/activity scores | None of the included studies assessed this outcome | |||
| Pain control | Huas 2006 showed that the intervention may result in worse patient‐related outcomes: pain relief scores (SMD 2, P=0.0004) | ⊕⊕⊖⊖ low1 | ||
| Work absence | None of the included studies assessed this outcome | |||
| Quality of life | None of the included studies assessed this outcome | |||
| Economic outcomes
| None of the included studies assessed these outcomes | |||
| *The basis for the assumed risk (e.g. the median control group risk across studies) is provided in footnotes. The corresponding risk (and its 95% confidence interval) is based on the assumed risk in the comparison group and the relative effect of the intervention (and its 95% CI). | ||||
| GRADE Working Group grades of evidence | ||||
| 1 The quality of evidence was downgraded because the results are based on just one study with high risk of bias. 2 The quality of evidence was downgraded because the results are based on just one study and the effect size was small. | ||||
Background
One in six adults (15.6%) suffers from a longstanding condition of the musculoskeletal system (Arthritis Research UK 2011). Between 12 and 20% of general practitioner (GP) consultations are for musculoskeletal problems (Jordan 2007; McCormick 1995; RCGP 1995). Musculoskeletal impairments ranked number one in chronic impairments in the USA (National Center for Health Statistics 1995). Work‐related musculoskeletal disorders were responsible for 11 million days lost from work in 1995 in the United Kingdom (UK) and tended to involve higher percentages of long‐term work loss in the USA when compared with all non‐fatal injuries and illnesses in 2001 (Jones 1998; Worker Health Chartbook 2004). In the Ontario Health Survey musculoskeletal conditions caused 40% of all chronic conditions, 54% of all long‐term disability, and 24% of all restricted activity days (Badley 1994). However, musculoskeletal training has not been part of traditional GP training and has only recently been introduced as part of the new Royal College of General Practitioners curriculum (RCGP Curriculum 2006).
The World Health Organization (WHO) dedicated the years 2000 to 2010 as Bone and Joint Decade. The importance of improving competency in the management of musculoskeletal problems within primary care settings is highlighted by Akesson et al in the Bulletin of the WHO (WHO 2003). Many GPs/family doctors do not have adequate training and consequently lack the competency, skills and confidence to manage musculoskeletal disorders in their daily practice; they may not recognise conditions or be aware of what can be achieved by appropriate care (WHO 2003).
The majority of research on educational interventions for healthcare professionals focuses mainly on improving theoretical knowledge and clinical decision making, with less emphasis on skill acquisition. However, competency in examination and technical skills, such as joint injections, is of paramount importance for appropriate diagnosis and management of musculoskeletal conditions. Technical skills require the use of targeted approaches for effective teaching, learning, and assessment (Ajit 2004). Interventions that may be successful at improving practice in other areas of medicine may therefore not achieve the same results in musculoskeletal medicine.
It is generally accepted that systematic development is needed for quality‐improvement interventions to be effective. Tailoring their content and format to the specific features of a target group and setting seems necessary to improve their effectiveness (Van Bokhoven 2003). Characteristics of the individual provider are important. For example, a programme to increase specific knowledge is likely to have a greater effect on providers with lower baseline knowledge, but paradoxically practitioners are more likely to place greater emphasis on topics of continuing education in which they have traditionally received the greatest amount of training (Forrest 1989). Efforts to tailor interventions to particular provider needs warrant greater attention (Kroenke 2000). Competing demands inherent in the primary care setting (such as limited time, frequent medical comorbidity and somatisation) need to be considered. Failure to recognise these constraints may sabotage interventions (Klinkman 1997). It cannot be assumed that interventions which are effective in changing behaviour and improving management by hospital specialists will also be effective in improving care provided by GPs or family doctors.
The identification of successful professional interventions to improve the management of musculoskeletal conditions by GPs could potentially result in improved health outcomes for patients, reduced healthcare costs and also reduced social costs related to the loss of productivity and earnings. The aim of this systematic review is to identify those professional interventions that improve management, and to quantify their effects.
Objectives
To determine the effectiveness of professional interventions for general practitioners/family doctors that aim to improve the management of musculoskeletal conditions in primary care.
Methods
Criteria for considering studies for this review
Types of studies
We considered randomised controlled trials (RCTs), non‐randomised controlled trials (NRCTs), controlled before‐and‐after studies (CBAs) and interrupted time series (ITS) studies for this review, in accord with the protocol (Tzortziou 2008). We used the eligibility criteria for NRCTs published by the Effective Practice and Organisation of Care (EPOC) Group (EPOC 2013a). According to this guidance, we excluded studies with only one intervention or control site. We included CBA studies with at least two intervention sites and two control sites. We excluded ITS studies that did not have a clearly‐defined point in time when the intervention occurred and at least three data points before and three after the intervention.
Types of participants
We included studies evaluating interventions within a primary care setting, targeting the following types of participants:
-
Individual general practitioners (GPs)/family doctors
-
Groups of GPs/family doctors
-
Multidisciplinary care teams (i.e. groups of healthcare workers of different disciplines) where GPs/family doctors are a substantial part of the team (50% or more)
Types of interventions
Any professional interventions aimed at GPs/family doctors, designed to improve the management of musculoskeletal conditions in the community. Such conditions include neck pain, back pain and other regional pain, possible or known arthritis (including osteoarthritis, rheumatoid arthritis and spondylo‐arthropathies), osteoporosis, musculoskeletal injuries and trauma. We used the term 'management' in its broader definition within general practice, which includes diagnosis, investigations, explanation, advice, prescribing, medical interventions/procedures, referral and prevention.
We considered professional interventions of any length, duration, intensity and complexity compared with active (i.e. different interventions) or inactive (e.g. standard care) controls.
Eligible professional interventions include the following and their combinations (based on the EPOC taxonomy, EPOC 2002):
-
Distribution of educational materials including clinical guidelines
-
Educational meetings
-
Educational outreach visits
-
Patient‐mediated interventions
-
Audit and feedback
-
Computer‐aided decision support
-
Marketing‐focus groups
-
E‐learning/web‐based educational programmes
-
Educational courses with formal examination/assessment (rather than attendance certificate only)
-
Mentoring
-
Training workshops
-
Local consensus processes
-
Local opinion leaders
-
GP reminder
Types of outcome measures
Primary outcomes
Any objective measure (using validated tools wherever available) of health professional behaviour related outcomes, patient or economic outcomes such as:
a) Health professional (GP) behaviour‐related outcomes
These outcomes measure GP behaviour, care provision and adherence to recommended practice or guidelines across all aspects of musculoskeletal management. As mentioned above, the term 'management' is used in its broader definition within general practice, which includes diagnosis, investigations, explanation, advice, prescribing, medical interventions/procedures, referral and prevention. Examples of such outcomes include the following:
-
Rates of diagnosis and diagnostic accuracy
-
Rates of appropriate clinical assessment/examination
-
Use of relevant clinical assessment and shared decision support tools (e.g. pain assessment score tools)
-
Ordering of tests/investigations to confirm a diagnosis or exclude other conditions (e.g. x‐rays, MRIs, bone scans, ultrasound scans, bone mineral density (BMD) scans, blood tests)
-
Prescribing of medication (e.g. non‐steroidal anti‐inflammatory medications for symptomatic pain relief, osteoporosis medication for treatment)
-
Provision of medical interventions/procedures (e.g. minor surgery, joint injections, ultrasound treatment)
-
Referral rates to other services (e.g. physiotherapy, occupational therapy, secondary‐care specialist clinics)
b) Patient outcomes
-
Symptom burden and health status
-
-
Markers of disease control (e.g. pain scores)
-
Symptom days/scores
-
Functional health status (e.g. disability scores)
-
Quality of life, morbidity, mortality
-
School/work days lost
-
-
Patient behaviour and utilisation of health care
-
-
Medication adherence
-
Consultation length
-
Patient repeat visits with same musculoskeletal complaint
-
Emergency Department visits
-
Patient sickness certification
-
Hospitalisations
-
c) Economic outcomes
-
Health service and societal costs
-
Cost effectiveness (for example, incremental cost‐effectiveness ratios (ICERs), incremental cost per quality‐adjusted life year (QALY) and cost‐benefit ratios)
-
Cost utility
Secondary outcomes
-
Patient knowledge or satisfaction
-
GP knowledge, attitude or satisfaction on the management of musculoskeletal conditions
We included measures of GPs' and patients' knowledge, attitudes or satisfaction in this review, as these may provide useful secondary information. However, we excluded studies only reporting knowledge, attitudes or satisfaction (i.e. secondary outcomes) with no objective measure of professional performance, patient health or economic outcomes (i.e. primary outcomes).
Search methods for identification of studies
We searched the Cochrane Database of Systematic Reviews and the Database of Abstracts of Reviews of Effects (DARE) for related systematic reviews, and the electronic databases listed below for primary studies. We designed a sensitive search strategy to retrieve studies from these databases. We applied neither language nor date restrictions. We conducted searches in August 2010 and November 2013; we include the exact search dates for each database with the search strategies in Appendix 1
-
Cochrane Central Register of Controlled Trials (CENTRAL), via EBM Reviews OvidSP (2013)
-
Cochrane Methodology Register, Health Technology Assessment, NHS Economic Evaluation Database, via EBM Reviews OvidSP (2013)
-
MEDLINE via OVID (1946 ‐ October 2013)
-
EMBASE via OVID (1947 ‐ October 2013)
-
CINAHL via EbscoHost (1980 ‐ November 2013)
We used the Cochrane 2013 sensitivity and precision‐maximising filter for retrieving RCTs from MEDLINE (Lefebvre 2011). To retrieve NRCT, CBA and ITS studies, we applied the EPOC Methods Filter 2.6 (developed by the EPOC Trials Search Co‐ordinator (TSC), January 2013 version). The search strategy was devised for the OVID Medline interface and then adapted for the other databases. For other databases, where no filter exists, study designs can only be identified at the screening stage (see Types of studies).
Searching other resources
We also:
-
screened individual journals, e.g. handsearched: Arthritis and Rheumatism (ISSN 1529‐0131) (November 1995 ‐ August 2012), and Primary Care‐Clinics in Office Practice (ISSN 0095‐4543) (March 1996 ‐ June 2012);
-
reviewed reference lists of all included studies, relevant systematic reviews, and primary studies;
-
conducted cited reference searches using ISI Web of Knowledge and Google Scholar for all studies selected for inclusion in this review.
Data collection and analysis
Selection of studies
Two review authors (VTB and NM) independently assessed all titles and abstracts of articles identified by the searches. We obtained the full‐text articles of studies meeting the initial inclusion criteria and for which we could not determine eligibility. Both authors independently read the full text to confirm studies as acceptable or not. A third review author (DM) was available to resolve any disagreements. We list those that initially appeared to meet the inclusion criteria but that we later deemed unsuitable for inclusion, in the Characteristics of excluded studies tables, together with reasons for their exclusion. We documented the number of articles screened, assessed for eligibility, and selected for inclusion in a PRISMA flow diagram.
Data extraction and management
Two review authors (VTB and NM) independently extracted details of study design, population, intervention and control, and outcome data from included articles using a data extraction form based on the EPOC data abstraction form (see EPOC 2013b). For economic outcomes, we designed data extraction forms according to the Cochrane Handbook for Systematic Reviews of Interventions (Cochrane Handbook: Shemilt 2011). We piloted the data extraction form on two included studies to minimise misinterpretation, resolving any disagreement between the review authors regarding study suitability or data extraction by discussion and consensus. If necessary, we consulted a third review author (DM, MU or OW) to resolve disagreements.
Assessment of risk of bias in included studies
We assessed the risk of bias of the included studies in accordance with EPOC and Cochrane guidance (EPOC 2015; Higgins 2011b). We used the Cochrane tool for assessing risk of bias for the included RCTs.The seven domains we addressed were: sequence generation, allocation concealment, blinding of participants, blinding of outcome assessment, incomplete outcome data, selective outcome reporting and "other bias". The seventh domain, "other bias", included a baseline assessment (on whether the groups differed in fundamental ways in terms of baseline characteristics and outcomes) and an assessment of whether there was any protection against contamination. By answering a prespecified question about the adequacy of the study in relation to each of the above domains, we made a judgement indicating low, high or unknown risk of bias. Two review authors (VTB and NM) independently assessed the overall risk of bias for each domain within each study. Review authors were not blinded to study author, institution, or journal, as evidence indicates that little benefit is achieved through blinding (Berlin 1997). We assessed the risk of bias for NRCTs using the suggested risk of bias criteria for EPOC reviews (EPOC 2015). We resolved any disagreement between review authors (VTB and NM) by discussion and consensus.
Measures of treatment effect
We reported outcomes for each study in natural units. Where baseline results were available from RCTs, NRCTs and CBAs, we reported pre‐intervention and post‐intervention means or proportions for both study and control groups.
For studies reporting dichotomous outcomes, we reported the absolute difference (risk difference, RD) calculated as the post‐intervention proportion of outcome in intervention group minus the post‐intervention proportion in the control group. We defined the effect size as 'small' if RD was less than or equal to 5%, 'modest' if greater than 5% but less than or equal to 10%, 'moderate' if greater than 10% but less than or equal to 20%, and 'large' if greater than 20%, according to Grimshaw 2004. We reported the relative percentage difference (absolute difference divided by post‐intervention score in the control group). When baseline levels were available, we calculated the absolute adjusted risk difference (ARD), which adjusts for baseline differences between groups as used by Flodgren 2011 and French 2010. An adjusted risk difference (ARD) is the difference between intervention and control group proportions of compliance after (post) the intervention minus the difference between groups before (pre) the intervention which may be expressed as: Adjusted risk difference (ARD) = (risk of compliance (intervention − control) post‐intervention) − (risk of compliance (intervention − control) pre‐intervention). We also calculated the risk ratio (RR) for all outcomes and included the P values as reported by the study authors. When summarising the results of a study in a summary table, for studies reporting more than one dichotomous outcome in which none was identified as a primary outcome, we reported the effect sizes for all outcomes.
For studies reporting continuous data, we calculated the absolute mean difference between intervention and control groups (MD) and the relative percentage change i.e. the per cent improvement relative to the post‐intervention mean in the control group. We calculated standardised mean differences (SMD) by dividing the difference in mean scores between the intervention and comparison group in each study, by an estimate of the pooled standard deviation according to Smith 2016. We considered the SMD to be small if < 0.40, moderate if 0.40 to 0.70 and large if > 0.70 according to Chapter 12.6.of the Cochrane Handbook (Schünemann 2011). Wherever possible, we also calculated the relative percentage change adjusted for baseline differences in the outcome measures (i.e. the absolute post‐intervention difference between the intervention and control groups minus the absolute pre‐intervention difference between the intervention and control groups, divided by the post‐intervention mean in the control group) according to Analysis in EPOC reviews (EPOC 2013e).
The direction of effect differed between studies, with some studies expecting an increase in outcome (such as an increase in BMD testing for osteoporosis) and others expecting a decrease (such as reduction of x‐ray requests for low back pain) according to the guidelines. In all cases we standardised the effect size, so that a positive RD, ARD, MD or SMD represents a beneficial intervention outcome compared to control, according to Grimshaw 2004.
For the ITS study, we reported the pre‐ and post‐intervention means, their difference, the relative percentage change and the mean change in level and slope.
We used 'Summary of findings' tables for the main comparisons in the review, to interpret the results and draw conclusions about the effects of different interventions, including the size of effects and certainty of the evidence.
Unit of analysis issues
For clustered randomised studies with potential unit of analysis errors, we attempted to re‐calculate the effect sizes using intracluster (or intraclass) correlation coefficient (ICC) wherever possible, according to Chapter 16.3 of the Cochrane Handbook (Higgins 2011a). Where the relevant data was not available to allow the re‐calculation of effect sizes incorporating the effect of clustering, we reported the relevant effect sizes without the confidence intervals and P values and highlighted the potential unit of analysis errors (French 2010, Ukoumunne 1999).
Assessment of heterogeneity
Given the wide scope of the review, we anticipated that many of the included studies would be too heterogeneous in terms of intervention types, musculoskeletal conditions targeted and outcomes measured to undertake meta‐analysis.
We assessed heterogeneity using the Chi² and I² tests, as described by Higgins 2003 and the Cochrane Handbook (Deeks 2011). We pooled results when a minimum of two studies were homogeneous regarding the participants, interventions and outcomes.
Where pooling was not possible, we presented a narrative summary and attempted to organise the studies into groupings or clusters (by musculoskeletal condition, intervention type, and study design) so that it is easier to identify patterns in results, both within and between the groups that were formed. We presented the studies in tabular form, reporting the results descriptively, and made a qualitative assessment of their effects.
Data synthesis
We pooled the results of studies which were homogeneous regarding the interventions and outcomes as mentioned above, and used a fixed‐effect meta‐analysis (Mantel‐Haenszel method) to report risk ratios (RRs) for dichotomous data, in accordance with the Cochrane Handbook (Deeks 2011). We used risk ratios because reporting relative effect measures is, on average, more consistent than absolute measures, and this is in accordance with the Cochrane Handbook (Deeks 2011).
If corrected data, taking into account the unit of analysis errors, were reported for cluster‐randomised trials, we planned to use these data for meta‐analysis. If corrected data were not reported, we intended to estimate corrections if adequate data were available; however, these data were also not reported and were not available after contacting the authors.
We assessed the overall confidence in estimate of effect (certainty of evidence) for each outcome using the GRADE (Grading of Recommendations Assessment, Development and Evaluation) approach which classifies the certainty or confidence of the evidence as high, moderate, low or very low in consideration of five factors: risk of bias or study limitations, directness, consistency of results, precision and publication bias (Guyatt 2008).
Two review authors independently assessed the certainty of evidence; resolving disagreements by discussion. We did not exclude studies on the basis of GRADE ratings; we took into account the certainty of evidence when interpreting the results. For assessments of the overall certainty of evidence for each outcome that included pooled data from RCTs only, we downgraded the evidence from 'high certainty' by one level for serious (or by two for very serious) study limitations (risk of bias), indirectness of evidence, serious inconsistency, imprecision of effect estimates or potential publication bias. Data from observational studies started at 'low certainty'.
Subgroup analysis and investigation of heterogeneity
We summarised the results meaningfully and organised the studies into groupings or clusters to identify patterns in results. Clinically, the main source of heterogeneity amongst studies is the musculoskeletal condition studied, as this can often determine the type of intervention and measured outcomes. For example, certain outcomes (such as BMD scanning or steroid injections) are only applicable in specific musculoskeletal conditions. We therefore reported the results of the included studies grouped by condition, i.e. osteoporosis, osteoarthritis, low back pain, shoulder pain and other musculoskeletal conditions. In each condition group, we divided the evaluations of interventions against 'no intervention' control groups and against a 'different intervention' control group. French 2010 followed the same approach in their review.
The vast majority of the included studies (26/30) focused on single musculoskeletal conditions. Therefore, by grouping the studies by condition, we were able to establish whether within‐study relationships were replicated across similar studies. This boosted our confidence in the findings, as differences in subgroups that are observed within studies are more reliable than analyses of subsets of studies (EPOC 2013c).
The osteoporosis studies which were sufficiently similar for their results to be combined were further divided into those where the intervention targeted just GPs versus those where both GPs and patients were targeted. This allowed an assessment of the effect of adding a patient directed component to interventions targeting a GP in order to establish whether the combined intervention results in improved outcomes.
We also did a subgroup analysis to assess the intended direction of the intervention's effect on the targeted behavioural change (i.e. whether increasing or decreasing an existing behaviour resulted in different effects). These additional aspects of analysis were not part of the protocol and were added post hoc in order to further explore heterogeneity.
Sensitivity analysis
We conducted a sensitivity analysis in order to ensure that the findings of any meta‐analysis are not dependent on arbitrary or unclear methodological decisions, in accordance with the Cochrane Handbook (Deeks 2011). The sensitivity analysis was to reconsider our analysis methods. In our meta‐analysis we planned to use risk ratios as recommended in the Cochrane Handbook (Deeks 2011). However, it is often sensible to re‐express the results using a more easily interpretable statistic such as the risk differences (Higgins 2011a). We therefore decided to re‐analyse the results using risk difference in order to investigate whether the choice of summary statistic could influence the conclusions of the meta‐analysis.
Results
Description of studies
See Characteristics of included studies, Characteristics of excluded studies
Results of the search
Figure 1 outlines the process from searching to study inclusion. We retrieved 9,665 potentially applicable citations from searches of electronic databases (CENTRAL, MEDLINE, EMBASE, CINAHL, and the EPOC Register) and handsearches of other resources.
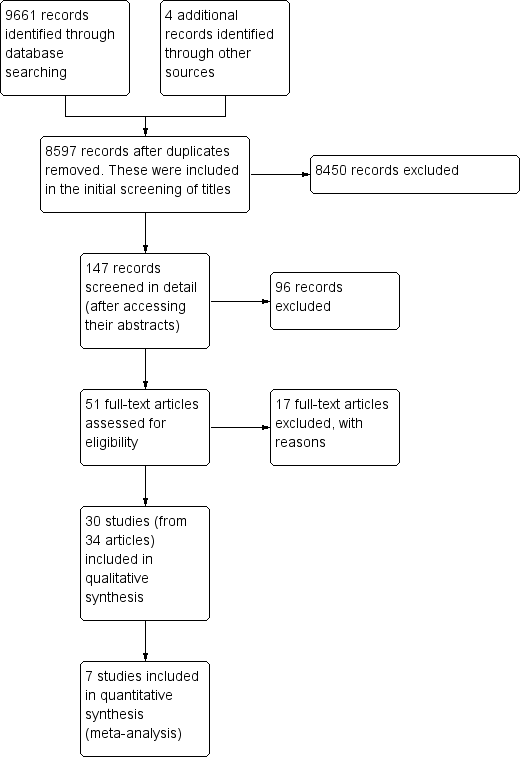
Prisma study flow diagram.
Two review authors (VTB and NM) independently screened the titles and abstracts of the studies and excluded 9614 records, leaving 51 studies eligible for full‐text review. Thirty of these studies met our inclusion criteria and we describe their characteristics in the Characteristics of included studies table. Studies initially appearing appropriate for inclusion, but then subsequently excluded have their primary reason for exclusion listed in the Characteristics of excluded studies table.
Included studies
Characteristics of study design and setting:
Seventeen included studies were cluster‐randomised trials, eleven were individual randomised trials, one (Broadhurst 2007) was a CBA and one (Hollingworth 2002) was an interrupted time series. There were no NRCTs. Seventeen of the studies were two‐arm trials, eight compared three arms and five compared four arms.
All of the included studies were conducted in high‐income countries, with eight based in Canada, eight in the USA, six in the UK, two in Germany, two in France, two in Australia, one in the Netherlands and one in Northern Ireland. All of the studies evaluated professional interventions for GPs. We found no studies targeting multidisciplinary care teams where GPs constituted 50% or more of the participants.
All of the studies evaluated interventions delivered in a primary care setting.
Characteristics of the professional interventions:
Eleven studies focused on the management of osteoporosis, ten on low back pain of which two included knee pain, four on the management of osteoarthritis, three on shoulder pain and the remaining two on other musculoskeletal pain.
Out of the thirty studies, twenty‐four included interventions addressed solely to the GP (Becker 2008; Bishop 2006; Boyd 2002; Broadhurst 2007; Chassany 2006; Dey 2004; Eccles 2001; Engers 2005; Feldstein 2006; French 2013; Gormley 2003; Hazard 1997; Hollingworth 2002; Huas 2006; Kerry 2000; Leslie 2012; Rahme 2005; Robling 2002; Rosemann 2007; Rozental 2008; Schectman 2003; Solomon 2007a; Stross 1985; Watson 2008). Ten studies (Bessette 2011; Bishop 2006; Ciaschini 2010; Cranney 2008; Feldstein 2006; Lafata 2007; Leslie 2012; Majumdar 2008; Roux 2013; Solomon 2007a) combined professional interventions with patient‐directed interventions such as patient‐directed education and reminders to see their GP. These patient‐directed components have been described as such whenever encountered.
Table 1 presents the classification of different educational interventions according to EPOC taxonomy (EPOC 2002). The thirty included studies provided an evaluation of a wide range of different professional interventions. Table 2 provides a summary of these.
| Table 1: Classification of relevant interventions from EPOC taxonomy | |
| Intervention | Description |
| Distribution of educational materials | Distribution of published or printed recommendations for clinical care, including clinical practice guidelines, audio‐visual materials and electronic publications. The materials may have been delivered personally or through mass mailings. |
| Educational meetings | Healthcare providers who have participated in conferences, lectures, workshops or traineeships |
| Local consensus processes | Inclusion of participating providers in discussion to ensure that they agreed that the chosen clinical problem was important and the approach to managing the problem was appropriate |
| Educational outreach visits | Use of a trained person who met with providers in their practice settings to give information with the intent of changing the provider’s practice. The information given may have included feedback on the performance of the provider(s) |
| Local opinion leaders | Use of providers nominated by their colleagues as ‘educationally influential’. The investigators must have explicitly stated that their colleagues identified the opinion leaders |
| Patient‐mediated | New clinical information (not previously available) collected directly from patients and given to the provider e.g. depression scores from an instrument |
| Audit and feedback | Any summary of clinical performance of health care over a specified period of time. The summary may also have included recommendations for clinical action. The information may have been obtained from medical records, computerised databases, or observations from patients |
| Reminders | Patient or encounter specific information, provided verbally, on paper or on a computer screen, which is designed or intended to prompt a health professional to recall information. This would usually be encountered through their general education; in the medical records or through interactions with peers, and so remind them to perform or avoid some action to aid individual patient care. Computer aided decision support and drugs dosage are included. |
| Marketing | Use of personal interviewing, group discussion (‘focus groups’), or a survey of targeted providers to identify barriers to change and subsequent design of an intervention that addresses identified barriers |
| Mass media | (i) Varied use of communication that reached great numbers of people including television, radio, newspapers, posters, leaflets, and booklets, alone or in conjunction with other interventions; (ii) Targeted at the population level |
| Other | Patient‐directed (education and reminders to see their primary care physician) |
| Table 2. Intervention types used in each study (N.B. All interventions evaluated were professional) | ||
| Intervention methods 1,2 | No. of Studies | Studies 3 |
| Distribution of educational materials | 27 | Becker 2008; Bessette 2011; Bishop 2006; Boyd 2002; Broadhurst 2007; Chassany 2006; Ciaschini 2010; Cranney 2008; Dey 2004; Eccles 2001; Engers 2005; Feldstein 2006; French 2013; Hazard 1997; Hollingworth 2002; Kerry 2000; Leslie 2012; Majumdar 2008; Rahme 2005; Robling 2002; Rosemann 2007; Roux 2013; Rozental 2008; Schectman 2003; Solomon 2007a; Stross 1985; Watson 2008 |
| Educational meetings | 10 | Becker 2008; Chassany 2006; Engers 2005; French 2013; Gormley 2003; Huas 2006; Rahme 2005; Rosemann 2007; Schectman 2003, Watson 2008 |
| Local consensus processes | 0 | |
| Educational outreach visits | 6 | Becker 2008; Broadhurst 2007; Dey 2004; Robling 2002; Schectman 2003; Solomon 2007a |
| Local opinion leaders | 3 | |
| Patient‐mediated | 6 | Boyd 2002; Ciaschini 2010; Cranney 2008; Huas 2006; Roux 2013; Rozental 2008 |
| Audit and feedback | 4 | |
| Reminders | 11 | Bishop 2006; Ciaschini 2010; Cranney 2008; Eccles 2001; Feldstein 2006; Hazard 1997; Lafata 2007; Leslie 2012; Majumdar 2008; Roux 2013; Rozental 2008 |
| Marketing | 0 | |
| Mass media | 0 | |
| Patient‐directed4 | 12 | Becker 2008; Bessette 2011; Bishop 2006; Leslie 2012; Ciaschini 2010; Cranney 2008; Feldstein 2006; Lafata 2007; Majumdar 2008; Rosemann 2007; Roux 2013; Solomon 2007a |
| 1. Category of intervention as classified by the EPOC taxonomy EPOC 2007 [9] 2. See Table 1 for definition of each intervention 3. Some studies used more than one intervention type and these are listed against their corresponding category 4. Patient‐directed interventions targeted patients and included patient education and reminders to see their primary‐care physician. These were included in the review only if they were a component of a professional intervention targeting primary‐care physicians | ||
Studies comparing an intervention to a ‘no intervention’ control:
Twenty‐three of the included studies assessed an intervention against a ‘no intervention’ or ‘usual care’ control (Bessette 2011; Bishop 2006; Broadhurst 2007; Chassany 2006; Ciaschini 2010; Cranney 2008; Dey 2004; Engers 2005; Feldstein 2006; French 2013; Hazard 1997; Huas 2006; Kerry 2000; Lafata 2007; Leslie 2012; Majumdar 2008; Rahme 2005; Rosemann 2007; Roux 2013; Schectman 2003; Solomon 2007a; Stross 1985; Watson 2008) and Table 3 shows the different components of these interventions. Distribution of educational material in combination with an educational meeting/workshop was the most frequent intervention assessed against a no‐intervention control, and was evaluated in six studies. Distribution of educational materials was the intervention most frequently used as a component of a multifaceted intervention.
| Table 3. Intervention combinations compared to a no‐intervention control group | ||
| Intervention combinations | No. of comparisons | Study ID |
| Single component interventions: | ||
| Distribution of educational materials | 1 | |
| Patient‐directed | 3 | |
| Educational meetings, workshops | 1 | |
| Multifaceted interventions: Two intervention components | ||
| Distribution of educational material + reminders | 4 | |
| Distribution of educational material + educational outreach visits | 4 | |
| Distribution of educational material + educational meeting/workshop | 6 | Chassany 2006; Engers 2005; French 2013; Rahme 2005; Rosemann 2007; Watson 2008 |
| Distribution of educational material + local opinion leaders | 1 | |
| Distribution of educational material + audit/feedback | 1 | |
| Patient‐mediated + educational meeting/workshop | 1 | |
| Patient‐directed +reminder | 1 | |
| Patient‐directed + educational material | 1 | |
| Multifaceted interventions: Three intervention components | ||
| Patient‐directed + educational material + reminder | 3 | |
| Patient‐directed + educational material + educational meeting/workshop | 1 | |
| Patient‐directed + educational material + educational outreach visit | 1 | |
| Multifaceted interventions: Four intervention components | ||
| Patient‐directed + distribution of educational material + reminder + local opinion leaders | 1 | |
| Patient‐mediated + distribution of educational material + reminders + patient‐directed (education and reminders) | 3 | |
| Multifaceted interventions: Five intervention components | ||
| Distribution of educational material + educational meetings/workshops + audit + educational outreach visit + local opinion leaders | 1 | |
Studies comparing an intervention to a different intervention:
Fifteen studies (Becker 2008; Bessette 2011; Bishop 2006; Boyd 2002; Eccles 2001; Feldstein 2006; Gormley 2003; Lafata 2007; Leslie 2012; Rahme 2005; Robling 2002; Rosemann 2007; Roux 2013; Rozental 2008; Solomon 2007a) evaluated single or multifaceted interventions against another intervention. The majority of the studies evaluated different intervention combinations (see Table 4).
| Table 4. Intervention combinations compared to a different intervention | ||
| Intervention combinations | No. of comparisons | Study ID |
| Single component interventions: | ||
| Educational meetings/workshops vs distribution of educational material | 1 | |
| Educational meetings/workshops vs a different educational meeting/workshop | 1 | |
| Multifaceted interventions: Two intervention components | ||
| Distribution of educational material + patient‐mediated vs the same intervention but less intensive | 1 | |
| Distribution of educational material + educational outreach visit vs distribution of educational material | 1 | |
| Distribution of educational material + audit vs distribution of educational material | 2 | |
| Distribution of educational material + audit vs distribution of educational material + reminder | 1 | |
| Distribution of educational material + outreach vs distribution of educational material + audit | 1 | |
| Distribution of educational material + educational outreach visit vs patient‐directed | 1 | |
| Distribution of educational material + patient‐directed vs the same (more intensive) | 1 | |
| Patient‐directed + reminder vs patient‐directed | 1 | |
| Distribution of educational material + reminder vs distribution of educational material | 1 | |
| Distribution of educational material + reminder vs patient‐mediated | 1 | |
| Distribution of educational material + educational meeting/workshop vs educational meeting/workshop | 1 | |
| Distribution of educational material + educational meeting/workshop vs distribution of educational material | 1 | |
| Multifaceted interventions: Three intervention components | ||
| Distribution of educational material + reminders + patient‐directed vs distribution of educational material + reminders | 2 | |
| Distribution of educational material + reminder + patient‐directed vs patient‐directed | 1 | |
| Distribution of educational material + audit + reminders vs distribution of educational material | 1 | |
| Distribution of educational material + audit + reminders vs distribution of educational material + audit | 1 | |
| Distribution of educational material + audit + reminders vs distribution of educational material + reminders | ||
| Distribution of educational material + audit + outreach vs distribution of educational material + outreach | 1 | |
| Distribution of educational material + audit + outreach vs distribution of educational material + audit | 1 | |
| Distribution of educational material + audit + outreach vs distribution of educational material | 1 | |
| Distribution of educational material + educational meetings/workshops + educational outreach visits vs distribution of educational material | 1 | |
| Distribution of educational material + educational outreach visit + patient‐directed vs patient‐directed | 1 | |
| Distribution of educational material + educational outreach visit + patient‐directed vs distribution of educational material + educational outreach visit | 1 | |
| Distribution of educational material + educational meeting/workshop + patient‐directed vs distribution of educational material + educational meeting/workshop | 1 | |
| Multifaceted interventions: Four intervention components | ||
| Distribution of educational material + educational meetings/workshops + educational outreach visits + patient‐directed vs distribution of educational material | 1 | |
| Distribution of educational material + educational meetings/workshops +educational outreach visits + patient directed vs distribution of educational material + educational meetings/workshops + educational outreach visits | 1 | |
| Patient‐mediated + distribution of education material + reminders + patient‐directed (education and reminders) vs patient‐mediated + distribution of education material + reminders + patient‐directed (education and reminders) | 1 | |
Excluded studies
The main reasons for the studies' exclusion were methodological limitations; for example, absence of two control and two intervention groups in CBAs, or observational studies with no comparison groups (Fabiani 2004; Feldstein 2007; Garala 1999; Gardner 2002; Ioannidis 2008; Ioannidis 2009; McDonald 2003; Nazareth 2002). We excluded five studies because fewer than 50% of the participants were GPs (Gardner 2005; Glazier 2005; Goldberg 2001; Solomon 2007b; Vernacchio 2013). We excluded two studies because they did not evaluate professional interventions on the management of musculoskeletal conditions (Corson 2011; Rolfe 2001), and a further two because they did not report on objectively‐measured primary outcomes (Ashe 2004; Ruiz 2001). The exact reasons for exclusion for each study are detailed in the Characteristics of excluded studies table.
Risk of bias in included studies
We present the findings of 'Risk of bias' assessments in Figure 2 and Figure 3 to demonstrate a graphical representation of the judgements about each of the risk of bias items, and in Figure 4 and Figure 5 to present these as percentages across all included studies.

Risk of bias summary: review authors' judgements about each risk of bias item for each included study.

Risk of bias summary for ITS study design: review authors' judgements about each risk of bias item for each included study.
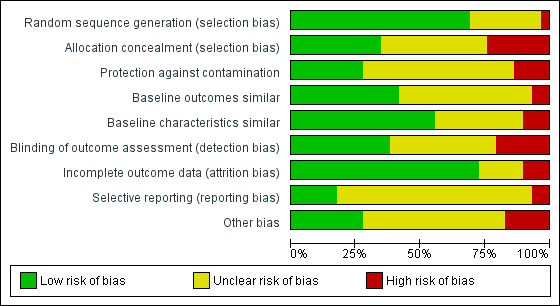
Risk of bias graph: review authors' judgements about each risk of bias item presented as percentages across all included studies.
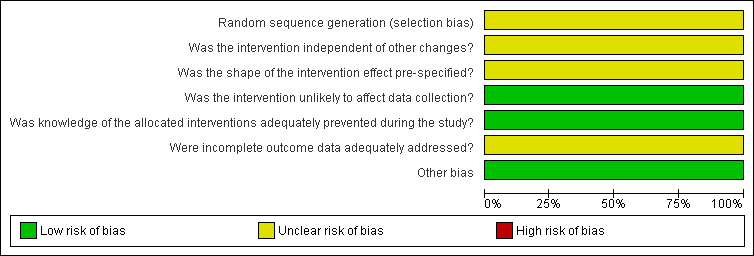
Risk of bias graph for ITS study design: review authors' judgements about each risk of bias item presented as percentages across all included studies.
Overall, with the exception of the five studies included in the meta‐analysis, there was a high risk of bias across the included studies.
Despite the fact that twenty‐eight out of the thirty studies were randomised trials, in eight studies (Bessette 2011; Boyd 2002; Gormley 2003; Huas 2006; Rahme 2005; Rozental 2008; Schectman 2003; Stross 1985) the method for random sequence generation was unclear.
With regard to the study by Hollingworth 2002, which used an ITS design, it was unclear whether the intervention took place independently of other changes and there was insufficient information on the shape of the intervention effect and the completeness of the outcome data.
Allocation
We judged seven out of the twenty‐nine controlled trials to have a high risk of bias for allocation concealment, and twelve had an unclear risk as they did not contain enough information for the risk to be estimated.Ten studies had a low risk of selection bias (Becker 2008; Cranney 2008; Dey 2004; Eccles 2001; Feldstein 2006; French 2013; Leslie 2012; Majumdar 2008; Roux 2013; Schectman 2003).
Blinding
We rated six of the twenty‐nine controlled trials as having a high risk of detection bias, twelve studies as having an unclear risk, and eleven studies with a low risk of such bias (Becker 2008; Eccles 2001; Feldstein 2006; French 2013; Kerry 2000; Lafata 2007; Leslie 2012; Majumdar 2008; Rahme 2005; Robling 2002; Solomon 2007a).
In half of the controlled studies, blinding of the participants was either unclear or did not happen (Bishop 2006; Boyd 2002; Feldstein 2006; French 2013; Hazard 1997; Lafata 2007; Rahme 2005; Robling 2002; Rosemann 2007; Roux 2013; Rozental 2008; Schectman 2003; Solomon 2007a; Stross 1985; Watson 2008).
Incomplete outcome data
Three controlled studies had a high risk of bias for incomplete outcome data (Bessette 2011; Boyd 2002; French 2013), five had an unclear risk (Gormley 2003; Huas 2006; Robling 2002; Schectman 2003; Stross 1985) and we judged the remaining twenty‐one controlled studies to have a low risk of such bias.
Selective reporting
Two controlled studies (French 2013; Kerry 2000) had a high risk of selective reporting bias, twenty‐two had an unclear risk, and we judged five to be at low risk (Bessette 2011; Ciaschini 2010; Leslie 2012; Rosemann 2007; Solomon 2007a).
Other potential sources of bias
Other areas assessed for sources of bias included protection against contamination (only eight out of the twenty‐nine controlled studies were at low risk) and whether a baseline assessment of the intervention groups had taken place with regard to group characteristics (only eleven out of the twenty‐nine controlled studies were at low risk) and baseline outcomes (we judged sixteen of twenty‐nine controlled studies to be at low risk).
Effects of interventions
See: Summary of findings for the main comparison Primary care physician alerting system and a patient‐directed intervention (education and reminder to see their primary care physician) compared to standard care for osteoporosis management; Summary of findings 2 Primary care physician alerting system compared to usual care for osteoporosis management; Summary of findings 3 Primary care physician alerting system compared to primary care physician alerting system and a patient‐directed intervention (education and reminder to see their primary care physician) for osteoporosis management; Summary of findings 4 Osteoporosis studies: Summary of findings; Summary of findings 5 Low back pain studies: Summary of findings; Summary of findings 6 Osteoarthritis studies: Summary of findings; Summary of findings 7 Shoulder pain studies: Summary of findings; Summary of findings 8 Studies on other musculoskeletal conditions: Summary of findings
We were only able to include five out of the thirty studies in a meta‐analysis. These five studies evaluated interventions aiming to improve the management of osteoporosis (Ciaschini 2010; Feldstein 2006; Leslie 2012; Majumdar 2008; Roux 2013) and were sufficiently similar in terms of condition studied, intervention and outcomes (GP behaviour‐related outcomes: osteoporosis diagnostic testing and medication prescribing), that we could pool the results.
In many studies there was no reporting of baseline performance and therefore for these studies we were unable to calculate an adjusted risk difference (ARD) for dichotomous measures and adjusted relative percentage change for continuous measures.
No study investigated the potential adverse effects of the interventions on professionals' health behaviours, coverage or access, quality of care or healthcare providers. Three studies on low back pain (Becker 2008; Dey 2004; Hazard 1997) reported on sickness certification/work absence (social outcome). One study (Rosemann 2007) reported on service utilisation. Three studies (Majumdar 2008; Robling 2002; Watson 2008) investigated the potential effects on resources and included a cost‐effectiveness analysis.
We explored the possibility of grouping the studies by intervention type and pooling the results to assess their effect. However, this was not always clinically appropriate, because not all intervention outcomes were applicable to all musculoskeletal conditions (for example, bone mineral density (BMD) scanning was only applicable for osteoporosis).
We presented the included studies classified by condition (osteoporosis, osteoarthritis, low back pain, shoulder pain and other musculoskeletal conditions). For each condition, we divided the study results into two groups: evaluation of interventions against a no‐intervention control and evaluation of interventions against 'other intervention' groups.
Osteoporosis studies:
Eleven studies included people with diagnosed osteoporosis or at risk of its development (Bessette 2011; Boyd 2002; Ciaschini 2010; Cranney 2008; Feldstein 2006; Lafata 2007; Leslie 2012; Majumdar 2008; Roux 2013; Rozental 2008; Solomon 2007a). Eight of these studies (Bessette 2011; Cranney 2008; Feldstein 2006; Leslie 2012; Majumdar 2008; Roux 2013; Rozental 2008; Solomon 2007a) were for secondary prevention of osteoporosis, and focused on people with a previous fracture and at an increased risk of having osteoporosis. Six studies were conducted in Canada, and five were set in the USA. Six studies were individual RCTs (Bessette 2011; Ciaschini 2010; Feldstein 2006; Leslie 2012; Majumdar 2008; Roux 2013), three were cluster‐RCTs (Cranney 2008; Lafata 2007; Solomon 2007a) and two were randomised trials without control groups (Boyd 2002; Rozental 2008). The desired management outcome in all of the studies was diagnostic testing for osteoporosis in the form of a BMD scan or prescribing of osteoporosis medication, or both. These are clinically important outcomes for osteoporosis management, as BMD testing leads to the diagnosis and prescribing osteoporosis medication is one of the main aspects of treatment.
Osteoporosis: evaluations of interventions compared to no‐intervention control groups
Nine studies (Bessette 2011; Ciaschini 2010; Cranney 2008; Feldstein 2006; Lafata 2007; Leslie 2012; Majumdar 2008; Roux 2013; Solomon 2007a) evaluated a single or multifaceted intervention compared to a no‐intervention control. The results of these studies are summarised in Table 5 and Table 6.
| (Study) Intervention | Int pre (%) 1 | C pre (%)2 | Int post (%)3 | C post (%)4 | ARD 5 | Risk difference 6 (P value if reported by authors) | Relative % change post 7 | Risk ratio 8 |
| Patient education and reminder to see their physician (patient directed), education of physician via the patient (distribution of educational material) | ‐ | ‐ | 14.72% | 11.96% | ‐ | 2.8% | 23% | 1.2 |
| Patient education (including video on osteoporosis) and reminder to see their physician, education of physician via the patient (distribution of educational material) | ‐ | ‐ | 15.81% | 11.96% | ‐ | 3.9% | 32% | 1.3 |
| (Cranney 2008)** Patient‐specific mailed letter to primary are physician (including guidelines) and patient education and reminder | ‐ | ‐ | 64/125 (51%) | 36/145 (25%) | ‐ | 26.4% (P< 0.0001) | 106% | 2.1 |
| Patient‐specific Electronic Medical Record (EMR) reminders to primary‐care provider informing them of patient increased risk and guidelines. Sent twice. | ‐ | ‐ | 40/101 (39.6%) | 2/103 (1.9%) | ‐ | 37.7% (P< 0.01) | 1940% | 20.4 |
| EMR reminder plus patient‐directed intervention: education and reminder | ‐ | ‐ | 36/110 (32.7%) | 2/103 (1.9%) | ‐ | 30.8% (P< 0.01) | 1585% | 16.9 |
| (Lafata 2007)** Patient‐directed: 2 mailings (educational and reminders) | ‐ | ‐ | 720/3367 (21.4%) | 313/2901 (10.8%) | ‐ | 10.6% (P< 0.001) | 98% | 2 |
| (Lafata 2007)** Physician prompt: Electronic Medical Record (EMR) reminder to physician and biweekly mailing plus patient‐directed: 2 mailings (educational and reminders) | ‐ | ‐ | 1181/4086 (28.9%) | 313/2901 (10.8%) | ‐ | 18.1% (P< 0.001) | 168% | 2.7 |
| Physician reminder plus educational material | 224/1363 (16.4%) | 58/1480 (3.9%) | ‐ | 12.5% | 319% | 4.2 | ||
| Physician reminder plus educational material plus patient‐directed intervention (reminder to see their physician) | ‐ | ‐ | 258/1421 (18.2%) | 58/1480 (3.9%) | ‐ | 14.2% | 363% | 4.6 |
| Patient education, physician patient‐specific reminders by mail/fax, physician guidelines endorsed by opinion leaders | ‐ | ‐ | 71/137 (51.8%) | 24/135 (17.8%) | ‐ | 34% (P< 0.001) | 192% | 2.9 |
| (Solomon 2007a)** Patient directed (3 mailed letters educational) | ‐ | ‐ | 249/3274 (7.6%) | 224/3268 (6.9%) | ‐ | 0.8% (NS) | 11% | 1.1 |
| (Solomon 2007a)** Physician education following an academic‐detailing approach | ‐ | ‐ | 183/3574 (5.1%) | 224/3268 (6.9%) | ‐ | ‐1.7% (NS) | ‐25% | 0.7 |
| (Solomon 2007b)** Combination of both physician and patient education | ‐ | ‐ | 223/3339 (6.7%) | 224/3268 (6.9%) | ‐ | ‐0.2% (NS) | ‐3% | 1 |
1. Intervention group pre‐intervention proportion
2. Control group pre‐intervention proportion
3. Intervention group post‐intervention proportion
4. Control group post‐intervention proportion
5. ARD = [Int post (%) minus C post (%)] minus [Int pre (%) minus C pre (%)]. The direction of effect has been adjusted so that a positive result represents a beneficial intervention outcome, according to Grimshaw 2004.
6. Risk Difference (RD) is the absolute % change post‐intervention = Int post (%) minus C post (%). This is considered to be "small" if ≤ 5%, "modest" if > 5% and ≤10%,"moderate" if > 10% but ≤ 20%, and "large" if > 20%.The direction of effect has been adjusted so that a positive result represents a beneficial intervention outcome, according to Grimshaw 2004.
7. Relative % change post = absolute % change post divided by C post (%). The direction of effect has been adjusted so that a positive result represents a beneficial intervention outcome, according to Grimshaw 2004.
8. Risk ratio (RR) = Int post (%) divided by C post (%)
BMD: bone mineral density; C: control group; Int: intervention group; ARD: adjusted risk difference; NS: not significant
* In the study by Bessette 2011, the outcomes reported above include the participants with a diagnosis following the intervention. The women were considered "diagnosed" if they received a BMD test, if they were informed by their physician that they were suffering from osteoporosis and/or if they were initiated on osteoporosis medication. Therefore, the above percentages do not necessarily mean that the women received a BMD test.
** The data reported above for the studies by Cranney 2008, Lafata 2007 and Solomon 2007b does not account for clustering. We did not have access to sufficient information to adjust the data for clustering.
| (Study) Intervention | Int pre (%) 1 | C pre (%)2 | Int post (%)3 | C post (%)4 | ARD 5 | Risk difference 6 (P value if reported by authors) | Relative % change post 7 | Risk ratio 8 |
| Patient education (patient directed), education of physician via the patient (for group of patients without diagnosis or treatment at randomisation) | ‐ | ‐ | 11.79% | 7.78% | ‐ | 4% | 52% | 1.5 |
| Patient education (including video on osteoporosis), education of physician via the patient (for group of patients without diagnosis or treatment at randomisation) | ‐ | ‐ | 10.64% | 7.78% | ‐ | 2.9% | 37% | 1.4 |
| Patient education (patient directed), education of physician via the patient (for group of patients without treatment at randomisation) | ‐ | ‐ | 13.49% | 10.31% | ‐ | 3.2% | 31% | 1.3 |
| Patient education (including video on osteoporosis), education of physician via the patient (for group of patients without treatment at randomisation) | ‐ | ‐ | 12.71% | 10.31% | ‐ | 2.4% | 23% | 1.2 |
| Patient education, education of physician via the patient where the patient did pass the information on to the physician (for group of patients without treatment at randomisation) | ‐ | ‐ | 15% | 10% | ‐ | 5% | 50% | 1.5 |
| Patient‐specific evidence‐based recommendations targeted to improve osteoporosis treatment to both the patients and their primary‐care providers | ‐ | ‐ | 29/52 (55.8%) | 16/60 (26.7%) | ‐ | 29.1% | 109% | 2.1 |
| (Cranney 2008)* Patient‐specific mailed letter to primary are physician (including guidelines) and patient education and reminder | ‐ | ‐ | 35/125 (28%) | 15/145 (10.3%) | ‐ | 17.7% (P=0.0002) | 171% | 2.7 |
| Patient‐specific Electronic Medical Record (EMR) reminders to primary‐care provider informing them of patient increased risk and guidelines. Sent twice. | ‐ | ‐ | 28/101 (27.7%) | 5/103 (5%) | ‐ | 22.9% (P< 0.01) | 471% | 5.7 |
| EMR reminder plus patient‐directed intervention: education and reminder | ‐ | ‐ | 22/110 (20.2%) | 5/103 (5%) | ‐ | 15.1% (P< 0.01) | 312% | 4.1 |
| (Lafata 2007)* Patient‐directed: x2 mailings (educational and reminders) | ‐ | ‐ | 11/128 (8.6%) | 3/51 (5.9%) | ‐ | 2.7% | 46% | 1.5 |
| (Lafata 2007)* Physician prompt: Electronic Medical Record (EMR) reminder to physician and biweekly mailing plus Patient‐directed: 2 mailings (educational and reminders) | ‐ | ‐ | 15/162 (9.3%) | 3/51 (5.9%) | ‐ | 3.4% | 57% | 1.6 |
| Physician reminder plus educational material | ‐ | ‐ | 200/1363 (14.7%) | 157/1480 (10.6%) | ‐ | 4.1% | 38% | 1.4 |
| Physician reminder plus educational material plus patient‐directed intervention (reminder to see their physician) | ‐ | ‐ | 234/1421 (16.5%) | 157/1480 (10.6%) | ‐ | 5.9% | 55% | 1.6 |
| Patient education, physician patient‐specific reminders by mail/fax, physician guidelines endorsed by opinion leaders | ‐ | ‐ | 30/137 (21.9%) | 10/135 (7.4%) | ‐ | 14.5% (P<0.001) | 196% | 3 |
| Verbal and written information on osteoporosis to patient and letter with specific management plan sent to their treating physician. Patient reminders at 6 and 12 months. Reminder to physician if patient untreated at 6 months | 82/275 (29.8%) | 45/199 (22.6%) | 151/275 (54.9%) | 71/199 (35.7%) | 12% | 19.2% (P< 0.005) | 54% | 1.5 |
| Verbal and written information on osteoporosis to patient and letter with specific management plan sent to their treating physician. Blood tests and BMD test ordered for patient and results sent to the physician. Patient reminders at 4,8 and 12 months and physician reminders at 4 and 8 months if patient remained untreated | 65/251 (25.9%) | 45/199 (22.6%) | 156/251 (62.2%) | 71/199 (35.7%) | 23.2% | 26.5% (P< 0.005) | 74% | 1.7 |
| Patient directed (x3 mailed letters educational) | ‐ | ‐ | 208/3274 (6.4%) | 231/3268 (7.1%) | ‐ | ‐0.7% | ‐10% | 0.9 |
| Physician education following an academic detailing approach | ‐ | ‐ | 197/3574 (5.5%) | 231/3268 (7.1%) | ‐ | ‐1.6% | ‐22% | 0.8 |
| Combination of both physician and patient education | ‐ | ‐ | 236/3339 (7.1%) | 231/3268 (7.1%) | ‐ | 0 | 0 | 1 |
1. Intervention group pre‐intervention proportion
2. Control group pre‐intervention proportion
3. Intervention group post‐intervention proportion
4. Control group post‐intervention proportion
5. ARD = [Int post (%) minus C post (%)] minus [Int pre (%) minus C pre (%)]. The direction of effect has been adjusted so that a positive result represents a beneficial intervention outcome, according to Grimshaw 2004.
6. Risk Difference (RD) is the absolute % change post‐intervention = Int post (%) minus C post (%). This is considered to be "small" if ≤ 5%, "modest" if > 5% and ≤10%,"moderate" if > 10% but ≤ 20%, and "large" if > 20%.The direction of effect has been adjusted so that a positive result represents a beneficial intervention outcome, according to Grimshaw 2004.
7. Relative % change post = absolute % change post divided by C post (%). The direction of effect has been adjusted so that a positive result represents a beneficial intervention outcome, according to Grimshaw 2004.
8. Risk ratio (RR) = Int post (%) divided by C post (%)
BMD: bone mineral density; C: control group; Int: intervention group; ARD: adjusted risk difference; NS: not significant
* The data reported above for the studies by Cranney 2008, Lafata 2007 and Solomon 2007b does not account for clustering. We did not have access to sufficient information to adjust the data for clustering.
The majority of the studies used combinations of interventions. All studies had a patient‐directed component aiming to educate the person on the condition and remind them to see their GP to discuss its management. A GP‐alerting system informing the participant's clinician on the increased risk of osteoporosis either via a patient‐specific letter or via an electronic reminder was also a commonly‐used component. Finally, seven out of the nine studies used distribution of educational material on osteoporosis, such as osteoporosis guidelines.
The majority of the studies reported improvements in GP behaviour and more specifically increases in BMD testing and osteoporosis medication prescribing rates.
The cluster‐RCTs (Cranney 2008; Lafata 2007; Solomon 2007a) did not provide sufficient data for the re‐calculation of the adjusted for clustering effect sizes for this review. Cranney 2008 used patient‐directed education, GP mailed reminders and dissemination of guidelines and showed that the intervention improved BMD testing (RD 26%, rates 53.5% in intervention group versus 25.5% in control, reported adjusted OR 3.38, 95% CI 1.83‐6.26, P <0.001) and osteoporosis medication prescribing rates (RD 17.7%, rates 28% in intervention group versus 10% in control, reported adjusted OR 3.45, 95% CI 1.58‐7.56, P = 0.002). This was a relatively small study (270 participants in total). Lafata 2007 evaluated the use a patient‐directed intervention (patient mailed reminders) alone and in combination with GP prompts and showed that the intervention resulted in little difference in outcomes (RD for BMD 10.6% and 18.1% respectively and for osteoporosis medication prescribing rates 2.7% and 3.4% respectively). The authors reported generalised estimating equation (GEE) adjusted treatment rates of 2.3% in the usual care group, 4% in the patient mailed reminders group and 3.9% in the mailed reminders with GP prompts group which were statistically significant. Solomon 2007a evaluated the effect of a brief programme of patient and/or GP education (academic detailing) and showed that the intervention resulted in no difference in the probability of the primary composite end‐point (BMD testing or osteoporosis medication prescribing) between the usual care and intervention groups. The reported adjusted RR for the patient and GP intervention was 1.04 (95% CI 0.85‐1.26), for the GP only intervention was 0.70 (95% CI 0.56‐0.86) and for the patient only intervention was 0.90 (95% CI 0.73‐1.10). These results are consistent with the small RDs (<5%) reported in Table 5 and Table 6.
From the remaining six RCT studies (Bessette 2011; Ciaschini 2010; Feldstein 2006; Leslie 2012; Majumdar 2008; Roux 2013) three studies (Feldstein 2006; Leslie 2012; Majumdar 2008) evaluating interventions aimed at both GPs and patients resulted in moderate to large effects in the investigation rates (BMD testing) and four (Ciaschini 2010; Feldstein 2006; Majumdar 2008; Roux 2013) showed moderate to large effects in the prescribing rates for osteoporosis medication. GP alerting on its own also resulted in improved GP behaviour with regards to BMD testing and osteoporosis medication prescribing according to two studies (Feldstein 2006; Leslie 2012).
Majumdar 2007, assessed the cost‐effectiveness of the study Majumdar 2008, and concluded that the intervention led to a per patient cost saving of CAD 13 (USD 9) and a gain of 0.012 quality‐adjusted life years.
Meta‐analysis of osteoporosis studies
Meta‐analysis of studies evaluating professional and patient interventions versus usual care
Five osteoporosis studies (Ciaschini 2010; Feldstein 2006; Leslie 2012; Majumdar 2008; Roux 2013) used a similar intervention, including a GP‐alerting system (via a patient‐specific letter or electronic reminder message) and a patient‐directed intervention (including patient education and a reminder to see their GP) and provided adequate data to allow meta‐analysis of the results. Three of these studies (Feldstein 2006; Leslie 2012; Majumdar 2008) assessed BMD testing as one of the main outcomes, and five (Ciaschini 2010; Feldstein 2006; Leslie 2012; Majumdar 2008; Roux 2013) evaluated the effect on osteoporosis medication prescribing rates. We pooled these studies (see Analysis 1.1; Analysis 1.2) and the results show that the combined intervention increases BMD testing rates and osteoporosis medication prescribing rates: RR 4.44 (95% CI 3.54 to 5.55; participants 3,386) for BMD and RR 1.71 (95% CI 1.50 to 1.94; participants 4,223) for medication prescribing, as shown in the summary of findings Table for the main comparison.The considerable statistical heterogeneity observed in the meta‐analysis for BMD testing,I2 = 75% (P=0.02), (Analysis 1.1) could be partly due to the low BMD testing in the usual care group in the studies by Feldstein 2006 (2/1032, 0.2%) and Leslie 2012 (58/1480, 4%) compared to the study by Majumdar 2008 where BMD testing in the usual care group was 18% (24/135). Additionally, the length of follow‐up was different in the three studies (six months in the studies by Feldstein 2006 and Majumdar 2008, twelve months in the study by Leslie 2012).
The Cochrane Handbook recommends that "it is often sensible to use one statistic for meta‐analysis and re‐express the results using a second, more easily interpretable statistic. For example, meta‐analysis may often be best performed using relative effect measures (risk ratios or odds ratios) and the results re‐expressed using absolute effect measures (risk differences or numbers needed to treat)" (Deeks 2011). In view of this recommendation and also the fact that we committed in our protocol to reporting both risk ratios and risk differences whenever possible, we conducted a sensitivity analysis and reported the results of the meta‐analysis using risk differences. We calculated the risk difference to be moderate for BMD testing at 17% (95% CI 15% to 19%) and modest for osteoporosis medication prescribing at 10% (95% CI 8% to 12%), confirming that the intervention improves osteoporosis guideline‐consistent GP behaviour irrespective of the analysis method used to express the size of the effect.
Meta‐analysis of studies evaluating professional only interventions versus usual care
Two osteoporosis studies (Feldstein 2006; Leslie 2012) evaluated the effect of a GP‐alerting system (via a patient‐specific letter or electronic reminder message) versus usual care on professional behaviour (BMD testing and osteoporosis medication prescribing). The interventions were sufficiently similar and provided adequate data to allow the pooling of the results (see Analysis 2.1; Analysis 2.2). The results show that the intervention probably leads to improved BMD testing rates (RR 4.75 (95% CI 3.62 to 6.24); participants 3,047) and a smaller effect with regards to osteoporosis medication prescribing rates (RR 1.52 (95% CI 1.26 to 1.84; participants 3,047), as shown in the summary of findings Table 2. The certainty of evidence was downgraded due to the fact that only two studies were included in the meta‐analysis, due to the relatively low number of patients and events in the study by Feldstein 2006 and also due to the considerable statistical heterogeneity observed. The statistical heterogeneity in the meta‐analysis for BMD testing was I2 = 80% (P = 0.03), (Analysis 2.1) and the heterogeneity for osteoporosis medication prescribing was I2 = 89% (P = 0.003), (Analysis 2.2). These could not be explained by study design or differences in populations but could be partly due to the different length of follow‐up (the follow up in the study by Feldstein 2006 was 6 months and in the study by Leslie 2012 was 12 months) and the relatively larger effect size in the study by Feldstein 2006.
We calculated the risk difference for BMD testing to be moderate at 14% (95% CI 12% to 16%) and for osteoporosis medication prescribing small at 5% (95% CI 3% to 8%), confirming that the intervention probably improves osteoporosis guideline‐consistent GP behaviour.
Osteoporosis: evaluations of interventions compared to another intervention
Eight studies (Bessette 2011; Boyd 2002; Feldstein 2006; Lafata 2007; Leslie 2012; Roux 2013; Rozental 2008; Solomon 2007a) evaluated single or multifaceted interventions compared to a different intervention control. The results of these studies are summarised in Table 7 (outcome: BMD) and Table 8 (outcome: osteoporosis medication).
| (Study) Interventions | Int 1 pre (%) 1 | Int 2 pre (%)2 | Int 1 post (%)3 | Int 2 post (%)4 | ARD 5 | Risk difference6 (P value if reported by authors) | Relative % change post 7 | Risk ratio 8 |
| Patient education, education of physician via the patient, reminder to family physician versus Patient education (including video on osteoporosis), education of physician via the patient, reminder to family physician | 14.72% | 15.81% | ‐1.1% | ‐7% | 0.9 | |||
| Patient‐specific letter to primary care physician containing information on results and recommendations: standard versus extended letter | ‐ | ‐ | 25/83 (30.1%) | 29/78 (37.2%) | ‐ | ‐7.1% | ‐19% | 0.8 |
| Patient‐specific Electronic Medical Record (EMR) reminders to primary‐care provider informing them of patient increased risk and guidelines (sent twice) versus EMR plus patient‐directed intervention (education and reminder) | ‐ | ‐ | 40/101 (39.6%) | 36/110 (32.7%) | ‐ | 6.9% | 21% | 1.2 |
| (Lafata 2007)** Patient‐directed: 2 mailings (educational and reminders) versus physician prompt: Electronic Medical Record (EMR) reminder to physician and biweekly mailing plus patient‐directed: 2 mailings (educational and reminders) | ‐ | ‐ | 720/3367 (21.4%) | 1181/4086 (28.9%) | ‐ | ‐7.5% | ‐26% | 0.7 |
| Physician reminder plus educational material versus physician reminder plus educational material plus patient‐directed intervention (reminder to see their physician) | ‐ | ‐ | 224/1363 (16.4%) | 258/1421 (18.2%) | ‐ | ‐1.7% (NS) | ‐9% | 0.9 |
| Patient‐specific letter to primary‐care physician outlining guidelines versus orthopaedic surgeon ordering BMD and forwarding results to primary‐care physician | 7/23 (30.4%) | 25/27(92.6%) | ‐ | ‐62.2% | ‐67% | 0.3 | ||
| (Solomon 2007a)** Patient‐directed (3 mailed letters educational) versus physician education following an academic‐detailing approach | ‐ | ‐ | 249/3274 (7.6%) | 183/3574 (5.1%) | ‐ | 2.5% | 49% | 1.5 |
| (Solomon 2007a)** Patient‐directed (3 mailed letters educational) versus combination of both physician and patient education | ‐ | ‐ | 249/3274 (7.6%) | 223/3339 (6.7%) | ‐ | 0.9% | 14% | 1.1 |
| (Solomon 2007a)** Physician education following an academic‐detailing approach versus combination of both physician and patient education | ‐ | ‐ | 183/3574 (5.1%) | 223/3339 (6.7%) | ‐ | ‐1.6% | ‐23% | 0.8 |
1. Intervention 1 group pre‐intervention proportion
2. Intervention 2 group pre‐intervention proportion
3. Intervention 1 group post‐intervention proportion
4. Intervention 2 group post‐intervention proportion
5. ARD = [Int 1 post (%) minus Int 2 post (%)] minus [Int 1 pre (%) minus Int 2 pre (%)]. The direction of effect has been adjusted so that a positive result represents a beneficial intervention 1 outcome, according to Grimshaw 2004.
6. Risk Difference (RD) is the absolute % change post‐intervention = Int 1 post (%) minus Int 2 post (%). This is considered to be "small" if ≤ 5%, "modest" if > 5% and ≤10%,"moderate" if > 10% but ≤ 20%, and "large" if > 20%.The direction of effect has been adjusted so that a positive result represents a beneficial intervention 1 outcome.
7. Relative % change post = absolute % change post divided by Int 2 post (%). The direction of effect has been adjusted so that a positive result represents a beneficial intervention 1 outcome, according to Grimshaw 2004.
8. Risk ratio (RR) = Int 1 post (%) divided by Int 2 post (%)
BMD: bone mineral density; Int 1: intervention 1 group; Int 2: Intervention 2 group; ARD: adjusted risk difference; NS: not significant
* In the study by Bessette 2011, the outcomes reported above include the participants with a diagnosis following the intervention. The women were considered "diagnosed" if they received a BMD test, if they were informed by their physician that they were suffering from osteoporosis and/or if they were initiated on osteoporosis medication. Therefore, the above percentages do not necessarily mean that the women received a BMD test.
**The data reported above for the studies by Lafata 2007 and Solomon 2007b does not account for clustering. We did not have access to sufficient information to adjust the data for clustering.
| (Study) Interventions | Int 1 pre (%) 1 | Int 2 pre (%)2 | Int 1 post (%)3 | Int 2 post (%)4 | ARD 5 | Risk difference 6 (P value if reported by authors) | Relative % change post 7 | Risk ratio 8 |
| Patient education, education of physician via the patient, reminder to family physician (for group of patients without diagnosis or treatment at randomisation) versus Patient education (including video on osteoporosis), education of physician via the patient, reminder to family physician (for group of patients without diagnosis and treatment at randomisation) | ‐ | ‐ | 11.79% | 10.64% | ‐ | 1.2% | 11% | 1.1 |
| Patient education, education of physician via the patient, reminder to family physician (for group of patients without diagnosis or treatment at randomisation) versus Patient education (including video on osteoporosis), education of physician via the patient, reminder to family physician (for group of patients without treatment at randomisation) | ‐ | ‐ | 13.49% | 12.71% | ‐ | 0.8% | 6% | 1.1 |
| Patient‐specific letter to primary care physician containing information on results and recommendations: standard versus extended letter | ‐ | ‐ | 11/104 (10.6%) | 14/93 (15.1%) | ‐ | ‐4.5% | ‐30% | 0.7 |
| Patient specific Electronic Medical Record (EMR) reminders to primary care provider informing them of patient increased risk and guidelines (sent twice) versus EMR plus patient‐directed intervention (education and reminder). | ‐ | ‐ | 28/101 (27.7%) | 22/110 (20%) | ‐ | 7.7% | 39% | 1.4 |
| (Lafata 2007)* Patient‐directed: 2 mailings (educational and reminders) versus physician prompt: Electronic Medical Record (EMR) reminder to physician and biweekly mailing plus patient‐directed: 2 mailings (educational and reminders) | ‐ | ‐ | 11/128 (8.6%) | 15/162 (9.3%) | ‐ | ‐0.7% | ‐7% | 0.9 |
| Physician reminder plus educational material versus physician reminder plus educational material plus patient‐directed intervention (reminder to see their physician) | ‐ | ‐ | 200/1363 (14.7%) | 234/1421 (16.5%) | ‐ | ‐1.8% (NS) | ‐11% | 0.9 |
| Verbal and written information on osteoporosis to patient and letter with specific management plan sent to their treating physician. Patient reminders at 6 and 12 months. Reminder to physician if patient untreated at 6 months versus verbal and written information on osteoporosis to patient and letter with specific management plan sent to their treating physician. Blood tests and BMD test ordered for patient and results sent to the physician. Patient reminders at 4,8 and 12 months and physician reminders at 4 and 8 months if patient remained untreated | 82/275 (29.8%) | 65/251 (25.9%) | 151/275 (54.9%) | 156/251 (62.2%) | ‐11.2% | ‐7.2% (P<0.001) | ‐12% | 0.9 |
| Patient specific letter to primary care physician outlining guidelines versus orthopaedic surgeon ordering BMD and forwarding results to primary‐care physician | 6/23 (26.1%) | 20/27(74.1%) | ‐ | ‐48% | ‐65% | 0.4 | ||
| Patient directed (x3 mailed letters educational) versus physician education following an academic detailing approach | ‐ | ‐ | 208/3274 (6.4%) | 197/3574 (5.5%) | ‐ | 0.8% | 15% | 1.2 |
| Patient directed (x3 mailed letters educational) versus combination of both physician and patient education | ‐ | ‐ | 208/3274 (6.4%) | 236/3339 (7.1%) | ‐ | ‐0.7% | ‐10% | 0.9 |
| Physician education following an academic detailing approach versus combination of both physician and patient education | ‐ | ‐ | 197/3574 (5.5%) | 236/3339 (7.1%) | ‐ | ‐1.6% | ‐22% | 0.8 |
1. Intervention 1 group pre‐intervention proportion
2. Intervention 2 group pre‐intervention proportion
3. Intervention 1 group post‐intervention proportion
4. Intervention 2 group post‐intervention proportion
5. ARD = [Int 1 post (%) minus Int 2 post (%)] minus [Int 1 pre (%) minus Int 2 pre (%)]. The direction of effect has been adjusted so that a positive result represents a beneficial intervention 1 outcome, according to Grimshaw 2004.
6. Risk Difference (RD) is the absolute % change post‐intervention = Int 1 post (%) minus Int 2 post (%). This is considered to be "small" if ≤ 5%, "modest" if > 5% and ≤10%,"moderate" if > 10% but ≤ 20%, and "large" if > 20%.The direction of effect has been adjusted so that a positive result represents a beneficial intervention 1 outcome.
7. Relative % change post = absolute % change post divided by Int 2 post (%). The direction of effect has been adjusted so that a positive result represents a beneficial intervention 1 outcome, according to Grimshaw 2004.
8. Risk ratio (RR) = Int 1 post (%) divided by Int 2 post (%)
BMD: bone mineral density; Int 1: intervention 1 group; Int 2: Intervention 2 group; ARD: Adjusted risk difference; NS: not significant
* The data reported above for the studies by Lafata 2007 and Solomon 2007b does not account for clustering. We did not have access to sufficient information to adjust the data for clustering.
Bessette 2011 showed that the more intensive intervention of including a video on osteoporosis as part of the educational material distributed to participants probably results in little or no difference in BMD testing and medication‐prescribing rates (RD < 5%), and in fact in the study it resulted in slightly lower BMD testing rates in the intervention group (RD ‐1.1).
Boyd 2002 focused on the primary prevention of fractures and showed that an extended letter (including guidelines on treatment) to the GP may slightly improve professional behaviour (BMD testing and osteoporosis medication prescribing) compared to a standard letter (suggestion to investigate and treat); RD for BMD testing modest at 7.1% and for medication prescribing small at 4.5%. The study had a potentially high risk of bias, as it did not contain adequate information to ensure its methodological quality.
Feldstein 2006 showed that adding a patient‐directed intervention (education and reminders) to GP electronic reminder messages does not increase the percentage of BMD testing or osteoporosis medication prescribing; in fact, the results were slightly better (RD 6.9% and 7.7% respectively) for the professional‐only intervention.
Leslie 2012 showed that the addition of patient reminders and educational material to an intervention aimed at GPs results in little difference in professional behaviour‐related outcomes (RD 1.7 and 1.8% for BMD and medication prescribing rates respectively).
Roux 2013 compared a "minimal" intervention of patient education and GP alerting with reminders (as mentioned above) to the more "intensive" version which included patient blood and BMD tests, the results of which were communicated to the patient's GP and more frequent reminders. The more intensive intervention may slightly increase osteoporosis medication prescribing rates (62.2% versus 54.9%, RD modest at 7.2%).
Rozental 2008 showed that when an orthopaedic surgeon orders a BMD test and forwards the results to the GP, there may be an improvement in the rates of osteoporosis medication prescribing (74% compared with 26%, large RD of 48%). This was in comparison with participants whose GP simply received a letter from the orthopaedic surgeon outlining guidelines for osteoporosis screening. However, this was a very small study (50 participants randomised into two intervention groups).
Two cluster randomised studies (Lafata 2007 and Solomon 2007a) did not provide sufficient data to allow data adjustment for clustering. Lafata 2007 reported that a combination of GP alerts and patient education and reminders does not result in significant differences in BMD testing and osteoporosis medication prescribing rates when compared to a patient‐directed intervention (RD ‐7.5% and ‐0.7% respectively, generalised estimated equation (GEE) adjusted rates as reported by the authors for medication prescribing 3.9% versus 4%). Solomon 2007a reported that there were no significant differences between the groups with regard to the composite endpoint (BMD testing and/or osteoporosis medication prescribing). The adjusted RR reported by the authors were 0.70 (95% CI 0.56‐0.86) for the GP only intervention versus 0.90 (95% CI 0.73‐1.10) for the patient intervention group versus 1.04 (95% CI 0.85‐1.26) for the combined intervention, which are consistent with the very small RDs (<5%) presented in Table 7 and Table 8.
Meta‐analysis of studies evaluating professional only interventions versus professional and patient interventions
The studies by Feldstein 2006 and Leslie 2012 were sufficiently similar and provided adequate data to allow a meta‐analysis assessing the effect of adding a patient‐directed component to a professional only intervention (see Analysis 3.1; Analysis 3.2). The results show that the combined intervention probably does not lead to an improved effect with regards to increasing BMD testing rates (RR 0.94. (95% CI 0.81 to 1.09); participants 2995) and osteoporosis medication prescribing rates (RR 0.93 (95% CI 0.79 to 1.10; participants 2,995), as shown in the summary of findings Table 3. The certainty of evidence was downgraded because only two studies were included in the meta‐analysis, one of which had a small number of participants and events.
We calculated the risk difference for BMD testing to be ‐1% (95% CI ‐4% to 2%) and for osteoporosis medication prescribing ‐1% (95% CI ‐4% to 2%), confirming that the combined intervention probably does not improve osteoporosis guideline‐consistent GP behaviour when compared to a professional only intervention.
Osteoporosis studies: summary
Nine studies evaluated interventions versus no‐intervention controls to improve the management of people with or at high risk of developing osteoporosis. All studies evaluated a combined intervention addressed to both the GP and the patient. Three out of the six RCT studies (Feldstein 2006; Leslie 2012; Majumdar 2008) showed moderate to large effects in the investigation rates (BMD testing) and four (Ciaschini 2010; Feldstein 2006; Majumdar 2008; Roux 2013) moderate to large effects in the osteoporosis medication prescribing rates.
Meta‐analysis of three studies on BMD testing (Feldstein 2006; Leslie 2012; Majumdar 2008) and five studies on medication prescribing (Ciaschini 2010; Feldstein 2006; Leslie 2012; Majumdar 2008; Roux 2013) showed that a combination of a GP‐alerting system (via a letter or educational reminder message (ERM)) and a patient‐directed intervention (including patient education and a reminder to see their GP) improves guideline‐consistent GP behaviour (Analysis 1.1 and Analysis 1.2). Meta‐analysis of two studies (Feldstein 2006; Leslie 2012) showed that GP alerting on its own also probably improves osteoporosis guideline‐consistent GP behaviour Analysis 2.1; Analysis 2.2) and that adding the patient‐directed component probably does not lead to a greater effect (Analysis 3.1; Analysis 3.2).
The results of three studies (Bessette 2011; Boyd 2002; Roux 2013) suggest that more intensive interventions may result in little or no improvement in GP behaviour‐related outcomes. One study (Solomon 2007a) showed that a brief educational intervention addressed at GPs (academic detailing) and patients may not result in improvements compared to usual care.
Low back pain studies:
We found 10 studies evaluating interventions on the management of low back pain (Becker 2008; Bishop 2006; Dey 2004; Eccles 2001; Engers 2005; French 2013; Hazard 1997; Hollingworth 2002; Kerry 2000; Schectman 2003) of which five were cluster‐RCTs (Dey 2004; Engers 2005; French 2013; Kerry 2000; Schectman 2003), two were individual RCTs (Bishop 2006; Hazard 1997), two were cluster randomised trials (without control group) (Becker 2008; Eccles 2001) and one was an interrupted time series (Hollingworth 2002). Four studies were conducted in the UK (Dey 2004; Eccles 2001; Hollingworth 2002; Kerry 2000), two in the USA (Hazard 1997; Schectman 2003), one in Germany (Becker 2008), one in Canada (Bishop 2006), one in the Netherlands (Engers 2005) and one in Australia (French 2013).
Low back pain studies: evaluations of interventions compared to a no‐intervention control group
Seven studies (Bishop 2006; Dey 2004; Engers 2005; French 2013; Hazard 1997; Kerry 2000; Schectman 2003) used a control group. The re‐calculated effect sizes for those studies where the data allowed us to re‐calculate the effects are summarised in Table 9.
| (Study) Intervention | Outcome | Int pre (%) 1 | C pre (%)2 | Int post (%)3 | C post (%)4 | ARD 5 | Risk difference 6 (P value if reported by authors) | Relative % change post 7 | Risk ratio 8 |
| Physician education (guidelines) and 3 patient‐specific reminder letters | Education and reassurance according to guideline 0 ‐ 4 weeks post‐onset | ‐ | ‐ | 10% (16/162) | 7% (10/149) | 3.2% | 47% | 1.5 | |
| Exercise according to guideline 0 ‐ 4 weeks post‐onset | ‐ | ‐ | 38% (62/162) | 43% (64/149) | ‐4.7% | ‐11% | 0.9 | ||
| Appropriate medication according to guideline 0 ‐ 4 weeks post‐onset | ‐ | ‐ | 85% (138/162) | 77% (115/149) | 8% (P=0.14) | 10% | 1.1 | ||
| Spinal manipulation according to guideline 0 ‐ 4 weeks post‐onset | ‐ | ‐ | 2.5% (4/162) | 6% (9/149) | ‐3.6% | ‐59% | 0.4 | ||
| Guideline‐discordant physician recommended treatment 0 ‐ 4 weeks post‐onset | ‐ | ‐ | 10% (16/162) | 17% (25/149) | 6.9% (P=0.05) | 41% | 0.6 | ||
| Supervised exercise programme (recommended treatment 5 ‐ 12 weeks post‐onset) | ‐ | ‐ | 19% (29/154) | 14% (21/149) | 4.7% (P=0.11) | 34% | 1.3 | ||
| Return to work (recommended treatment 5 ‐ 12 weeks post‐onset) | ‐ | ‐ | 24% (37/154) | 17% (25/149) | 7.2% (P=0.18) | 43% | 1.4 | ||
| Refer to interdisciplinary programme (recommended treatment 5 ‐ 12 weeks post‐onset) | ‐ | ‐ | 4% (6/154) | 2% (3/149) | 1.9% | 94% | 1.9 | ||
| Physiotherapy > 4 weeks (guideline‐discordant) | ‐ | ‐ | 41% (63/154) | 43% (64/149) | 2% | 5% | 1 | ||
| Continued use of spinal manipulation therapy (guideline‐discordant) | ‐ | ‐ | ‐(no data available) | 33% (49/149) | ‐ (P=0.04) | ‐ | |||
| Physician education, reminders and also patient education and 3 reminders | Education and reassurance according to guideline 0 ‐ 4 weeks post‐onset | ‐ | ‐ | 6% (9/151) | 7% (10/149) | ‐0.8% | ‐11% | 0.9 | |
| Exercise according to guideline 0 ‐ 4 weeks post‐onset | ‐ | ‐ | 53% (80/151) | 43% (64/149) | 10% (P=0.05) | 23% | 1.2 | ||
| Appropriate medication according to guideline 0 ‐ 4 weeks post‐onset | ‐ | ‐ | 81% (122/151) | 77% (115/149) | 3.6% (P=0.08) | 5% | 1 | ||
| Spinal manipulation according to guideline 0 ‐ 4 weeks post‐onset | ‐ | ‐ | 5% (8/151) | 6% (9/149) | ‐0.7% | ‐12% | 0.9 | ||
| Guideline‐discordant physician recommended treatment 0 ‐ 4 weeks post‐onset | ‐ | ‐ | 18% (27/151) | 17% (25/149) | ‐1.1% | ‐7% | 1.1 | ||
| Supervised exercise programme (recommended treatment 5 ‐ 12 weeks post‐onset) | ‐ | ‐ | 18% (26/145) | 14% (21/149) | 3.8% (P=0.07) | 27% | 1.3 | ||
| Return to work (recommended treatment 5 ‐ 12 weeks post‐onset) | ‐ | ‐ | 23% (33/145) | 17% (25/149) | 6% (P=0.14) | 36% | 1.4 | ||
| Refer to interdisciplinary programme (recommended treatment 5 ‐ 12 weeks post‐onset) | ‐ | ‐ | 0 | 2% (3/149) | ‐2% | ‐100% | 0 | ||
| Physiotherapy > 4 weeks (guideline‐discordant) | ‐ | ‐ | 42% (61/145) | 43% (64/149) | 0.9% | 2% | 1 | ||
| Continued use of spinal manipulation therapy (guideline‐discordant) | ‐ | ‐ | 3% (4/145) | 33% (49/149) | 30.1% (P=0.05) | 92% | 0.1 | ||
| (Dey 2004)* Intervention (aimed at general practitioners): guidelines discussion (educational component), patient information leaflets, access to fast‐track physiotherapy and triage services for patients with persistent symptoms (organisational component) versus usual care (control)* | X‐ray referrals | 15.1% (43/284) | 13.7% (42/308) | ‐1.4% (P=0.62) | ‐10% | 1.1 | |||
| Sickness certificates | 17.9 % (34/190) | 19.2% (40/206) | 1.3% (P=0.74) | 7% | 0.9 | ||||
| Prescriptions for opioids or muscle relaxants | 18.6% (84/452) | 18.7% (92/491) | 0.1 (P=0.99) | 1 | 1 | ||||
| Referrals to secondary care | 3.4% (33/962) | 2.3% (24/1044) | ‐1.1% (P=0.12) | ‐49% | 1.5 | ||||
| Referrals to physiotherapy or educational programme | ‐ | ‐ | 26.3% (44/167) | 13.8% (25/181) | ‐ | ‐12.6% (P=0.01) | ‐91% | 1.9 | |
| (Engers 2005)** Intervention (aimed at general practitioners): guidelines on low back pain, 2‐hour workshop, 2 scientific articles, guidelines on low back pain for occupational physicians, tool for patient education and management‐decision tool. Control group: usual care | Referral to a therapist | ‐ | ‐ | 22.9% (75/328) | 27.4% (79/288) | ‐ | 4.6% | 17% | 0.8 |
| Prescription of pain medication on a time‐contingent basis | ‐ | ‐ | 70% (139/328) | 69% (130/288) | ‐ | 2.8% | 6% | 0.9 | |
| Handed patient information leaflet | ‐ | ‐ | 36.9% (121/328) | 38.2% (110/288) | ‐ | ‐1.3% | ‐3% | 1 | |
| Advised patient to stay active | ‐ | ‐ | 95.1% (312/328) | 89.2% (257/288) | ‐ | 5.9% | 7% | 1.1 | |
| Advised patient to gradually increase activity | ‐ | ‐ | 78% (256/328) | 65.3% (188/288) | ‐ | 12.8% | 20% | 1.2 | |
| Advised patient which activities to increase at what moment | ‐ | ‐ | 18% (58/328) | 9% (26/288) | ‐ | 8.7% | 96% | 2 | |
| (French 2013)*** Intervention (aimed at general practitioners): Interactive, educational workshops plus educational material disseminated (via DVDs); Control group: usual care** | Number of x‐ray requests out of total number of patients seen | ‐ | ‐ | 0.83% (67/8,085) | 1.02% (80/7,826) | 0.2% (P=0.2) | 19% | 0.8 | |
| Number of CT requests out of total number of patients seen | ‐ | ‐ | 0.61% (64/10,419) | 0.66% (66/10,085) | ‐ | 0.0% (P=0.6) | 7% | 0.9 | |
| Intervention (aimed at physicians): notification that patient was at a high risk of disability and guidelines on management. Control group: usual care | 3‐month work absence rates | ‐ | ‐ | 28.6% (8/28) | 24% (6/25) | ‐ | ‐4.6% (NS) | ‐19% | 1.2 |
| Intervention (aimed at physicians): guideline on low back pain, 90‐minute educational session on guideline implementation delivered by local opinion leaders and audit report summarising performance against the guideline plus outreach visit. Control group: usual care plus/minus patient education (pamphlet and video) | Lumbosacral X‐ray total utilisation (% of patients based on episode of care) | 31% | 21% | 19% | 18% | 9% | ‐1% | ‐6% | 1.1 |
| Lumbosacral X‐ray not consistent with guideline | 14.5% | 8.2% | 8.1% | 8.6% | 6.8% | 0.5% | 6% | 0.9 | |
| Lumbosacral CT/MRI total utilisation (% of patients based on episode of care) | 7.6% | 5.6% | 5.6% | 7.1% | 3.5% | 1.5% | 21% | 0.8 | |
| Lumbosacral CT/MRI not consistent with guideline | 5.7% | 3.5% | 3.5% | 5.4% | 4.1% | 1.9% | 35% | 0.6 | |
| Physical therapy referral total utilisation (% of patients based on episode of care) | 12% | 13% | 10% | 13% | 2% | 3% | 23% | 0.8 | |
| Physical therapy referral not consistent with guideline | 10% | 10.9% | 9.2% | 12% | 1.9% | 2.8% | 23% | 0.8 | |
| Specialty referral total utilisation (% of patients based on episode of care) | 12% | 5.9% | 8.6% | 7.1% | 4.6% | ‐1.5% | ‐21% | 1.2 | |
| Specialty referral not consistent with guideline | 9.5% | 4% | 7.1% | 5.6% | 4% | ‐1.5% | ‐27% | 1.3 |
1. Intervention group pre‐intervention proportion
2. Control group pre‐intervention proportion
3. Intervention group post‐intervention proportion
4. Control group post‐intervention proportion
5. ARD = [Int post (%) minus C post (%)] minus [Int pre (%) minus C pre (%)]. The direction of effect has been adjusted so that a positive result represents a beneficial intervention outcome, according to Grimshaw 2004.
6. Risk Difference (RD) is the absolute % change post‐intervention = Int post (%) minus C post (%). This is considered to be "small" if ≤ 5%, "modest" if > 5% and ≤10%,"moderate" if > 10% but ≤ 20%, and "large" if > 20%.The direction of effect has been adjusted so that a positive result represents a beneficial intervention outcome, according to Grimshaw 2004.
7. Relative % change post = absolute % change post divided by C post (%). The direction of effect has been adjusted so that a positive result represents a beneficial intervention outcome, according to Grimshaw 2004.
8. Risk ratio (RR) = Int post (%) divided by C post (%)
C: control group; Int: intervention group; ARD: adjusted risk difference; NS: not significant
CT/MRI: computed tomography/magnetic resonance imaging
* Dey 2004 reported the Intercluster Correlation (ICC) for the results (mean cluster size=95.1) and this was used to calculate the above effective sample sizes according to chapter 16.3.4 of the Cochrane Handbook, Higgins 2011a.
** The data reported above for the study by Engers 2005 does not account for clustering. We did not have access to sufficient information to adjust the data for clustering.
***French 2013 reported Intercluster Correlation (ICC for x‐rays 0.004 and for CTs 0.003, mean cluster size=2,154) and this was used to calculate the above effective sample sizes according to chapter 16.3.4 of the Cochrane Handbook, Higgins 2011a
Different combinations of interventions were used in each study, preventing us from pooling the results. All studies used dissemination of educational materials as a component of their intervention. Five studies used some form of educational meeting/educational outreach. The outcomes measured varied widely and included GP behaviour‐related outcomes, such as guideline‐consistent advice and x‐ray requests, and patient‐related outcomes, such as pain scores.
Bishop 2006 compared GP education (guidelines) and three patient‐specific reminder letters to GPs versus GP and patient education and reminders versus a control group. Several outcomes were measured assessing professional behaviour (clinician adherence to the guidelines) and for the majority of these outcomes the study showed that the interventions may lead to little or no improvements (RD < 5%).
Dey 2004 showed that outreach visits to GP practices to promote national guidelines on acute low back pain were unsuccessful in changing GP behaviour with regard to ordering x‐rays, issuing sickness certificates and prescribing opioids. Access to fast‐track physiotherapy and a back‐pain triage unit seemed to result in more referrals (RD 12.6%).
Engers 2005 showed that a complex intervention including the Dutch low back pain management guideline dissemination, a two‐hour workshop, two scientific articles, additional guidance on low back pain management for occupational physicians, a patient‐education tool and a management‐decision tool may be unsuccessful in improving GP behaviour with regard to prescribing and advising the patient, but may lead to reduced onward referrals to a therapist at follow‐up (RD 39.2%, 36% in the intervention group versus 76% in the control group, clustered adjusted OR 0.2, 95% CI (0.1 to 0.6)). These results were self‐reported and there is therefore some risk of bias. The study did not provide adequate data to allow the re‐calculation of effect sizes taking into account the effect of clustering.
French 2013 used interactive, educational workshops aiming to facilitate GP behavioural change and the dissemination of educational materials in the form of a DVD. It showed that the intervention may lead to little or no difference in the number of x‐ray and CT requests (RD ‐0.2% and 0.0% respectively).The study had a potentially high risk of bias, as its primary outcomes (patient‐related outcomes) were not measured and GP behaviour‐related outcomes were reported instead.
Hazard 1997 used a risk stratification tool alerting GPs of patients at high risk of disability, and disseminated guidance on low back pain management. The study was very small (just 53 participants) and showed that the intervention may result in no improvement in patient‐related outcomes (absence from work, RD ‐4.6%).
Kerry 2000 compared an intervention group (dissemination of guidelines on the use of radiology and audit/feedback on numbers of radiological referrals) to a control group of practices, and reported on GP behaviour‐related outcomes (numbers of spinal x‐ray requests over a year). The study did not report the means and standard deviations but showed a cluster‐adjusted reduction of spinal x‐ray requests of 20% between the intervention and control groups (95% CI 4 to 36, P<0.05). There was no assessment of the impact on the quality of these requests and their concordance with the guidelines.
Schectman 2003 compared an intervention including guideline dissemination on low back pain, a 90‐minute educational session delivered by local opinion leaders and two audit/feedback reports summarising GP performance to a control group, part of which had access to patient education materials (pamphlet and video). The intervention may result in little or no improvement in guideline‐consistent GP behaviour. There was no statistically significant change in GP behaviour with regard to the utilisation of individual services, which were the main outcome measures used in the study, and the RDs were small (RD < 5%) across all outcomes including guideline‐consistent behaviour. Additionally, the initial four groups of the study were collapsed into two (GP intervention versus no GP intervention), after analysis of the impact of the patient‐education component of the intervention revealed no effect on clinical service utilisation. This retrospective pooling of the results and the possibility of contamination between the groups may have introduced bias.
In summary, the studies on back pain used interventions with multiple components, mainly including dissemination of educational materials and educational meetings/outreach, and showed that these interventions may result in little or no improvement in GP behaviour and patient‐related outcomes (Bishop 2006; Dey 2004; Engers 2005; French 2013; Hazard 1997; Schectman 2003). The combination of guidelines and audit/feedback may result in a slight reduction in spinal radiology requests according to one study (Kerry 2000).
Low back pain studies: evaluations of interventions compared to another intervention
Three low back pain studies (Becker 2008; Bishop 2006; Eccles 2001) compared one intervention against a different intervention. The results of these studies are summarised in Table 10 (dichotomous data) and Table 11 (continuous data).
| (Study) Intervention 1 versus intervention 2 | Outcome | Int 1 pre (%) 1 | Int 2 pre (%)2 | Int 1 post (%)3 | Int 2 post (%)4 | ARD 5 | Risk difference 6 (P value if reported by authors) | Relative % change post 7 | Risk ratio 8 |
| Physician education (guidelines) and 3 patient‐specific reminder letters versus physician education, reminders and also patient education and 3 reminders | Education and reassurance according to guideline 0 ‐ 4 weeks post‐onset | ‐ | ‐ | 10% (16/162) | 6% (9/151) | ‐ | 3.9% (NS) | 66% | 1.7 |
| Exercise according to guideline 0 ‐ 4 weeks post‐onset | ‐ | ‐ | 38% (62/162) | 53% (80/151) | ‐ | ‐14.7% (P=0.0083) | ‐28% | 0.7 | |
| Appropriate medication according to guideline 0 ‐ 4 weeks post‐onset | ‐ | ‐ | 85% (138/162) | 81% (122/151) | ‐ | 4.4% (NS) | 5% | 1.1 | |
| Spinal manipulation according to guideline 0 ‐ 4 weeks post‐onset | ‐ | ‐ | 2.5% (4/162) | 5% (13/151) | ‐ | ‐6.1% (P=0.018) | ‐71% | 0.3 | |
| Guideline‐discordant physician‐recommended treatment 0 ‐ 4 weeks post‐onset | ‐ | ‐ | 10% (16/162) | 18% (27/151) | ‐ | 8% (P=0.04) | 45% | 0.6 | |
| Supervised exercise programme (recommended treatment 5 ‐ 12 weeks post‐onset) | ‐ | ‐ | 19% (29/154) | 18% (26/145) | ‐ | 0.9% (NS) | 5% | 1.1 | |
| Return to work (recommended treatment 5 ‐ 12 weeks post‐onset) | ‐ | ‐ | 24% (37/154) | 23% (33/145) | ‐ | 1.3% (NS) | 6% | 1.1 | |
| Refer to interdisciplinary programme (recommended treatment 5 ‐ 12 weeks post‐onset) | ‐ | ‐ | 4% (6/154) | 0 | ‐ | 3.9% (P=0.02) | ‐ | ‐ | |
| Physiotherapy > 4 weeks (guideline‐discordant) | ‐ | ‐ | 41% (63/154) | 42% (61/145) | ‐ | 1.2% (NS) | 3% | 1 | |
| Continued use of spinal manipulation therapy (guideline‐discordant) | ‐ | ‐ | ‐ (no data available) | 3% (4/145) | ‐ | ‐ | ‐ | ‐ | |
| (Eccles 2001)* Feedback on number of spinal radiographs 6 months before and 6 months after the intervention plus guideline dissemination versus guideline dissemination | Lumbar spine radiographs concordant with guidelines | ‐ | ‐ | 35.4% (64/181) | 43.6% (120/275) | ‐ | ‐8.3% | ‐19% | 0.8 |
| (Eccles 2001)* Reminder messages on radiograph reports plus guideline dissemination versus guideline dissemination | Lumbar spine radiographs concordant with guidelines | ‐ | ‐ | 41.2% (35/85) | 43.6% (120/275) | ‐ | ‐2.5% | ‐6% | 0.9 |
| (Eccles 2001)* Feedback on number of spinal radiographs 6 months before and 6 months after the intervention plus guideline dissemination plus reminder messages on radiograph reports versus guideline dissemination | Lumbar spine radiographs concordant with guidelines | ‐ | ‐ | 36% (89/247) | 43.6% (120/275) | ‐ | ‐7.6% | ‐17% | 0.8 |
| (Eccles 2001)* Feedback on number of spinal radiographs 6 months before and 6 months after the intervention plus guideline dissemination versus reminder messages on radiograph reports plus guideline dissemination | Lumbar spine radiographs concordant with guidelines | ‐ | ‐ | 35.4% (64/181) | 41.2% (35/85) | ‐ | ‐5.8% | ‐14% | 0.9 |
1. Intervention 1 group pre‐intervention proportion
2. Intervention 2 group pre‐intervention proportion
3. Intervention 1 group post‐intervention proportion
4. Intervention 2 group post‐intervention proportion
5. ARD = [Int 1 post (%) minus Int 2 post (%)] minus [Int 1 pre (%) minus Int 2 pre (%)]. The direction of effect has been adjusted so that a positive result represents a beneficial intervention 1 outcome, according to Grimshaw 2004.
6. Risk Difference (RD) is the absolute % change post‐intervention = Int 1 post (%) minus Int 2 post (%). This is considered to be "small" if ≤ 5%, "modest" if > 5% and ≤10%,"moderate" if > 10% but ≤ 20%, and "large" if > 20%.The direction of effect has been adjusted so that a positive result represents a beneficial intervention 1 outcome.
7. Relative % change post = absolute % change post divided by Int 2 post (%). The direction of effect has been adjusted so that a positive result represents a beneficial intervention 1 outcome, according to Grimshaw 2004.
8. Risk ratio (RR) = Int 1 post (%) divided by Int 2 post (%)
Int 1: intervention 1 group; Int 2: Intervention 2 group; ARD: Adjusted risk difference; NS: not significant
*The data reported above for the study by Eccles 2001 does not account for clustering. We did not have access to sufficient information to adjust the data for clustering.
| (Study) Intervention 1 versus Intervention 2 | Outcome | Int 1 pre mean (SD)1 | Int 2 pre mean (SD)2 | Int 1 post mean (SD)3 | Int 2 post mean (SD)4 | MD 5 | Relative % change 6 | Adjusted relative % change7 | SMD8 (P value)9 |
| (Becker 2008*) Physician education: Guideline (in 4 versions including patient leaflet), 3 seminars and academic detailing versus guideline dissemination | Functional capacity measured by Hannover Functional Ability Questionnaire at 6 months | ‐ | ‐ | 72.9 | 70.3 | 2.7 | 4% | ‐ | 0.1 (P=0.12) |
| (Becker 2008*) Physician education (as above) plus practice nurse training in motivational counselling versus guideline dissemination | Functional capacity measured by Hannover Functional Ability Questionnaire at 6 months | ‐ | ‐ | 73.9 | 70.3 | 3.6 | 5% | ‐ | 0.2 (P=0.032) |
| (Becker 2008*) Physician education: Guideline (in 4 versions including patient leaflet), 3 seminars and academic detailing versus guideline dissemination | Days in pain at 6 months | ‐ | ‐ | 63.3 | 80.8 | 17.4 | 22% | ‐ | 0.2 (P=0.002) |
| (Becker 2008*) Physician education (as above) plus practice nurse training in motivational counselling versus guideline dissemination | Days in pain at 6 months | ‐ | ‐ | 62.9 | 80.8 | 17.9 | 22% | ‐ | 0.2 (P=0.001) |
| (Becker 2008*) Physician education: Guideline (in 4 versions including patient leaflet), 3 seminars and academic detailing versus guideline dissemination | Overall activity at 6 months | ‐ | ‐ | 36.5 | 33.5 | 3 | 9% | ‐ | 0.1 (P=0.203) |
| (Becker 2008*) Physician education (as above) plus practice nurse training in motivational counselling versus guideline dissemination | Overall activity at 6 months | ‐ | ‐ | 36.3 | 33.5 | 2.8 | 8% | ‐ | 0.1 (P=0.230) |
| (Becker 2008*) Physician education: Guideline (in 4 versions including patient leaflet), 3 seminars and academic detailing versus guideline dissemination | Days of sick leave at 6 months | ‐ | ‐ | 13 | 14.3 | 1.3 | 9% | ‐ | 0 (P=0.569) |
| (Becker 2008*) Physician education (as above) plus practice nurse training in motivational counselling versus guideline dissemination | Days of sick leave at 6 months | ‐ | ‐ | 13 | 14.3 | 1.3 | 9% | ‐ | 0 (P=0.584) |
| (Becker 2008*) Physician education: Guideline (in 4 versions including patient leaflet), 3 seminars and academic detailing versus guideline dissemination | Quality of life at 6 months | ‐ | ‐ | 66.6 | 66.8 | ‐0.3 | 0% | ‐ | 0 (P=0.847) |
| (Becker 2008*) Physician education (as above) plus practice nurse training in motivational counselling versus guideline dissemination | Quality of life at 6 months | ‐ | ‐ | 67.5 | 66.8 | 0.7 | 1% | ‐‐ | 0 (P=0.602) |
| (Becker 2008*) Physician education: Guideline (in 4 versions including patient leaflet), 3 seminars and academic detailing versus guideline dissemination | Functional capacity measured by Hannover Functional Ability Questionnaire at 12 months | ‐ | ‐ | 73 | 71.6 | 1.4 | 2% | ‐ | 0.1 (P=0.446) |
| (Becker 2008*) Physician education (as above) plus practice nurse training in motivational counselling versus guideline dissemination | Functional capacity measured by Hannover Functional Ability Questionnaire at 12 months | ‐ | ‐ | 74.6 | 71.6 | 3.1 | 4% | ‐ | 0.1 (P=0.088) |
| (Becker 2008*) Physician education: Guideline (in 4 versions including patient leaflet), 3 seminars and academic detailing versus guideline dissemination | Days in pain at 12 months | ‐ | ‐ | 58.5 | 71.3 | 12.8 | 18% | ‐ | 0.2 (P=0.018) |
| (Becker 2008*) Physician education (as above) plus practice nurse training in motivational counselling versus guideline dissemination | Days in pain at 12 months | ‐ | ‐ | 61.6 | 71.3 | 9.8 | 14% | ‐ | 0.1 (P=0.067) |
| (Becker 2008*) Physician education: Guideline (in 4 versions including patient leaflet), 3 seminars and academic detailing versus guideline dissemination | Overall activity at 12 months | ‐ | ‐ | 46.4 | 42.9 | 3.5 | 8% | ‐ | 0.1 (P=0.202) |
| (Becker 2008*) Physician education (as above) plus practice nurse training in motivational counselling versus guideline dissemination | Overall activity at 12 months | ‐ | ‐ | 45.4 | 42.9 | 2.5 | 6% | ‐ | 0.1 (P=0.396) |
| (Becker 2008*) Physician education: Guideline (in 4 versions including patient leaflet), 3 seminars and academic detailing versus guideline dissemination | Days of sick leave at 12 months | ‐ | ‐ | 6.2 | 9.3 | 3.1 | 34% | ‐ | 0.1 (P=0.256) |
| (Becker 2008*) Physician education (as above) plus practice nurse training in motivational counselling versus guideline dissemination | Days of sick leave at 12 months | ‐ | ‐ | 6.5 | 9.3 | 2.8 | 30% | ‐ | 0.1 (P=0.320) |
| (Becker 2008*) Physician education: Guideline (in 4 versions including patient leaflet), 3 seminars and academic detailing versus guideline dissemination | Quality of life at 12 months | ‐ | ‐ | 68.5 | 67.7 | 0.8 | 1% | ‐ | 0 (P=0.535) |
| (Becker 2008*) Physician education (as above) plus practice nurse training in motivational counselling versus guideline dissemination | Quality of life at 12 months | ‐ | ‐ | 70.4 | 67.7 | 2.7 | 4% | ‐ | 0.1 (P=0.036) |
| (Becker 2008*) Physician education: Guideline (in 4 versions including patient leaflet), 3 seminars and academic detailing vs physician education plus practice nurse training in motivational counselling | Functional capacity measured by Hannover Functional Ability Questionnaire at 6 months | ‐ | ‐ | 72.9 | 73.9 | ‐1 | ‐1% | ‐ | 0 (NR) |
| (Becker 2008*) Physician education: Guideline (in 4 versions including patient leaflet), 3 seminars and academic detailing vs physician education plus practice nurse training in motivational counselling | Days in pain at 6 months | ‐ | ‐ | 63.3 | 62.9 | ‐0.4 | ‐1% | ‐ | 0 (NR) |
| (Becker 2008*) Physician education: Guideline (in 4 versions including patient leaflet), 3 seminars and academic detailing vs physician education plus practice nurse training in motivational counselling | Overall activity at 6 months | ‐ | ‐ | 36.5 | 36.3 | 0.2 | 0% | ‐ | 0 (NR) |
| (Becker 2008*) Physician education: Guideline (in 4 versions including patient leaflet), 3 seminars and academic detailing vs Physician education plus practice nurse training in motivational counselling | Days of sick leave at 6 months | ‐ | ‐ | 13 | 13.1 | 0.1 | 0% | ‐ | 0 (NR) |
| (Becker 2008*) Physician education: Guideline (in 4 versions including patient leaflet), 3 seminars and academic detailing vs Physician education plus practice nurse training in motivational counselling | Quality of life at 6 months | ‐ | ‐ | 66.6 | 67.5 | ‐0.9 | ‐1% | ‐ | 0 (NR) |
| (Becker 2008*) Physician education: Guideline (in 4 versions including patient leaflet), 3 seminars and academic detailing vs Physician education plus practice nurse training in motivational counselling | Functional capacity measured by Hannover Functional Ability Questionnaire at 12 months | ‐ | ‐ | 73 | 74.6 | ‐1.7 | ‐2% | ‐ | ‐0.1 (NR) |
| (Becker 2008*) Physician education: Guideline (in 4 versions including patient leaflet), 3 seminars and academic detailing vs Physician education plus practice nurse training in motivational counselling | Days in pain at 12 months | ‐ | ‐ | 58.5 | 61.6 | 3.1 | 5% | ‐ | 0 (NR) |
| (Becker 2008*) Physician education: Guideline (in 4 versions including patient leaflet), 3 seminars and academic detailing vs Physician education plus practice nurse training in motivational counselling | Overall activity at 12 months | ‐ | ‐ | 46.4 | 45.4 | 1 | 2% | ‐ | 0 (NR) |
| (Becker 2008*) Physician education: Guideline (in 4 versions including patient leaflet), 3 seminars and academic detailing vs Physician education plus practice nurse training in motivational counselling | Days of sick leave at 12 months | ‐ | ‐ | 6.2 | 6.458 | 0.3 | 5% | ‐ | 0 (NR) |
| (Becker 2008*) Physician education: Guideline (in 4 versions including patient leaflet), 3 seminars and academic detailing vs Physician education plus practice nurse training in motivational counselling | Quality of life at 12 months | ‐ | ‐ | 68.5 | 70.4 | ‐1.9 | ‐3% | ‐ | ‐0.1 (NR) |
| (Eccles 2001)* Feedback on number of spinal radiographs 6 months before and 6 months after the intervention plus guideline dissemination versus guideline dissemination | Number of lumbar spine radiographs per 1000 patients | 7.24 (4.8) | 7.53 (4.1) | 5.97 (4.2) | 6.80 (4.3) | 0.83 | 12% | 8% | 0.2 (NR) |
| (Eccles 2001)* Reminder messages on radiograph reports plus guideline dissemination versus guideline dissemination | Number of lumbar spine radiographs per 1000 patients | 7.31 (5.2) | 7.53 (4.1) | 5.14 (3.7) | 6.80 (4.3) | 1.66 | 24% | 21% | 0.4 (P=0.05) |
| (Eccles 2001)* Feedback on number of spinal radiographs 6 months before and 6 months after the intervention plus guideline dissemination plus reminder messages on radiograph reports versus guideline dissemination | Number of lumbar spine radiographs per 1000 patients | 8.30 (5.1) | 7.53 (4.1) | 5.23 (3.7) | 6.80 (4.3) | 1.57 | 23% | 34% | 0.4 (NR) |
| (Eccles 2001)* Feedback on number of spinal radiographs 6 months before and 6 months after the intervention plus guideline dissemination versus reminder messages on radiograph reports plus guideline dissemination | Number of lumbar spine radiographs per 1000 patients | 7.24 (4.8) | 7.31 (5.2) | 5.97 (4.2) | 5.14 (3.7) | ‐0.83 | ‐16% | ‐18% | ‐0.2 (NR) |
1. Intervention 1 group pre‐intervention mean (standard deviation)
2. Intervention 2 group pre‐intervention mean (standard deviation)
3. Intervention 1 group post‐intervention mean (standard deviation)
4. Intervention 2 group postintervention mean (standard deviation)
5. Mean Difference (MD)=Difference between post‐intervention means. The direction of effect has been adjusted so that a positive result represents a beneficial intervention 1 outcome, according to Grimshaw 2004.
6. Relative percentage change post‐intervention = (Int1 post mean ‐ Int2 post mean)/Int2 post mean. The direction of effect has been adjusted so that a positive result represents a beneficial intervention 1 outcome, according to Grimshaw 2004.
7. Adjusted relative percentage change= (Int1 post mean‐Int2 post mean)‐(Int1 pre mean ‐ Int2 pre mean)/Int2 post mean. The direction of effect has been adjusted so that a positive result represents a beneficial intervention 1 outcome.
8. SMD=Standardised Mean Difference=(Int1 post mean‐Int2 post mean)/SD pooled. The direction of effect has been adjusted so that a positive result represents a beneficial intervention 1 outcome, according to Grimshaw 2004.
9. P value reported by study authors
Int 1: intervention 1 group; Int 2: Intervention 2 group; NR: not reported; SD: standard deviation
*The data reported above for Becker 2008 and Eccles 2001 was adjusted for clustering by the authors
Becker 2008 assessed the effect of GP education using guideline dissemination, three seminars and academic detailing (guideline implementation, GI group) versus a 'control group' which only received guidelines by mail and versus GP education plus practice‐nurse motivational counselling plus guidelines (motivational counselling, MC group). The study showed that the intervention resulted in little or no improvement with respect to the majority of patient‐related outcomes (functional capacity, overall activity, days of sick leave and quality of life) compared to the guideline dissemination only group. The main statistically and clinically significant improvements were with regards to fewer days in pain at 6 months for both GI and MC intervention groups (SMD 0.2, mean difference ‐16.4, 95% CI (‐26.8 to ‐6), P = 0.002 for the GI and SMD 0.2, mean difference ‐17.9, 95% CI (‐28.2 to ‐7.6), P = 0.001 for the MC group) and at 12 months for the GI group (SMD 0.2, mean difference ‐12.8, 95% CI (‐23.4 to ‐2.3), P = 0.018). There was only a small absolute and clinical difference between the GI and MC group means without consistent improvement in one group over the other across outcomes (Table 11).
Bishop 2006 showed that the added intervention of providing participants with lay‐language versions of the guidelines may not alter GP guideline‐consistent behaviour, with the only moderate improvement occurring with respect to the recommendations regarding aerobic exercise (RD 15%).
Eccles 2001 assessed the effect of audit/feedback and reminder messages on primary care knee and spinal radiology referrals. The study evaluated three intervention groups versus a 'control' group which only received guidelines. The first intervention group received feedback on the number of radiographs requested in the six months before and after the intervention. The second intervention group received educational reminder messages (ERMs) on all radiograph reports. The third intervention group received both feedback and reminders. All groups, including the 'control' group, received referral guidelines. The study showed that there may be some deterioration in the percentage of spinal radiographs which are concordant with the guidelines in the intervention groups (RD range ‐2.5% to ‐8.3%, Table 10) and a slight reduction in the number of spinal radiograph requests across the groups (SMD small for the feedback group at 0.2 and moderate for the reminder group at 0.4) as seen in Table 11. The authors of this study recommended caution in the interpretation of the data, due to a baseline imbalance between the study groups. Ramsey 2003 reported on the effect of the educational reminder messages over the 12 months after the intervention by Eccles 2001. It showed that there was a small but sustained reduction in the number of spinal radiographs in the reminder group compared to the guideline‐only group (reported RR = 0.64, 95% CI (0.43 to 0.96), P=0.029).
Low back pain studies: evaluation of interventions using interrupted time series
Hollingworth 2002 used interrupted times series to evaluate the impact of guideline dissemination on the use of lumbar spine radiography by GPs. The study did not report the mean number of radiographs at the different time periods (the trend was presented in a graph form). The study showed that the intervention may lead to no improvement in the referral patterns for radiography of the lumbar spine.The outcomes of the study are summarised in Table 12.
| Study | Intervention | Outcome | Mean pre (SD) | Mean post (SD) | Mean post minus mean pre | Relative % change pre to post | SMD pre to post | Mean change in level (p value) | Mean change in slope (p value) |
| Educational material | Back x‐rays ordered | 1133 (50) | 1208.7 (111.5) | ‐75.7 | ‐6.7 | ‐1.51 | ‐121.5 (P = 0.167) | 6.8 (P = 0.776) |
Low back pain studies: summary
In summary, the 10 studies on low back pain showed that interventions including guideline dissemination, educational reminders and face‐to‐face educational opportunities for GPs may lead to little or no improvement with regard to changing professional behaviour. Guidelines on their own may lead to little or no difference (Hollingworth 2002), while a combination of guidelines and educational meetings/outreach may result in little or no improvement (Becker 2008; Bishop 2006; Dey 2004; Engers 2005; French 2013; Hazard 1997; Schectman 2003). The combination of guidelines and audit/feedback may result in a slight reduction in radiology requests (Eccles 2001; Kerry 2000). The combination of guidelines and GP reminders may result in a slight, sustained reduction in the number of radiology requests but no improvement in their quality, as shown in Eccles 2001.
Osteoarthritis studies:
Four studies included people with osteoarthritis (Chassany 2006; Rahme 2005; Rosemann 2007; Stross 1985). All were cluster‐RCTs. One study was conducted in the USA (Stross 1985), one in France (Chassany 2006), one in Germany (Rosemann 2007), and one in Canada (Rahme 2005). The reported outcomes varied amongst the studies and included patient‐related outcomes (pain control) and GP behaviour‐related outcomes (prescribing of medication and onward referrals for radiographs, physical therapy or arthroplasty).
Osteoarthritis: evaluations of interventions compared to a no‐intervention control group
All four studies assessed a single or multifaceted intervention compared to a no‐intervention control group. The results of these studies are summarised in Table 13; and Table 14.
| (Study) Intervention | Outcome | Int pre mean (SD)1 | C pre mean (SD)2 | Int post mean (SD)3 | C post mean (SD)4 | MD 5 | Relative % change 6 | Adjusted relative % change7 | SMD8 (P value)9 |
| GP training on relationships and communication, pain evaluation, prescription and negotiation of a patient contract delivered in a 4‐hour interactive session plus 8 reminders on recommendations | Pain relief (SPID) | ‐ | ‐ | 315.6 (289.5) | 264.7 (242.9) | 50.9 | 19% | 19% | 0.2 (P< 0.0001) |
| Intensity of pain in motion on VAS | 63.7 (13.8) | 62.8 (13.5) | ‐29 (23.1) | ‐24.8 (21.1) | 4.2 | 17% | ‐21% | 0.2 (P=0.01) | |
| Lequesne Index | 9.2 (2.9) | 9.8 (3.2) | ‐2.5 (2.5) | ‐2.0 (2.4) | 0.5 | 25% | 5% | 0.2 (P< 0.0001) | |
| WOMAC index pain | 9.3 (3.0) | 9.6 (2.8) | ‐2.9 (3.4) | ‐2.2 (2.9) | 0.7 | 32% | ‐18% | 0.2 (P< 0.0001) | |
| WOMAC index stiffness | 4.1 (1.4) | 4.0 (1.4) | ‐1.2 (1.6) | ‐0.8 (1.4) | 0.4 | 50% | ‐62% | 0.3 (P=0.0004) | |
| WOMAC index physical function | 31.2 (10.9) | 32.8 (9.5) | ‐8.7 (10.7) | ‐6.1 (8.8) | 2.6 | 43% | ‐16% | 0.3 (P< 0.0001) | |
| WOMAC index global score | 44.6 (14.4) | 46.4 (12.5) | ‐12.9 (14.8) | ‐9.2 (12.2) | 3.7 | 40% | ‐21% | 0.3 (P< 0.0001) | |
| Acetaminophen consumption | ‐ | ‐ | 3400 (800) | 2900 (900) | ‐500 | ‐17% | ‐17% | ‐0.6 (P< 0.0001) | |
| Intervention (aimed at GPs): 2 interactive 8‐hour meetings focusing on arthritis self management, guideline dissemination and patient information material versus control (usual care) | Quality of life (AIMS2‐SF scores) Lower body | 2.67 (1.88) | 2.65 (1.85) | 2.48 | 2.62 | ‐0.14 | ‐5% | ‐6% | ‐0.1 (P=0.349) |
| Quality of life (AIMS2‐SF scores) Upper body | 1.47 (2.25) | 1.33 (2.09) | 1.43 | 1.34 | 0.09 | 7% | ‐4% | 0.1 P=0.694) | |
| Quality of life (AIMS2‐SF scores) Symptom | 4.87 (2.13) | 4.81 (2.18) | 4.51 | 4.72 | ‐0.21 | ‐4% | ‐6% | ‐0.2 (P=0.119) | |
| Quality of life (AIMS2‐SF scores) Affect | 2.89 (1.35) | 2.88 (1.33) | 2.92 | 2.83 | 0.09 | 3% | 3% | 0.1 (P=0.610) | |
| Quality of life (AIMS2‐SF scores) Social | 4.52 (1.88) | 4.69 (1.80) | 4.43 | 4.62 | ‐0.19 | ‐4% | 0% | ‐0.3 P=0.776 | |
| GP contacts | 4.56 (6.13) | 4.82 (6.00) | 4.44 | 4.6 | 0.16 | 3% | ‐2% | 0.1 (P=0.339) | |
| Referrals to orthopaedics | 1.58 (3.43) | 1.76 (3.52) | 1.49 | 1.75 | 0.26 | 15% | 5% | 0.8 (P=0.153) | |
| Radiographs | 0.82 (3.12) | 0.79 (2.78) | 0.75 | 0.85 | 0.1 | 12% | 15% | 0.2 (P=0.05) | |
| Non‐medical practitioners | 0.11 (3.01) | 0.36 (3.28) | 0.09 | 0.32 | 0.23 | 72% | ‐6% | 0.6 (P=0.687) | |
| Physiotherapy | 4.70 (9.10) | 5.81 (11.10) | 4.63 | 5.77 | 1.14 | 20% | 1% | 2 (P=0.242) | |
| Acupuncture | 0.83 (3.45) | 0.97 (3.80) | 0.8 | 0.97 | 0.17 | 18% | 3% | 0.2 (P=0.821) | |
| Intervention (aimed at GPs) as above plus patient case management via telephone by practice nurses versus control (usual care) | Quality of life (AIMS2‐SF scores) Lower body | 3.01 (2.11) | 2.65 (1.85) | 2.61 | 2.62 | ‐0.01 | 0% | ‐14% | 0 (P=0.049) |
| Quality of life (AIMS2‐SF scores) Upper body | 1.68 (2.44) | 1.33 (2.09) | 1.62 | 1.34 | 0.28 | 21% | ‐5% | 0.2 (P=0.621) | |
| Quality of life (AIMS2‐SF scores) Symptom | 5.02 (2.29) | 4.81 (2.18) | 4.42 | 4.72 | ‐0.3 | ‐6% | ‐11% | ‐0.2 (P=0.048) | |
| Quality of life (AIMS2‐SF scores) Affect | 3.04 (1.39) | 2.88 (1.33) | 2.98 | 2.83 | 0.15 | 5% | 0% | 0.2 (P=0.691) | |
| Quality of life (AIMS2‐SF scores) Social | 4.79 (1.80) | 4.69 (1.80) | 4.736 | 4.62 | 0.116 | 3% | 0% | 0.1 (P< 0.001) | |
| GP contacts | 5.01 (5.78) | 4.82 (6.00) | 4.9 | 4.6 | ‐0.3 | ‐7% | ‐2% | ‐0.2 (P=0.823) | |
| Referrals to orthopaedics | 1.76 (3.52) | 1.76 (3.52) | 1.52 | 1.75 | 0.23 | 13% | 13% | 0.2 (P=0.044) | |
| Radiographs | 0.80 (3.01) | 0.79 (2.78) | 0.71 | 0.85 | 0.14 | 16% | 18% | 0.4 (P=0.031) | |
| Non‐medical practitioners | 0.50 (4.20) | 0.36 (3.28) | 0.47 | 0.32 | ‐0.15 | ‐47% | ‐3% | ‐0.4 (P=0.225) | |
| Physiotherapy | 5.22 (10.03) | 5.81 (11.10) | 5.08 | 5.77 | 0.69 | 12% | 2% | 1.3 (P=0.129) | |
| Acupuncture | 0.77 (3.99) | 0.97 (3.80) | 0.72 | 1.09 | 0.37 | 34% | 16% | 0.4 (P=0.769) | |
| (Stross 1985)** Intervention: Educationally‐influential physicians (EIs) led education of primary‐care physicians: self‐study programme including textbook, audiovisual materials and recent articles on osteoarthritis versus control (usual care) | Length of stay for OA patients | 8.8 | 8.4 | 8.4 | 8.6 | 0.2 | 2% | 7% | NR |
| Length of stay for total hip arthroplasty (THA) patients | 17.2 | 16.6 | 15.2 | 16.0 | 0.8 | 5% | 9% | NR |
1. Intervention group pre‐intervention mean (standard deviation)
2. Control group pre‐intervention mean (standard deviation)
3. Intervention group post‐intervention mean (standard deviation)
4. Control group pos‐tintervention mean (standard deviation)
5. Mean Difference (MD)=Difference between post‐intervention means. The direction of effect has been adjusted so that a positive result represents a beneficial intervention outcome, according to Grimshaw 2004.
6. Relative percentage change post‐intervention = (Int post mean ‐ Control post mean)/Control post mean
7. Adjusted relative percentage change= (Int post mean‐Control post mean)‐(Int pre mean ‐ Control pre mean)/Control post mean. The direction of effect has been adjusted so that a positive result represents a beneficial intervention outcome.
8. SMD=Standardised Mean Difference=(Int post mean‐Control post mean)/SD pooled. The direction of effect has been adjusted so that a positive result represents a beneficial intervention outcome, according to Grimshaw 2004.
9. P value reported by study authors
AIMS2‐SF: Arthritis Impact Measurement Scales Short Form
WOMAC: Western Ontario and McMaster Universities Osteoarthritis Index
* There are potential unit of analysis errors in the reported results as the study did not account for clustering and did not provide sufficient data to allow an approximate analysis according to chapter 16.3.4 of the Cochrane Handbook, Higgins 2011a.
**The study did not report standard deviations and therefore we were unable to calculate the SMD. There are potential unit of analysis errors in the reported results as the study did not account for clustering and did not provide sufficient data to allow an approximate analysis according to chapter 16.3.4 of the Cochrane Handbook, Higgins 2011a.
| (Study) Intervention | Outcome | Int pre (%) 1 | C pre (%)2 | Int post (%)3 | C post (%)4 | ARD 5 | Risk difference 6 (P Value if reported by authors) | Relative % change post 7 | Risk ratio 8 |
| (Rahme 2005)* Intervention (aimed at GPs): 90‐minute workshop on management of osteoarthritis versus control group (usual care) | Number of adequate prescription, according to the guidelines | 51% (273/536) | 47% (675/1437) | 56% (251/450) | 49% (593/1209) | 3% | 7% | 14% | 1.1 |
| (Rahme 2005)* Intervention (aimed at GPs): decision tree on treatment choices for osteoarthritis patients versus control (usual care) | Number of adequate prescription, according to the guidelines | 51% (799/1569) | 47% (675/1437) | 54% (712/1317) | 49% (593/1209) | 1% | 5% | 10% | 1.1 |
| (Rahme 2005)* Intervention (aimed at GPs): 90‐minute workshop and decision tree as above versus control (usual care) | Number of adequate prescription, according to the guidelines | 58% (1022/1776) | 47% (675/1437) | 62% (1008/1634) | 49% (593/1209) | 2% | 13% | 26% | 1.3 |
| Intervention (aimed at GPs): 2 interactive 8‐hour meetings focusing on arthritis self management, guideline dissemination and patient information material versus control (usual care) | Paracetamol prescriptions | 8.9% (31/345) | 6.6% (22/332) | 16.4% | 5.3% | 8.7% | 11.1% (<0.001) | 209% | 3.1 |
| Opioids | 5.8% (20/345) | 6.9% (23/332) | 10.1% | 7.9% | 3.4% | 2.2% (NS) | 28% | 1.3 | |
| NSAID | 40% (138/345) | 41.9% (139/332) | 44.3% | 44.2% | 2.0% | 0.1% (NS) | 23% | 1.0 | |
| Homeopathics | 6.1% (21/345) | 8.1% (27/332) | 7.7% | 9.8% | ‐0.1% | ‐2.2% (NS) | ‐22% | 0.8 | |
| Intervention (aimed at GPs) as above plus patient case management via telephone by practice nurses versus control (usual care) | Paracetamol prescriptions | 7.3% (25/345) | 6.6% (22/332) | 14.1% | 5.3% | 8.2% | 8.8% (<0.01) | 166% | 2.7 |
| Opioids | 7.3% (25/345) | 6.9% (23/332) | 16.0% | 7.9% | 7.8% | 8.1% (< 0.01) | 102% | 2.0 | |
| NSAID | 43.3% (149/345) | 41.9% (139/332) | 49.7% | 44.2% | 4.3% | 5.6% (0.019) | 13% | 1.1 | |
| Homeopathics | 6.7% (23/345) | 8.1% (27/332) | 9.6% | 9.8% | 1.2% | ‐0.2% (NS) | ‐2% | 1.0 | |
| (Stross 1985)* Intervention: Educationally‐influential physicians (EIs) led education of primary‐care physicians: self‐study programme including textbook, audiovisual materials and recent articles on osteoarthritis versus control (usual care) | Management of OA patients with aspirin | 39% (9/23) | 50% (9/18) | 20% (6/30) | 28% (5/18) | 3% | ‐8% | ‐28% | 0.7 |
| Management of OA patients with NSAIDs | 83% (19/23) | 78% (14/18) | 87% (26/30) | 94% (17/18) | ‐13% | ‐8% | ‐8% | 0.9 | |
| Management of OA patients with systemic corticosteroids | 13% (3/23) | 17% (3/18) | 3% (1/30) | 22% (4/18) | 15% | 19% (< 0.05) | 85% | 0.2 | |
| Management of OA patients with intra‐articular corticosteroids | 17% (4/23) | 11% (2/18) | 40% (12/30) | 11% (2/18) | 23% | 29% (<0.05) | 260% | 3.6 | |
| Management of OA patients with physical therapy | 87% (20/23) | 83% (15/18) | 93% (28/30) | 83% (15/18) | 6% | 10% | 12% | 1.1 | |
| Referral of OA patients | 39% (9/23) | 39% (7/18) | 30% (9/30) | 33% (6/18) | ‐4% | 3% | 10% | 0.9 | |
| Pre‐op physical therapy of THA patients | 56% (10/18) | 46% (12/26) | 97% (35/36) | 40% (12/30) | 48% | 57% (< 0.05) | 143% | 2.4 | |
| Post‐op narcotics of THA patients | 72% (13/18) | 77% (20/26) | 89% (32/36) | 93% (28/30) | 0% | 4% | 5% | 1.0 | |
| Post‐op physical therapy of THA patients | 100% (18/18) | 100% (26/26) | 100% (36/36) | 100% (30/30) | 0% | 0% | 0% | 1.0 | |
| Post‐op complications of THA patients | 11% (2/18) | 15% (4/26) | 6% (2/36) | 13% (4/30) | 4% | 8% | 58% | 0.4 |
1. Intervention group pre‐intervention proportion
2. Control group pre‐intervention proportion
3. Intervention group post‐intervention proportion
4. Control group post‐intervention proportion
5. ARD = [Int post (%) minus C post (%)] minus [Int pre (%) minus C pre (%)]. The direction of effect has been adjusted so that a positive result represents a beneficial intervention outcome, according to Grimshaw 2004.
6. Risk Difference (RD) is the absolute % change post‐intervention = Int post (%) minus C post (%). This is considered to be "small" if ≤ 5%, "modest" if > 5% and ≤10%,"moderate" if > 10% but ≤ 20%, and "large" if > 20%.The direction of effect has been adjusted so that a positive result represents a beneficial intervention outcome, according to Grimshaw 2004.
7. Relative % change post = absolute % change post divided by C post (%). The direction of effect has been adjusted so that a positive result represents a beneficial intervention outcome, according to Grimshaw 2004.
8. Risk ratio (RR) = Int post (%) divided by C post (%)
C: control group; Int: intervention group; ARD: Adjusted risk difference; NS: not significant
NSAID: non‐steroidal anti‐inflammatory drug, THA: total hip arthroplasty
* There are unit of analysis errors in the reported results because the available data did not account for the effect of clustering.
Chassany 2006 evaluated the effect of a four‐hour interactive training session for GPs on relationships and communication, pain evaluation, prescribing and negotiating a patient contract. Following the training, eight letters emphasising the recommendations were mailed to the participants. The intervention resulted in small improvements with regard to patient‐related outcomes such as pain and disability scores (WOMAC index global score) (SMD <0.40, P<0.05 across all outcomes, Table 13). The relative limitation of the study was that results were assessed within two weeks of the trial, so it is unclear whether the positive patient outcomes persisted.
Rahme 2005 evaluated three intervention groups (a 90‐minute interactive workshop group on osteoarthritis management, a decision tree on osteoarthritis management, and a combination of the two interventions) with a control (usual care) group. The results showed a probable slight improvement in osteoarthritis guideline‐consistent GP behaviour (prescribing of medication) in all three groups. The highest RD was 13% for the combined intervention while the dissemination of educational material (decision tree) on its own resulted in a 5% RD.
Rosemann 2007 evaluated two interactive eight‐hour GP meetings focusing on education and guideline dissemination with and without nurse case management, and showed some improvements with regard to GP behaviour‐related outcomes (reduced referrals to orthopaedic surgeons: SMD 0.8 for the educational intervention and 0.2 for the combined intervention, reduced referrals for radiographs: SMD 0.2 and 0.4 respectively and increased prescriptions for painkillers: RDs between ‐2.2 and 11.1%). There were small or no improvements with regard to patient related outcomes (quality of life: SMD <0.40).
Stross 1985 evaluated a complex intervention which was delivered by educationally influential physicians (EIs) and targeted GPs. It comprised a self‐study programme including textbook, audiovisual materials and recent articles on osteoarthritis. This was a small study and showed that the intervention may improve guideline‐consistent GP behaviour by increasing the intra‐articular corticosteroids (RD large at 29%) and reducing the use of systemic corticosteroids (RD moderate at 19%) in osteoarthritis patients. There were small reductions in the length of stay (MD 0.2 days for osteoarthritis and 0.8 days for total hip arthroplasty, Table 13). In those patients undergoing total hip arthroplasty, there may be an increase in the utilisation of physical therapy pre‐operatively (RD large at 57%).
Osteoarthritis: evaluations of interventions compared to another intervention
When comparing the three intervention groups (a 90‐minute interactive workshop group on osteoarthritis management, a decision tree on osteoarthritis management, and a combination of the two interventions) in the study by Rahme 2005, the combined intervention resulted in modest improvements in GP behaviour (medication prescribing) compared to the single faceted interventions (Table 15).
| (Study) Intervention 1 versus intervention 2 | Outcome | Int 1 pre (%) 1 | Int 2 pre (%)2 | Int 1 post (%)3 | Int 2 post (%)4 | ARD 5 | Risk difference 6 (P value if reported by authors) | Relative % change post 7 | Risk ratio 8 |
| (Rahme 2005)* Intervention 1 (aimed at GPs): 90‐minute workshop on management of osteoarthritis versus Intervention 2 (aimed at GPs): decision tree on treatment choices for osteoarthritis patients | Number of adequate prescription, according to the guidelines | 51% (273/536) | 51% (799/1569) | 56% (251/450) | 54% (712/1317) | 1.7% | 1.7% | 3% | 1 |
| (Rahme 2005)* Intervention 1 (aimed at GPs): 90‐minute workshop on management of osteoarthritis versus Intervention 2 (aimed at GPs): 90‐minute workshop and decision tree | Number of adequate prescription, according to the guidelines | 51% (273/536) | 58% (1022/1776) | 56% (251/450) | 62% (1008/1634) | 0.7% | ‐5.9% | ‐10% | 0.9 |
| (Rahme 2005)* Intervention 1 (aimed at GPs):decision tree on treatment choices for osteoarthritis patients versus Intervention 2 (aimed at GPs): 90‐minute workshop and decision tree | Number of adequate prescription, according to the guidelines | 51% (799/1569) | 58% (1022/1776) | 54% (712/1317) | 62% (1008/1634) | ‐1% | ‐7.6% | ‐12% | 0.9 |
| Intervention (aimed at GPs): 2 interactive 8‐hour meetings focusing on arthritis self management, guideline dissemination and patient information material versus Intervention (aimed at GPs) as above plus patient case management via telephone by practice nurses | Paracetamol prescriptions | 8.9% (31/345) | 7.3% (25/345) | 16.4% | 14.1% | 0.5% | 2.3% | 16% | 1.2 |
| Opioids | 5.8% (20/345) | 7.3% (25/345) | 10.1% | 16.0% | ‐4.5% | ‐5.9% | ‐37% | 1.2 | |
| NSAID | 40% (138/345) | 43.3% (149/345) | 44.3% | 49.7% | ‐2.2% | ‐5.4% | ‐11% | 1.2 | |
| Homeopathics | 6.1% (21/345) | 6.7% (23/345) | 7.7% | 9.6% | ‐1.4% | ‐1.9% | ‐20% | 1.2 |
1. Intervention 1 group pre‐intervention proportion
2. Intervention 2 group pre‐intervention proportion
3. Intervention 1 group post‐intervention proportion
4. Intervention 2 group post‐intervention proportion
5. ARD = [Int 1 post (%) minus Int 2 post (%)] minus [Int 1 pre (%) minus Int 2 pre (%)]. The direction of effect has been adjusted so that a positive result represents a beneficial intervention 1 outcome, according to Grimshaw 2004.
6. Risk Difference (RD) is the absolute % change post‐intervention = Int 1 post (%) minus Int 2 post (%). This is considered to be "small" if ≤ 5%, "modest" if > 5% and ≤10%,"moderate" if > 10% but ≤ 20%, and "large" if > 20%.The direction of effect has been adjusted so that a positive result represents a beneficial intervention 1 outcome.
7. Relative % change post = absolute % change post divided by Int 2 post (%). The direction of effect has been adjusted so that a positive result represents a beneficial intervention 1 outcome, according to Grimshaw 2004.
8. Risk ratio (RR) = Int 1 post (%) divided by Int 2 post (%)
Int 1: intervention 1 group; Int 2: Intervention 2 group; ARD: adjusted risk difference; NS: not significant, NSAID: non‐steroidal anti‐inflammatory drug
* There are unit of analysis errors in the reported results because the available data did not account for the effect of clustering.
There was little or no difference with regard to the prescriptions of painkillers (RD < 5.9%, Table 15), referrals to other services (SMD <0.20 for the majority of outcomes, Table 16) and patient related outcomes (quality of life) (SMD <0.20, Table 16) with the addition of nurse case management in the study by Rosemann 2007.
| (Study) Intervention 1 versus Intervention 2 | Outcome | Int 1 pre mean (SD)1 | Int 2 pre mean (SD)2 | Int 1 post mean (SD)3 | Int 2 post mean (SD)4 | MD 5 | Relative % change 6 | Adjusted relative % change7 | SMD8 (P value)9 |
| Intervention (aimed at GPs): 2 interactive 8‐hour meetings focusing on arthritis self management, guideline dissemination and patient information material versus Intervention (aimed at GPs) as above plus patient case management via telephone by practice nurses | Quality of life (AIMS2‐SF scores) Lower body | 2.67 (1.88) | 3.01 (2.11) | 2.48 (1.1) | 2.61 (1.4) | ‐0.13 | ‐5% | 0% | ‐0.1 |
| Quality of life (AIMS2‐SF scores) Upper body | 1.47 (2.25) | 1.68 (2.44) | 1.43 (1.5) | 1.62 (1.3) | ‐0.19 | ‐12% | ‐6% | ‐0.1 | |
| Quality of life (AIMS2‐SF scores) Symptom | 4.87 (2.13) | 5.02 (2.29) | 4.51 (1.0) | 4.42 (1.8) | 0.09 | 2% | 12% | 0.1 | |
| Quality of life (AIMS2‐SF scores) Affect | 2.89 (1.35) | 3.04 (1.39) | 2.92 (0.8) | 2.98 (0.9) | ‐0.06 | ‐2% | ‐1% | ‐0.1 | |
| Quality of life (AIMS2‐SF scores) Social | 4.52 (1.88) | 4.79 (1.80) | 4.43 (0.6) | 4.736 (1.2) | ‐0.31 | ‐6% | ‐25% | ‐0.3 | |
| GP contacts | 4.56 (6.13) | 5.01 (5.78) | 4.44 (1.7) | 4.9 (1.6) | 0.46 | 9% | 37% | 0.3 | |
| Referrals to orthopaedics | 1.58 (3.43) | 1.76 (3.52) | 1.49 (0.4) | 1.52 (1.3) | 0.03 | 2% | ‐9% | 0.0 | |
| Radiographs | 0.82 (3.12) | 0.80 (3.01) | 0.75 (0.6) | 0.71 (0.4) | ‐0.04 | ‐6% | ‐1% | ‐0.1 | |
| Non‐medical practitioners | 0.11 (3.01) | 0.50 (4.20) | 0.09 (0.4) | 0.47 (0.4) | 0.38 | 81% | ‐45% | 0.9 | |
| Physiotherapy | 4.70 (9.10) | 5.22 (10.03) | 4.63 (0.6) | 5.08 (0.6) | 0.45 | 9% | 35% | 0.7 | |
| Acupuncture | 0.83 (3.45) | 0.77 (3.99) | 0.8 (1.3) | 0.72 (1.3) | ‐0.08 | ‐11% | 0% | ‐0.1 |
1. Intervention 1 group pre‐intervention mean (standard deviation)
2. Intervention 2 group pre‐intervention mean (standard deviation)
3. Intervention 1 group post‐intervention mean (standard deviation)
4. Intervention 2 group postintervention mean (standard deviation)
5. Mean Difference (MD)=Difference between post‐intervention means. The direction of effect has been adjusted so that a positive result represents a beneficial intervention 1 outcome, according to Grimshaw 2004.
6. Relative percentage change post‐intervention = (Int1 post mean ‐ Int2 post mean)/Int2 post mean. The direction of effect has been adjusted so that a positive result represents a beneficial intervention 1 outcome, according to Grimshaw 2004.
7. Adjusted relative percentage change= (Int1 post mean‐Int2 post mean)‐(Int1 pre mean ‐ Int2 pre mean)/Int2 post mean. The direction of effect has been adjusted so that a positive result represents a beneficial intervention 1 outcome.
8. SMD=Standardised Mean Difference=(Int1 post mean‐Int2 post mean)/SD pooled. The direction of effect has been adjusted so that a positive result represents a beneficial intervention 1 outcome, according to Grimshaw 2004.
9. P value reported by study authors
AIMS2‐SF: Arthritis Impact Measurement Scales Short Form
* There are unit of analysis errors in the reported results because the available data did not account for the effect of clustering.
Osteoarthritis studies: summary
Educational sessions, workshops and guidelines on the management of osteoarthritis were the main interventions evaluated, and they may result in some positive changes in GP behaviour and patient‐related outcomes. Chassany 2006 showed that the intervention may result in little improvement in patient outcomes (pain and disability) after training GPs in pain evaluation, management and communication. Rahme 2005 and Stross 1985 showed modest improvements in GP prescribing after clinician education, but the results were not confirmed in Rosemann 2007. Stross 1985 delivered the educational intervention via local educationally influential physicians and showed that it may lead to an improvement in guideline‐consistent GP behaviour.
Shoulder pain studies:
Three studies evaluated interventions aiming to improve the management of shoulder pain by GPs (Broadhurst 2007; Gormley 2003; Watson 2008). The studies were set in Australia (Broadhurst 2007), Northern Ireland (Gormley 2003), and the UK (Watson 2008). Broadhurst 2007 was a controlled before‐and‐after (CBA) study with two intervention and two control groups, while Gormley 2003 was a randomised controlled trial (RCT) and Watson 2008 a cluster‐RCT. All studies used educational interventions in the format of meetings or educational outreach.
Shoulder pain: evaluations of interventions compared to a no‐intervention control group
Broadhurst 2007 evaluated the effect of academic detailing on the management of shoulder pain and recorded the number of shoulder x‐rays and ultrasound scans before, during and after the intervention. The time‐adjusted rates of imaging requests were reported, but not the absolute numbers, means or standard deviations. There was no evidence to suggest a change in the rate of x‐ray requests over the different time periods between the intervention and the control groups (P = 0.11). Requests for ultrasound imaging were approximately 43.8% higher in the period two years before academic detailing compared to six months after in the academic detailing group, but an upward trend towards the baseline was observed in the period six months to one year after the intervention. The intervention may result in a temporary, slight reduction in ultrasound requests, but little or no change in the x‐ray requests.
Watson 2008 reported on the SAPPHIRE randomised controlled trial (Table 17). The intervention consisted of a 60‐minute lecture on shoulder disorders, summarised handouts and training in injection techniques. The main outcomes reported were patient‐related (pain and disability assessed by the British Shoulder Disability questionnaire (BSDQ) and the Short‐form 36 item (SF‐36) Health Survey). The intervention may result in little or no improvement in pain and disability a year later (BSDQ SMD 0.2, SF‐36 for physical component SMD 0 and SF‐36 mental component SMD 0.1). McKenna 2009 assessed the cost‐effectiveness of providing practical training to GPs in the SAPPHIRE study. It reported an incremental cost‐effectiveness ratio of GBP 2813 per QALY gained for trained GPs.
| (Study) Intervention | Outcome | Int pre mean (SD)1 | C pre mean (SD)2 | Int post mean (SD)3 | C post mean (SD)4 | MD 5 | Relative % change 6 | Adjusted relative % change7 | SMD8 (P value)9 |
| Intervention: 60‐minute lecture on shoulder disorders, handouts, training in injection techniques versus control group (usual care) | British Shoulder Disability Questionnaire (BSDQ) | 12.22 (4.21) | 13.11 (4.43) | 8.51 (0.60) | 9.46 (0.82) | 0.95 | 10% | 1% | 0.2 (P=0.36) |
| Short form 36 item (SF‐36) Health Survey ‐ physical component score | 37.78 (8.69) | 35.96 (8.93) | 40.55 (0.60) | 40.80 (0.90) | ‐0.25 | ‐1% | ‐5% | 0.0 (P=0.82) | |
| Short form 36 item (SF‐36) Health Survey ‐ mental component score | 45.42 (13.33) | 44.64 (13.09) | 46.81 (0.93) | 45.64 (1.28) | 1.17 | 3% | 1% | 0.1 (P=0.47) |
1. Intervention group pre‐intervention mean (standard deviation)
2. Control group pre‐intervention mean (standard deviation)
3. Intervention group post‐intervention mean (standard deviation)
4. Control group pos‐tintervention mean (standard deviation)
5. Mean Difference (MD)=Difference between post‐intervention means. The direction of effect has been adjusted so that a positive result represents a beneficial intervention outcome, according to Grimshaw 2004.
6. Relative percentage change post‐intervention = (Int post mean ‐ Control post mean)/Control post mean
7. Adjusted relative percentage change= (Int post mean‐Control post mean)‐(Int pre mean ‐ Control pre mean)/Control post mean. The direction of effect has been adjusted so that a positive result represents a beneficial intervention outcome.
8. SMD=Standardised Mean Difference=(Int post mean‐Control post mean)/SD pooled. The direction of effect has been adjusted so that a positive result represents a beneficial intervention outcome, according to Grimshaw 2004.
9. P value reported by study authors
Shoulder pain: evaluations of interventions compared to another intervention
Gormley 2003 evaluated the impact of two different types of shoulder injection training (on mannequins versus mannequins and real patients) for GPs, and reported the effects on professional behaviour, i.e. the number of shoulder injections performed and the number of referrals to injection or physiotherapy clinics. The results are summarised in Table 18. Additional training with real patients may result in an increase in the number of injections performed by GPs (adjusted relative percentage change 44%, P=0.02) and a reduction in the rates of onward referrals (adjusted relative percentage change 38‐100%, not statistically significant).
| (Study) Intervention 1 versus Intervention 2 | Outcome | Int 1 pre mean (SD)1 | Int 2 pre mean (SD)2 | Int 1 post mean (SD)3 | Int 2 post mean (SD)4 | MD 5 | Relative % change 6 | Adjusted relative % change7 | SMD8 (P value)9 |
| (Gormley 2003*) Shoulder injection training on mannequins versus shoulder injection training on mannequins and real patients | Shoulder injections performed by general practitioner | 3.5 | 3.4 | 4.5 | 7.8 | ‐3.3 | ‐42% | ‐44% | (P=0.02) |
| Referrals to shoulder injection clinics | 2.3 | 2.0 | 1.5 | 0.6 | ‐0.9 | ‐150% | ‐100% | (P=0.36) | |
| Referrals to physiotherapy | 5.9 | 5.6 | 4.7 | 3.2 | ‐1.5 | ‐47% | ‐38% | (P=0.20) |
1. Intervention 1 group pre‐intervention mean (standard deviation)
2. Intervention 2 group pre‐intervention mean (standard deviation)
3. Intervention 1 group post‐intervention mean (standard deviation)
4. Intervention 2 group postintervention mean (standard deviation)
5. Mean Difference (MD)=Difference between post‐intervention means. The direction of effect has been adjusted so that a positive result represents a beneficial intervention 1 outcome, according to Grimshaw 2004.
6. Relative percentage change post‐intervention = (Int1 post mean ‐ Int2 post mean)/Int2 post mean. The direction of effect has been adjusted so that a positive result represents a beneficial intervention 1 outcome, according to Grimshaw 2004.
7. Adjusted relative percentage change= (Int1 post mean‐Int2 post mean)‐(Int1 pre mean ‐ Int2 pre mean)/Int2 post mean. The direction of effect has been adjusted so that a positive result represents a beneficial intervention 1 outcome.
8. SMD=Standardised Mean Difference=(Int1 post mean‐Int2 post mean)/SD pooled. The direction of effect has been adjusted so that a positive result represents a beneficial intervention 1 outcome, according to Grimshaw 2004.
9. P value reported by study authors
* The study does not report SD and therefore we were not able to calculate the SMD
Shoulder studies: summary
The studies were heterogeneous in terms of design, type of intervention and outcomes. Broadhurst 2007 showed that academic detailing may result in a temporary, slight reduction of shoulder ultrasound scans, but little or no change in the x‐ray requests. Watson 2008 showed there may be little or no improvement in patient‐reported outcomes after education of GPs on shoulder pain management and injection training. Gormley 2003 showed that additional training with real patients may increase the number of shoulder injections performed by GPs.
Other musculoskeletal conditions studies:
Four studies focused on musculoskeletal conditions other than the ones mentioned above (Eccles 2001; Huas 2006; Kerry 2000; Robling 2002). Eccles 2001 and Kerry 2000 have been mentioned above under the low back pain studies, as they also reported on low back pain outcomes. All studies were cluster‐randomised trials. Three of the studies (Eccles 2001; Kerry 2000; Robling 2002) were set in the UK and one (Huas 2006) was conducted in France. The outcomes of these studies are summarised in Table 19; Table 20; Table 21.
| (Study) Intervention | Outcome | Int pre mean (SD)1 | C pre mean (SD)2 | Int post mean (SD)3 | C post mean (SD)4 | MD 5 | Relative % change 6 | Adjusted relative % change7 | SMD8 (P value)9 |
| Training of general practitioners on the use of 2 validated assessment instruments for pain versus control group (usual care) | Pain relief a week after last consultation with general practitioner | 41.1 (4.6) | 50.7 (4.8) | ‐9.6 | ‐19% | ‐2 (P=0.0004) | |||
| Pain relief a week after last consultation with general practitioner not including patients on Level 3 analgesics | 40.8 (4.0) | 50.7 (4.2) | ‐9.9 | ‐20% | ‐2.4 (P=0.0001) | ||||
| Level 1 analgesic treatment (as defined by WHO classification system) | 34.7 (10.6) | 42.9 (18.4) | 29.6 (9.9) | 34.2 (12.4) | ‐4.6 | ‐13% | 11% | ‐0.3 (P=0.38) | |
| Level 2 analgesic treatment (as defined by WHO classification system) | 42.2 (5.9) | 44.1 (19.6) | 35.4 (6.3) | 47.7 (8.8) | ‐12.3 | ‐26% | ‐22% | ‐0.9 (P=0.003) | |
| Level 3 analgesic treatment (as defined by WHO classification system) | 7.5 (5.6) | 2.5 (2.1) | 7.2 (4.7) | 1.8 (2.5) | 5.4 | 300% | 22% | 1.2 (P=0.007) | |
| Co‐analgesics (antidepressants, anxiolytics, anti‐epileptics) | 46.0 (7.6) | 38.7 (7.5) | 38.4 (11.4) | 33.0 (15.1) | 5.4 | 16% | ‐6% | 0.7 (P=0.38) | |
| Other drugs (non‐psychotropic muscle relaxants) | 21.6 (7.1) | 27.3 (13.5) | 19.0 (5.3) | 22.9 (11.5) | ‐3.9 | ‐17% | 8% | ‐0.4 (P=0.34) | |
| Non‐medicinal treatment (physiotherapy, homeopathy, acupuncture, compression bandages, etc) | 44.3 (10.2) | 44.9 (11.1) | 33.8 (11.8) | 39.3 (12.5) | ‐5.5 | ‐14% | ‐12% | ‐0.5 (P=0.30) |
1. Intervention group pre‐intervention mean (standard deviation)
2. Control group pre‐intervention mean (standard deviation)
3. Intervention group post‐intervention mean (standard deviation)
4. Control group pos‐tintervention mean (standard deviation)
5. Mean Difference (MD)=Difference between post‐intervention means. The direction of effect has been adjusted so that a positive result represents a beneficial intervention outcome, according to Grimshaw 2004.
6. Relative percentage change post‐intervention = (Int post mean ‐ Control post mean)/Control post mean
7. Adjusted relative percentage change= (Int post mean‐Control post mean)‐(Int pre mean ‐ Control pre mean)/Control post mean. The direction of effect has been adjusted so that a positive result represents a beneficial intervention outcome.
8. SMD=Standardised Mean Difference=(Int post mean‐Control post mean)/SD pooled. The direction of effect has been adjusted so that a positive result represents a beneficial intervention outcome, according to Grimshaw 2004.
9. P value reported by study authors
| (Study) Intervention 1 versus intervention 2 | Outcome | Int 1 pre (%) 1 | Int 2 pre (%)2 | Int 1 post (%)3 | Int 2 post (%)4 | ARD 5 | Risk difference 6 (P value if reported by authors) | Relative % change post 7 | Risk ratio 8 |
| (Robling 2002)* Guidelines and seminar versus guideline dissemination by post* | Concordant requests | ‐ | ‐ | 79% (23/29) | 79% (32/41) | ‐ | 0% | 0% | 1 |
| (Robling 2002)* Guidelines and feedback versus guideline dissemination by post* | Concordant requests | ‐ | ‐ | 67% (21/32) | 79% (32/41) | ‐ | ‐12.1% | ‐15% | 0.8 |
| (Robling 2002)* Guidelines, seminar and feedback versus guideline dissemination by post* | Concordant requests | ‐ | ‐ | 71% (27/37) | 79% (32/41) | ‐ | ‐7.6% | ‐10% | 0.9 |
| (Robling 2002)* Guidelines and seminar versus guidelines and feedback* | Concordant requests | ‐ | ‐ | 79% (23/29 | 67% (21/32) | ‐ | 12.1% | 18% | 1.2 |
| (Robling 2002)* Guidelines and seminar versus guidelines, seminar and feedback* | Concordant requests | ‐ | ‐ | 79% (23/29) | 71% (27/37) | ‐ | 7.6% | 11% | 1.1 |
| (Robling 2002)* Guidelines and feedback versus guidelines, seminar and feedback* | Concordant requests | ‐ | ‐ | 67% (21/32) | 71% (27/37) | ‐ | ‐4.5% | ‐6% | 0.9 |
| (Eccles 2001)** Feedback on number of knee radiographs 6 months before and 6 months after the intervention plus guideline dissemination versus guideline dissemination | Knee radiographs concordant with guidelines | ‐ | ‐ | 22% (52/240) | 25% (83/328) | ‐ | ‐3.6% | ‐14% | 0.9 |
| (Eccles 2001)** Reminder messages on radiograph reports plus guideline dissemination versus guideline dissemination | Knee radiographs concordant with guidelines | ‐ | ‐ | 31% (26/85) | 25% (83/328) | ‐ | 5.3% | 21% | 1.2 |
| (Eccles 2001)** Feedback on number of knee radiographs 6 months before and 6 months after the intervention plus guideline dissemination plus reminder messages on radiograph reports versus guideline dissemination | Knee radiographs concordant with guidelines | ‐ | ‐ | 28% (70/252) | 25% (83/328) | ‐ | 2.5% | 10% | 1.1 |
| (Eccles 2001)** Feedback on number of knee radiographs 6 months before and 6 months after the intervention plus guideline dissemination versus reminder messages on radiograph reports plus guideline dissemination | Knee radiographs concordant with guidelines | ‐ | ‐ | 22% (52/240) | 31% (26/85) | ‐ | ‐8.9% | ‐29% | 0.7 |
1. Intervention 1 group pre‐intervention proportion
2. Intervention 2 group pre‐intervention proportion
3. Intervention 1 group post‐intervention proportion
4. Intervention 2 group post‐intervention proportion
5. ARD = [Int 1 post (%) minus Int 2 post (%)] minus [Int 1 pre (%) minus Int 2 pre (%)]. The direction of effect has been adjusted so that a positive result represents a beneficial intervention 1 outcome, according to Grimshaw 2004.
6. Risk Difference (RD) is the absolute % change post‐intervention = Int 1 post (%) minus Int 2 post (%). This is considered to be "small" if ≤ 5%, "modest" if > 5% and ≤10%,"moderate" if > 10% but ≤ 20%, and "large" if > 20%.The direction of effect has been adjusted so that a positive result represents a beneficial intervention 1 outcome.
7. Relative % change post = absolute % change post divided by Int 2 post (%). The direction of effect has been adjusted so that a positive result represents a beneficial intervention 1 outcome, according to Grimshaw 2004.
8. Risk ratio (RR) = Int 1 post (%) divided by Int 2 post (%)
Int 1: intervention 1 group; Int 2: Intervention 2 group; ARD: adjusted risk difference; NS: not significant
*The results have been re‐calculated taking into account the reported Intercluster Correlation (ICC=0.0269) and average cluster size 12.5 according to chapter 16.3.4 of the Cochrane Handbook, Higgins 2011a.
** The data reported above for the study by Eccles 2001 does not account for clustering. We did not have access to sufficient information to adjust the data for clustering.
| (Study) Intervention 1 versus Intervention 2 | Outcome | Int 1 pre mean (SD)1 | Int 2 pre mean (SD)2 | Int 1 post mean (SD)3 | Int 2 post mean (SD)4 | MD 5 | Relative % change 6 | Adjusted relative % change7 | SMD8 (P value)9 |
| (Eccles 2001)* Feedback on number of knee radiographs 6 months before and 6 months after the intervention plus guideline dissemination versus guideline dissemination | Number of knee radiographs per 1000 patients | 7.03 (5.1) | 6.67 (3.9) | 6.32 (4.0) | 7.02 (3.6) | 0.7 | 10% | 15% | 0.2 (NR) |
| (Eccles 2001)* Reminder messages on radiograph reports plus guideline dissemination versus guideline dissemination | Number of knee radiographs per 1000 patients | 7.18 (5.0) | 6.67 (3.9) | 5.22 (3.6) | 7.02 (3.6) | 1.8 | 26% | 33% | 0.5 (P< 0.05) |
| (Eccles 2001)* Feedback on number of knee radiographs 6 months before and 6 months after the intervention plus guideline dissemination plus reminder messages on radiograph reports versus guideline dissemination | Number of knee radiographs per 1000 patients | 9.34 (6.1) | 6.67 (3.9) | 5.21 (3.7) | 7.02 (3.6) | 1.8 | 26% | 64% | 0.5 (NR) |
| (Eccles 2001)* Feedback on number of knee radiographs 6 months before and 6 months after the intervention plus guideline dissemination versus reminder messages on radiograph reports plus guideline dissemination | Number of knee radiographs per 1000 patients | 7.03 (5.1) | 7.18 (5.0) | 6.32 (4.0) | 5.22 (3.6) | ‐1.1 | ‐21% | ‐24% | ‐0.3 (NR) |
1. Intervention 1 group pre‐intervention mean (standard deviation)
2. Intervention 2 group pre‐intervention mean (standard deviation)
3. Intervention 1 group post‐intervention mean (standard deviation)
4. Intervention 2 group postintervention mean (standard deviation)
5. Mean Difference (MD)=Difference between post‐intervention means. The direction of effect has been adjusted so that a positive result represents a beneficial intervention 1 outcome, according to Grimshaw 2004.
6. Relative percentage change post‐intervention = (Int1 post mean ‐ Int2 post mean)/Int2 post mean. The direction of effect has been adjusted so that a positive result represents a beneficial intervention 1 outcome, according to Grimshaw 2004.
7. Adjusted relative percentage change= (Int1 post mean‐Int2 post mean)‐(Int1 pre mean ‐ Int2 pre mean)/Int2 post mean. The direction of effect has been adjusted so that a positive result represents a beneficial intervention 1 outcome.
8. SMD=Standardised Mean Difference=(Int1 post mean‐Int2 post mean)/SD pooled. The direction of effect has been adjusted so that a positive result represents a beneficial intervention 1 outcome, according to Grimshaw 2004.
9. P value reported by study authors
*The above data reported above for Eccles 2001 was adjusted for clustering by the authors
Other musculoskeletal conditions: evaluations of interventions compared to a no‐intervention control group
Huas 2006 evaluated the impact of training GPs on the use of two validated assessment scales (the VAS pain scale and the HAD anxiety and depression scale). The intervention may result in worse patient‐related outcomes: pain relief scores (SMD 2, P=0.0004) and increased level 3 (WHO classification) analgesic prescribing (SMD 1.2, P=0.02).
Kerry 2000, as mentioned above, used dissemination of guidelines on the use of radiology and GP audit/feedback on numbers of radiological referrals. The study did not report the means and standard deviations. Overall a 1% reduction in the numbers of limb and joint x‐ray requests was observed in the intervention group compared to a 9% increase in the control group (giving a total of 10% difference), but this did not achieve statistical significance (95% CI ‐5 to 25). Overall, the intervention therefore may result in a little or no reduction in GP radiology referrals.
Other musculoskeletal conditions: evaluations of interventions compared to another intervention
Eccles 2001 was discussed above as part of the low back pain studies. However, it also looked at knee radiographs. Educational reminder messages may result in a slight improvement in concordance of the requests with guidelines (RD 5.3, Table 20). Audit/feedback and educational reminder messages used separately and in combination may show a slight reduction in the number of knee radiograph requests per 1000 patients, as seen in Table 21 (SMD 0.2, 0.50, and 0.50 respectively). The authors of this study recommended caution in the interpretation of the data, due to a baseline imbalance between the study groups. Ramsey 2003 reported on the effect of the educational reminder messages over the 12 months after the intervention by Eccles 2001. It showed that there was a small but sustained reduction in the number of knee radiographs in the reminder group compared to the guideline‐only group (reported RR = 0.65, 95% CI (0.46 to 0.91), P=0.011).
Robling 2002 evaluated different combinations of guideline dissemination on knee and lumbar spine magnetic resonance imaging (MRI), practice‐based seminar and audit/feedback on MRI use, and comparative data on orthopaedic and neurosurgical referrals. The results for both knee and spine MRIs were reported together and therefore the study is not mentioned under the low back pain studies. The results (summarised in Table 20) show that the interventions may result in no difference in guideline‐concordant GP behaviour (guideline‐concordant requests for MRIs (RD ‐12.1 to 12.1)). A cost‐effectiveness analysis showed that accessing the MRI service in writing is probably more cost effective compared to telephone access, and dissemination of guidelines is probably more cost effective compared to the other types of intervention used.
Other musculoskeletal conditions: summary
The four studies on other musculoskeletal conditions were heterogeneous in terms of intervention types and outcomes assessed. Huas 2006 showed that GP training in the use of validated assessment scales may result in worse pain control and increased prescribing of strong (level 3) painkillers. Eccles 2001 showed that educational reminder messages attached to radiographic reports may result in a slight but sustained reduction in knee radiographs. Kerry 2000 and Eccles 2001 showed that providing GP feedback on the total number of investigations requested may result in a slight reduction in the number of radiology requests.
Additional analysis
Does the effectiveness of interventions vary depending on the direction of behaviour targeted?
Some of the interventions aimed to increase a clinical behaviour (e.g. bone density testing) while others aimed to decrease certain clinical actions (e.g. x‐ray requests discordant with guidelines). We examined whether the effectiveness of the interventions varied depending on the direction of the targeted behaviour. The results are presented in Table 22. The median absolute effect size for comparisons that aimed to increase a behaviour was 5 (interquartile range (IQR) 0.6 to 12.6) compared to 1.1 (IQR ‐1.1 to 3) for comparisons that aimed to decrease an existing behaviour (T‐test < 0.05).
| Table 23: Summary of median absolute effect sizes (risk difference) of dichotomous outcomes for interventions aiming to increase or decrease a clinical behaviour | ||||
| Study characteristic: behaviour targeted | Number of comparisons (n studies) | Median absolute effect size | Interquartile range | Range |
| Increase an existing clinical behaviour according to guidelines | 68 (14) | 5% | 0.6% to 12.6% | ‐7.8% to 57.2% |
| Decrease an existing clinical behaviour according to guidelines | 26 (7) | 1.1% | ‐1.1% to 3% | ‐12.6% to 30.1% |
The above seem to suggest that it may be more challenging for an intervention to reduce an existing behaviour rather than to increase a behaviour that is underused. However, as highlighted in the review by French 2010, a difference in intervention effects may be "due to factors inherent in the management of osteoporosis and low back pain rather than due to increasing or decreasing behaviours per se". Therefore, in order to investigate the above study characteristic further, we undertook a subgroup analysis by condition. None of the osteoporosis studies included comparisons aiming to decrease a clinical behaviour and they were therefore excluded from the condition‐specific subgroup analysis. The results for the low back pain and osteoarthritis studies are presented in Table 23 and Table 24 respectively and show no significant difference between the median absolute effect sizes (T‐test = 0.297 for low back pain and T‐test=0.70 for osteoarthritis). The available data therefore do not support the notion that increasing a behaviour is more or less challenging than reducing an existing behaviour.
| Table 24: Summary of median effect sizes (risk difference) of dichotomous outcomes for interventions aiming to increase or decrease a clinical behaviour (including only comparisons from Low Back Pain studies) | ||||
| Study characteristic: behaviour targeted | Number of comparisons (n studies) | Median absolute effect size | Interquartile range | Range |
| Increase an existing clinical behaviour according to guidelines | 18 (2) | 3.7% | ‐0.8% to 6.9% | ‐4.7% to 12.8% |
| Decrease an existing clinical behaviour according to guidelines | 23 (6) | 0.5% | ‐1.1% to 2.4% | ‐12.6% to 30.1% |
| Table 25: Summary of median effect sizes (risk difference) of dichotomous outcomes for interventions aiming to increase or decrease a clinical behaviour (including only comparisons from Osteoarthritis studies) | ||||
| Study characteristic: behaviour targeted | Number of comparisons (n studies) | Median absolute effect size | Interquartile range | Range |
| Increase an existing clinical behaviour according to guidelines | 18 (3) | 6.3% | ‐0.2% to 10% | ‐7.8% to 57.2% |
| Decrease an existing clinical behaviour according to guidelines | 3 (1) | 7.8% | 6.1% to 13.4% | 4.4% to 18.9% |
Discussion
We included thirty studies assessing a range of professional interventions targeting GPs/family doctors and aiming to improve the management of musculoskeletal conditions. Eleven studies evaluated interventions on osteoporosis, ten on low back pain, four on osteoarthritis, three on shoulder pain and four on other musculoskeletal conditions (two of these studies looked at both low back pain and other musculoskeletal conditions).
Summary of main results
For improving the management of osteoporosis, a combination of a GP‐alerting system and patient education with reminders to see their GP leads to improved professional behaviour. The combined intervention increases both diagnostic testing rates for osteoporosis and medication prescribing rates. GP‐alerting on its own also probably improves osteoporosis guideline‐consistent professional behaviour and adding the patient‐directed component probably does not lead to a greater effect.
Distribution of educational materials (including guideline dissemination) and participation in educational meetings/workshops were common components of complex interventions. Seven studies on low back pain showed that guideline dissemination and educational opportunities for GPs may lead to little or no improvement with regard to guideline‐consistent GP behaviour.
Two studies showed that the combination of guidelines and GP feedback on the total number of investigations requested may result in a slight reduction in the number of tests requested, while one of these studies showed that the combination of guidelines and GP reminders attached to radiology reports may result in a small but sustained reduction in the number of requests. One study showed that using educationally influential physicians may result in improvement in guideline‐consistent GP behaviour.
The direction of the targeted behavioural change does not seem to affect the effect size of interventions.
Overall completeness and applicability of evidence
We are unable to draw firm conclusions on the effectiveness of the tested professional interventions aimed at improving the management of musculoskeletal conditions by GPs/family doctors. Only five studies were sufficiently similar in terms of interventions and outcomes studied and provided adequate data to allow a meta‐analysis of their results. These studies incorporated a patient‐directed component in addition to a professional intervention. This additional component increases the complexity of the interventions and limits their applicability as it introduces contextual and cultural factors (e.g. linguistic and socioeconomic diversity of the patient population) which may affect the success of the intervention. Further meta‐analysis of two of these studies showed that probably the professional intervention on its own is effective and that adding the patient component probably does not result in improved professional behaviour. However, further studies are required to confirm this conclusion. Additionally, the included studies did not assess the effect of the above interventions on patient related and economic outcomes.
Incomplete reporting of data and the relatively high risk of bias in the remaining studies compromised our confidence in the results. Due to the complexity of the interventions and the often inadequate intervention detail, we were unable to conduct robust subgroup analysis of the different components of interventions, so that we can confidently identify the ones associated with successful outcomes.
The majority of the studies did not investigate the potential adverse effects of the interventions. This may be because most studies aimed to improve adherence to evidence‐based clinical guidelines which tend to promote clinical practice where the overall benefits outweigh the risks. Only four studies reported on work absence and service utilisation, and only three studies (Majumdar 2008; Robling 2002; Watson 2008) included a cost‐effectiveness analysis.
No studies looked specifically at disadvantaged groups. The primary target of the interventions were the GPs/family doctors. The patient‐directed interventions did not focus specifically on any disadvantaged groups. The applicability of such interventions to patients with a low socioeconomic status may be different, especially in countries where the patients need to contribute financially in order to access medical services.
Study locations may limit the external validity of the conclusions drawn to high‐income countries only.
Quality of the evidence
We judged the quality or certainty of the evidence of the five studies included in the first meta‐analysis to be high, because they were all well designed and implemented RCTs which gave consistent results with a low level of imprecision (summary of findings Table for the main comparison). Our confidence in the pooled effect estimate of interventions directed to both GPs and patients for improving diagnostic testing and medication prescribing in osteoporosis is therefore high.
Our confidence in the pooled effect estimate reported in the two additional meta‐analyses (summary of findings Table 2; summary of findings Table 3) is moderate because the analyses included only two studies, one of which was relatively small. Therefore, the certainty of the evidence was downgraded.
Our confidence in the reported effect estimates in the remaining twenty‐five studies is low. Most studies had limitations in design or execution with an often unclear or high risk of associated bias which affected the certainty of the evidence. We were unable to judge the level of inconsistency for these studies, due to their wide heterogeneity in terms of types of interventions and outcomes which prevented us from comparing their effects. The heterogeneity of interventions and their combinations was also a source of indirectness, as studies were reporting on the results of a variety of intervention comparisons. Four of the studies (Gormley 2003; Hazard 1997; Rozental 2008; Stross 1985) had high levels of imprecision, including relatively few events in their analysis. For the above reasons, we rated the certainty of the evidence as low or very low for the comparisons and outcomes reported for these studies.
Overall, we found no indication of publication bias, and many of the included studies reported uncertain results.
Potential biases in the review process
The subject of this review was very broad, including all professional interventions on the management of musculoskeletal conditions targeting GPs/family doctors. Although we made every effort to create a broad search strategy that would identify all relevant studies, it is possible that we failed to locate important studies.
We used risk difference for dichotomous outcomes, because, according to Higgins 2011a, paragraph 9.4.4.4, this summary statistic is thought to be easier for clinicians to interpret. However, this measure does not account for differences in baseline compliance between intervention and control groups, and could produce biased effect estimates. We attempted to limit this risk by also calculating the adjusted risk difference (which does take into account baseline differences between groups) wherever the data allowed.
The majority of the included studies were published before 2008. As more studies are being conducted in this increasingly important area, the review will need to be updated in order to identify and incorporate the newest evidence.
Agreements and disagreements with other studies or reviews
The findings of this review in the context of musculoskeletal conditions are largely consistent with what was observed in a comprehensive systematic review (Grimshaw 2004) which reviewed all guideline implementation strategies across all health conditions. It showed GP reminders to have moderate effects. We also found that a GP‐alerting system (via a patient‐specific letter or electronic reminder), with or without a patient‐directed intervention, leads to improved professional behaviour (both diagnosis and treatment) of osteoporosis. This is also in agreement with a more recent systematic review (French 2010). However, unlike Grimshaw 2004, we found that distribution of educational material on its own may result in no or minimal improvement, with only a small 5% RD in the study by Rahme 2005 and no significant improvement in the study by Hollingworth 2002.
A Cochrane systematic review by Giguere 2012 which evaluated the effect of printed educational materials concluded that this intervention, when used alone, may have a small beneficial effect on GP behaviour and process‐related outcomes but not necessarily on patient outcomes. Our review suggests that educational materials alone may not even improve process‐related outcomes and guideline‐concordant behaviour for low back pain, although our conclusion is based on only one study with ITS design (Hollingworth 2002).
We are unable to comment on the effect of feedback on performance when used on its own, as this was only used as part of a multifaceted intervention in the included studies. A systematic review by Bywood 2008 showed that feedback is an effective strategy which can facilitate professional behaviour change, and a more recent Cochrane review (Ivers 2012) confirmed this finding.
The use of local opinion leaders was evaluated as part of a multifaceted intervention in three studies (Majumdar 2008; Schectman 2003; Stross 1985), two of which (Majumdar 2008; Stross 1985) showed that it probably results in improved GP behaviour. This is in accordance with the Cochrane review (Flodgren 2011) which concluded that the use of local opinion leaders can successfully promote evidence‐based practice but that effectiveness varied both within and between studies.
Guidelines and educational reminder messages attached to radiology reports (Eccles 2001) may result in small but sustained reductions in GP radiology requests. This is in accordance with the findings by French 2010.
The use of educational meetings and workshops showed varied results in our review. It seemed to work better for improving GP behaviour in the management of osteoarthritis (Chassany 2006; Rahme 2005; Rosemann 2007; Stross 1985) and not so well when trying to improve the management of low back pain (Bishop 2006; Dey 2004; Engers 2005; French 2013; Hazard 1997; Schectman 2003). A systematic review (Smith 2009) concluded that educational meetings alone, or as a component of multifaceted interventions, can result in small to moderate increases in the adoption of desired behaviours by healthcare professionals. Also, meetings that combined interactive and didactic approaches seemed to be more effective in changing the behaviour of healthcare professionals than meetings that were purely didactic or interactive. The meetings and workshops in the studies included in our review had both an interactive and a didactic component.
Our review investigated whether it is more challenging trying to effect a reduction in established clinician behaviours than to generate new routines, as suggested by French 2010. Although an initial analysis of the effects of studies depending on the direction of behavioural change seemed to agree with this notion, this observation may have been a consequence of the management specifics of the conditions in the included studies, as demonstrated by the results of the subgroup analysis which included only studies on the same conditions. We could not find any systematic review that looked in detail into this issue. Behaviour change is a complex process and interventions are commonly designed without evidence of having gone through a process of analysing the target behaviour or the theoretically‐predicted mechanisms of action as advocated by Michie 2011. The theoretical framework behind the design of the interventions in the studies included here was not always apparent. Lally 2010 showed that repeating a behaviour in response to a cue appeared to be enough for many people to develop automaticity for that behaviour. It is not clear how applicable this observation is when trying to develop new clinical habits. Additionally, there seems to be a lack of evidence surrounding the complexities of stopping an established clinical behaviour.

Prisma study flow diagram.
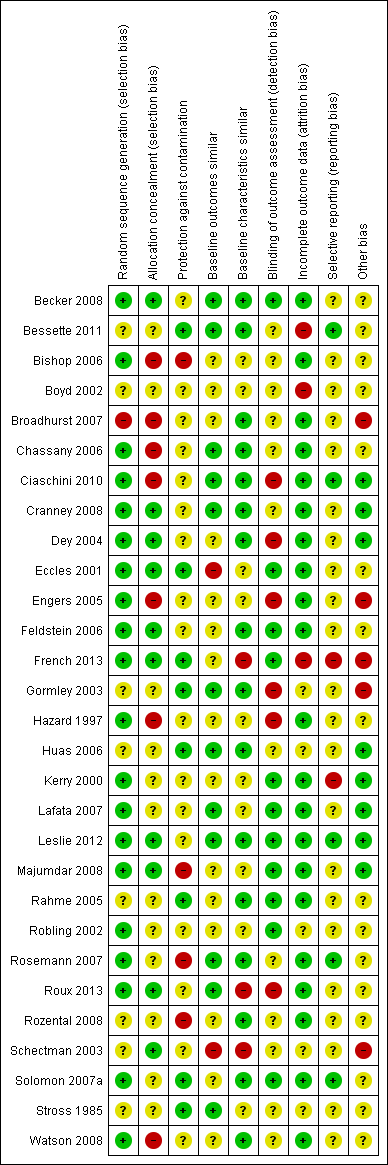
Risk of bias summary: review authors' judgements about each risk of bias item for each included study.
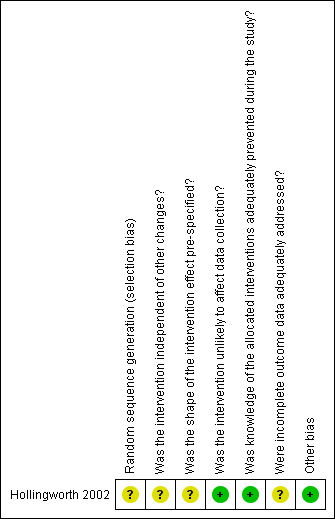
Risk of bias summary for ITS study design: review authors' judgements about each risk of bias item for each included study.

Risk of bias graph: review authors' judgements about each risk of bias item presented as percentages across all included studies.

Risk of bias graph for ITS study design: review authors' judgements about each risk of bias item presented as percentages across all included studies.
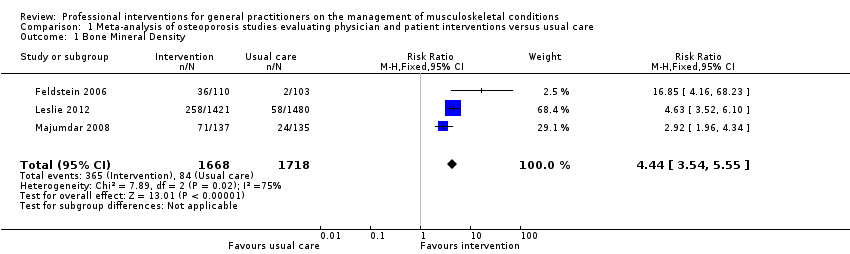
Comparison 1 Meta‐analysis of osteoporosis studies evaluating physician and patient interventions versus usual care, Outcome 1 Bone Mineral Density.
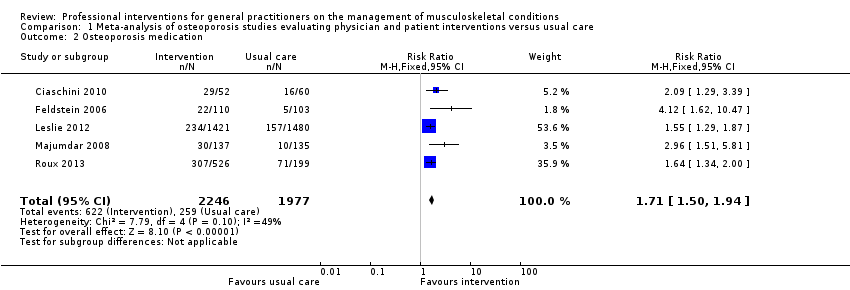
Comparison 1 Meta‐analysis of osteoporosis studies evaluating physician and patient interventions versus usual care, Outcome 2 Osteoporosis medication.
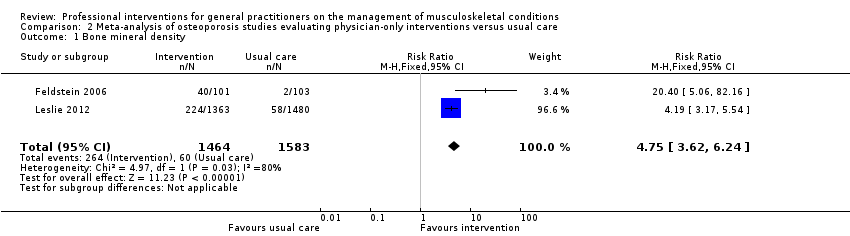
Comparison 2 Meta‐analysis of osteoporosis studies evaluating physician‐only interventions versus usual care, Outcome 1 Bone mineral density.
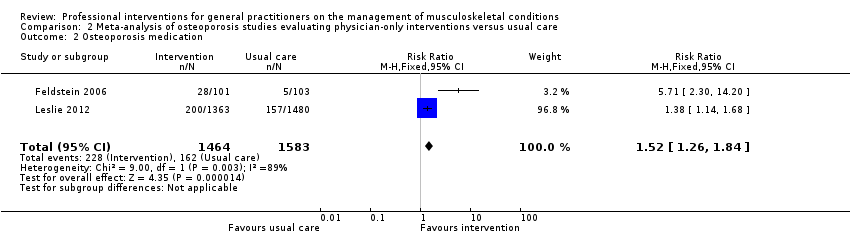
Comparison 2 Meta‐analysis of osteoporosis studies evaluating physician‐only interventions versus usual care, Outcome 2 Osteoporosis medication.
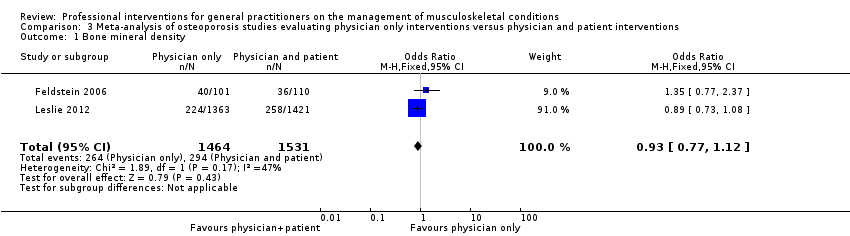
Comparison 3 Meta‐analysis of osteoporosis studies evaluating physician only interventions versus physician and patient interventions, Outcome 1 Bone mineral density.
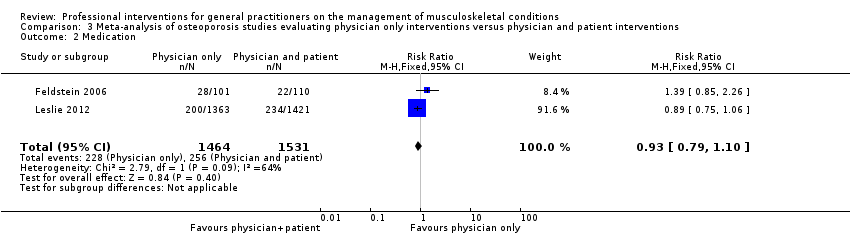
Comparison 3 Meta‐analysis of osteoporosis studies evaluating physician only interventions versus physician and patient interventions, Outcome 2 Medication.
| Primary care physician alerting system and a patient‐directed intervention (education and reminder to see their primary care physician) compared to usual care for osteoporosis management | ||||||
| Patient or population: General practitioners/family doctors involved in the management of patients with osteoporosis | ||||||
| Outcomes | Illustrative comparative risks* (95% CI) | Relative effect | No of Participants | Certainty of the evidence | Comments | |
| Assumed risk | Corresponding risk | |||||
| Usual care | A physician alerting system and a patient‐directed intervention (education and reminder to see their primary care physician) | |||||
| Bone Mineral Density 1 | Study population | RR 4.44 | 3386 | ⊕⊕⊕⊕ | ||
| 49 per 1000 | 220 per 1000 | |||||
| Moderate | ||||||
| 39 per 1000 | 176 per 1000 | |||||
| Osteoporosis medication 2 | Study population | RR 1.71 | 4223 | ⊕⊕⊕⊕ | ||
| 131 per 1000 | 241 per 1000 3 | |||||
| Moderate | ||||||
| 106 per 1000 | 195 per 1000 3 | |||||
| *The basis for the assumed risk (e.g. the median control group risk across studies) is provided in footnotes. The corresponding risk (and its 95% confidence interval) is based on the assumed risk in the comparison group and the relative effect of the intervention (and its 95% CI). | ||||||
| GRADE Working Group grades of evidence | ||||||
| 1 Bone mineral density (BMD) testing is an important outcome for osteoporosis because it leads to the diagnosis of the condition. This is one of the GP behaviour‐related outcomes (primary outcome) 2 Osteoporosis medication prescribing is an important outcome for osteoporosis management as it is the main aspect of treatment. This is one of the GP behaviour‐related outcomes (primary outcome) 3 One of the five studies (Roux 2013) had two intervention comparison groups which were combined to create a single pair‐wise comparison as recommended in chapter 16.5.4 of the Cochrane Handbook. | ||||||
| Primary care physician alerting system compared to usual care for osteoporosis management | ||||||
| Patient or population: General practitioners/family doctors involved in the management of patients with osteoporosis | ||||||
| Outcomes | Illustrative comparative risks* (95% CI) | Relative effect | No of Participants | Certainty of the evidence | Comments | |
| Assumed risk | Corresponding risk | |||||
| Usual care | Primary care physician alerting system | |||||
| Bone mineral density1 | Study population | RR 4.75 | 3047 | ⊕⊕⊕⊖ | ||
| 38 per 1000 | 302 per 1000 | |||||
| Moderate | ||||||
| 29 per 1000 | 231 per 1000 | |||||
| Osteoporosis medication2 | Study population | RR 1.52 | 3047 | ⊕⊕⊕⊖ | ||
| 102 per 1000 | 268 per 1000 | |||||
| Moderate | ||||||
| 77 per 1000 | 202 per 1000 | |||||
| *The basis for the assumed risk (e.g. the median control group risk across studies) is provided in footnotes. The corresponding risk (and its 95% confidence interval) is based on the assumed risk in the comparison group and the relative effect of the intervention (and its 95% CI). | ||||||
| GRADE Working Group grades of evidence | ||||||
| 1 Bone mineral density (BMD) testing is an important outcome for osteoporosis because it leads to the diagnosis of the condition. This is one of the GP behaviour‐related outcomes (primary outcome) 2 Osteoporosis medication prescribing is an important outcome for osteoporosis management as it is the main aspect of treatment. This is one of the GP behaviour‐related outcomes (primary outcome) 3 The quality of evidence was downgraded because only two studies were included, one of which had a small number of participants and events, and in view of the considerable statistical heterogeneity observed. | ||||||
| Primary care physician alerting system compared to Primary care physician alerting system and a patient‐directed intervention (education and reminder to see their primary care physician) for osteoporosis management | ||||||
| Patient or population: General practitioners/family doctors involved in the management of patients with osteoporosis | ||||||
| Outcomes | Illustrative comparative risks* (95% CI) | Relative effect | No of Participants | Certainty of the evidence | Comments | |
| Assumed risk | Corresponding risk | |||||
| Primary care physician alerting system and a patient‐directed intervention (education and reminder to see their primary care physician) | Primary care physician alerting system | |||||
| Bone mineral density1 | Study population | RR 0.94 (0.81 to 1.09) | 2995 | ⊕⊕⊕⊖ | ||
| 192 per 1000 | 194 per 1000 | |||||
| Moderate | ||||||
| 254 per 1000 | 257 per 1000 | |||||
| Medication2 Follow‐up: 6‐12 months | Study population | RR 0.93 | 2995 | ⊕⊕⊕⊖ moderate3 | ||
| 167 per 1000 | 176 per 1000 | |||||
| Moderate | ||||||
| 182 per 1000 | 191 per 1000 | |||||
| *The basis for the assumed risk (e.g. the median control group risk across studies) is provided in footnotes. The corresponding risk (and its 95% confidence interval) is based on the assumed risk in the comparison group and the relative effect of the intervention (and its 95% CI). | ||||||
| GRADE Working Group grades of evidence | ||||||
| 1 Bone mineral density (BMD) testing is an important outcome for osteoporosis because it leads to the diagnosis of the condition. This is one of the GP behaviour‐related outcomes (primary outcome) 2 Osteoporosis medication prescribing is an important outcome for osteoporosis management as it is the main aspect of treatment. This is one of the GP behaviour‐related outcomes (primary outcome) 3 The quality of evidence was downgraded because only two studies were included, one of which had a small number of participants and events. | ||||||
| Professional interventions for GPs on the management of osteoporosis compared to usual care | ||||
| Patient or population: General practitioners/family doctors involved in the management of patients with osteoporosis Settings: Primary care Intervention: Professional interventions (targeting physician‐only) Comparison: Usual care | ||||
| Outcomes | Impact (including effect sizes wherever available) | Number of Participants | Certainty of the evidence | Comments |
| Health professional (GP) behaviour‐related outcomes
|
|
|
| |
| Patient outcomes
| None of the included studies assessed these outcomes | |||
| Economic outcomes
| Majumdar 2007, assessed the cost effectiveness of the study Majumdar 2008, and concluded that the intervention led to a per patient cost saving of CAD 13 (USD 9) and a gain of 0.012 quality‐adjusted life years. | 272 participants (1 study) | ⊕⊕⊖⊖ low2 | |
| *The basis for the assumed risk (e.g. the median control group risk across studies) is provided in footnotes. The corresponding risk (and its 95% confidence interval) is based on the assumed risk in the comparison group and the relative effect of the intervention (and its 95% CI). | ||||
| GRADE Working Group grades of evidence | ||||
| 1The quality of evidence was downgraded because only two studies were included, one of which had a small number of participants and events, and in view of the considerable statistical heterogeneity observed. 2 The quality of evidence was downgraded because only one study was included which had some risk of bias. | ||||
| Professional interventions for GPs on the management of low back pain compared to usual care | ||||
| Patient or population: General practitioners/family doctors involved in the management of patients with low back pain Settings: Primary care Intervention: Professional interventions (targeting physician‐only) Comparison: Usual care | ||||
| Outcomes | Impact (including effect sizes wherever available) | No of studies | Certainty of the evidence | Comments |
| H ealth professional (GP) behaviour‐related outcomes | ||||
| Guideline‐consistent advice during consultation | Bishop 2006 showed that the intervention may result in little or no improvements (RD < 10%) with regard to guideline‐consistent advice about exercise, return to work and education and reassurance. Dey 2004 showed that the intervention probably results in a small reduction of sickness certification (RD 1.3). Engers 2005 showed that the intervention may lead to no improvement of GP behaviour with regards to patient education and advice during the consultation (RD range (‐1.3 to 12.8), authors reported OR ranging between 0.4 and 2.9). | 3 | ⊕⊕⊖⊖ low1 | |
| Guideline‐consistent prescribing of medication | Bishop 2006 showed that the intervention may lead to little improvements (RD < 10%) with regards to guideline‐consistent medication prescribing. Dey 2004 showed that the intervention probably results in no difference on prescribing rates of opioids (RD ‐1.3). Engers 2005 showed that the intervention may result in no improvement of GP behaviour with regard to prescribing (RD=2.8, OR=1, 95% CI (0.3 to 3), reported as not statistically significant). | 3 | ⊕⊕⊖⊖ low1 | |
| Guideline‐consistent referrals for investigations (e.g.. x‐rays) | Schectman 2003 showed that the intervention may result in little or no change in GP behaviour with regards to the number of guideline‐consistent referrals for lumbar spine x‐rays and CT scans (RD <5%). | 1 | ⊕⊕⊖⊖ low2 | |
| Guideline‐consistent referrals to other services | Bishop 2006 showed that the intervention may lead to little or no improvements (RD < 5%) with regards to guideline‐consistent referral to other services (such as physiotherapy). Schectman 2003 showed that the intervention may result in little or no difference with regards to the number of guideline‐consistent specialist or physiotherapy referrals (RD <5%). | 2 | ⊕⊕⊖⊖ low3 | |
| Number of investigations | Dey 2004 showed that the intervention probably results in a small increase in the ordering of x‐rays (RD 1.4). French 2013 showed that the intervention may lead to little or no difference in the number of x‐ray and CT requests (RD ‐0.2% and 0.0% respectively). Kerry 2000 showed that the intervention probably results in a cluster‐adjusted reduction of spinal x‐ray requests of 20% between the intervention and control groups (95% CI 4 to 36, P<0.05). Schectman 2003 showed that the intervention may result in little or no change in GP behaviour with regards to referrals for lumbar spine x‐rays and CT scans (RD <5%). | 4 | ⊕⊕⊖⊖low4 | |
| Number of referrals to other services | Dey 2004 showed that the intervention probably results in increased referrals to fast‐track physiotherapy and a back‐pain triage service (RD 12.6%). Engers 2005 showed that the intervention may lead to little reduction of onward referrals to a therapist (RD 4.6, 23% in the intervention group versus 28% in the control group, clustered adjusted OR 0.8, 95% CI (0.5 to 1.4)). Schectman 2003 showed that the intervention may result in little or no difference with regards to the number of specialist or physiotherapy referrals (RD <5%). | 3 | ⊕⊕⊖⊖ low4 | |
| Patient outcomes | ||||
| Functional capacity/activity scores | 0 | None of the included studies assessed this outcome | ||
| Pain control | 0 | None of the included studies assessed this outcome | ||
| Work absence | Hazard 1997 showed that the intervention may result in no improvement with respect to days of sick leave compared to the control group (RD ‐4.6%). | 1 | ⊕⊕⊖⊖ low2 | The study by Hazard 1997 was very small (just 53 participants) |
| Quality of life | 0 | None of the included studies assessed this outcome | ||
| Economic outcomes
| 0 | None of the included studies assessed these outcomes | ||
| *The basis for the assumed risk (e.g. the median control group risk across studies) is provided in footnotes. The corresponding risk (and its 95% confidence interval) is based on the assumed risk in the comparison group and the relative effect of the intervention (and its 95% CI). | ||||
| GRADE Working Group grades of evidence | ||||
| 1 The quality of evidence was downgraded because the studies have a high risk of bias and high heterogeneity in terms of the types of interventions evaluated. Additionally the effect sizes are small. 2 The quality of evidence was downgraded because the results are based only on one study with high risk of bias. 3 The quality of evidence was downgraded because the results are based on just two studies with high risk of bias. 4 The quality of evidence was downgraded because the studies have a high risk of bias and high heterogeneity in terms of the types of interventions evaluated. Additionally there is high inconsistency in the direction of effects across the studies. | ||||
| Professional interventions for GPs on the management of osteoarthritis compared to usual care | ||||
| Patient or population: General practitioners/family doctors involved in the management of patients with osteoarthritis Settings: Primary care Intervention: Professional interventions (targeting physician‐only) Comparison: Usual care | ||||
| Outcomes | Impact (including effect sizes wherever available) | No of studies | Certainty of the evidence | Comments |
| Health professional (GP) behaviour‐related outcomes | ||||
| Guideline‐consistent advice during consultation | Stross 1985 showed that the intervention may increase the use of intra‐articular corticosteroids (RD large at 29%). | ⊕⊕⊖⊖ low1 | ||
| Guideline‐consistent prescribing of medication | Rahme 2005 showed that the intervention may result in a slight improvement in osteoarthritis guideline‐consistent GP prescribing of medication (acetaminophen, NSAIDs and COX‐2 inhibitors) 5 months afterwards (RD 5% after dissemination of educational material, RD 7% after a workshop and RD 13% for the combined intervention) Rosemann 2007 showed that prescriptions for painkillers may slightly increase following the intervention (RDs between ‐2.2% and 11.1%). Stross 1985 showed that the intervention may reduce the use of systemic corticosteroids according to the guidelines (RD moderate at 19%). | ⊕⊕⊖⊖ low1 | ||
| Guideline‐consistent referrals for investigations (e.g.. x‐rays) | None of the included studies assessed this outcome | |||
| Guideline‐consistent referrals to other services | Stross 1985 showed that the intervention may increase the utilisation of physical therapy pre‐operatively (RD large at 57%). | ⊕⊕⊖⊖ low1 | ||
| Number of investigations | Rosemann 2007 showed that the intervention may result in some small reduction in the number of GP referrals for radiographs (SMD 0.2‐0.4). | ⊕⊕⊖⊖low3 | ||
| Number of referrals to other services | Rosemann 2007 showed that the intervention may result in a reduction in the number of GP referrals to orthopaedics (SMD 0.8 for the educational intervention and 0.2 for the combined intervention after adding nurse case management). | ⊕⊕⊖⊖ low4 | ||
| Patient outcomes | ||||
| Functional capacity/activity scores | Chassany 2006 showed that the intervention may result in small improvements with regard to physical function scores (WOMAC index physical function score) (SMD 0.3, P<0.05). | ⊕⊕⊖⊖ low5 | Results were assessed within two weeks of the Chassany 2006 trial, so it is unclear whether the positive patient outcomes persisted. | |
| Pain control | Chassany 2006 showed that the intervention may result in small improvements with regard to pain scores (VAS score, Pain relief (SPID), WOMAC index pain score) (SMD 0.2, P<0.05 across all outcomes). | ⊕⊕⊖⊖ low5 | Results were assessed within two weeks of the Chassany 2006 trial, so it is unclear whether the positive patient outcomes persisted. | |
| Work absence | None of the included studies assessed this outcome | |||
| Quality of life | Rosemann 2007 showed that the intervention may result in small or no improvement with regard to patient related outcomes (SMD <0.40). | ⊕⊕⊖⊖ low3 | ||
| Economic outcomes
| None of the included studies assessed these outcomes | |||
| *The basis for the assumed risk (e.g. the median control group risk across studies) is provided in footnotes. The corresponding risk (and its 95% confidence interval) is based on the assumed risk in the comparison group and the relative effect of the intervention (and its 95% CI). | ||||
| GRADE Working Group grades of evidence | ||||
| 1 The quality of evidence was downgraded because the results are based on one study only with high risk of bias and a small number of participants (114). 2 The quality of evidence was downgraded because the studies have high heterogeneity in terms of the types of interventions and the types of medications prescribed. 3 The quality of evidence was downgraded because the results are based on just one study and the effect size was small. 4 The quality of evidence was downgraded because the results are based on just one study and the effect size varies considerably between the two intervention groups. 5 The quality of evidence was downgraded because the results are based on just one study and were assessed just 2 weeks following the intervention. NSAIDs: Non steroidal anti‐inflammatory drugs, COX‐2 inhibitors: Cyclo‐oxygenase 2 inhibitors, WOMAC: Western Ontario and McMaster Universities Osteoarthritis Index, VAS: Visual analogue scale, SPID: sum of pain intensity differences. | ||||
| Professional interventions for GPs on the management of shoulder pain compared to usual care | ||||
| Patient or population: General practitioners/family doctors involved in the management of patients with shoulder pain Settings: Primary care Intervention: Professional interventions (targeting physician‐only) Comparison: Usual care | ||||
| Outcomes | Impact (including effect sizes wherever available) | Number of studies | Certainty of the evidence | Comments |
| Health professional (GP) behaviour‐related outcomes | ||||
| Guideline‐consistent advice during consultation | None of the included studies assessed this outcome | |||
| Guideline‐consistent prescribing of medication | None of the included studies assessed this outcome | |||
| Guideline‐consistent referrals for investigations (e.g.. x‐rays) | None of the included studies assessed this outcome | |||
| Guideline‐consistent referrals to other services | None of the included studies assessed this outcome | |||
| Number of investigations | Broadhurst 2007 showed that the intervention may result in a temporary, slight reduction in ultrasound requests, but little or no change in the x‐ray requests. | ⊕⊕⊖⊖ low1 | ||
| Number of referrals to other services | None of the included studies assessed this outcome | |||
| Patient outcomes | ||||
| Functional capacity/activity scores | Watson 2008 showed that the intervention may result in little or no improvement in function a year later (BSDQ SMD 0.2, SF‐36 for physical component SMD 0 and SF‐36 mental component SMD 0.1) | ⊕⊕⊖⊖ low2 | ||
| Pain control | None of the included studies assessed this outcome | |||
| Work absence | None of the included studies assessed this outcome | |||
| Quality of life | None of the included studies assessed this outcome | |||
| Economic outcomes
| McKenna 2009 assessed the cost effectiveness of providing practical training to GPs in the SAPPHIRE study by Watson 2008. It reported an incremental cost‐effectiveness ratio of GBP 2,813 per QALY gained for trained GPs. | ⊕⊕⊖⊖ low2 | ||
| *The basis for the assumed risk (e.g. the median control group risk across studies) is provided in footnotes. The corresponding risk (and its 95% confidence interval) is based on the assumed risk in the comparison group and the relative effect of the intervention (and its 95% CI). | ||||
| GRADE Working Group grades of evidence | ||||
| 1 The quality of evidence was downgraded because the results are based on just one study (CBA) with high risk of bias. 2 The quality of evidence was downgraded because the results are based on just one study and the effect size was small. BSDQ: British Shoulder Disability questionnaire, SF‐36: Short‐form 36 item Health Survey, GBP: Great Britain Pound | ||||
| Professional interventions for GPs on the management of shoulder pain compared to usual care | ||||
| Patient or population: General practitioners/family doctors involved in the management of patients with other musculoskeletal conditions Settings: Primary care Intervention: Professional interventions (targeting physician‐only) Comparison: Usual care | ||||
| Outcomes | Impact (including effect sizes wherever available) | No of studies | Certainty of the evidence | Comments |
| Health professional (GP) behaviour‐related outcomes | ||||
| Guideline‐consistent advice during consultation | None of the included studies assessed this outcome | |||
| Guideline‐consistent prescribing of medication | Huas 2006 showed that the intervention may result in increased level 3 (WHO classification) analgesic prescribing (SMD 1.2, P=0.02) | ⊕⊕⊖⊖ low1 | ||
| Guideline‐consistent referrals for investigations (e.g.. x‐rays) | None of the included studies assessed this outcome | |||
| Guideline‐consistent referrals to other services | None of the included studies assessed this outcome | |||
| Number of investigations | Kerry 2000 showed that the intervention may result in little or no reduction in GP knee radiology requests (relative change 10%, not statistically significant). | ⊕⊕⊖⊖ low2 | ||
| Number of referrals to other services | None of the included studies assessed this outcome | |||
| Patient outcomes | ||||
| Functional capacity/activity scores | None of the included studies assessed this outcome | |||
| Pain control | Huas 2006 showed that the intervention may result in worse patient‐related outcomes: pain relief scores (SMD 2, P=0.0004) | ⊕⊕⊖⊖ low1 | ||
| Work absence | None of the included studies assessed this outcome | |||
| Quality of life | None of the included studies assessed this outcome | |||
| Economic outcomes
| None of the included studies assessed these outcomes | |||
| *The basis for the assumed risk (e.g. the median control group risk across studies) is provided in footnotes. The corresponding risk (and its 95% confidence interval) is based on the assumed risk in the comparison group and the relative effect of the intervention (and its 95% CI). | ||||
| GRADE Working Group grades of evidence | ||||
| 1 The quality of evidence was downgraded because the results are based on just one study with high risk of bias. 2 The quality of evidence was downgraded because the results are based on just one study and the effect size was small. | ||||
| Table 1: Classification of relevant interventions from EPOC taxonomy | |
| Intervention | Description |
| Distribution of educational materials | Distribution of published or printed recommendations for clinical care, including clinical practice guidelines, audio‐visual materials and electronic publications. The materials may have been delivered personally or through mass mailings. |
| Educational meetings | Healthcare providers who have participated in conferences, lectures, workshops or traineeships |
| Local consensus processes | Inclusion of participating providers in discussion to ensure that they agreed that the chosen clinical problem was important and the approach to managing the problem was appropriate |
| Educational outreach visits | Use of a trained person who met with providers in their practice settings to give information with the intent of changing the provider’s practice. The information given may have included feedback on the performance of the provider(s) |
| Local opinion leaders | Use of providers nominated by their colleagues as ‘educationally influential’. The investigators must have explicitly stated that their colleagues identified the opinion leaders |
| Patient‐mediated | New clinical information (not previously available) collected directly from patients and given to the provider e.g. depression scores from an instrument |
| Audit and feedback | Any summary of clinical performance of health care over a specified period of time. The summary may also have included recommendations for clinical action. The information may have been obtained from medical records, computerised databases, or observations from patients |
| Reminders | Patient or encounter specific information, provided verbally, on paper or on a computer screen, which is designed or intended to prompt a health professional to recall information. This would usually be encountered through their general education; in the medical records or through interactions with peers, and so remind them to perform or avoid some action to aid individual patient care. Computer aided decision support and drugs dosage are included. |
| Marketing | Use of personal interviewing, group discussion (‘focus groups’), or a survey of targeted providers to identify barriers to change and subsequent design of an intervention that addresses identified barriers |
| Mass media | (i) Varied use of communication that reached great numbers of people including television, radio, newspapers, posters, leaflets, and booklets, alone or in conjunction with other interventions; (ii) Targeted at the population level |
| Other | Patient‐directed (education and reminders to see their primary care physician) |
| Table 2. Intervention types used in each study (N.B. All interventions evaluated were professional) | ||
| Intervention methods 1,2 | No. of Studies | Studies 3 |
| Distribution of educational materials | 27 | Becker 2008; Bessette 2011; Bishop 2006; Boyd 2002; Broadhurst 2007; Chassany 2006; Ciaschini 2010; Cranney 2008; Dey 2004; Eccles 2001; Engers 2005; Feldstein 2006; French 2013; Hazard 1997; Hollingworth 2002; Kerry 2000; Leslie 2012; Majumdar 2008; Rahme 2005; Robling 2002; Rosemann 2007; Roux 2013; Rozental 2008; Schectman 2003; Solomon 2007a; Stross 1985; Watson 2008 |
| Educational meetings | 10 | Becker 2008; Chassany 2006; Engers 2005; French 2013; Gormley 2003; Huas 2006; Rahme 2005; Rosemann 2007; Schectman 2003, Watson 2008 |
| Local consensus processes | 0 | |
| Educational outreach visits | 6 | Becker 2008; Broadhurst 2007; Dey 2004; Robling 2002; Schectman 2003; Solomon 2007a |
| Local opinion leaders | 3 | |
| Patient‐mediated | 6 | Boyd 2002; Ciaschini 2010; Cranney 2008; Huas 2006; Roux 2013; Rozental 2008 |
| Audit and feedback | 4 | |
| Reminders | 11 | Bishop 2006; Ciaschini 2010; Cranney 2008; Eccles 2001; Feldstein 2006; Hazard 1997; Lafata 2007; Leslie 2012; Majumdar 2008; Roux 2013; Rozental 2008 |
| Marketing | 0 | |
| Mass media | 0 | |
| Patient‐directed4 | 12 | Becker 2008; Bessette 2011; Bishop 2006; Leslie 2012; Ciaschini 2010; Cranney 2008; Feldstein 2006; Lafata 2007; Majumdar 2008; Rosemann 2007; Roux 2013; Solomon 2007a |
| 1. Category of intervention as classified by the EPOC taxonomy EPOC 2007 [9] 2. See Table 1 for definition of each intervention 3. Some studies used more than one intervention type and these are listed against their corresponding category 4. Patient‐directed interventions targeted patients and included patient education and reminders to see their primary‐care physician. These were included in the review only if they were a component of a professional intervention targeting primary‐care physicians | ||
| Table 3. Intervention combinations compared to a no‐intervention control group | ||
| Intervention combinations | No. of comparisons | Study ID |
| Single component interventions: | ||
| Distribution of educational materials | 1 | |
| Patient‐directed | 3 | |
| Educational meetings, workshops | 1 | |
| Multifaceted interventions: Two intervention components | ||
| Distribution of educational material + reminders | 4 | |
| Distribution of educational material + educational outreach visits | 4 | |
| Distribution of educational material + educational meeting/workshop | 6 | Chassany 2006; Engers 2005; French 2013; Rahme 2005; Rosemann 2007; Watson 2008 |
| Distribution of educational material + local opinion leaders | 1 | |
| Distribution of educational material + audit/feedback | 1 | |
| Patient‐mediated + educational meeting/workshop | 1 | |
| Patient‐directed +reminder | 1 | |
| Patient‐directed + educational material | 1 | |
| Multifaceted interventions: Three intervention components | ||
| Patient‐directed + educational material + reminder | 3 | |
| Patient‐directed + educational material + educational meeting/workshop | 1 | |
| Patient‐directed + educational material + educational outreach visit | 1 | |
| Multifaceted interventions: Four intervention components | ||
| Patient‐directed + distribution of educational material + reminder + local opinion leaders | 1 | |
| Patient‐mediated + distribution of educational material + reminders + patient‐directed (education and reminders) | 3 | |
| Multifaceted interventions: Five intervention components | ||
| Distribution of educational material + educational meetings/workshops + audit + educational outreach visit + local opinion leaders | 1 | |
| Table 4. Intervention combinations compared to a different intervention | ||
| Intervention combinations | No. of comparisons | Study ID |
| Single component interventions: | ||
| Educational meetings/workshops vs distribution of educational material | 1 | |
| Educational meetings/workshops vs a different educational meeting/workshop | 1 | |
| Multifaceted interventions: Two intervention components | ||
| Distribution of educational material + patient‐mediated vs the same intervention but less intensive | 1 | |
| Distribution of educational material + educational outreach visit vs distribution of educational material | 1 | |
| Distribution of educational material + audit vs distribution of educational material | 2 | |
| Distribution of educational material + audit vs distribution of educational material + reminder | 1 | |
| Distribution of educational material + outreach vs distribution of educational material + audit | 1 | |
| Distribution of educational material + educational outreach visit vs patient‐directed | 1 | |
| Distribution of educational material + patient‐directed vs the same (more intensive) | 1 | |
| Patient‐directed + reminder vs patient‐directed | 1 | |
| Distribution of educational material + reminder vs distribution of educational material | 1 | |
| Distribution of educational material + reminder vs patient‐mediated | 1 | |
| Distribution of educational material + educational meeting/workshop vs educational meeting/workshop | 1 | |
| Distribution of educational material + educational meeting/workshop vs distribution of educational material | 1 | |
| Multifaceted interventions: Three intervention components | ||
| Distribution of educational material + reminders + patient‐directed vs distribution of educational material + reminders | 2 | |
| Distribution of educational material + reminder + patient‐directed vs patient‐directed | 1 | |
| Distribution of educational material + audit + reminders vs distribution of educational material | 1 | |
| Distribution of educational material + audit + reminders vs distribution of educational material + audit | 1 | |
| Distribution of educational material + audit + reminders vs distribution of educational material + reminders | ||
| Distribution of educational material + audit + outreach vs distribution of educational material + outreach | 1 | |
| Distribution of educational material + audit + outreach vs distribution of educational material + audit | 1 | |
| Distribution of educational material + audit + outreach vs distribution of educational material | 1 | |
| Distribution of educational material + educational meetings/workshops + educational outreach visits vs distribution of educational material | 1 | |
| Distribution of educational material + educational outreach visit + patient‐directed vs patient‐directed | 1 | |
| Distribution of educational material + educational outreach visit + patient‐directed vs distribution of educational material + educational outreach visit | 1 | |
| Distribution of educational material + educational meeting/workshop + patient‐directed vs distribution of educational material + educational meeting/workshop | 1 | |
| Multifaceted interventions: Four intervention components | ||
| Distribution of educational material + educational meetings/workshops + educational outreach visits + patient‐directed vs distribution of educational material | 1 | |
| Distribution of educational material + educational meetings/workshops +educational outreach visits + patient directed vs distribution of educational material + educational meetings/workshops + educational outreach visits | 1 | |
| Patient‐mediated + distribution of education material + reminders + patient‐directed (education and reminders) vs patient‐mediated + distribution of education material + reminders + patient‐directed (education and reminders) | 1 | |
| (Study) Intervention | Int pre (%) 1 | C pre (%)2 | Int post (%)3 | C post (%)4 | ARD 5 | Risk difference 6 (P value if reported by authors) | Relative % change post 7 | Risk ratio 8 |
| Patient education and reminder to see their physician (patient directed), education of physician via the patient (distribution of educational material) | ‐ | ‐ | 14.72% | 11.96% | ‐ | 2.8% | 23% | 1.2 |
| Patient education (including video on osteoporosis) and reminder to see their physician, education of physician via the patient (distribution of educational material) | ‐ | ‐ | 15.81% | 11.96% | ‐ | 3.9% | 32% | 1.3 |
| (Cranney 2008)** Patient‐specific mailed letter to primary are physician (including guidelines) and patient education and reminder | ‐ | ‐ | 64/125 (51%) | 36/145 (25%) | ‐ | 26.4% (P< 0.0001) | 106% | 2.1 |
| Patient‐specific Electronic Medical Record (EMR) reminders to primary‐care provider informing them of patient increased risk and guidelines. Sent twice. | ‐ | ‐ | 40/101 (39.6%) | 2/103 (1.9%) | ‐ | 37.7% (P< 0.01) | 1940% | 20.4 |
| EMR reminder plus patient‐directed intervention: education and reminder | ‐ | ‐ | 36/110 (32.7%) | 2/103 (1.9%) | ‐ | 30.8% (P< 0.01) | 1585% | 16.9 |
| (Lafata 2007)** Patient‐directed: 2 mailings (educational and reminders) | ‐ | ‐ | 720/3367 (21.4%) | 313/2901 (10.8%) | ‐ | 10.6% (P< 0.001) | 98% | 2 |
| (Lafata 2007)** Physician prompt: Electronic Medical Record (EMR) reminder to physician and biweekly mailing plus patient‐directed: 2 mailings (educational and reminders) | ‐ | ‐ | 1181/4086 (28.9%) | 313/2901 (10.8%) | ‐ | 18.1% (P< 0.001) | 168% | 2.7 |
| Physician reminder plus educational material | 224/1363 (16.4%) | 58/1480 (3.9%) | ‐ | 12.5% | 319% | 4.2 | ||
| Physician reminder plus educational material plus patient‐directed intervention (reminder to see their physician) | ‐ | ‐ | 258/1421 (18.2%) | 58/1480 (3.9%) | ‐ | 14.2% | 363% | 4.6 |
| Patient education, physician patient‐specific reminders by mail/fax, physician guidelines endorsed by opinion leaders | ‐ | ‐ | 71/137 (51.8%) | 24/135 (17.8%) | ‐ | 34% (P< 0.001) | 192% | 2.9 |
| (Solomon 2007a)** Patient directed (3 mailed letters educational) | ‐ | ‐ | 249/3274 (7.6%) | 224/3268 (6.9%) | ‐ | 0.8% (NS) | 11% | 1.1 |
| (Solomon 2007a)** Physician education following an academic‐detailing approach | ‐ | ‐ | 183/3574 (5.1%) | 224/3268 (6.9%) | ‐ | ‐1.7% (NS) | ‐25% | 0.7 |
| (Solomon 2007b)** Combination of both physician and patient education | ‐ | ‐ | 223/3339 (6.7%) | 224/3268 (6.9%) | ‐ | ‐0.2% (NS) | ‐3% | 1 |
| 1. Intervention group pre‐intervention proportion 2. Control group pre‐intervention proportion 3. Intervention group post‐intervention proportion 4. Control group post‐intervention proportion 5. ARD = [Int post (%) minus C post (%)] minus [Int pre (%) minus C pre (%)]. The direction of effect has been adjusted so that a positive result represents a beneficial intervention outcome, according to Grimshaw 2004. 6. Risk Difference (RD) is the absolute % change post‐intervention = Int post (%) minus C post (%). This is considered to be "small" if ≤ 5%, "modest" if > 5% and ≤10%,"moderate" if > 10% but ≤ 20%, and "large" if > 20%.The direction of effect has been adjusted so that a positive result represents a beneficial intervention outcome, according to Grimshaw 2004. 7. Relative % change post = absolute % change post divided by C post (%). The direction of effect has been adjusted so that a positive result represents a beneficial intervention outcome, according to Grimshaw 2004. 8. Risk ratio (RR) = Int post (%) divided by C post (%) BMD: bone mineral density; C: control group; Int: intervention group; ARD: adjusted risk difference; NS: not significant * In the study by Bessette 2011, the outcomes reported above include the participants with a diagnosis following the intervention. The women were considered "diagnosed" if they received a BMD test, if they were informed by their physician that they were suffering from osteoporosis and/or if they were initiated on osteoporosis medication. Therefore, the above percentages do not necessarily mean that the women received a BMD test. ** The data reported above for the studies by Cranney 2008, Lafata 2007 and Solomon 2007b does not account for clustering. We did not have access to sufficient information to adjust the data for clustering. | ||||||||
| (Study) Intervention | Int pre (%) 1 | C pre (%)2 | Int post (%)3 | C post (%)4 | ARD 5 | Risk difference 6 (P value if reported by authors) | Relative % change post 7 | Risk ratio 8 |
| Patient education (patient directed), education of physician via the patient (for group of patients without diagnosis or treatment at randomisation) | ‐ | ‐ | 11.79% | 7.78% | ‐ | 4% | 52% | 1.5 |
| Patient education (including video on osteoporosis), education of physician via the patient (for group of patients without diagnosis or treatment at randomisation) | ‐ | ‐ | 10.64% | 7.78% | ‐ | 2.9% | 37% | 1.4 |
| Patient education (patient directed), education of physician via the patient (for group of patients without treatment at randomisation) | ‐ | ‐ | 13.49% | 10.31% | ‐ | 3.2% | 31% | 1.3 |
| Patient education (including video on osteoporosis), education of physician via the patient (for group of patients without treatment at randomisation) | ‐ | ‐ | 12.71% | 10.31% | ‐ | 2.4% | 23% | 1.2 |
| Patient education, education of physician via the patient where the patient did pass the information on to the physician (for group of patients without treatment at randomisation) | ‐ | ‐ | 15% | 10% | ‐ | 5% | 50% | 1.5 |
| Patient‐specific evidence‐based recommendations targeted to improve osteoporosis treatment to both the patients and their primary‐care providers | ‐ | ‐ | 29/52 (55.8%) | 16/60 (26.7%) | ‐ | 29.1% | 109% | 2.1 |
| (Cranney 2008)* Patient‐specific mailed letter to primary are physician (including guidelines) and patient education and reminder | ‐ | ‐ | 35/125 (28%) | 15/145 (10.3%) | ‐ | 17.7% (P=0.0002) | 171% | 2.7 |
| Patient‐specific Electronic Medical Record (EMR) reminders to primary‐care provider informing them of patient increased risk and guidelines. Sent twice. | ‐ | ‐ | 28/101 (27.7%) | 5/103 (5%) | ‐ | 22.9% (P< 0.01) | 471% | 5.7 |
| EMR reminder plus patient‐directed intervention: education and reminder | ‐ | ‐ | 22/110 (20.2%) | 5/103 (5%) | ‐ | 15.1% (P< 0.01) | 312% | 4.1 |
| (Lafata 2007)* Patient‐directed: x2 mailings (educational and reminders) | ‐ | ‐ | 11/128 (8.6%) | 3/51 (5.9%) | ‐ | 2.7% | 46% | 1.5 |
| (Lafata 2007)* Physician prompt: Electronic Medical Record (EMR) reminder to physician and biweekly mailing plus Patient‐directed: 2 mailings (educational and reminders) | ‐ | ‐ | 15/162 (9.3%) | 3/51 (5.9%) | ‐ | 3.4% | 57% | 1.6 |
| Physician reminder plus educational material | ‐ | ‐ | 200/1363 (14.7%) | 157/1480 (10.6%) | ‐ | 4.1% | 38% | 1.4 |
| Physician reminder plus educational material plus patient‐directed intervention (reminder to see their physician) | ‐ | ‐ | 234/1421 (16.5%) | 157/1480 (10.6%) | ‐ | 5.9% | 55% | 1.6 |
| Patient education, physician patient‐specific reminders by mail/fax, physician guidelines endorsed by opinion leaders | ‐ | ‐ | 30/137 (21.9%) | 10/135 (7.4%) | ‐ | 14.5% (P<0.001) | 196% | 3 |
| Verbal and written information on osteoporosis to patient and letter with specific management plan sent to their treating physician. Patient reminders at 6 and 12 months. Reminder to physician if patient untreated at 6 months | 82/275 (29.8%) | 45/199 (22.6%) | 151/275 (54.9%) | 71/199 (35.7%) | 12% | 19.2% (P< 0.005) | 54% | 1.5 |
| Verbal and written information on osteoporosis to patient and letter with specific management plan sent to their treating physician. Blood tests and BMD test ordered for patient and results sent to the physician. Patient reminders at 4,8 and 12 months and physician reminders at 4 and 8 months if patient remained untreated | 65/251 (25.9%) | 45/199 (22.6%) | 156/251 (62.2%) | 71/199 (35.7%) | 23.2% | 26.5% (P< 0.005) | 74% | 1.7 |
| Patient directed (x3 mailed letters educational) | ‐ | ‐ | 208/3274 (6.4%) | 231/3268 (7.1%) | ‐ | ‐0.7% | ‐10% | 0.9 |
| Physician education following an academic detailing approach | ‐ | ‐ | 197/3574 (5.5%) | 231/3268 (7.1%) | ‐ | ‐1.6% | ‐22% | 0.8 |
| Combination of both physician and patient education | ‐ | ‐ | 236/3339 (7.1%) | 231/3268 (7.1%) | ‐ | 0 | 0 | 1 |
| 1. Intervention group pre‐intervention proportion 2. Control group pre‐intervention proportion 3. Intervention group post‐intervention proportion 4. Control group post‐intervention proportion 5. ARD = [Int post (%) minus C post (%)] minus [Int pre (%) minus C pre (%)]. The direction of effect has been adjusted so that a positive result represents a beneficial intervention outcome, according to Grimshaw 2004. 6. Risk Difference (RD) is the absolute % change post‐intervention = Int post (%) minus C post (%). This is considered to be "small" if ≤ 5%, "modest" if > 5% and ≤10%,"moderate" if > 10% but ≤ 20%, and "large" if > 20%.The direction of effect has been adjusted so that a positive result represents a beneficial intervention outcome, according to Grimshaw 2004. 7. Relative % change post = absolute % change post divided by C post (%). The direction of effect has been adjusted so that a positive result represents a beneficial intervention outcome, according to Grimshaw 2004. 8. Risk ratio (RR) = Int post (%) divided by C post (%) BMD: bone mineral density; C: control group; Int: intervention group; ARD: adjusted risk difference; NS: not significant * The data reported above for the studies by Cranney 2008, Lafata 2007 and Solomon 2007b does not account for clustering. We did not have access to sufficient information to adjust the data for clustering. | ||||||||
| (Study) Interventions | Int 1 pre (%) 1 | Int 2 pre (%)2 | Int 1 post (%)3 | Int 2 post (%)4 | ARD 5 | Risk difference6 (P value if reported by authors) | Relative % change post 7 | Risk ratio 8 |
| Patient education, education of physician via the patient, reminder to family physician versus Patient education (including video on osteoporosis), education of physician via the patient, reminder to family physician | 14.72% | 15.81% | ‐1.1% | ‐7% | 0.9 | |||
| Patient‐specific letter to primary care physician containing information on results and recommendations: standard versus extended letter | ‐ | ‐ | 25/83 (30.1%) | 29/78 (37.2%) | ‐ | ‐7.1% | ‐19% | 0.8 |
| Patient‐specific Electronic Medical Record (EMR) reminders to primary‐care provider informing them of patient increased risk and guidelines (sent twice) versus EMR plus patient‐directed intervention (education and reminder) | ‐ | ‐ | 40/101 (39.6%) | 36/110 (32.7%) | ‐ | 6.9% | 21% | 1.2 |
| (Lafata 2007)** Patient‐directed: 2 mailings (educational and reminders) versus physician prompt: Electronic Medical Record (EMR) reminder to physician and biweekly mailing plus patient‐directed: 2 mailings (educational and reminders) | ‐ | ‐ | 720/3367 (21.4%) | 1181/4086 (28.9%) | ‐ | ‐7.5% | ‐26% | 0.7 |
| Physician reminder plus educational material versus physician reminder plus educational material plus patient‐directed intervention (reminder to see their physician) | ‐ | ‐ | 224/1363 (16.4%) | 258/1421 (18.2%) | ‐ | ‐1.7% (NS) | ‐9% | 0.9 |
| Patient‐specific letter to primary‐care physician outlining guidelines versus orthopaedic surgeon ordering BMD and forwarding results to primary‐care physician | 7/23 (30.4%) | 25/27(92.6%) | ‐ | ‐62.2% | ‐67% | 0.3 | ||
| (Solomon 2007a)** Patient‐directed (3 mailed letters educational) versus physician education following an academic‐detailing approach | ‐ | ‐ | 249/3274 (7.6%) | 183/3574 (5.1%) | ‐ | 2.5% | 49% | 1.5 |
| (Solomon 2007a)** Patient‐directed (3 mailed letters educational) versus combination of both physician and patient education | ‐ | ‐ | 249/3274 (7.6%) | 223/3339 (6.7%) | ‐ | 0.9% | 14% | 1.1 |
| (Solomon 2007a)** Physician education following an academic‐detailing approach versus combination of both physician and patient education | ‐ | ‐ | 183/3574 (5.1%) | 223/3339 (6.7%) | ‐ | ‐1.6% | ‐23% | 0.8 |
| 1. Intervention 1 group pre‐intervention proportion 2. Intervention 2 group pre‐intervention proportion 3. Intervention 1 group post‐intervention proportion 4. Intervention 2 group post‐intervention proportion 5. ARD = [Int 1 post (%) minus Int 2 post (%)] minus [Int 1 pre (%) minus Int 2 pre (%)]. The direction of effect has been adjusted so that a positive result represents a beneficial intervention 1 outcome, according to Grimshaw 2004. 6. Risk Difference (RD) is the absolute % change post‐intervention = Int 1 post (%) minus Int 2 post (%). This is considered to be "small" if ≤ 5%, "modest" if > 5% and ≤10%,"moderate" if > 10% but ≤ 20%, and "large" if > 20%.The direction of effect has been adjusted so that a positive result represents a beneficial intervention 1 outcome. 7. Relative % change post = absolute % change post divided by Int 2 post (%). The direction of effect has been adjusted so that a positive result represents a beneficial intervention 1 outcome, according to Grimshaw 2004. 8. Risk ratio (RR) = Int 1 post (%) divided by Int 2 post (%) BMD: bone mineral density; Int 1: intervention 1 group; Int 2: Intervention 2 group; ARD: adjusted risk difference; NS: not significant * In the study by Bessette 2011, the outcomes reported above include the participants with a diagnosis following the intervention. The women were considered "diagnosed" if they received a BMD test, if they were informed by their physician that they were suffering from osteoporosis and/or if they were initiated on osteoporosis medication. Therefore, the above percentages do not necessarily mean that the women received a BMD test. **The data reported above for the studies by Lafata 2007 and Solomon 2007b does not account for clustering. We did not have access to sufficient information to adjust the data for clustering. | ||||||||
| (Study) Interventions | Int 1 pre (%) 1 | Int 2 pre (%)2 | Int 1 post (%)3 | Int 2 post (%)4 | ARD 5 | Risk difference 6 (P value if reported by authors) | Relative % change post 7 | Risk ratio 8 |
| Patient education, education of physician via the patient, reminder to family physician (for group of patients without diagnosis or treatment at randomisation) versus Patient education (including video on osteoporosis), education of physician via the patient, reminder to family physician (for group of patients without diagnosis and treatment at randomisation) | ‐ | ‐ | 11.79% | 10.64% | ‐ | 1.2% | 11% | 1.1 |
| Patient education, education of physician via the patient, reminder to family physician (for group of patients without diagnosis or treatment at randomisation) versus Patient education (including video on osteoporosis), education of physician via the patient, reminder to family physician (for group of patients without treatment at randomisation) | ‐ | ‐ | 13.49% | 12.71% | ‐ | 0.8% | 6% | 1.1 |
| Patient‐specific letter to primary care physician containing information on results and recommendations: standard versus extended letter | ‐ | ‐ | 11/104 (10.6%) | 14/93 (15.1%) | ‐ | ‐4.5% | ‐30% | 0.7 |
| Patient specific Electronic Medical Record (EMR) reminders to primary care provider informing them of patient increased risk and guidelines (sent twice) versus EMR plus patient‐directed intervention (education and reminder). | ‐ | ‐ | 28/101 (27.7%) | 22/110 (20%) | ‐ | 7.7% | 39% | 1.4 |
| (Lafata 2007)* Patient‐directed: 2 mailings (educational and reminders) versus physician prompt: Electronic Medical Record (EMR) reminder to physician and biweekly mailing plus patient‐directed: 2 mailings (educational and reminders) | ‐ | ‐ | 11/128 (8.6%) | 15/162 (9.3%) | ‐ | ‐0.7% | ‐7% | 0.9 |
| Physician reminder plus educational material versus physician reminder plus educational material plus patient‐directed intervention (reminder to see their physician) | ‐ | ‐ | 200/1363 (14.7%) | 234/1421 (16.5%) | ‐ | ‐1.8% (NS) | ‐11% | 0.9 |
| Verbal and written information on osteoporosis to patient and letter with specific management plan sent to their treating physician. Patient reminders at 6 and 12 months. Reminder to physician if patient untreated at 6 months versus verbal and written information on osteoporosis to patient and letter with specific management plan sent to their treating physician. Blood tests and BMD test ordered for patient and results sent to the physician. Patient reminders at 4,8 and 12 months and physician reminders at 4 and 8 months if patient remained untreated | 82/275 (29.8%) | 65/251 (25.9%) | 151/275 (54.9%) | 156/251 (62.2%) | ‐11.2% | ‐7.2% (P<0.001) | ‐12% | 0.9 |
| Patient specific letter to primary care physician outlining guidelines versus orthopaedic surgeon ordering BMD and forwarding results to primary‐care physician | 6/23 (26.1%) | 20/27(74.1%) | ‐ | ‐48% | ‐65% | 0.4 | ||
| Patient directed (x3 mailed letters educational) versus physician education following an academic detailing approach | ‐ | ‐ | 208/3274 (6.4%) | 197/3574 (5.5%) | ‐ | 0.8% | 15% | 1.2 |
| Patient directed (x3 mailed letters educational) versus combination of both physician and patient education | ‐ | ‐ | 208/3274 (6.4%) | 236/3339 (7.1%) | ‐ | ‐0.7% | ‐10% | 0.9 |
| Physician education following an academic detailing approach versus combination of both physician and patient education | ‐ | ‐ | 197/3574 (5.5%) | 236/3339 (7.1%) | ‐ | ‐1.6% | ‐22% | 0.8 |
| 1. Intervention 1 group pre‐intervention proportion 2. Intervention 2 group pre‐intervention proportion 3. Intervention 1 group post‐intervention proportion 4. Intervention 2 group post‐intervention proportion 5. ARD = [Int 1 post (%) minus Int 2 post (%)] minus [Int 1 pre (%) minus Int 2 pre (%)]. The direction of effect has been adjusted so that a positive result represents a beneficial intervention 1 outcome, according to Grimshaw 2004. 6. Risk Difference (RD) is the absolute % change post‐intervention = Int 1 post (%) minus Int 2 post (%). This is considered to be "small" if ≤ 5%, "modest" if > 5% and ≤10%,"moderate" if > 10% but ≤ 20%, and "large" if > 20%.The direction of effect has been adjusted so that a positive result represents a beneficial intervention 1 outcome. 7. Relative % change post = absolute % change post divided by Int 2 post (%). The direction of effect has been adjusted so that a positive result represents a beneficial intervention 1 outcome, according to Grimshaw 2004. 8. Risk ratio (RR) = Int 1 post (%) divided by Int 2 post (%) BMD: bone mineral density; Int 1: intervention 1 group; Int 2: Intervention 2 group; ARD: Adjusted risk difference; NS: not significant * The data reported above for the studies by Lafata 2007 and Solomon 2007b does not account for clustering. We did not have access to sufficient information to adjust the data for clustering. | ||||||||
| (Study) Intervention | Outcome | Int pre (%) 1 | C pre (%)2 | Int post (%)3 | C post (%)4 | ARD 5 | Risk difference 6 (P value if reported by authors) | Relative % change post 7 | Risk ratio 8 |
| Physician education (guidelines) and 3 patient‐specific reminder letters | Education and reassurance according to guideline 0 ‐ 4 weeks post‐onset | ‐ | ‐ | 10% (16/162) | 7% (10/149) | 3.2% | 47% | 1.5 | |
| Exercise according to guideline 0 ‐ 4 weeks post‐onset | ‐ | ‐ | 38% (62/162) | 43% (64/149) | ‐4.7% | ‐11% | 0.9 | ||
| Appropriate medication according to guideline 0 ‐ 4 weeks post‐onset | ‐ | ‐ | 85% (138/162) | 77% (115/149) | 8% (P=0.14) | 10% | 1.1 | ||
| Spinal manipulation according to guideline 0 ‐ 4 weeks post‐onset | ‐ | ‐ | 2.5% (4/162) | 6% (9/149) | ‐3.6% | ‐59% | 0.4 | ||
| Guideline‐discordant physician recommended treatment 0 ‐ 4 weeks post‐onset | ‐ | ‐ | 10% (16/162) | 17% (25/149) | 6.9% (P=0.05) | 41% | 0.6 | ||
| Supervised exercise programme (recommended treatment 5 ‐ 12 weeks post‐onset) | ‐ | ‐ | 19% (29/154) | 14% (21/149) | 4.7% (P=0.11) | 34% | 1.3 | ||
| Return to work (recommended treatment 5 ‐ 12 weeks post‐onset) | ‐ | ‐ | 24% (37/154) | 17% (25/149) | 7.2% (P=0.18) | 43% | 1.4 | ||
| Refer to interdisciplinary programme (recommended treatment 5 ‐ 12 weeks post‐onset) | ‐ | ‐ | 4% (6/154) | 2% (3/149) | 1.9% | 94% | 1.9 | ||
| Physiotherapy > 4 weeks (guideline‐discordant) | ‐ | ‐ | 41% (63/154) | 43% (64/149) | 2% | 5% | 1 | ||
| Continued use of spinal manipulation therapy (guideline‐discordant) | ‐ | ‐ | ‐(no data available) | 33% (49/149) | ‐ (P=0.04) | ‐ | |||
| Physician education, reminders and also patient education and 3 reminders | Education and reassurance according to guideline 0 ‐ 4 weeks post‐onset | ‐ | ‐ | 6% (9/151) | 7% (10/149) | ‐0.8% | ‐11% | 0.9 | |
| Exercise according to guideline 0 ‐ 4 weeks post‐onset | ‐ | ‐ | 53% (80/151) | 43% (64/149) | 10% (P=0.05) | 23% | 1.2 | ||
| Appropriate medication according to guideline 0 ‐ 4 weeks post‐onset | ‐ | ‐ | 81% (122/151) | 77% (115/149) | 3.6% (P=0.08) | 5% | 1 | ||
| Spinal manipulation according to guideline 0 ‐ 4 weeks post‐onset | ‐ | ‐ | 5% (8/151) | 6% (9/149) | ‐0.7% | ‐12% | 0.9 | ||
| Guideline‐discordant physician recommended treatment 0 ‐ 4 weeks post‐onset | ‐ | ‐ | 18% (27/151) | 17% (25/149) | ‐1.1% | ‐7% | 1.1 | ||
| Supervised exercise programme (recommended treatment 5 ‐ 12 weeks post‐onset) | ‐ | ‐ | 18% (26/145) | 14% (21/149) | 3.8% (P=0.07) | 27% | 1.3 | ||
| Return to work (recommended treatment 5 ‐ 12 weeks post‐onset) | ‐ | ‐ | 23% (33/145) | 17% (25/149) | 6% (P=0.14) | 36% | 1.4 | ||
| Refer to interdisciplinary programme (recommended treatment 5 ‐ 12 weeks post‐onset) | ‐ | ‐ | 0 | 2% (3/149) | ‐2% | ‐100% | 0 | ||
| Physiotherapy > 4 weeks (guideline‐discordant) | ‐ | ‐ | 42% (61/145) | 43% (64/149) | 0.9% | 2% | 1 | ||
| Continued use of spinal manipulation therapy (guideline‐discordant) | ‐ | ‐ | 3% (4/145) | 33% (49/149) | 30.1% (P=0.05) | 92% | 0.1 | ||
| (Dey 2004)* Intervention (aimed at general practitioners): guidelines discussion (educational component), patient information leaflets, access to fast‐track physiotherapy and triage services for patients with persistent symptoms (organisational component) versus usual care (control)* | X‐ray referrals | 15.1% (43/284) | 13.7% (42/308) | ‐1.4% (P=0.62) | ‐10% | 1.1 | |||
| Sickness certificates | 17.9 % (34/190) | 19.2% (40/206) | 1.3% (P=0.74) | 7% | 0.9 | ||||
| Prescriptions for opioids or muscle relaxants | 18.6% (84/452) | 18.7% (92/491) | 0.1 (P=0.99) | 1 | 1 | ||||
| Referrals to secondary care | 3.4% (33/962) | 2.3% (24/1044) | ‐1.1% (P=0.12) | ‐49% | 1.5 | ||||
| Referrals to physiotherapy or educational programme | ‐ | ‐ | 26.3% (44/167) | 13.8% (25/181) | ‐ | ‐12.6% (P=0.01) | ‐91% | 1.9 | |
| (Engers 2005)** Intervention (aimed at general practitioners): guidelines on low back pain, 2‐hour workshop, 2 scientific articles, guidelines on low back pain for occupational physicians, tool for patient education and management‐decision tool. Control group: usual care | Referral to a therapist | ‐ | ‐ | 22.9% (75/328) | 27.4% (79/288) | ‐ | 4.6% | 17% | 0.8 |
| Prescription of pain medication on a time‐contingent basis | ‐ | ‐ | 70% (139/328) | 69% (130/288) | ‐ | 2.8% | 6% | 0.9 | |
| Handed patient information leaflet | ‐ | ‐ | 36.9% (121/328) | 38.2% (110/288) | ‐ | ‐1.3% | ‐3% | 1 | |
| Advised patient to stay active | ‐ | ‐ | 95.1% (312/328) | 89.2% (257/288) | ‐ | 5.9% | 7% | 1.1 | |
| Advised patient to gradually increase activity | ‐ | ‐ | 78% (256/328) | 65.3% (188/288) | ‐ | 12.8% | 20% | 1.2 | |
| Advised patient which activities to increase at what moment | ‐ | ‐ | 18% (58/328) | 9% (26/288) | ‐ | 8.7% | 96% | 2 | |
| (French 2013)*** Intervention (aimed at general practitioners): Interactive, educational workshops plus educational material disseminated (via DVDs); Control group: usual care** | Number of x‐ray requests out of total number of patients seen | ‐ | ‐ | 0.83% (67/8,085) | 1.02% (80/7,826) | 0.2% (P=0.2) | 19% | 0.8 | |
| Number of CT requests out of total number of patients seen | ‐ | ‐ | 0.61% (64/10,419) | 0.66% (66/10,085) | ‐ | 0.0% (P=0.6) | 7% | 0.9 | |
| Intervention (aimed at physicians): notification that patient was at a high risk of disability and guidelines on management. Control group: usual care | 3‐month work absence rates | ‐ | ‐ | 28.6% (8/28) | 24% (6/25) | ‐ | ‐4.6% (NS) | ‐19% | 1.2 |
| Intervention (aimed at physicians): guideline on low back pain, 90‐minute educational session on guideline implementation delivered by local opinion leaders and audit report summarising performance against the guideline plus outreach visit. Control group: usual care plus/minus patient education (pamphlet and video) | Lumbosacral X‐ray total utilisation (% of patients based on episode of care) | 31% | 21% | 19% | 18% | 9% | ‐1% | ‐6% | 1.1 |
| Lumbosacral X‐ray not consistent with guideline | 14.5% | 8.2% | 8.1% | 8.6% | 6.8% | 0.5% | 6% | 0.9 | |
| Lumbosacral CT/MRI total utilisation (% of patients based on episode of care) | 7.6% | 5.6% | 5.6% | 7.1% | 3.5% | 1.5% | 21% | 0.8 | |
| Lumbosacral CT/MRI not consistent with guideline | 5.7% | 3.5% | 3.5% | 5.4% | 4.1% | 1.9% | 35% | 0.6 | |
| Physical therapy referral total utilisation (% of patients based on episode of care) | 12% | 13% | 10% | 13% | 2% | 3% | 23% | 0.8 | |
| Physical therapy referral not consistent with guideline | 10% | 10.9% | 9.2% | 12% | 1.9% | 2.8% | 23% | 0.8 | |
| Specialty referral total utilisation (% of patients based on episode of care) | 12% | 5.9% | 8.6% | 7.1% | 4.6% | ‐1.5% | ‐21% | 1.2 | |
| Specialty referral not consistent with guideline | 9.5% | 4% | 7.1% | 5.6% | 4% | ‐1.5% | ‐27% | 1.3 | |
| 1. Intervention group pre‐intervention proportion 2. Control group pre‐intervention proportion 3. Intervention group post‐intervention proportion 4. Control group post‐intervention proportion 5. ARD = [Int post (%) minus C post (%)] minus [Int pre (%) minus C pre (%)]. The direction of effect has been adjusted so that a positive result represents a beneficial intervention outcome, according to Grimshaw 2004. 6. Risk Difference (RD) is the absolute % change post‐intervention = Int post (%) minus C post (%). This is considered to be "small" if ≤ 5%, "modest" if > 5% and ≤10%,"moderate" if > 10% but ≤ 20%, and "large" if > 20%.The direction of effect has been adjusted so that a positive result represents a beneficial intervention outcome, according to Grimshaw 2004. 7. Relative % change post = absolute % change post divided by C post (%). The direction of effect has been adjusted so that a positive result represents a beneficial intervention outcome, according to Grimshaw 2004. 8. Risk ratio (RR) = Int post (%) divided by C post (%) C: control group; Int: intervention group; ARD: adjusted risk difference; NS: not significant CT/MRI: computed tomography/magnetic resonance imaging * Dey 2004 reported the Intercluster Correlation (ICC) for the results (mean cluster size=95.1) and this was used to calculate the above effective sample sizes according to chapter 16.3.4 of the Cochrane Handbook, Higgins 2011a. ** The data reported above for the study by Engers 2005 does not account for clustering. We did not have access to sufficient information to adjust the data for clustering. ***French 2013 reported Intercluster Correlation (ICC for x‐rays 0.004 and for CTs 0.003, mean cluster size=2,154) and this was used to calculate the above effective sample sizes according to chapter 16.3.4 of the Cochrane Handbook, Higgins 2011a | |||||||||
| (Study) Intervention 1 versus intervention 2 | Outcome | Int 1 pre (%) 1 | Int 2 pre (%)2 | Int 1 post (%)3 | Int 2 post (%)4 | ARD 5 | Risk difference 6 (P value if reported by authors) | Relative % change post 7 | Risk ratio 8 |
| Physician education (guidelines) and 3 patient‐specific reminder letters versus physician education, reminders and also patient education and 3 reminders | Education and reassurance according to guideline 0 ‐ 4 weeks post‐onset | ‐ | ‐ | 10% (16/162) | 6% (9/151) | ‐ | 3.9% (NS) | 66% | 1.7 |
| Exercise according to guideline 0 ‐ 4 weeks post‐onset | ‐ | ‐ | 38% (62/162) | 53% (80/151) | ‐ | ‐14.7% (P=0.0083) | ‐28% | 0.7 | |
| Appropriate medication according to guideline 0 ‐ 4 weeks post‐onset | ‐ | ‐ | 85% (138/162) | 81% (122/151) | ‐ | 4.4% (NS) | 5% | 1.1 | |
| Spinal manipulation according to guideline 0 ‐ 4 weeks post‐onset | ‐ | ‐ | 2.5% (4/162) | 5% (13/151) | ‐ | ‐6.1% (P=0.018) | ‐71% | 0.3 | |
| Guideline‐discordant physician‐recommended treatment 0 ‐ 4 weeks post‐onset | ‐ | ‐ | 10% (16/162) | 18% (27/151) | ‐ | 8% (P=0.04) | 45% | 0.6 | |
| Supervised exercise programme (recommended treatment 5 ‐ 12 weeks post‐onset) | ‐ | ‐ | 19% (29/154) | 18% (26/145) | ‐ | 0.9% (NS) | 5% | 1.1 | |
| Return to work (recommended treatment 5 ‐ 12 weeks post‐onset) | ‐ | ‐ | 24% (37/154) | 23% (33/145) | ‐ | 1.3% (NS) | 6% | 1.1 | |
| Refer to interdisciplinary programme (recommended treatment 5 ‐ 12 weeks post‐onset) | ‐ | ‐ | 4% (6/154) | 0 | ‐ | 3.9% (P=0.02) | ‐ | ‐ | |
| Physiotherapy > 4 weeks (guideline‐discordant) | ‐ | ‐ | 41% (63/154) | 42% (61/145) | ‐ | 1.2% (NS) | 3% | 1 | |
| Continued use of spinal manipulation therapy (guideline‐discordant) | ‐ | ‐ | ‐ (no data available) | 3% (4/145) | ‐ | ‐ | ‐ | ‐ | |
| (Eccles 2001)* Feedback on number of spinal radiographs 6 months before and 6 months after the intervention plus guideline dissemination versus guideline dissemination | Lumbar spine radiographs concordant with guidelines | ‐ | ‐ | 35.4% (64/181) | 43.6% (120/275) | ‐ | ‐8.3% | ‐19% | 0.8 |
| (Eccles 2001)* Reminder messages on radiograph reports plus guideline dissemination versus guideline dissemination | Lumbar spine radiographs concordant with guidelines | ‐ | ‐ | 41.2% (35/85) | 43.6% (120/275) | ‐ | ‐2.5% | ‐6% | 0.9 |
| (Eccles 2001)* Feedback on number of spinal radiographs 6 months before and 6 months after the intervention plus guideline dissemination plus reminder messages on radiograph reports versus guideline dissemination | Lumbar spine radiographs concordant with guidelines | ‐ | ‐ | 36% (89/247) | 43.6% (120/275) | ‐ | ‐7.6% | ‐17% | 0.8 |
| (Eccles 2001)* Feedback on number of spinal radiographs 6 months before and 6 months after the intervention plus guideline dissemination versus reminder messages on radiograph reports plus guideline dissemination | Lumbar spine radiographs concordant with guidelines | ‐ | ‐ | 35.4% (64/181) | 41.2% (35/85) | ‐ | ‐5.8% | ‐14% | 0.9 |
| 1. Intervention 1 group pre‐intervention proportion 2. Intervention 2 group pre‐intervention proportion 3. Intervention 1 group post‐intervention proportion 4. Intervention 2 group post‐intervention proportion 5. ARD = [Int 1 post (%) minus Int 2 post (%)] minus [Int 1 pre (%) minus Int 2 pre (%)]. The direction of effect has been adjusted so that a positive result represents a beneficial intervention 1 outcome, according to Grimshaw 2004. 6. Risk Difference (RD) is the absolute % change post‐intervention = Int 1 post (%) minus Int 2 post (%). This is considered to be "small" if ≤ 5%, "modest" if > 5% and ≤10%,"moderate" if > 10% but ≤ 20%, and "large" if > 20%.The direction of effect has been adjusted so that a positive result represents a beneficial intervention 1 outcome. 7. Relative % change post = absolute % change post divided by Int 2 post (%). The direction of effect has been adjusted so that a positive result represents a beneficial intervention 1 outcome, according to Grimshaw 2004. 8. Risk ratio (RR) = Int 1 post (%) divided by Int 2 post (%) Int 1: intervention 1 group; Int 2: Intervention 2 group; ARD: Adjusted risk difference; NS: not significant *The data reported above for the study by Eccles 2001 does not account for clustering. We did not have access to sufficient information to adjust the data for clustering. | |||||||||
| (Study) Intervention 1 versus Intervention 2 | Outcome | Int 1 pre mean (SD)1 | Int 2 pre mean (SD)2 | Int 1 post mean (SD)3 | Int 2 post mean (SD)4 | MD 5 | Relative % change 6 | Adjusted relative % change7 | SMD8 (P value)9 |
| (Becker 2008*) Physician education: Guideline (in 4 versions including patient leaflet), 3 seminars and academic detailing versus guideline dissemination | Functional capacity measured by Hannover Functional Ability Questionnaire at 6 months | ‐ | ‐ | 72.9 | 70.3 | 2.7 | 4% | ‐ | 0.1 (P=0.12) |
| (Becker 2008*) Physician education (as above) plus practice nurse training in motivational counselling versus guideline dissemination | Functional capacity measured by Hannover Functional Ability Questionnaire at 6 months | ‐ | ‐ | 73.9 | 70.3 | 3.6 | 5% | ‐ | 0.2 (P=0.032) |
| (Becker 2008*) Physician education: Guideline (in 4 versions including patient leaflet), 3 seminars and academic detailing versus guideline dissemination | Days in pain at 6 months | ‐ | ‐ | 63.3 | 80.8 | 17.4 | 22% | ‐ | 0.2 (P=0.002) |
| (Becker 2008*) Physician education (as above) plus practice nurse training in motivational counselling versus guideline dissemination | Days in pain at 6 months | ‐ | ‐ | 62.9 | 80.8 | 17.9 | 22% | ‐ | 0.2 (P=0.001) |
| (Becker 2008*) Physician education: Guideline (in 4 versions including patient leaflet), 3 seminars and academic detailing versus guideline dissemination | Overall activity at 6 months | ‐ | ‐ | 36.5 | 33.5 | 3 | 9% | ‐ | 0.1 (P=0.203) |
| (Becker 2008*) Physician education (as above) plus practice nurse training in motivational counselling versus guideline dissemination | Overall activity at 6 months | ‐ | ‐ | 36.3 | 33.5 | 2.8 | 8% | ‐ | 0.1 (P=0.230) |
| (Becker 2008*) Physician education: Guideline (in 4 versions including patient leaflet), 3 seminars and academic detailing versus guideline dissemination | Days of sick leave at 6 months | ‐ | ‐ | 13 | 14.3 | 1.3 | 9% | ‐ | 0 (P=0.569) |
| (Becker 2008*) Physician education (as above) plus practice nurse training in motivational counselling versus guideline dissemination | Days of sick leave at 6 months | ‐ | ‐ | 13 | 14.3 | 1.3 | 9% | ‐ | 0 (P=0.584) |
| (Becker 2008*) Physician education: Guideline (in 4 versions including patient leaflet), 3 seminars and academic detailing versus guideline dissemination | Quality of life at 6 months | ‐ | ‐ | 66.6 | 66.8 | ‐0.3 | 0% | ‐ | 0 (P=0.847) |
| (Becker 2008*) Physician education (as above) plus practice nurse training in motivational counselling versus guideline dissemination | Quality of life at 6 months | ‐ | ‐ | 67.5 | 66.8 | 0.7 | 1% | ‐‐ | 0 (P=0.602) |
| (Becker 2008*) Physician education: Guideline (in 4 versions including patient leaflet), 3 seminars and academic detailing versus guideline dissemination | Functional capacity measured by Hannover Functional Ability Questionnaire at 12 months | ‐ | ‐ | 73 | 71.6 | 1.4 | 2% | ‐ | 0.1 (P=0.446) |
| (Becker 2008*) Physician education (as above) plus practice nurse training in motivational counselling versus guideline dissemination | Functional capacity measured by Hannover Functional Ability Questionnaire at 12 months | ‐ | ‐ | 74.6 | 71.6 | 3.1 | 4% | ‐ | 0.1 (P=0.088) |
| (Becker 2008*) Physician education: Guideline (in 4 versions including patient leaflet), 3 seminars and academic detailing versus guideline dissemination | Days in pain at 12 months | ‐ | ‐ | 58.5 | 71.3 | 12.8 | 18% | ‐ | 0.2 (P=0.018) |
| (Becker 2008*) Physician education (as above) plus practice nurse training in motivational counselling versus guideline dissemination | Days in pain at 12 months | ‐ | ‐ | 61.6 | 71.3 | 9.8 | 14% | ‐ | 0.1 (P=0.067) |
| (Becker 2008*) Physician education: Guideline (in 4 versions including patient leaflet), 3 seminars and academic detailing versus guideline dissemination | Overall activity at 12 months | ‐ | ‐ | 46.4 | 42.9 | 3.5 | 8% | ‐ | 0.1 (P=0.202) |
| (Becker 2008*) Physician education (as above) plus practice nurse training in motivational counselling versus guideline dissemination | Overall activity at 12 months | ‐ | ‐ | 45.4 | 42.9 | 2.5 | 6% | ‐ | 0.1 (P=0.396) |
| (Becker 2008*) Physician education: Guideline (in 4 versions including patient leaflet), 3 seminars and academic detailing versus guideline dissemination | Days of sick leave at 12 months | ‐ | ‐ | 6.2 | 9.3 | 3.1 | 34% | ‐ | 0.1 (P=0.256) |
| (Becker 2008*) Physician education (as above) plus practice nurse training in motivational counselling versus guideline dissemination | Days of sick leave at 12 months | ‐ | ‐ | 6.5 | 9.3 | 2.8 | 30% | ‐ | 0.1 (P=0.320) |
| (Becker 2008*) Physician education: Guideline (in 4 versions including patient leaflet), 3 seminars and academic detailing versus guideline dissemination | Quality of life at 12 months | ‐ | ‐ | 68.5 | 67.7 | 0.8 | 1% | ‐ | 0 (P=0.535) |
| (Becker 2008*) Physician education (as above) plus practice nurse training in motivational counselling versus guideline dissemination | Quality of life at 12 months | ‐ | ‐ | 70.4 | 67.7 | 2.7 | 4% | ‐ | 0.1 (P=0.036) |
| (Becker 2008*) Physician education: Guideline (in 4 versions including patient leaflet), 3 seminars and academic detailing vs physician education plus practice nurse training in motivational counselling | Functional capacity measured by Hannover Functional Ability Questionnaire at 6 months | ‐ | ‐ | 72.9 | 73.9 | ‐1 | ‐1% | ‐ | 0 (NR) |
| (Becker 2008*) Physician education: Guideline (in 4 versions including patient leaflet), 3 seminars and academic detailing vs physician education plus practice nurse training in motivational counselling | Days in pain at 6 months | ‐ | ‐ | 63.3 | 62.9 | ‐0.4 | ‐1% | ‐ | 0 (NR) |
| (Becker 2008*) Physician education: Guideline (in 4 versions including patient leaflet), 3 seminars and academic detailing vs physician education plus practice nurse training in motivational counselling | Overall activity at 6 months | ‐ | ‐ | 36.5 | 36.3 | 0.2 | 0% | ‐ | 0 (NR) |
| (Becker 2008*) Physician education: Guideline (in 4 versions including patient leaflet), 3 seminars and academic detailing vs Physician education plus practice nurse training in motivational counselling | Days of sick leave at 6 months | ‐ | ‐ | 13 | 13.1 | 0.1 | 0% | ‐ | 0 (NR) |
| (Becker 2008*) Physician education: Guideline (in 4 versions including patient leaflet), 3 seminars and academic detailing vs Physician education plus practice nurse training in motivational counselling | Quality of life at 6 months | ‐ | ‐ | 66.6 | 67.5 | ‐0.9 | ‐1% | ‐ | 0 (NR) |
| (Becker 2008*) Physician education: Guideline (in 4 versions including patient leaflet), 3 seminars and academic detailing vs Physician education plus practice nurse training in motivational counselling | Functional capacity measured by Hannover Functional Ability Questionnaire at 12 months | ‐ | ‐ | 73 | 74.6 | ‐1.7 | ‐2% | ‐ | ‐0.1 (NR) |
| (Becker 2008*) Physician education: Guideline (in 4 versions including patient leaflet), 3 seminars and academic detailing vs Physician education plus practice nurse training in motivational counselling | Days in pain at 12 months | ‐ | ‐ | 58.5 | 61.6 | 3.1 | 5% | ‐ | 0 (NR) |
| (Becker 2008*) Physician education: Guideline (in 4 versions including patient leaflet), 3 seminars and academic detailing vs Physician education plus practice nurse training in motivational counselling | Overall activity at 12 months | ‐ | ‐ | 46.4 | 45.4 | 1 | 2% | ‐ | 0 (NR) |
| (Becker 2008*) Physician education: Guideline (in 4 versions including patient leaflet), 3 seminars and academic detailing vs Physician education plus practice nurse training in motivational counselling | Days of sick leave at 12 months | ‐ | ‐ | 6.2 | 6.458 | 0.3 | 5% | ‐ | 0 (NR) |
| (Becker 2008*) Physician education: Guideline (in 4 versions including patient leaflet), 3 seminars and academic detailing vs Physician education plus practice nurse training in motivational counselling | Quality of life at 12 months | ‐ | ‐ | 68.5 | 70.4 | ‐1.9 | ‐3% | ‐ | ‐0.1 (NR) |
| (Eccles 2001)* Feedback on number of spinal radiographs 6 months before and 6 months after the intervention plus guideline dissemination versus guideline dissemination | Number of lumbar spine radiographs per 1000 patients | 7.24 (4.8) | 7.53 (4.1) | 5.97 (4.2) | 6.80 (4.3) | 0.83 | 12% | 8% | 0.2 (NR) |
| (Eccles 2001)* Reminder messages on radiograph reports plus guideline dissemination versus guideline dissemination | Number of lumbar spine radiographs per 1000 patients | 7.31 (5.2) | 7.53 (4.1) | 5.14 (3.7) | 6.80 (4.3) | 1.66 | 24% | 21% | 0.4 (P=0.05) |
| (Eccles 2001)* Feedback on number of spinal radiographs 6 months before and 6 months after the intervention plus guideline dissemination plus reminder messages on radiograph reports versus guideline dissemination | Number of lumbar spine radiographs per 1000 patients | 8.30 (5.1) | 7.53 (4.1) | 5.23 (3.7) | 6.80 (4.3) | 1.57 | 23% | 34% | 0.4 (NR) |
| (Eccles 2001)* Feedback on number of spinal radiographs 6 months before and 6 months after the intervention plus guideline dissemination versus reminder messages on radiograph reports plus guideline dissemination | Number of lumbar spine radiographs per 1000 patients | 7.24 (4.8) | 7.31 (5.2) | 5.97 (4.2) | 5.14 (3.7) | ‐0.83 | ‐16% | ‐18% | ‐0.2 (NR) |
| 1. Intervention 1 group pre‐intervention mean (standard deviation) 2. Intervention 2 group pre‐intervention mean (standard deviation) 3. Intervention 1 group post‐intervention mean (standard deviation) 4. Intervention 2 group postintervention mean (standard deviation) 5. Mean Difference (MD)=Difference between post‐intervention means. The direction of effect has been adjusted so that a positive result represents a beneficial intervention 1 outcome, according to Grimshaw 2004. 6. Relative percentage change post‐intervention = (Int1 post mean ‐ Int2 post mean)/Int2 post mean. The direction of effect has been adjusted so that a positive result represents a beneficial intervention 1 outcome, according to Grimshaw 2004. 7. Adjusted relative percentage change= (Int1 post mean‐Int2 post mean)‐(Int1 pre mean ‐ Int2 pre mean)/Int2 post mean. The direction of effect has been adjusted so that a positive result represents a beneficial intervention 1 outcome. 8. SMD=Standardised Mean Difference=(Int1 post mean‐Int2 post mean)/SD pooled. The direction of effect has been adjusted so that a positive result represents a beneficial intervention 1 outcome, according to Grimshaw 2004. 9. P value reported by study authors Int 1: intervention 1 group; Int 2: Intervention 2 group; NR: not reported; SD: standard deviation *The data reported above for Becker 2008 and Eccles 2001 was adjusted for clustering by the authors | |||||||||
| Study | Intervention | Outcome | Mean pre (SD) | Mean post (SD) | Mean post minus mean pre | Relative % change pre to post | SMD pre to post | Mean change in level (p value) | Mean change in slope (p value) |
| Educational material | Back x‐rays ordered | 1133 (50) | 1208.7 (111.5) | ‐75.7 | ‐6.7 | ‐1.51 | ‐121.5 (P = 0.167) | 6.8 (P = 0.776) |
| (Study) Intervention | Outcome | Int pre mean (SD)1 | C pre mean (SD)2 | Int post mean (SD)3 | C post mean (SD)4 | MD 5 | Relative % change 6 | Adjusted relative % change7 | SMD8 (P value)9 |
| GP training on relationships and communication, pain evaluation, prescription and negotiation of a patient contract delivered in a 4‐hour interactive session plus 8 reminders on recommendations | Pain relief (SPID) | ‐ | ‐ | 315.6 (289.5) | 264.7 (242.9) | 50.9 | 19% | 19% | 0.2 (P< 0.0001) |
| Intensity of pain in motion on VAS | 63.7 (13.8) | 62.8 (13.5) | ‐29 (23.1) | ‐24.8 (21.1) | 4.2 | 17% | ‐21% | 0.2 (P=0.01) | |
| Lequesne Index | 9.2 (2.9) | 9.8 (3.2) | ‐2.5 (2.5) | ‐2.0 (2.4) | 0.5 | 25% | 5% | 0.2 (P< 0.0001) | |
| WOMAC index pain | 9.3 (3.0) | 9.6 (2.8) | ‐2.9 (3.4) | ‐2.2 (2.9) | 0.7 | 32% | ‐18% | 0.2 (P< 0.0001) | |
| WOMAC index stiffness | 4.1 (1.4) | 4.0 (1.4) | ‐1.2 (1.6) | ‐0.8 (1.4) | 0.4 | 50% | ‐62% | 0.3 (P=0.0004) | |
| WOMAC index physical function | 31.2 (10.9) | 32.8 (9.5) | ‐8.7 (10.7) | ‐6.1 (8.8) | 2.6 | 43% | ‐16% | 0.3 (P< 0.0001) | |
| WOMAC index global score | 44.6 (14.4) | 46.4 (12.5) | ‐12.9 (14.8) | ‐9.2 (12.2) | 3.7 | 40% | ‐21% | 0.3 (P< 0.0001) | |
| Acetaminophen consumption | ‐ | ‐ | 3400 (800) | 2900 (900) | ‐500 | ‐17% | ‐17% | ‐0.6 (P< 0.0001) | |
| Intervention (aimed at GPs): 2 interactive 8‐hour meetings focusing on arthritis self management, guideline dissemination and patient information material versus control (usual care) | Quality of life (AIMS2‐SF scores) Lower body | 2.67 (1.88) | 2.65 (1.85) | 2.48 | 2.62 | ‐0.14 | ‐5% | ‐6% | ‐0.1 (P=0.349) |
| Quality of life (AIMS2‐SF scores) Upper body | 1.47 (2.25) | 1.33 (2.09) | 1.43 | 1.34 | 0.09 | 7% | ‐4% | 0.1 P=0.694) | |
| Quality of life (AIMS2‐SF scores) Symptom | 4.87 (2.13) | 4.81 (2.18) | 4.51 | 4.72 | ‐0.21 | ‐4% | ‐6% | ‐0.2 (P=0.119) | |
| Quality of life (AIMS2‐SF scores) Affect | 2.89 (1.35) | 2.88 (1.33) | 2.92 | 2.83 | 0.09 | 3% | 3% | 0.1 (P=0.610) | |
| Quality of life (AIMS2‐SF scores) Social | 4.52 (1.88) | 4.69 (1.80) | 4.43 | 4.62 | ‐0.19 | ‐4% | 0% | ‐0.3 P=0.776 | |
| GP contacts | 4.56 (6.13) | 4.82 (6.00) | 4.44 | 4.6 | 0.16 | 3% | ‐2% | 0.1 (P=0.339) | |
| Referrals to orthopaedics | 1.58 (3.43) | 1.76 (3.52) | 1.49 | 1.75 | 0.26 | 15% | 5% | 0.8 (P=0.153) | |
| Radiographs | 0.82 (3.12) | 0.79 (2.78) | 0.75 | 0.85 | 0.1 | 12% | 15% | 0.2 (P=0.05) | |
| Non‐medical practitioners | 0.11 (3.01) | 0.36 (3.28) | 0.09 | 0.32 | 0.23 | 72% | ‐6% | 0.6 (P=0.687) | |
| Physiotherapy | 4.70 (9.10) | 5.81 (11.10) | 4.63 | 5.77 | 1.14 | 20% | 1% | 2 (P=0.242) | |
| Acupuncture | 0.83 (3.45) | 0.97 (3.80) | 0.8 | 0.97 | 0.17 | 18% | 3% | 0.2 (P=0.821) | |
| Intervention (aimed at GPs) as above plus patient case management via telephone by practice nurses versus control (usual care) | Quality of life (AIMS2‐SF scores) Lower body | 3.01 (2.11) | 2.65 (1.85) | 2.61 | 2.62 | ‐0.01 | 0% | ‐14% | 0 (P=0.049) |
| Quality of life (AIMS2‐SF scores) Upper body | 1.68 (2.44) | 1.33 (2.09) | 1.62 | 1.34 | 0.28 | 21% | ‐5% | 0.2 (P=0.621) | |
| Quality of life (AIMS2‐SF scores) Symptom | 5.02 (2.29) | 4.81 (2.18) | 4.42 | 4.72 | ‐0.3 | ‐6% | ‐11% | ‐0.2 (P=0.048) | |
| Quality of life (AIMS2‐SF scores) Affect | 3.04 (1.39) | 2.88 (1.33) | 2.98 | 2.83 | 0.15 | 5% | 0% | 0.2 (P=0.691) | |
| Quality of life (AIMS2‐SF scores) Social | 4.79 (1.80) | 4.69 (1.80) | 4.736 | 4.62 | 0.116 | 3% | 0% | 0.1 (P< 0.001) | |
| GP contacts | 5.01 (5.78) | 4.82 (6.00) | 4.9 | 4.6 | ‐0.3 | ‐7% | ‐2% | ‐0.2 (P=0.823) | |
| Referrals to orthopaedics | 1.76 (3.52) | 1.76 (3.52) | 1.52 | 1.75 | 0.23 | 13% | 13% | 0.2 (P=0.044) | |
| Radiographs | 0.80 (3.01) | 0.79 (2.78) | 0.71 | 0.85 | 0.14 | 16% | 18% | 0.4 (P=0.031) | |
| Non‐medical practitioners | 0.50 (4.20) | 0.36 (3.28) | 0.47 | 0.32 | ‐0.15 | ‐47% | ‐3% | ‐0.4 (P=0.225) | |
| Physiotherapy | 5.22 (10.03) | 5.81 (11.10) | 5.08 | 5.77 | 0.69 | 12% | 2% | 1.3 (P=0.129) | |
| Acupuncture | 0.77 (3.99) | 0.97 (3.80) | 0.72 | 1.09 | 0.37 | 34% | 16% | 0.4 (P=0.769) | |
| (Stross 1985)** Intervention: Educationally‐influential physicians (EIs) led education of primary‐care physicians: self‐study programme including textbook, audiovisual materials and recent articles on osteoarthritis versus control (usual care) | Length of stay for OA patients | 8.8 | 8.4 | 8.4 | 8.6 | 0.2 | 2% | 7% | NR |
| Length of stay for total hip arthroplasty (THA) patients | 17.2 | 16.6 | 15.2 | 16.0 | 0.8 | 5% | 9% | NR | |
| 1. Intervention group pre‐intervention mean (standard deviation) 2. Control group pre‐intervention mean (standard deviation) 3. Intervention group post‐intervention mean (standard deviation) 4. Control group pos‐tintervention mean (standard deviation) 5. Mean Difference (MD)=Difference between post‐intervention means. The direction of effect has been adjusted so that a positive result represents a beneficial intervention outcome, according to Grimshaw 2004. 6. Relative percentage change post‐intervention = (Int post mean ‐ Control post mean)/Control post mean 7. Adjusted relative percentage change= (Int post mean‐Control post mean)‐(Int pre mean ‐ Control pre mean)/Control post mean. The direction of effect has been adjusted so that a positive result represents a beneficial intervention outcome. 8. SMD=Standardised Mean Difference=(Int post mean‐Control post mean)/SD pooled. The direction of effect has been adjusted so that a positive result represents a beneficial intervention outcome, according to Grimshaw 2004. 9. P value reported by study authors AIMS2‐SF: Arthritis Impact Measurement Scales Short Form * There are potential unit of analysis errors in the reported results as the study did not account for clustering and did not provide sufficient data to allow an approximate analysis according to chapter 16.3.4 of the Cochrane Handbook, Higgins 2011a. **The study did not report standard deviations and therefore we were unable to calculate the SMD. There are potential unit of analysis errors in the reported results as the study did not account for clustering and did not provide sufficient data to allow an approximate analysis according to chapter 16.3.4 of the Cochrane Handbook, Higgins 2011a. | |||||||||
| (Study) Intervention | Outcome | Int pre (%) 1 | C pre (%)2 | Int post (%)3 | C post (%)4 | ARD 5 | Risk difference 6 (P Value if reported by authors) | Relative % change post 7 | Risk ratio 8 |
| (Rahme 2005)* Intervention (aimed at GPs): 90‐minute workshop on management of osteoarthritis versus control group (usual care) | Number of adequate prescription, according to the guidelines | 51% (273/536) | 47% (675/1437) | 56% (251/450) | 49% (593/1209) | 3% | 7% | 14% | 1.1 |
| (Rahme 2005)* Intervention (aimed at GPs): decision tree on treatment choices for osteoarthritis patients versus control (usual care) | Number of adequate prescription, according to the guidelines | 51% (799/1569) | 47% (675/1437) | 54% (712/1317) | 49% (593/1209) | 1% | 5% | 10% | 1.1 |
| (Rahme 2005)* Intervention (aimed at GPs): 90‐minute workshop and decision tree as above versus control (usual care) | Number of adequate prescription, according to the guidelines | 58% (1022/1776) | 47% (675/1437) | 62% (1008/1634) | 49% (593/1209) | 2% | 13% | 26% | 1.3 |
| Intervention (aimed at GPs): 2 interactive 8‐hour meetings focusing on arthritis self management, guideline dissemination and patient information material versus control (usual care) | Paracetamol prescriptions | 8.9% (31/345) | 6.6% (22/332) | 16.4% | 5.3% | 8.7% | 11.1% (<0.001) | 209% | 3.1 |
| Opioids | 5.8% (20/345) | 6.9% (23/332) | 10.1% | 7.9% | 3.4% | 2.2% (NS) | 28% | 1.3 | |
| NSAID | 40% (138/345) | 41.9% (139/332) | 44.3% | 44.2% | 2.0% | 0.1% (NS) | 23% | 1.0 | |
| Homeopathics | 6.1% (21/345) | 8.1% (27/332) | 7.7% | 9.8% | ‐0.1% | ‐2.2% (NS) | ‐22% | 0.8 | |
| Intervention (aimed at GPs) as above plus patient case management via telephone by practice nurses versus control (usual care) | Paracetamol prescriptions | 7.3% (25/345) | 6.6% (22/332) | 14.1% | 5.3% | 8.2% | 8.8% (<0.01) | 166% | 2.7 |
| Opioids | 7.3% (25/345) | 6.9% (23/332) | 16.0% | 7.9% | 7.8% | 8.1% (< 0.01) | 102% | 2.0 | |
| NSAID | 43.3% (149/345) | 41.9% (139/332) | 49.7% | 44.2% | 4.3% | 5.6% (0.019) | 13% | 1.1 | |
| Homeopathics | 6.7% (23/345) | 8.1% (27/332) | 9.6% | 9.8% | 1.2% | ‐0.2% (NS) | ‐2% | 1.0 | |
| (Stross 1985)* Intervention: Educationally‐influential physicians (EIs) led education of primary‐care physicians: self‐study programme including textbook, audiovisual materials and recent articles on osteoarthritis versus control (usual care) | Management of OA patients with aspirin | 39% (9/23) | 50% (9/18) | 20% (6/30) | 28% (5/18) | 3% | ‐8% | ‐28% | 0.7 |
| Management of OA patients with NSAIDs | 83% (19/23) | 78% (14/18) | 87% (26/30) | 94% (17/18) | ‐13% | ‐8% | ‐8% | 0.9 | |
| Management of OA patients with systemic corticosteroids | 13% (3/23) | 17% (3/18) | 3% (1/30) | 22% (4/18) | 15% | 19% (< 0.05) | 85% | 0.2 | |
| Management of OA patients with intra‐articular corticosteroids | 17% (4/23) | 11% (2/18) | 40% (12/30) | 11% (2/18) | 23% | 29% (<0.05) | 260% | 3.6 | |
| Management of OA patients with physical therapy | 87% (20/23) | 83% (15/18) | 93% (28/30) | 83% (15/18) | 6% | 10% | 12% | 1.1 | |
| Referral of OA patients | 39% (9/23) | 39% (7/18) | 30% (9/30) | 33% (6/18) | ‐4% | 3% | 10% | 0.9 | |
| Pre‐op physical therapy of THA patients | 56% (10/18) | 46% (12/26) | 97% (35/36) | 40% (12/30) | 48% | 57% (< 0.05) | 143% | 2.4 | |
| Post‐op narcotics of THA patients | 72% (13/18) | 77% (20/26) | 89% (32/36) | 93% (28/30) | 0% | 4% | 5% | 1.0 | |
| Post‐op physical therapy of THA patients | 100% (18/18) | 100% (26/26) | 100% (36/36) | 100% (30/30) | 0% | 0% | 0% | 1.0 | |
| Post‐op complications of THA patients | 11% (2/18) | 15% (4/26) | 6% (2/36) | 13% (4/30) | 4% | 8% | 58% | 0.4 | |
| 1. Intervention group pre‐intervention proportion 2. Control group pre‐intervention proportion 3. Intervention group post‐intervention proportion 4. Control group post‐intervention proportion 5. ARD = [Int post (%) minus C post (%)] minus [Int pre (%) minus C pre (%)]. The direction of effect has been adjusted so that a positive result represents a beneficial intervention outcome, according to Grimshaw 2004. 6. Risk Difference (RD) is the absolute % change post‐intervention = Int post (%) minus C post (%). This is considered to be "small" if ≤ 5%, "modest" if > 5% and ≤10%,"moderate" if > 10% but ≤ 20%, and "large" if > 20%.The direction of effect has been adjusted so that a positive result represents a beneficial intervention outcome, according to Grimshaw 2004. 7. Relative % change post = absolute % change post divided by C post (%). The direction of effect has been adjusted so that a positive result represents a beneficial intervention outcome, according to Grimshaw 2004. 8. Risk ratio (RR) = Int post (%) divided by C post (%) C: control group; Int: intervention group; ARD: Adjusted risk difference; NS: not significant NSAID: non‐steroidal anti‐inflammatory drug, THA: total hip arthroplasty * There are unit of analysis errors in the reported results because the available data did not account for the effect of clustering. | |||||||||
| (Study) Intervention 1 versus intervention 2 | Outcome | Int 1 pre (%) 1 | Int 2 pre (%)2 | Int 1 post (%)3 | Int 2 post (%)4 | ARD 5 | Risk difference 6 (P value if reported by authors) | Relative % change post 7 | Risk ratio 8 |
| (Rahme 2005)* Intervention 1 (aimed at GPs): 90‐minute workshop on management of osteoarthritis versus Intervention 2 (aimed at GPs): decision tree on treatment choices for osteoarthritis patients | Number of adequate prescription, according to the guidelines | 51% (273/536) | 51% (799/1569) | 56% (251/450) | 54% (712/1317) | 1.7% | 1.7% | 3% | 1 |
| (Rahme 2005)* Intervention 1 (aimed at GPs): 90‐minute workshop on management of osteoarthritis versus Intervention 2 (aimed at GPs): 90‐minute workshop and decision tree | Number of adequate prescription, according to the guidelines | 51% (273/536) | 58% (1022/1776) | 56% (251/450) | 62% (1008/1634) | 0.7% | ‐5.9% | ‐10% | 0.9 |
| (Rahme 2005)* Intervention 1 (aimed at GPs):decision tree on treatment choices for osteoarthritis patients versus Intervention 2 (aimed at GPs): 90‐minute workshop and decision tree | Number of adequate prescription, according to the guidelines | 51% (799/1569) | 58% (1022/1776) | 54% (712/1317) | 62% (1008/1634) | ‐1% | ‐7.6% | ‐12% | 0.9 |
| Intervention (aimed at GPs): 2 interactive 8‐hour meetings focusing on arthritis self management, guideline dissemination and patient information material versus Intervention (aimed at GPs) as above plus patient case management via telephone by practice nurses | Paracetamol prescriptions | 8.9% (31/345) | 7.3% (25/345) | 16.4% | 14.1% | 0.5% | 2.3% | 16% | 1.2 |
| Opioids | 5.8% (20/345) | 7.3% (25/345) | 10.1% | 16.0% | ‐4.5% | ‐5.9% | ‐37% | 1.2 | |
| NSAID | 40% (138/345) | 43.3% (149/345) | 44.3% | 49.7% | ‐2.2% | ‐5.4% | ‐11% | 1.2 | |
| Homeopathics | 6.1% (21/345) | 6.7% (23/345) | 7.7% | 9.6% | ‐1.4% | ‐1.9% | ‐20% | 1.2 | |
| 1. Intervention 1 group pre‐intervention proportion 2. Intervention 2 group pre‐intervention proportion 3. Intervention 1 group post‐intervention proportion 4. Intervention 2 group post‐intervention proportion 5. ARD = [Int 1 post (%) minus Int 2 post (%)] minus [Int 1 pre (%) minus Int 2 pre (%)]. The direction of effect has been adjusted so that a positive result represents a beneficial intervention 1 outcome, according to Grimshaw 2004. 6. Risk Difference (RD) is the absolute % change post‐intervention = Int 1 post (%) minus Int 2 post (%). This is considered to be "small" if ≤ 5%, "modest" if > 5% and ≤10%,"moderate" if > 10% but ≤ 20%, and "large" if > 20%.The direction of effect has been adjusted so that a positive result represents a beneficial intervention 1 outcome. 7. Relative % change post = absolute % change post divided by Int 2 post (%). The direction of effect has been adjusted so that a positive result represents a beneficial intervention 1 outcome, according to Grimshaw 2004. 8. Risk ratio (RR) = Int 1 post (%) divided by Int 2 post (%) Int 1: intervention 1 group; Int 2: Intervention 2 group; ARD: adjusted risk difference; NS: not significant, NSAID: non‐steroidal anti‐inflammatory drug * There are unit of analysis errors in the reported results because the available data did not account for the effect of clustering. | |||||||||
| (Study) Intervention 1 versus Intervention 2 | Outcome | Int 1 pre mean (SD)1 | Int 2 pre mean (SD)2 | Int 1 post mean (SD)3 | Int 2 post mean (SD)4 | MD 5 | Relative % change 6 | Adjusted relative % change7 | SMD8 (P value)9 |
| Intervention (aimed at GPs): 2 interactive 8‐hour meetings focusing on arthritis self management, guideline dissemination and patient information material versus Intervention (aimed at GPs) as above plus patient case management via telephone by practice nurses | Quality of life (AIMS2‐SF scores) Lower body | 2.67 (1.88) | 3.01 (2.11) | 2.48 (1.1) | 2.61 (1.4) | ‐0.13 | ‐5% | 0% | ‐0.1 |
| Quality of life (AIMS2‐SF scores) Upper body | 1.47 (2.25) | 1.68 (2.44) | 1.43 (1.5) | 1.62 (1.3) | ‐0.19 | ‐12% | ‐6% | ‐0.1 | |
| Quality of life (AIMS2‐SF scores) Symptom | 4.87 (2.13) | 5.02 (2.29) | 4.51 (1.0) | 4.42 (1.8) | 0.09 | 2% | 12% | 0.1 | |
| Quality of life (AIMS2‐SF scores) Affect | 2.89 (1.35) | 3.04 (1.39) | 2.92 (0.8) | 2.98 (0.9) | ‐0.06 | ‐2% | ‐1% | ‐0.1 | |
| Quality of life (AIMS2‐SF scores) Social | 4.52 (1.88) | 4.79 (1.80) | 4.43 (0.6) | 4.736 (1.2) | ‐0.31 | ‐6% | ‐25% | ‐0.3 | |
| GP contacts | 4.56 (6.13) | 5.01 (5.78) | 4.44 (1.7) | 4.9 (1.6) | 0.46 | 9% | 37% | 0.3 | |
| Referrals to orthopaedics | 1.58 (3.43) | 1.76 (3.52) | 1.49 (0.4) | 1.52 (1.3) | 0.03 | 2% | ‐9% | 0.0 | |
| Radiographs | 0.82 (3.12) | 0.80 (3.01) | 0.75 (0.6) | 0.71 (0.4) | ‐0.04 | ‐6% | ‐1% | ‐0.1 | |
| Non‐medical practitioners | 0.11 (3.01) | 0.50 (4.20) | 0.09 (0.4) | 0.47 (0.4) | 0.38 | 81% | ‐45% | 0.9 | |
| Physiotherapy | 4.70 (9.10) | 5.22 (10.03) | 4.63 (0.6) | 5.08 (0.6) | 0.45 | 9% | 35% | 0.7 | |
| Acupuncture | 0.83 (3.45) | 0.77 (3.99) | 0.8 (1.3) | 0.72 (1.3) | ‐0.08 | ‐11% | 0% | ‐0.1 | |
| 1. Intervention 1 group pre‐intervention mean (standard deviation) 2. Intervention 2 group pre‐intervention mean (standard deviation) 3. Intervention 1 group post‐intervention mean (standard deviation) 4. Intervention 2 group postintervention mean (standard deviation) 5. Mean Difference (MD)=Difference between post‐intervention means. The direction of effect has been adjusted so that a positive result represents a beneficial intervention 1 outcome, according to Grimshaw 2004. 6. Relative percentage change post‐intervention = (Int1 post mean ‐ Int2 post mean)/Int2 post mean. The direction of effect has been adjusted so that a positive result represents a beneficial intervention 1 outcome, according to Grimshaw 2004. 7. Adjusted relative percentage change= (Int1 post mean‐Int2 post mean)‐(Int1 pre mean ‐ Int2 pre mean)/Int2 post mean. The direction of effect has been adjusted so that a positive result represents a beneficial intervention 1 outcome. 8. SMD=Standardised Mean Difference=(Int1 post mean‐Int2 post mean)/SD pooled. The direction of effect has been adjusted so that a positive result represents a beneficial intervention 1 outcome, according to Grimshaw 2004. 9. P value reported by study authors AIMS2‐SF: Arthritis Impact Measurement Scales Short Form * There are unit of analysis errors in the reported results because the available data did not account for the effect of clustering. | |||||||||
| (Study) Intervention | Outcome | Int pre mean (SD)1 | C pre mean (SD)2 | Int post mean (SD)3 | C post mean (SD)4 | MD 5 | Relative % change 6 | Adjusted relative % change7 | SMD8 (P value)9 |
| Intervention: 60‐minute lecture on shoulder disorders, handouts, training in injection techniques versus control group (usual care) | British Shoulder Disability Questionnaire (BSDQ) | 12.22 (4.21) | 13.11 (4.43) | 8.51 (0.60) | 9.46 (0.82) | 0.95 | 10% | 1% | 0.2 (P=0.36) |
| Short form 36 item (SF‐36) Health Survey ‐ physical component score | 37.78 (8.69) | 35.96 (8.93) | 40.55 (0.60) | 40.80 (0.90) | ‐0.25 | ‐1% | ‐5% | 0.0 (P=0.82) | |
| Short form 36 item (SF‐36) Health Survey ‐ mental component score | 45.42 (13.33) | 44.64 (13.09) | 46.81 (0.93) | 45.64 (1.28) | 1.17 | 3% | 1% | 0.1 (P=0.47) | |
| 1. Intervention group pre‐intervention mean (standard deviation) 2. Control group pre‐intervention mean (standard deviation) 3. Intervention group post‐intervention mean (standard deviation) 4. Control group pos‐tintervention mean (standard deviation) 5. Mean Difference (MD)=Difference between post‐intervention means. The direction of effect has been adjusted so that a positive result represents a beneficial intervention outcome, according to Grimshaw 2004. 6. Relative percentage change post‐intervention = (Int post mean ‐ Control post mean)/Control post mean 7. Adjusted relative percentage change= (Int post mean‐Control post mean)‐(Int pre mean ‐ Control pre mean)/Control post mean. The direction of effect has been adjusted so that a positive result represents a beneficial intervention outcome. 8. SMD=Standardised Mean Difference=(Int post mean‐Control post mean)/SD pooled. The direction of effect has been adjusted so that a positive result represents a beneficial intervention outcome, according to Grimshaw 2004. 9. P value reported by study authors | |||||||||
| (Study) Intervention 1 versus Intervention 2 | Outcome | Int 1 pre mean (SD)1 | Int 2 pre mean (SD)2 | Int 1 post mean (SD)3 | Int 2 post mean (SD)4 | MD 5 | Relative % change 6 | Adjusted relative % change7 | SMD8 (P value)9 |
| (Gormley 2003*) Shoulder injection training on mannequins versus shoulder injection training on mannequins and real patients | Shoulder injections performed by general practitioner | 3.5 | 3.4 | 4.5 | 7.8 | ‐3.3 | ‐42% | ‐44% | (P=0.02) |
| Referrals to shoulder injection clinics | 2.3 | 2.0 | 1.5 | 0.6 | ‐0.9 | ‐150% | ‐100% | (P=0.36) | |
| Referrals to physiotherapy | 5.9 | 5.6 | 4.7 | 3.2 | ‐1.5 | ‐47% | ‐38% | (P=0.20) | |
| 1. Intervention 1 group pre‐intervention mean (standard deviation) 2. Intervention 2 group pre‐intervention mean (standard deviation) 3. Intervention 1 group post‐intervention mean (standard deviation) 4. Intervention 2 group postintervention mean (standard deviation) 5. Mean Difference (MD)=Difference between post‐intervention means. The direction of effect has been adjusted so that a positive result represents a beneficial intervention 1 outcome, according to Grimshaw 2004. 6. Relative percentage change post‐intervention = (Int1 post mean ‐ Int2 post mean)/Int2 post mean. The direction of effect has been adjusted so that a positive result represents a beneficial intervention 1 outcome, according to Grimshaw 2004. 7. Adjusted relative percentage change= (Int1 post mean‐Int2 post mean)‐(Int1 pre mean ‐ Int2 pre mean)/Int2 post mean. The direction of effect has been adjusted so that a positive result represents a beneficial intervention 1 outcome. 8. SMD=Standardised Mean Difference=(Int1 post mean‐Int2 post mean)/SD pooled. The direction of effect has been adjusted so that a positive result represents a beneficial intervention 1 outcome, according to Grimshaw 2004. 9. P value reported by study authors * The study does not report SD and therefore we were not able to calculate the SMD | |||||||||
| (Study) Intervention | Outcome | Int pre mean (SD)1 | C pre mean (SD)2 | Int post mean (SD)3 | C post mean (SD)4 | MD 5 | Relative % change 6 | Adjusted relative % change7 | SMD8 (P value)9 |
| Training of general practitioners on the use of 2 validated assessment instruments for pain versus control group (usual care) | Pain relief a week after last consultation with general practitioner | 41.1 (4.6) | 50.7 (4.8) | ‐9.6 | ‐19% | ‐2 (P=0.0004) | |||
| Pain relief a week after last consultation with general practitioner not including patients on Level 3 analgesics | 40.8 (4.0) | 50.7 (4.2) | ‐9.9 | ‐20% | ‐2.4 (P=0.0001) | ||||
| Level 1 analgesic treatment (as defined by WHO classification system) | 34.7 (10.6) | 42.9 (18.4) | 29.6 (9.9) | 34.2 (12.4) | ‐4.6 | ‐13% | 11% | ‐0.3 (P=0.38) | |
| Level 2 analgesic treatment (as defined by WHO classification system) | 42.2 (5.9) | 44.1 (19.6) | 35.4 (6.3) | 47.7 (8.8) | ‐12.3 | ‐26% | ‐22% | ‐0.9 (P=0.003) | |
| Level 3 analgesic treatment (as defined by WHO classification system) | 7.5 (5.6) | 2.5 (2.1) | 7.2 (4.7) | 1.8 (2.5) | 5.4 | 300% | 22% | 1.2 (P=0.007) | |
| Co‐analgesics (antidepressants, anxiolytics, anti‐epileptics) | 46.0 (7.6) | 38.7 (7.5) | 38.4 (11.4) | 33.0 (15.1) | 5.4 | 16% | ‐6% | 0.7 (P=0.38) | |
| Other drugs (non‐psychotropic muscle relaxants) | 21.6 (7.1) | 27.3 (13.5) | 19.0 (5.3) | 22.9 (11.5) | ‐3.9 | ‐17% | 8% | ‐0.4 (P=0.34) | |
| Non‐medicinal treatment (physiotherapy, homeopathy, acupuncture, compression bandages, etc) | 44.3 (10.2) | 44.9 (11.1) | 33.8 (11.8) | 39.3 (12.5) | ‐5.5 | ‐14% | ‐12% | ‐0.5 (P=0.30) | |
| 1. Intervention group pre‐intervention mean (standard deviation) 2. Control group pre‐intervention mean (standard deviation) 3. Intervention group post‐intervention mean (standard deviation) 4. Control group pos‐tintervention mean (standard deviation) 5. Mean Difference (MD)=Difference between post‐intervention means. The direction of effect has been adjusted so that a positive result represents a beneficial intervention outcome, according to Grimshaw 2004. 6. Relative percentage change post‐intervention = (Int post mean ‐ Control post mean)/Control post mean 7. Adjusted relative percentage change= (Int post mean‐Control post mean)‐(Int pre mean ‐ Control pre mean)/Control post mean. The direction of effect has been adjusted so that a positive result represents a beneficial intervention outcome. 8. SMD=Standardised Mean Difference=(Int post mean‐Control post mean)/SD pooled. The direction of effect has been adjusted so that a positive result represents a beneficial intervention outcome, according to Grimshaw 2004. 9. P value reported by study authors | |||||||||
| (Study) Intervention 1 versus intervention 2 | Outcome | Int 1 pre (%) 1 | Int 2 pre (%)2 | Int 1 post (%)3 | Int 2 post (%)4 | ARD 5 | Risk difference 6 (P value if reported by authors) | Relative % change post 7 | Risk ratio 8 |
| (Robling 2002)* Guidelines and seminar versus guideline dissemination by post* | Concordant requests | ‐ | ‐ | 79% (23/29) | 79% (32/41) | ‐ | 0% | 0% | 1 |
| (Robling 2002)* Guidelines and feedback versus guideline dissemination by post* | Concordant requests | ‐ | ‐ | 67% (21/32) | 79% (32/41) | ‐ | ‐12.1% | ‐15% | 0.8 |
| (Robling 2002)* Guidelines, seminar and feedback versus guideline dissemination by post* | Concordant requests | ‐ | ‐ | 71% (27/37) | 79% (32/41) | ‐ | ‐7.6% | ‐10% | 0.9 |
| (Robling 2002)* Guidelines and seminar versus guidelines and feedback* | Concordant requests | ‐ | ‐ | 79% (23/29 | 67% (21/32) | ‐ | 12.1% | 18% | 1.2 |
| (Robling 2002)* Guidelines and seminar versus guidelines, seminar and feedback* | Concordant requests | ‐ | ‐ | 79% (23/29) | 71% (27/37) | ‐ | 7.6% | 11% | 1.1 |
| (Robling 2002)* Guidelines and feedback versus guidelines, seminar and feedback* | Concordant requests | ‐ | ‐ | 67% (21/32) | 71% (27/37) | ‐ | ‐4.5% | ‐6% | 0.9 |
| (Eccles 2001)** Feedback on number of knee radiographs 6 months before and 6 months after the intervention plus guideline dissemination versus guideline dissemination | Knee radiographs concordant with guidelines | ‐ | ‐ | 22% (52/240) | 25% (83/328) | ‐ | ‐3.6% | ‐14% | 0.9 |
| (Eccles 2001)** Reminder messages on radiograph reports plus guideline dissemination versus guideline dissemination | Knee radiographs concordant with guidelines | ‐ | ‐ | 31% (26/85) | 25% (83/328) | ‐ | 5.3% | 21% | 1.2 |
| (Eccles 2001)** Feedback on number of knee radiographs 6 months before and 6 months after the intervention plus guideline dissemination plus reminder messages on radiograph reports versus guideline dissemination | Knee radiographs concordant with guidelines | ‐ | ‐ | 28% (70/252) | 25% (83/328) | ‐ | 2.5% | 10% | 1.1 |
| (Eccles 2001)** Feedback on number of knee radiographs 6 months before and 6 months after the intervention plus guideline dissemination versus reminder messages on radiograph reports plus guideline dissemination | Knee radiographs concordant with guidelines | ‐ | ‐ | 22% (52/240) | 31% (26/85) | ‐ | ‐8.9% | ‐29% | 0.7 |
| 1. Intervention 1 group pre‐intervention proportion 2. Intervention 2 group pre‐intervention proportion 3. Intervention 1 group post‐intervention proportion 4. Intervention 2 group post‐intervention proportion 5. ARD = [Int 1 post (%) minus Int 2 post (%)] minus [Int 1 pre (%) minus Int 2 pre (%)]. The direction of effect has been adjusted so that a positive result represents a beneficial intervention 1 outcome, according to Grimshaw 2004. 6. Risk Difference (RD) is the absolute % change post‐intervention = Int 1 post (%) minus Int 2 post (%). This is considered to be "small" if ≤ 5%, "modest" if > 5% and ≤10%,"moderate" if > 10% but ≤ 20%, and "large" if > 20%.The direction of effect has been adjusted so that a positive result represents a beneficial intervention 1 outcome. 7. Relative % change post = absolute % change post divided by Int 2 post (%). The direction of effect has been adjusted so that a positive result represents a beneficial intervention 1 outcome, according to Grimshaw 2004. 8. Risk ratio (RR) = Int 1 post (%) divided by Int 2 post (%) Int 1: intervention 1 group; Int 2: Intervention 2 group; ARD: adjusted risk difference; NS: not significant *The results have been re‐calculated taking into account the reported Intercluster Correlation (ICC=0.0269) and average cluster size 12.5 according to chapter 16.3.4 of the Cochrane Handbook, Higgins 2011a. ** The data reported above for the study by Eccles 2001 does not account for clustering. We did not have access to sufficient information to adjust the data for clustering. | |||||||||
| (Study) Intervention 1 versus Intervention 2 | Outcome | Int 1 pre mean (SD)1 | Int 2 pre mean (SD)2 | Int 1 post mean (SD)3 | Int 2 post mean (SD)4 | MD 5 | Relative % change 6 | Adjusted relative % change7 | SMD8 (P value)9 |
| (Eccles 2001)* Feedback on number of knee radiographs 6 months before and 6 months after the intervention plus guideline dissemination versus guideline dissemination | Number of knee radiographs per 1000 patients | 7.03 (5.1) | 6.67 (3.9) | 6.32 (4.0) | 7.02 (3.6) | 0.7 | 10% | 15% | 0.2 (NR) |
| (Eccles 2001)* Reminder messages on radiograph reports plus guideline dissemination versus guideline dissemination | Number of knee radiographs per 1000 patients | 7.18 (5.0) | 6.67 (3.9) | 5.22 (3.6) | 7.02 (3.6) | 1.8 | 26% | 33% | 0.5 (P< 0.05) |
| (Eccles 2001)* Feedback on number of knee radiographs 6 months before and 6 months after the intervention plus guideline dissemination plus reminder messages on radiograph reports versus guideline dissemination | Number of knee radiographs per 1000 patients | 9.34 (6.1) | 6.67 (3.9) | 5.21 (3.7) | 7.02 (3.6) | 1.8 | 26% | 64% | 0.5 (NR) |
| (Eccles 2001)* Feedback on number of knee radiographs 6 months before and 6 months after the intervention plus guideline dissemination versus reminder messages on radiograph reports plus guideline dissemination | Number of knee radiographs per 1000 patients | 7.03 (5.1) | 7.18 (5.0) | 6.32 (4.0) | 5.22 (3.6) | ‐1.1 | ‐21% | ‐24% | ‐0.3 (NR) |
| 1. Intervention 1 group pre‐intervention mean (standard deviation) 2. Intervention 2 group pre‐intervention mean (standard deviation) 3. Intervention 1 group post‐intervention mean (standard deviation) 4. Intervention 2 group postintervention mean (standard deviation) 5. Mean Difference (MD)=Difference between post‐intervention means. The direction of effect has been adjusted so that a positive result represents a beneficial intervention 1 outcome, according to Grimshaw 2004. 6. Relative percentage change post‐intervention = (Int1 post mean ‐ Int2 post mean)/Int2 post mean. The direction of effect has been adjusted so that a positive result represents a beneficial intervention 1 outcome, according to Grimshaw 2004. 7. Adjusted relative percentage change= (Int1 post mean‐Int2 post mean)‐(Int1 pre mean ‐ Int2 pre mean)/Int2 post mean. The direction of effect has been adjusted so that a positive result represents a beneficial intervention 1 outcome. 8. SMD=Standardised Mean Difference=(Int1 post mean‐Int2 post mean)/SD pooled. The direction of effect has been adjusted so that a positive result represents a beneficial intervention 1 outcome, according to Grimshaw 2004. 9. P value reported by study authors *The above data reported above for Eccles 2001 was adjusted for clustering by the authors | |||||||||
| Table 23: Summary of median absolute effect sizes (risk difference) of dichotomous outcomes for interventions aiming to increase or decrease a clinical behaviour | ||||
| Study characteristic: behaviour targeted | Number of comparisons (n studies) | Median absolute effect size | Interquartile range | Range |
| Increase an existing clinical behaviour according to guidelines | 68 (14) | 5% | 0.6% to 12.6% | ‐7.8% to 57.2% |
| Decrease an existing clinical behaviour according to guidelines | 26 (7) | 1.1% | ‐1.1% to 3% | ‐12.6% to 30.1% |
| Table 24: Summary of median effect sizes (risk difference) of dichotomous outcomes for interventions aiming to increase or decrease a clinical behaviour (including only comparisons from Low Back Pain studies) | ||||
| Study characteristic: behaviour targeted | Number of comparisons (n studies) | Median absolute effect size | Interquartile range | Range |
| Increase an existing clinical behaviour according to guidelines | 18 (2) | 3.7% | ‐0.8% to 6.9% | ‐4.7% to 12.8% |
| Decrease an existing clinical behaviour according to guidelines | 23 (6) | 0.5% | ‐1.1% to 2.4% | ‐12.6% to 30.1% |
| Table 25: Summary of median effect sizes (risk difference) of dichotomous outcomes for interventions aiming to increase or decrease a clinical behaviour (including only comparisons from Osteoarthritis studies) | ||||
| Study characteristic: behaviour targeted | Number of comparisons (n studies) | Median absolute effect size | Interquartile range | Range |
| Increase an existing clinical behaviour according to guidelines | 18 (3) | 6.3% | ‐0.2% to 10% | ‐7.8% to 57.2% |
| Decrease an existing clinical behaviour according to guidelines | 3 (1) | 7.8% | 6.1% to 13.4% | 4.4% to 18.9% |
| Outcome or subgroup title | No. of studies | No. of participants | Statistical method | Effect size |
| 1 Bone Mineral Density Show forest plot | 3 | 3386 | Risk Ratio (M‐H, Fixed, 95% CI) | 4.44 [3.54, 5.55] |
| 2 Osteoporosis medication Show forest plot | 5 | 4223 | Risk Ratio (M‐H, Fixed, 95% CI) | 1.71 [1.50, 1.94] |
| Outcome or subgroup title | No. of studies | No. of participants | Statistical method | Effect size |
| 1 Bone mineral density Show forest plot | 2 | 3047 | Risk Ratio (M‐H, Fixed, 95% CI) | 4.75 [3.62, 6.24] |
| 2 Osteoporosis medication Show forest plot | 2 | 3047 | Risk Ratio (M‐H, Fixed, 95% CI) | 1.52 [1.26, 1.84] |
| Outcome or subgroup title | No. of studies | No. of participants | Statistical method | Effect size |
| 1 Bone mineral density Show forest plot | 2 | 2995 | Odds Ratio (M‐H, Fixed, 95% CI) | 0.93 [0.77, 1.12] |
| 2 Medication Show forest plot | 2 | 2995 | Risk Ratio (M‐H, Fixed, 95% CI) | 0.93 [0.79, 1.10] |