مداخلات حرفهای برای پزشکان عمومی به منظور مدیریت بالینی بیماریهای عضلانیاسکلتی
Appendices
Appendix 1. Search strategies
MEDLINE OVID
Search date: October 24, 2013
1 exp musculoskeletal diseases/ or rheumatology/ or exp orthopedics/ or orthopedic procedures/ (857643)
2 (musculoskeletal or arthriti$ or orthop?edic? or osteo$ or polymyalg$ or periarthrit$).ti. (249636)
3 (arthritis or back pain or chondrocalcinosis or dermatomyositis or dupuytren? contracture or fibromyal$ or Fibrositis or Fibrositides or gout or hyperostos$ or low$ back or lupus or osteitis or osteoarthrit$ or osteoarthrop$ or osteochondr$ or Osteonecros$ or osteoporos$ or periarthriti$ or polymyalgia? or raynaud disease? or rheumatism or rheumatic disease? or sciatica or scleroderma$ or Spondylarthrit$).ti,ab. (352214)
4 (((cartiledge or connective tissue? or joint? or ligament? or muscula$ or myofascial or neck or soft tissue? or spine or spinal) adj2 (damage? or disease? or disorder? or injury or injuries or pain? or strain?)) and (care or treatment)).ti. (2884)
5 ((caplan? or felty's or Sjogren's or still's or wissler's) adj (disease? or syndrome?)).ti,ab. (11736)
6 ((elbow or hand? or knee or knees or leg or muscle or muscular$ or orthop?edic? or shoulder? or wrist?) adj2 (care or treatment? or injury or injuries or pain? or strain?)).ti,ab. (38503)
7 (athletic? adj2 (strain? or injury or injuries)).ti. (451)
8 Dermatomyositis/ or Dupuytren's Contracture/ or Lupus Erythematosus, Cutaneous/ or Lupus Erythematosus, Systemic/ or exp back pain/ or neck pain/ or sciatica/ or exp Raynaud Disease/ or exp Scleroderma, Systemic/ or exp arm injuries/ or athletic injuries/ or exp back injuries/ or exp dislocations/ or exp fractures bone/ or fractures cartilage/ or exp hand injuries/ or exp hip injuries/ or exp leg injuries/ or multiple trauma/ or exp neck injuries/ or soft tissue injuries/ or exp spinal cord injuries/ or exp spinal injuries/ or exp "sprains and strains"/ or exp tendon injuries/ or exp musculoskeletal system/ (1447111)
9 or/1‐8 [MSK Rev] (2072899)
10 general practice/ or physicians, primary care/ [Terms added August 2012] (4535)
11 family practice/ or physicians, family/ or primary health care/ (122879)
12 ((family or general) adj2 (doctor? or medicine or medical practitioner? or medical practice? or practice? or practitioner? or physician$)).ti,ab. [Increased adj Aug 2012] (101849)
13 (primary adj2 (care or health care or healthcare or medical care or patient care)).ti,ab. (89077)
14 or/10‐13 [Primary Care Rev ML] (217520)
15 (randomized controlled trial or controlled clinical trial).pt. or randomized.ab. or placebo.ab. or clinical trials as topic.sh. or randomly.ab. or trial.ti. (930250)
16 exp animals/ not humans.sh. (4051829)
17 15 not 16 [Cochrane RCT Filter 6.4.d Sens/Precision Maximizing] (859939)
18 intervention?.ti. or (intervention? adj6 (clinician? or collaborat$ or community or complex or DESIGN$ or doctor? or educational or family doctor? or family physician? or family practitioner? or financial or GP or general practice? or hospital? or impact? or improv$ or individuali?e? or individuali?ing or interdisciplin$ or multicomponent or multi‐component or multidisciplin$ or multi‐disciplin$ or multifacet$ or multi‐facet$ or multimodal$ or multi‐modal$ or personali?e? or personali?ing or pharmacies or pharmacist? or pharmacy or physician? or practitioner? or prescrib$ or prescription? or primary care or professional$ or provider? or regulatory or regulatory or tailor$ or target$ or team$ or usual care)).ab. (165998)
19 (pre‐intervention? or preintervention? or "pre intervention?" or post‐intervention? or postintervention? or "post intervention?").ti,ab. [added 2.4] (10262)
20 (hospital$ or patient?).hw. and (study or studies or care or health$ or practitioner? or provider? or physician? or nurse? or nursing or doctor?).ti,hw. (720981)
21 demonstration project?.ti,ab. (1984)
22 (pre‐post or "pre test$" or pretest$ or posttest$ or "post test$" or (pre adj5 post)).ti,ab. (65680)
23 (pre‐workshop or post‐workshop or (before adj3 workshop) or (after adj3 workshop)).ti,ab. (610)
24 trial.ti. or ((study adj3 aim?) or "our study").ab. (632839)
25 (before adj10 (after or during)).ti,ab. (362830)
26 ("quasi‐experiment$" or quasiexperiment$ or "quasi random$" or quasirandom$ or "quasi control$" or quasicontrol$ or ((quasi$ or experimental) adj3 (method$ or study or trial or design$))).ti,ab,hw. [ML] (104437)
27 ("time series" adj2 interrupt$).ti,ab,hw. [ML] (1184)
28 (time points adj3 (over or multiple or three or four or five or six or seven or eight or nine or ten or eleven or twelve or month$ or hour? or day? or "more than")).ab. (9391)
29 pilot.ti. (39876)
30 Pilot projects/ [ML] (84019)
31 (clinical trial or controlled clinical trial or multicenter study).pt. [ML] (649874)
32 (multicentre or multicenter or multi‐centre or multi‐center).ti. (29829)
33 random$.ti,ab. or controlled.ti. (779263)
34 (control adj3 (area or cohort? or compare? or condition or design or group? or intervention? or participant? or study)).ab. not (controlled clinical trial or randomized controlled trial).pt. [ML] (412256)
35 "comment on".cm. or review.ti,pt. or randomized controlled trial.pt. [ML] (2959592)
36 review.ti. [EM] (255522)
37 (rat or rats or cow or cows or chicken? or horse or horses or mice or mouse or bovine or animal?).ti. (1368734)
38 exp animals/ not humans.sh. [ML] (4051829)
39 (animal$ not human$).sh,hw. [EM] (3956028)
40 *experimental design/ or *pilot study/ or quasi experimental study/ [EM] (24261)
41 ("quasi‐experiment$" or quasiexperiment$ or "quasi random$" or quasirandom$ or "quasi control$" or quasicontrol$ or ((quasi$ or experimental) adj3 (method$ or study or trial or design$))).ti,ab. [EM] (104437)
42 ("time series" adj2 interrupt$).ti,ab. [EM] (1184)
43 (or/18‐29,32‐34) or experimental design/ or between groups design/ or quantitative methods/ or quasi experimental methods/ [PsycInfo] (2839256)
44 exp animals/ or animal?.ti,id,hw. [PsycInfo] (17706941)
45 (or/18‐34) not (or/35,37‐38) [EPOC Methods Filter 2.4 Medline] (2151565)
46 (or/18‐25,28‐29,32‐33,40‐42) not (or/36,39) [EPOC Methods Filter 2.4 EMBASE] (2199704)
47 43 not (or/36‐37,44) [EPOC Methods Filter 2.4 PsycInfo] (339055)
48 9 and 14 [MSK & PC] (11460)
49 9 and 14 and 17 [MSK & PC & RCT FILTER] (1584)
50 (9 and 14 and 45) not 49 [MSK & PC & EPOC FILTER 2.4] (2810)
51 (201208$ or 201209$ or 201210$ or 201211$ or 201212$ or 2013$).ed,ep,yr. (1796601)
52 49 and 51 [rct] (167)
53 remove duplicates from 52 [RCT to export Oct 24‐2013] (129)
54 50 and 51 [EPOC] (292)
55 remove duplicates from 54 [EPOC to export Oct 2013]
EMBASE OVID
Embase Classic+Embase <1947 to 2013 October 23>
1 exp *musculoskeletal disease/ or rheumatology/ or *orthopedics/ or *orthopedic surgery/ (1190591)
2 (arthrit$ or back pain or fibromyalg$ or gout or low$ back or musculoskeletal or orthop?edic? or lupus or osteitis or osteoarthrit$ or osteoarthrop$ or osteochondr$ or Osteonecros$ or osteoporos$ or periarthriti$ or polymyalgia? or rheumatism or rheumatic disease? or sciatica or scleroderma$ or Spondylarthrit$).ti. (311875)
3 ((arthritis or back pain or chondrocalcinosis or dermatomyositis or dupuytren? contracture or fibromyal$ or Fibrositis or Fibrositides or gout or hyperostos$ or low$ back or lupus or osteitis or osteoarthrit$ or osteoarthrop$ or osteochondr$ or Osteonecros$ or osteoporos$ or periarthriti$ or polymyalgia? or raynaud disease? or rheumatism or rheumatic disease? or sciatica or scleroderma$ or Spondylarthrit$) adj3 (care or treatment?)).ab. (24640)
4 (((cartiledge or connective tissue? or joint? or ligament? or muscula$ or myofascial or neck or soft tissue? or spine or spinal) adj2 (damage? or disease? or disorder? or injury or injuries or pain? or strain?)) and (care or treatment)).ti. (3734)
5 ((caplan? or felty's or Sjogren's or still's or wissler's) adj (disease? or syndrome?)).ti,ab. (15557)
6 ((elbow or hand? or knee or knees or leg or muscle or muscular$ or orthop?edic? or shoulder? or sprain$ or wrist?) adj4 (care or treatment)).ti,ab. (32341)
7 (athletic? adj2 (strain? or injury or injuries)).ti. (491)
8 (bone adj2 (fracture? or fractured)).ti. (2759)
9 ((bone? or cartiledge or connective tissue? or joint? or ligament? or muscula$ or myofascial or neck or soft tissue? or spine or spinal) adj2 (damage? or disease? or disorder? or injury or injuries or pain? or strain?)).ti. (49287)
10 *dermatomyositis/ or *Dupuytren contracture/ or *skin lupus erythematosus/ or *systemic lupus erythematosus/ or exp *backache/ or exp *leg pain/ or exp *musculoskeletal pain/ or *neck pain/ or *ischialgia/ or *Raynaud phenomenon/ or *scleroderma/ or exp *ARM INJURY/ or exp *TENDON INJURY/ or exp *SOFT TISSUE INJURY/ or exp *NECK INJURY/ or exp *HAND INJURY/ or exp *LEG INJURY/ or exp *SPINE INJURY/ or exp *SPINAL CORD INJURY/ or exp *HIP INJURY/ or *sport injury/ or *dislocation/ or exp *fracture/ or exp *sprain/ or muscle strain/ or exp *tendon injury/ (367353)
11 or/1‐10 [MSK conditions] (1404842)
12 *general practitioner/ (15844)
13 *general practice/ (39859)
14 exp *primary health care/ (40728)
15 ((family or general) adj2 (doctor? or medical practitioner? or medical practice? or practice? or practitioner? or physician$)).ti,ab. (117580)
16 (primary adj2 (care or health care or healthcare or medical care or patient care)).ti,ab. (104088)
17 or/12‐16 [Primary care] (231098)
18 controlled clinical trial/ or controlled study/ or randomized controlled trial/ [EM] (4244044)
19 (book or conference paper or editorial or letter or review).pt. not randomized controlled trial/ [Per BMJ Clinical Evidence filter] (4034696)
20 (random sampl$ or random digit$ or random effect$ or random survey or random regression).ti,ab. not randomized controlled trial/ [Per BMJ Clinical Evidence filter] (54247)
21 (animal$ not human$).sh,hw. (3913735)
22 18 not (or/19‐21) [Trial filter per BMJ CLinical Evidence] (2801374)
23 intervention?.ti. or (intervention? adj6 (clinician? or collaborat$ or community or complex or DESIGN$ or doctor? or educational or family doctor? or family physician? or family practitioner? or financial or GP or general practice? or hospital? or impact? or improv$ or individuali?e? or individuali?ing or interdisciplin$ or multicomponent or multi‐component or multidisciplin$ or multi‐disciplin$ or multifacet$ or multi‐facet$ or multimodal$ or multi‐modal$ or personali?e? or personali?ing or pharmacies or pharmacist? or pharmacy or physician? or practitioner? or prescrib$ or prescription? or primary care or professional$ or provider? or regulatory or regulatory or tailor$ or target$ or team$ or usual care)).ab. (201463)
24 (pre‐intervention? or preintervention? or "pre intervention?" or post‐intervention? or postintervention? or "post intervention?").ti,ab. [added 2.4] (12626)
25 (hospital$ or patient?).hw. and (study or studies or care or health$ or practitioner? or provider? or physician? or nurse? or nursing or doctor?).ti,hw. (1623934)
26 demonstration project?.ti,ab. (2357)
27 (pre‐post or "pre test$" or pretest$ or posttest$ or "post test$" or (pre adj5 post)).ti,ab. (93420)
28 (pre‐workshop or post‐workshop or (before adj3 workshop) or (after adj3 workshop)).ti,ab. (809)
29 trial.ti. or ((study adj3 aim?) or "our study").ab. (838686)
30 (before adj10 (after or during)).ti,ab. (474031)
31 deleted line; no impact on strategy
32 deleted line; no impact on strategy
33 (time points adj3 (over or multiple or three or four or five or six or seven or eight or nine or ten or eleven or twelve or month$ or hour? or day? or "more than")).ab. (11728)
34 pilot.ti. (49794)
35 deleted line; no impact on strategy
36 deleted line; no impact on strategy
37 (multicentre or multicenter or multi‐centre or multi‐center).ti. (39211)
38 random$.ti,ab. or controlled.ti. (932656)
39 (control adj3 (area or cohort? or compare? or condition or design or group? or intervention? or participant? or study)).ab. not (controlled clinical trial or randomized controlled trial).pt. [ML] (615626)
40 deleted line; no impact on strategy
41 review.ti. [EM] (312835)
42 (rat or rats or cow or cows or chicken? or horse or horses or mice or mouse or bovine or animal?).ti. (1654258)
43deleted line; no impact on strategy
44 (animal$ not human$).sh,hw. [EM] (3913735)
45 *experimental design/ or *pilot study/ or quasi experimental study/ [EM] (6990)
46 ("quasi‐experiment$" or quasiexperiment$ or "quasi random$" or quasirandom$ or "quasi control$" or quasicontrol$ or ((quasi$ or experimental) adj3 (method$ or study or trial or design$))).ti,ab. [EM] (128680)
47 ("time series" adj2 interrupt$).ti,ab. [EM] (1124)
48‐50 deleted lines; no impact on strategy
51 (or/23‐30,33‐34,37‐38,45‐47) not (or/41,44) [EPOC Methods Filter 2.4 EMBASE] (3323291)
52 48 not (or/41‐42,49) [EPOC Methods Filter 2.4 PsycInfo] (715574)
53 11 and 17 [MSK & Primary Care] (10572)
54 11 and 17 and 22 [MSK & PC & RCT] (2143)
55 (11 and 17 and 51) not 54 [MSK & PC & EPOC Filter] (3595)
Cochrane Library via OVID EBM Collection
Search date: October 2013
EBM Reviews ‐ Cochrane Database of Systematic Reviews <2005 to September 2013>, EBM Reviews ‐ ACP Journal Club <1991 to October 2013>, EBM Reviews ‐ Database of Abstracts of Reviews of Effects <3rd Quarter 2013>, EBM Reviews ‐ Cochrane Central Register of Controlled Trials <September 2013>, EBM Reviews ‐ Cochrane Methodology Register <3rd Quarter 2012>, EBM Reviews ‐ Health Technology Assessment <3rd Quarter 2013>, EBM Reviews ‐ NHS Economic Evaluation Database <3rd Quarter 2013>
1 exp musculoskeletal diseases/ or rheumatology/ or exp orthopedics/ or orthopedic procedures/ (20864)
2 (musculoskeletal or arthrit$ or orthop?edic? or osteo$ or polymyalg$ or periarthrit$).ti. (13266)
3 (arthritis or back pain or chondrocalcinosis or dermatomyositis or dupuytren? contracture or fibromyal$ or Fibrositis or Fibrositides or gout or hyperostos$ or low$ back or lupus or osteitis or osteoarthrit$ or osteoarthrop$ or osteochondr$ or Osteonecros$ or osteoporos$ or periarthriti$ or polymyalgia? or raynaud disease? or rheumatism or rheumatic disease? or sciatica or scleroderma$ or Spondylarthrit$).ti,ab. (19487)
4 (((cartiledge or connective tissue? or joint? or ligament? or muscula$ or myofascial or neck or soft tissue? or spine or spinal) adj2 (damage? or disease? or disorder? or injury or injuries or pain? or strain?)) and (care or treatment)).ti. (472)
5 ((caplan? or felty's or Sjogren's or still's or wissler's) adj (disease? or syndrome?)).ti,ab. (247)
6 ((elbow or hand? or knee or knees or leg or muscle or muscular$ or orthop?edic? or shoulder? or wrist?) adj2 (care or treatment? or injury or injuries or pain? or strain?)).ti,ab. (5343)
7 (athletic? adj2 (strain? or injury or injuries)).ti. (14)
8 Dermatomyositis/ or Dupuytren's Contracture/ or Lupus Erythematosus, Cutaneous/ or Lupus Erythematosus, Systemic/ or exp back pain/ or neck pain/ or sciatica/ or exp Raynaud Disease/ or exp Scleroderma, Systemic/ or exp arm injuries/ or athletic injuries/ or exp back injuries/ or exp dislocations/ or exp fractures bone/ or fractures cartilage/ or exp hand injuries/ or exp hip injuries/ or exp leg injuries/ or multiple trauma/ or exp neck injuries/ or soft tissue injuries/ or exp spinal cord injuries/ or exp spinal injuries/ or exp "sprains and strains"/ or exp tendon injuries/ or exp musculoskeletal system/ (28264)
9 or/1‐8 [MSK Rev] (53389
10 general practice/ or physicians, primary care/ [Terms added August 2012] (145)
11 family practice/ or physicians, family/ or primary health care/ (4521)
12 ((family or general) adj2 (doctor? or medicine or medical practitioner? or medical practice? or practice? or practitioner? or physician$)).ti,ab. [Increased adj Aug 2012] (6968)
13 (primary adj2 (care or health care or healthcare or medical care or patient care)).ti,ab. (7493)
14 or/10‐13 [Primary Care Rev ML] (13418)
15 9 and 14 (1090)
16 limit 15 to yr="2012 ‐ 2014" [Limit not valid in DARE; records were retained] (68)
17 from 16 keep 1‐3 [CDSR] (3)
18 from 16 keep 4‐7 [ACP] (4)
19 from 16 keep 8‐9 [DARE] (2)
20 from 16 keep 10‐53 [Central] (44)
21 from 16 keep 45‐53 [HTA] (9)
22 from 16 keep 63‐68 [EED] (6)
Cochrane Library, Issue 2, 2010 [Wiley]
Search Date: 2010‐08‐23 15:34:51.33
#1MeSH descriptor Musculoskeletal Diseases explode all trees
#2MeSH descriptor Rheumatology, this term only
#3MeSH descriptor Orthopedics explode all trees
#4MeSH descriptor Orthopedic Procedures, this term only
#5(musculoskeletal or arthritis or osteoarthritis):ab
#6(arthrit*):ti
#7((bone near/2 fracture*) or (bone near/2 fractured)):ti
#8(Chondrocalcinosis or dermatomyositis or dupuytren* contracture or fibromyalgia* or Fibrositis or Fibrositides or gout or hyperostos* or lupus or Musculoskeletal or orthopedic* or orthopaedic* or osteitis or osteoarthrit* or osteoarthrop* or osteochondr* or Osteonecros* or osteoporos* or periarthriti* or polymyalgia* or raynaud disease* or rheumati* or sciatica or scleroderma* or Spondylarthrit* or sprain*):ti
#9((caplan* or felty's or Sjogren's or still's or wissler's) near/ disease*):ti
#10((caplan* or felty's or Sjogren's or still's or wissler's) near/ syndrome*):ti
#11((bone* or cartiledge or connective tissue* or joint* or ligament* or muscula* or myofascial or neck or soft tissue* or spine or spinal) near/2 strain*):ti
#12((bone* or cartiledge or connective tissue* or joint* or ligament* or muscula* or myofascial or neck or soft tissue* or spine or spinal) near/2 damage*):ti
#13((bone* or cartiledge or connective tissue* or joint* or ligament* or muscula* or myofascial or neck or soft tissue* or spine or spinal) near/2 disease*):ti
#14((bone* or cartiledge or connective tissue* or joint* or ligament* or muscula* or myofascial or neck or soft tissue* or spine or spinal) near/2 disorder*):ti
#15((bone* or cartiledge or connective tissue* or joint* or ligament* or muscula* or myofascial or neck or soft tissue* or spine or spinal) near/2 injury):ti
#16((bone* or cartiledge or connective tissue* or joint* or ligament* or muscula* or myofascial or neck or soft tissue* or spine or spinal) near/2 pain*):ti
#17((bone* or cartiledge or connective tissue* or joint* or ligament* or muscula* or myofascial or neck or soft tissue* or spine or spinal) near/2 injuries):ti
#18((elbow) near/2 (injury or injuries or pain* or strain*)):ti
#19((shoulder) near/2 (injury or injuries or pain* or strain*)):ti
#20((hand*) near/2 (injury or injuries or pain* or strain*)):ti
#21(knee near/2 (injury or injuries or pain* or strain*)):ti
#22(athletic* near/2 (strain* or injury or injuries)):ti
#23MeSH descriptor Dermatomyositis, this term only
#24MeSH descriptor Dupuytren Contracture, this term only
#25MeSH descriptor Lupus Erythematosus, Cutaneous, this term only
#26MeSH descriptor Lupus Erythematosus, Systemic explode all trees
#27MeSH descriptor Back Pain explode all trees
#28MeSH descriptor Sciatica, this term only
#29MeSH descriptor Raynaud Disease, this term only
#30MeSH descriptor Scleroderma, Systemic explode all trees
#31MeSH descriptor Arm Injuries explode all trees
#32MeSH descriptor Neck Pain explode all trees
#33MeSH descriptor Athletic Injuries, this term only
#34MeSH descriptor Back Injuries explode all trees
#35MeSH descriptor Dislocations explode all trees
#36MeSH descriptor Fractures, Bone explode all trees
#37MeSH descriptor Fractures, Cartilage, this term only
#38MeSH descriptor Hand Injuries explode all trees
#39MeSH descriptor Hip Injuries explode all trees
#40MeSH descriptor Leg Injuries explode all trees
#41MeSH descriptor Multiple Trauma, this term only
#42MeSH descriptor Neck Injuries explode all trees
#43MeSH descriptor Soft Tissue Injuries, this term only
#44MeSH descriptor Spinal Cord Injuries explode all trees
#45MeSH descriptor Sprains and Strains explode all trees
#46MeSH descriptor Tendon Injuries explode all trees
#47MeSH descriptor Musculoskeletal System explode all trees
#48(#1 OR #2 OR #3 OR #4 OR #5 OR #6 OR #7 OR #8 OR #9 OR #10 OR #11 OR #12 OR #13 OR #14 OR #15 OR #16 OR #17 OR #18 OR #19 OR #20 OR #21 OR #22 OR #23 OR #24 OR #25 OR #26 OR #27 OR #28 OR #29 OR #30 OR #31 OR #32 OR #33 OR #34 OR #35 OR #36 OR #37 OR #38 OR #39 OR #40 OR #41 OR #42 OR #43 OR #44 OR #45 OR #46 OR #47)
#49MeSH descriptor Family Practice, this term only
#50MeSH descriptor Physicians, Family, this term only
#51MeSH descriptor Primary Health Care, this term only
#52(general near/ (doctor* or medicine or medical practitioner* or medical practice* or practice* or practitioner* or physician*)):ti,ab
#53(family near/ (doctor* or medicine or medical practitioner* or medical practice* or practice* or practitioner* or physician*)):ti,ab
#54(primary near/2 (care or health care or healthcare or medical care or patient care)):ti,ab
#55(#49 OR #50 OR #51 OR #52 OR #53 OR #54)
#56intervention*:ti
#57(intervention* near/6 (clinician* or collaborat* or community or complex or doctor* or educational or family doctor* or family physician* or family practitioner* or financial or GP or general practice* or hospital* or impact* or improv* or individuali*e* or individuali*ing or interdisciplin* or multicomponent or multi‐component or
multidisciplin* or multi‐disciplin* or multifacet* or multi‐facet* or multimodal* or multi‐modal* or personali*e* or personali*ing or pharmacies or pharmacist* or pharmacy or
physician* or practitioner* or prescrib* or prescription* or primary care or professional* or provider* or regulatory or regulatory or tailor* or target* or team* or usual care)):ab
#58((evidence near/4 intervention) or (evidence‐based near/4 intervention) or (evidence‐driven)):ti,ab
#59"practice‐based":ti,ab
#60(improv* near/3 (decision* or implement* or health care or healthcare or initiative* or management or multifacet* or multi‐facet* or multi‐component or practi*e* or practitioner* or prescrib* or prescription* or professional* or program* or programme* or provider*)):ti
#61(improv* near/2 (patient‐care or family practice or ((family or general) near/2 (practi*e or practitioner* or doctor*)) or primary care)):ab
#62recommended practice*:ti,ab
#63((information or evidence) near/2 uptake):ti,ab
#64(knowledge near/2 (application or broke* or creation or diffus* or disseminat* or exchang* or implement* or management or mobili* or translat* or transfer* or uptake or utili*)):ti,ab
#65(evidence* near/2 (exchang* or translat* or transfer*)):ti,ab
#66(KT near/2 (application or broke* or diffus* or disseminat* or decision* or exchang* or implement* or intervent* or mobili* or plan* or policy or policies or strateg* or translat* or transfer* or uptake or utili*)):ti,ab
#67((computer‐tailored or individuali*ing or individuali*ed or personali*e* or personali*ing or tailor*) near/2 (feedback or intervention* or information or plan*)):ti,ab
#68((conventional or evidence‐based or pattern or regular or routine or standard or traditional or usual) near/2 (care or healthcare or patient care or practice)):ti,ab #69(collaborative* or interdisciplin* or inter‐disciplin* or multidisciplin* or multi‐ disciplin* or team* or team‐based or skill‐ mix):ti
#70(skill* near/2 (mix or mixes)):ti,ab
#71((collaborative) near/2 (care or patient care or healthcare)):ab
#72((multidisciplinary) near/2 (care or patient care or healthcare)):ab
#73((interdisciplinary) near/2 (care or patient care or healthcare)):ab
#74(doctor‐driven or doctor‐led or GP‐LED or nurse‐led or nurse‐driven or pharmacist‐led or pharmacist‐driven or physician‐led or physician‐ driven):ti,ab
#75physician directed:ti,ab
#76(leaflet* or pamphlet* or "written information"):ti
#77((leaflet*) near/5 (intervention* or care or healthcare or physician* or practitioner* or provider*)):ab
#78((pamphlet*) near/5 (intervention* or care or healthcare or physician* or practitioner* or provider*)):ab
#79(("written information") near/5 (intervention* or care or healthcare or physician* or practitioner* or provider*)):ab
#80((academic detailing or e‐detailing) or (opinion* near/2 leader*)):ti,ab
#81("audit and feedback"):ti,ab
#82((physician* or doctor* or practitioner* or nurse* or provider*) near/ feedback):ti,ab
#83(clinician* near/2 (prompt or prompts or prompting)):ti,ab or (physician* near/2 (prompt or prompts or prompting)):ti,ab or (remind* near/2 (prompt or prompts or prompting)):ti,ab
#84(reminder* near/2 (clinician* or physician* or practitioner* or nurse* or doctor* or provider*)):ti,ab
#85MeSH descriptor Reminder Systems, this term only
#86((doctor* or nurse* or pharmacist* or physician* or practitioner*) near/2 behavio*r*):ti,ab
#87(nurse* near/4 substitut*):ti,ab
#88(practice pattern*):ti,ab or ((change* or changing) near/2 practice):ti,ab
#89MeSH descriptor Physician's Practice Patterns, this term only
#90(nurse‐practitioner* or physician* assistant*):ti
#91((doctor* or pharmacist* or physician*) near/2 role*):ab
#92MeSH descriptor Referral and Consultation, this term only
#93(Referral* and (primary care or specialist* or general practitioner* or change* or changing or improv* or impact or effect* or reduce* or reducing or increase* or increasing or optimi* or optimal or quality or healthcare or patient care or intensive care or emergency or chronic or management or administration)):ti,ab
#94(Referral* and (primary care or specialist* or general practitioner* or optimi*e* or optimal)):ti or (Referral* near/3 (primary care or specialist* or general practitioner* or optimi*e* or optimal)):ab
#95((nurse* or physician* or pharmacist* or provider*) near/2 initiative*):ti,ab
#96(virtual reality or VR Training or VR simulat* or (simulat* near/2 skill*)):ti,ab
#97(blog* or wiki* or PDA or "palm pilot* " or blackberr* or Twitter or tweet or tweeting or facebook or social networking or social marketing or youtube):ti,ab or blogging or (health 20 or healthcare 20 or health care 20 or web 20):ti,ab
#98(guideline adherence or (guideline* near/3 (adherence or compliance or concordance or implement* or UPTAKE))):ti,ab
#99((individuali* near/2 (care or healthcare or medical care)) or (integrated near/2 (care or healthcare or medical care)) or (patient‐centred or patient‐centered or patient‐control*)):ti,ab
#100quality improvement:ti,ab
#101(Patient satisfaction or algorithm*):ti,ab
#102MeSH descriptor Education, Pharmacy, Continuing, this term only
#103MeSH descriptor Education, Medical, Continuing, this term only
#104MeSH descriptor Education, Nursing, Continuing, this term only
#105MeSH descriptor Education, Professional, this term only
#106(continuing near/2 education near/3 (physician* or nurse* or nursing or practitioner* or doctor* or family physician* or general practitioner* or family doctor* or primary care or primary healthcare)):ab
#107(continuing near/3 education):ti
#108((continuing or "on the job" or "off the job" or postgrad* or post‐grad* or resident* or intern* or internship* or workplace) near/2 training):ti,ab
#109(((continuing or "on the job" or "off the job" or postgrad* or post‐grad* or resident* or intern* or internship* or workplace) near/2 education*) or (skill* near/ (education or training))):ti,ab
#110(#56 OR #57 OR #58 OR #59 OR #60 OR #61 OR #62 OR #63 OR #64 OR #65 OR #66 OR #67 OR #68 OR #69 OR #70 OR #71 OR #72 OR #73 OR #74 OR #75 OR #76 OR #77 OR #78 OR #79 OR #80 OR #81 OR #82 OR #83 OR #84 OR #85 OR #86 OR #87 OR #88 OR #89 OR #90 OR #91 OR #92 OR #93 OR #94 OR #95 OR #96 OR #97 OR #98 OR #99 OR #100 OR #101 OR #102 OR #103 OR #104 OR #105 OR #106 OR #107 OR #108 OR #109)
#111(#48 AND #55)
#112(#48 AND #55 AND #110)
#113(#111 OR #112)
CINAHL, EbscoHost 1980‐
Search dates: August 24, 2010 AND november 20, 2013
| Date: 20100101‐20131231 NOVEMBER 20, 2013 | 288 | |
| S52 | S51 or S50 [All Results] AUGUST 24, 2010 | 608 |
| S51 | S49 and S46 (Results with EPOC 1.7 Filter) | 485 |
|
|
|
|
| S50 | S49 and S45 (Results with RCT filter) | 302 |
| S49 | S47 and S48 and S17 (S17= primary Care terms) | 1681 |
| S48 | S18 or S19 or S20 or S21 or S22 or S23 (Education/Collaboration Intervention terms) | 76261 |
| S47 | S1 or S2 or S3 or S4 or S5 or S6 or S7 or S8 or S9 or S10 or S11 or S12 or S13 or S14 or S15 or S16 (MSK terms) | 404871 |
| S46 | S24 or S25 or S26 or S27 or S28 or S29 or S30 or S31 or S32 or S34 or S35 or S36 or S37 or S38 (EPOC Filter 1.7) | 187032 |
| S45 | S39 or S40 or S41 or S42 or S43 or S44 (RCT filter) | 126098 |
| S44 | TI ( “control* N1 clinical” or “control* N1 group*” or “control* N1 trial*” or “control* N1 study” or “control* N1 studies” or “control* N1 design*” or “control* N1 method*” ) or AB ( “control* N1 clinical” or “control* N1 group*” or “control* N1 trial*” or “control* N1 study” or “control* N1 studies” or “control* N1 design*” or “control* N1 method*” ) | 57555 |
| S43 | TI controlled or AB controlled | 44233 |
| S42 | TI random* or AB random* | 77414 |
| S41 | TI ( “clinical study” or “clinical studies” ) or AB ( “clinical study” or “clinical studies” ) | 11229 |
| S40 | (MM "Clinical Trials+") | 6045 |
| S39 | TI ( (multicent* n2 design*) or (multicent* n2 study) or (multicent* n2 studies) or (multicent* n2 trial*) ) or AB ( (multicent* n2 design*) or (multicent* n2 study) or (multicent* n2 studies) or (multicent* n2 trial*) ) | 5282 |
| S38 | TI pilot | 7878 |
| S37 | (MH "Pilot Studies") | 20827 |
| S36 | AB "before‐and‐after" | 12207 |
| S35 | AB time series | 1089 |
| S34 | TI time series | 141 |
| S33 | AB ( before* n7 during or before n3 after ) or AU ( before* n7 during or before n3 after ) | 19048 |
| S32 | TI ( (time point*) or (period* n4 interrupted) or (period* n4 multiple) or (period* n4 time) or (period* n4 various) or (period* n4 varying) or (period* n4 week*) or (period* n4 month*) or (period* n4 year*) ) or AB ( (time point*) or (period* n4 interrupted) or (period* n4 multiple) or (period* n4 time) or (period* n4 various) or (period* n4 varying) or (period* n4 week*) or (period* n4 month*) or (period* n4 year*) ) | 34841 |
| S31 | TI ( ( quasi‐experiment* or quasiexperiment* or quasi‐random* or quasirandom* or quasi control* or quasicontrol* or “quasi* W3 method*” or “quasi* W3 study” or “quasi* W3 studies” or “quasi* W3 trial” or “quasi* W3 design*” or “experimental W3 method*” or “experimental W3 study” or “experimental W3 studies” or “experimental W3 trial” or “experimental W3 design*” ) ) or AB ( ( quasi‐experiment* or quasiexperiment* or quasi‐random* or quasirandom* or quasi control* or quasicontrol* or “quasi* W3 method*” or “quasi* W3 study” or “quasi* W3 studies” or “quasi* W3 trial” or “quasi* W3 design*” or “experimental W3 method*” or “experimental W3 study” or “experimental W3 studies” or “experimental W3 trial” or “experimental W3 design*” ) ) | 8591 |
| S30 | TI pre w7 post or AB pre w7 post | 6142 |
| S29 | MH "Multiple Time Series" or MH "Time Series" | 922 |
| S28 | TI ( (comparative N2 study) or (comparative N2 studies) or “evaluation study” or "evaluation studies" ) or AB ( (comparative N2 study) or (comparative N2 studies) or “evaluation study” or "evaluation studies" ) | 5677 |
| S27 | MH Experimental Studies or Community Trials or Community Trials or Pretest‐Posttest Design + or Quasi‐Experimental Studies + Pilot Studies or Policy Studies + Multicenter Studies | 24708 |
| S26 | TI ( "pre test*" or pretest* or posttest* or "post test*" ) or AB ( "pre test*" or pretest* or posttest* or "post test*" ) | 5942 |
| S25 | TI ( intervention* or multiintervention* or multi‐intervention* or postintervention* or post‐intervention* or preintervention* or pre‐intervention* ) or AB ( intervention* or multiintervention* or multi‐intervention* or postintervention* or post‐intervention* or preintervention* or pre‐intervention* ) | 105013 |
| S24 | (MH "Quasi‐Experimental Studies") | 4258 |
| S23 | (MH "Professional Development") | 10105 |
| S22 | (MH "Practice Patterns") OR (MH "Prescribing Patterns") | 3110 |
| S21 | AB ( (multifacet* or multi‐facet* or multimodal* or multi‐modal* or multidisciplin* or interdisciplin* or collaborat* or shared or team‐based or team or skill‐mix or inter‐disciplin* or multi‐disciplin*) ) and AB ( (care or practice or decsion* or refer* or consult*) ) | 32079 |
| S20 | (MH "Education, Medical, Continuing") OR (MH "Education, Nursing, Continuing") | 10047 |
| S19 | (MH "Multidisciplinary Care Team") | 15543 |
| S18 | (MH "Referral and Consultation") OR (MH "Group Practice") | 12699 |
| S17 | (MH "Family Practice") OR (MH "Physicians, Family") OR (MH "Primary Health Care") OR AB ("primary care" or "family physician*" or "family doctor*" or "primary health") | 41203 |
| S16 | TI (caplan* or felty's or Sjogren's or still's or wissler's) N disease* | 266964 |
| S15 | TI (Chondrocalcinosis or dermatomyositis or dupuytren* contracture or fibromyalgia* or Fibrositis or Fibrositides or gout or hyperostos* or lupus or Musculoskeletal or orthopedic* or orthopaedic* or osteitis or osteoarthrit* or osteoarthrop* or osteochondr* or Osteonecros* or osteoporos* or periarthriti* or polymyalgia* or raynaud disease* or rheumati* or sciatica or scleroderma* or Spondylarthrit* or sprain*) | 19656 |
| S14 | (MH "Dermatomyositis") OR (MH "Musculoskeletal System+") | 64039 |
| S13 | (MH "Back Pain+") OR (MH "Neck Pain") | 13141 |
| S12 | (MH "Sciatica") | 443 |
| S11 | (MH "Tendon Injuries+") OR (MH "Soft Tissue Injuries") OR (MH "Spinal Cord Injuries+") OR (MH "Dislocations+") | 14157 |
| S10 | (MH "Multiple Trauma") | 1104 |
| S9 | (MH "Dupuytren's Contracture") OR (MH "Scleroderma, Systemic+") | 1057 |
| S8 | (MH "Raynaud's Disease") | 299 |
| S7 | (MH "Back Injuries+") OR (MH "Arm Injuries+") OR (MH "Athletic Injuries+") OR (MH "Fractures+") OR (MH "Hand Injuries+") OR (MH "Leg Injuries+") OR (MH "Neck Injuries+") OR (MH "Sprains and Strains+") | 38128 |
| S6 | (MH "Arthritis+") | 19407 |
| S5 | (MH "Orthopedic Care") OR (MH "Orthopedic Surgery") | 5307 |
| S4 | (MH "Orthopedics") | 4192 |
| S3 | (MH "Rheumatology") | 676 |
| S2 | (MH "Lupus Erythematosus, Systemic+") | 2417 |
| S1 | (MH "Musculoskeletal Diseases+") | 72861 |
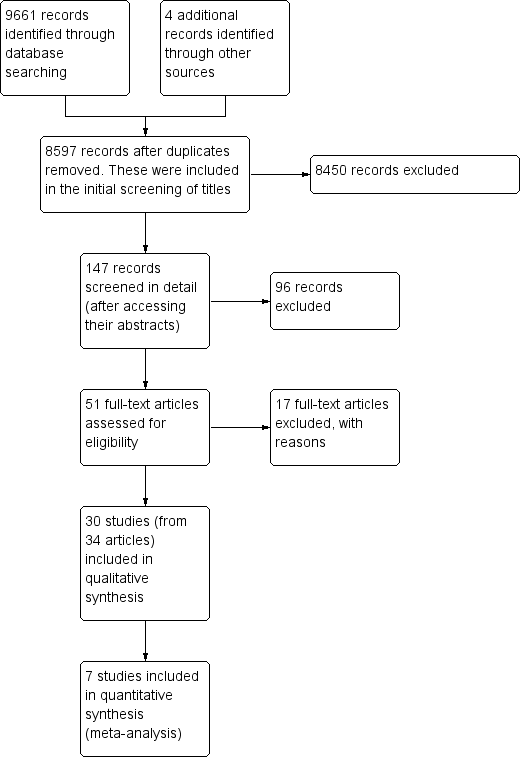
Prisma study flow diagram.
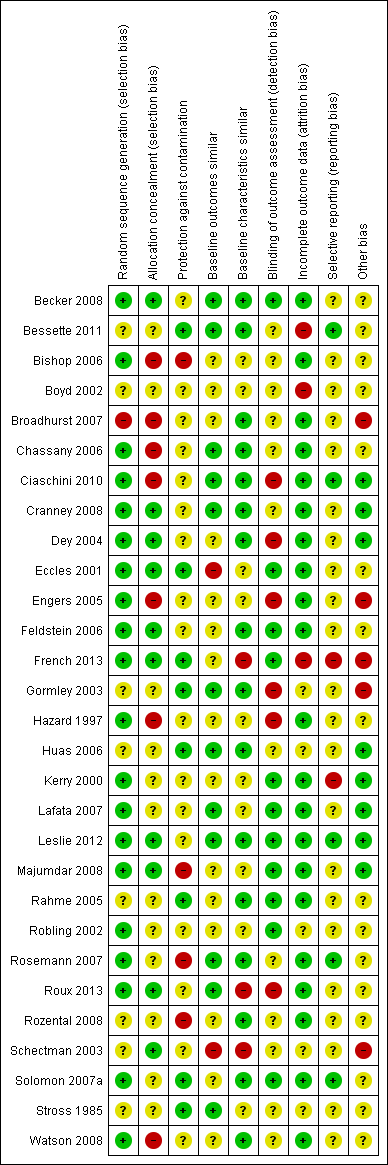
Risk of bias summary: review authors' judgements about each risk of bias item for each included study.
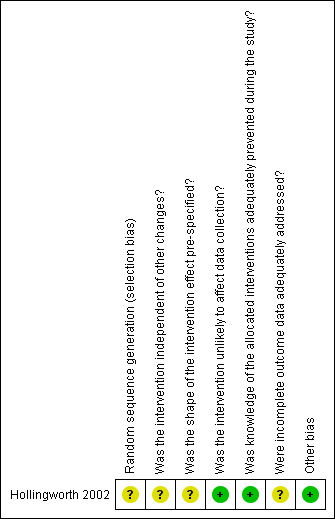
Risk of bias summary for ITS study design: review authors' judgements about each risk of bias item for each included study.
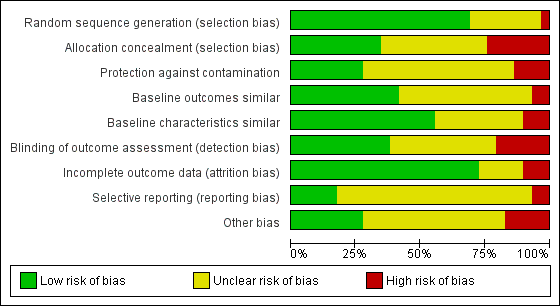
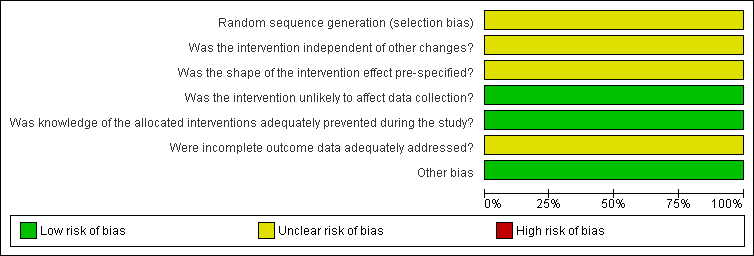
Risk of bias graph: review authors' judgements about each risk of bias item presented as percentages across all included studies.
Risk of bias graph for ITS study design: review authors' judgements about each risk of bias item presented as percentages across all included studies.
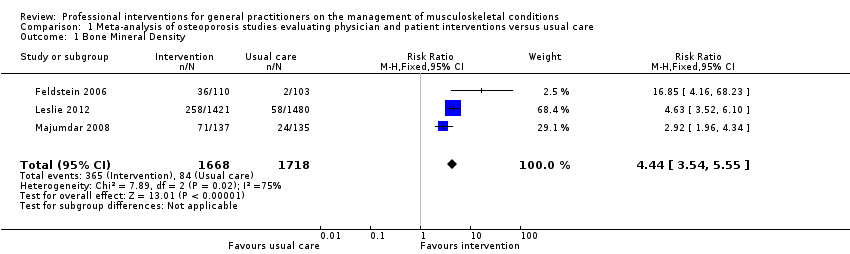
Comparison 1 Meta‐analysis of osteoporosis studies evaluating physician and patient interventions versus usual care, Outcome 1 Bone Mineral Density.
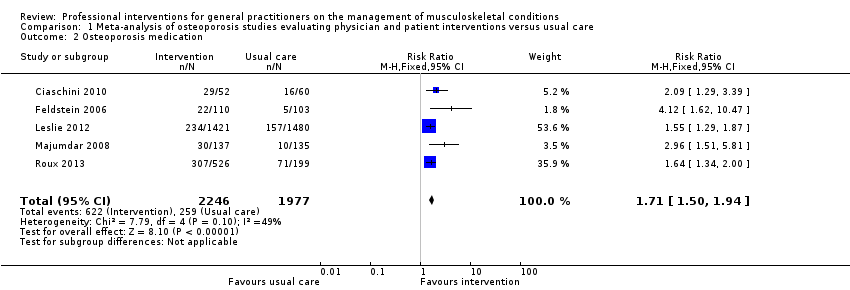
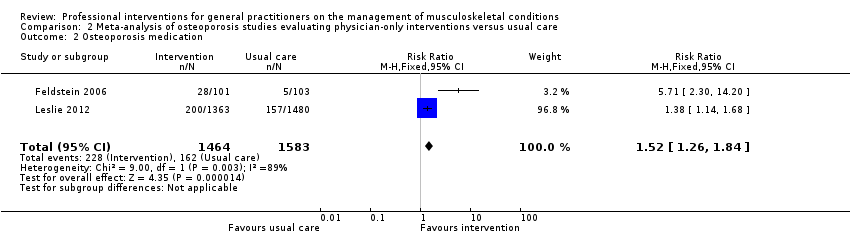
Comparison 1 Meta‐analysis of osteoporosis studies evaluating physician and patient interventions versus usual care, Outcome 2 Osteoporosis medication.
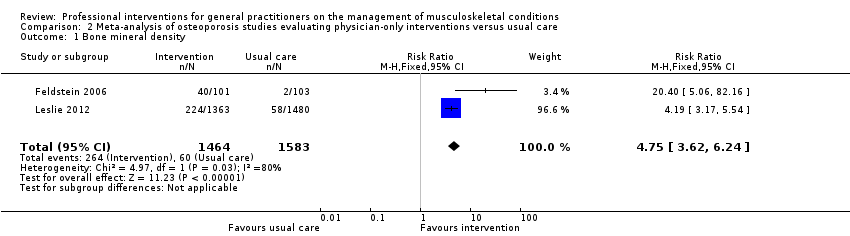
Comparison 2 Meta‐analysis of osteoporosis studies evaluating physician‐only interventions versus usual care, Outcome 1 Bone mineral density.
Comparison 2 Meta‐analysis of osteoporosis studies evaluating physician‐only interventions versus usual care, Outcome 2 Osteoporosis medication.
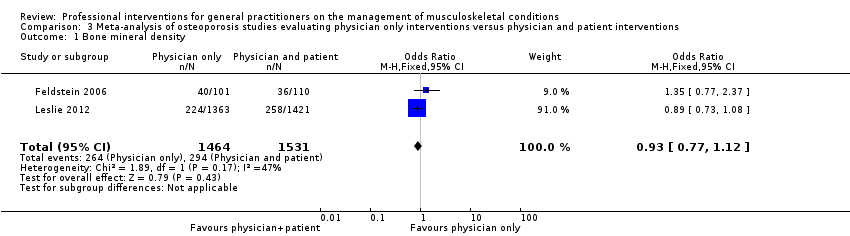
Comparison 3 Meta‐analysis of osteoporosis studies evaluating physician only interventions versus physician and patient interventions, Outcome 1 Bone mineral density.
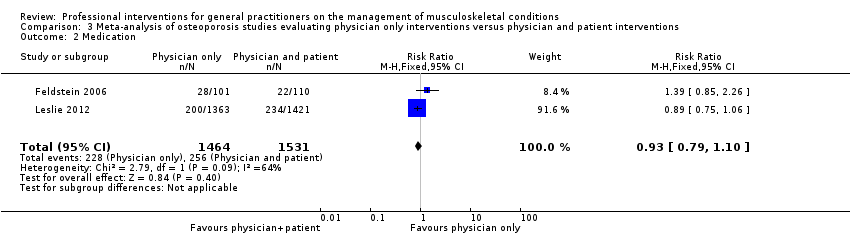
Comparison 3 Meta‐analysis of osteoporosis studies evaluating physician only interventions versus physician and patient interventions, Outcome 2 Medication.
| Primary care physician alerting system and a patient‐directed intervention (education and reminder to see their primary care physician) compared to usual care for osteoporosis management | ||||||
| Patient or population: General practitioners/family doctors involved in the management of patients with osteoporosis | ||||||
| Outcomes | Illustrative comparative risks* (95% CI) | Relative effect | No of Participants | Certainty of the evidence | Comments | |
| Assumed risk | Corresponding risk | |||||
| Usual care | A physician alerting system and a patient‐directed intervention (education and reminder to see their primary care physician) | |||||
| Bone Mineral Density 1 | Study population | RR 4.44 | 3386 | ⊕⊕⊕⊕ | ||
| 49 per 1000 | 220 per 1000 | |||||
| Moderate | ||||||
| 39 per 1000 | 176 per 1000 | |||||
| Osteoporosis medication 2 | Study population | RR 1.71 | 4223 | ⊕⊕⊕⊕ | ||
| 131 per 1000 | 241 per 1000 3 | |||||
| Moderate | ||||||
| 106 per 1000 | 195 per 1000 3 | |||||
| *The basis for the assumed risk (e.g. the median control group risk across studies) is provided in footnotes. The corresponding risk (and its 95% confidence interval) is based on the assumed risk in the comparison group and the relative effect of the intervention (and its 95% CI). | ||||||
| GRADE Working Group grades of evidence | ||||||
| 1 Bone mineral density (BMD) testing is an important outcome for osteoporosis because it leads to the diagnosis of the condition. This is one of the GP behaviour‐related outcomes (primary outcome) 2 Osteoporosis medication prescribing is an important outcome for osteoporosis management as it is the main aspect of treatment. This is one of the GP behaviour‐related outcomes (primary outcome) 3 One of the five studies (Roux 2013) had two intervention comparison groups which were combined to create a single pair‐wise comparison as recommended in chapter 16.5.4 of the Cochrane Handbook. | ||||||
| Primary care physician alerting system compared to usual care for osteoporosis management | ||||||
| Patient or population: General practitioners/family doctors involved in the management of patients with osteoporosis | ||||||
| Outcomes | Illustrative comparative risks* (95% CI) | Relative effect | No of Participants | Certainty of the evidence | Comments | |
| Assumed risk | Corresponding risk | |||||
| Usual care | Primary care physician alerting system | |||||
| Bone mineral density1 | Study population | RR 4.75 | 3047 | ⊕⊕⊕⊖ | ||
| 38 per 1000 | 302 per 1000 | |||||
| Moderate | ||||||
| 29 per 1000 | 231 per 1000 | |||||
| Osteoporosis medication2 | Study population | RR 1.52 | 3047 | ⊕⊕⊕⊖ | ||
| 102 per 1000 | 268 per 1000 | |||||
| Moderate | ||||||
| 77 per 1000 | 202 per 1000 | |||||
| *The basis for the assumed risk (e.g. the median control group risk across studies) is provided in footnotes. The corresponding risk (and its 95% confidence interval) is based on the assumed risk in the comparison group and the relative effect of the intervention (and its 95% CI). | ||||||
| GRADE Working Group grades of evidence | ||||||
| 1 Bone mineral density (BMD) testing is an important outcome for osteoporosis because it leads to the diagnosis of the condition. This is one of the GP behaviour‐related outcomes (primary outcome) 2 Osteoporosis medication prescribing is an important outcome for osteoporosis management as it is the main aspect of treatment. This is one of the GP behaviour‐related outcomes (primary outcome) 3 The quality of evidence was downgraded because only two studies were included, one of which had a small number of participants and events, and in view of the considerable statistical heterogeneity observed. | ||||||
| Primary care physician alerting system compared to Primary care physician alerting system and a patient‐directed intervention (education and reminder to see their primary care physician) for osteoporosis management | ||||||
| Patient or population: General practitioners/family doctors involved in the management of patients with osteoporosis | ||||||
| Outcomes | Illustrative comparative risks* (95% CI) | Relative effect | No of Participants | Certainty of the evidence | Comments | |
| Assumed risk | Corresponding risk | |||||
| Primary care physician alerting system and a patient‐directed intervention (education and reminder to see their primary care physician) | Primary care physician alerting system | |||||
| Bone mineral density1 | Study population | RR 0.94 (0.81 to 1.09) | 2995 | ⊕⊕⊕⊖ | ||
| 192 per 1000 | 194 per 1000 | |||||
| Moderate | ||||||
| 254 per 1000 | 257 per 1000 | |||||
| Medication2 Follow‐up: 6‐12 months | Study population | RR 0.93 | 2995 | ⊕⊕⊕⊖ moderate3 | ||
| 167 per 1000 | 176 per 1000 | |||||
| Moderate | ||||||
| 182 per 1000 | 191 per 1000 | |||||
| *The basis for the assumed risk (e.g. the median control group risk across studies) is provided in footnotes. The corresponding risk (and its 95% confidence interval) is based on the assumed risk in the comparison group and the relative effect of the intervention (and its 95% CI). | ||||||
| GRADE Working Group grades of evidence | ||||||
| 1 Bone mineral density (BMD) testing is an important outcome for osteoporosis because it leads to the diagnosis of the condition. This is one of the GP behaviour‐related outcomes (primary outcome) 2 Osteoporosis medication prescribing is an important outcome for osteoporosis management as it is the main aspect of treatment. This is one of the GP behaviour‐related outcomes (primary outcome) 3 The quality of evidence was downgraded because only two studies were included, one of which had a small number of participants and events. | ||||||
| Professional interventions for GPs on the management of osteoporosis compared to usual care | ||||
| Patient or population: General practitioners/family doctors involved in the management of patients with osteoporosis Settings: Primary care Intervention: Professional interventions (targeting physician‐only) Comparison: Usual care | ||||
| Outcomes | Impact (including effect sizes wherever available) | Number of Participants | Certainty of the evidence | Comments |
| Health professional (GP) behaviour‐related outcomes
|
|
|
| |
| Patient outcomes
| None of the included studies assessed these outcomes | |||
| Economic outcomes
| Majumdar 2007, assessed the cost effectiveness of the study Majumdar 2008, and concluded that the intervention led to a per patient cost saving of CAD 13 (USD 9) and a gain of 0.012 quality‐adjusted life years. | 272 participants (1 study) | ⊕⊕⊖⊖ low2 | |
| *The basis for the assumed risk (e.g. the median control group risk across studies) is provided in footnotes. The corresponding risk (and its 95% confidence interval) is based on the assumed risk in the comparison group and the relative effect of the intervention (and its 95% CI). | ||||
| GRADE Working Group grades of evidence | ||||
| 1The quality of evidence was downgraded because only two studies were included, one of which had a small number of participants and events, and in view of the considerable statistical heterogeneity observed. 2 The quality of evidence was downgraded because only one study was included which had some risk of bias. | ||||
| Professional interventions for GPs on the management of low back pain compared to usual care | ||||
| Patient or population: General practitioners/family doctors involved in the management of patients with low back pain Settings: Primary care Intervention: Professional interventions (targeting physician‐only) Comparison: Usual care | ||||
| Outcomes | Impact (including effect sizes wherever available) | No of studies | Certainty of the evidence | Comments |
| H ealth professional (GP) behaviour‐related outcomes | ||||
| Guideline‐consistent advice during consultation | Bishop 2006 showed that the intervention may result in little or no improvements (RD < 10%) with regard to guideline‐consistent advice about exercise, return to work and education and reassurance. Dey 2004 showed that the intervention probably results in a small reduction of sickness certification (RD 1.3). Engers 2005 showed that the intervention may lead to no improvement of GP behaviour with regards to patient education and advice during the consultation (RD range (‐1.3 to 12.8), authors reported OR ranging between 0.4 and 2.9). | 3 | ⊕⊕⊖⊖ low1 | |
| Guideline‐consistent prescribing of medication | Bishop 2006 showed that the intervention may lead to little improvements (RD < 10%) with regards to guideline‐consistent medication prescribing. Dey 2004 showed that the intervention probably results in no difference on prescribing rates of opioids (RD ‐1.3). Engers 2005 showed that the intervention may result in no improvement of GP behaviour with regard to prescribing (RD=2.8, OR=1, 95% CI (0.3 to 3), reported as not statistically significant). | 3 | ⊕⊕⊖⊖ low1 | |
| Guideline‐consistent referrals for investigations (e.g.. x‐rays) | Schectman 2003 showed that the intervention may result in little or no change in GP behaviour with regards to the number of guideline‐consistent referrals for lumbar spine x‐rays and CT scans (RD <5%). | 1 | ⊕⊕⊖⊖ low2 | |
| Guideline‐consistent referrals to other services | Bishop 2006 showed that the intervention may lead to little or no improvements (RD < 5%) with regards to guideline‐consistent referral to other services (such as physiotherapy). Schectman 2003 showed that the intervention may result in little or no difference with regards to the number of guideline‐consistent specialist or physiotherapy referrals (RD <5%). | 2 | ⊕⊕⊖⊖ low3 | |
| Number of investigations | Dey 2004 showed that the intervention probably results in a small increase in the ordering of x‐rays (RD 1.4). French 2013 showed that the intervention may lead to little or no difference in the number of x‐ray and CT requests (RD ‐0.2% and 0.0% respectively). Kerry 2000 showed that the intervention probably results in a cluster‐adjusted reduction of spinal x‐ray requests of 20% between the intervention and control groups (95% CI 4 to 36, P<0.05). Schectman 2003 showed that the intervention may result in little or no change in GP behaviour with regards to referrals for lumbar spine x‐rays and CT scans (RD <5%). | 4 | ⊕⊕⊖⊖low4 | |
| Number of referrals to other services | Dey 2004 showed that the intervention probably results in increased referrals to fast‐track physiotherapy and a back‐pain triage service (RD 12.6%). Engers 2005 showed that the intervention may lead to little reduction of onward referrals to a therapist (RD 4.6, 23% in the intervention group versus 28% in the control group, clustered adjusted OR 0.8, 95% CI (0.5 to 1.4)). Schectman 2003 showed that the intervention may result in little or no difference with regards to the number of specialist or physiotherapy referrals (RD <5%). | 3 | ⊕⊕⊖⊖ low4 | |
| Patient outcomes | ||||
| Functional capacity/activity scores | 0 | None of the included studies assessed this outcome | ||
| Pain control | 0 | None of the included studies assessed this outcome | ||
| Work absence | Hazard 1997 showed that the intervention may result in no improvement with respect to days of sick leave compared to the control group (RD ‐4.6%). | 1 | ⊕⊕⊖⊖ low2 | The study by Hazard 1997 was very small (just 53 participants) |
| Quality of life | 0 | None of the included studies assessed this outcome | ||
| Economic outcomes
| 0 | None of the included studies assessed these outcomes | ||
| *The basis for the assumed risk (e.g. the median control group risk across studies) is provided in footnotes. The corresponding risk (and its 95% confidence interval) is based on the assumed risk in the comparison group and the relative effect of the intervention (and its 95% CI). | ||||
| GRADE Working Group grades of evidence | ||||
| 1 The quality of evidence was downgraded because the studies have a high risk of bias and high heterogeneity in terms of the types of interventions evaluated. Additionally the effect sizes are small. 2 The quality of evidence was downgraded because the results are based only on one study with high risk of bias. 3 The quality of evidence was downgraded because the results are based on just two studies with high risk of bias. 4 The quality of evidence was downgraded because the studies have a high risk of bias and high heterogeneity in terms of the types of interventions evaluated. Additionally there is high inconsistency in the direction of effects across the studies. | ||||
| Professional interventions for GPs on the management of osteoarthritis compared to usual care | ||||
| Patient or population: General practitioners/family doctors involved in the management of patients with osteoarthritis Settings: Primary care Intervention: Professional interventions (targeting physician‐only) Comparison: Usual care | ||||
| Outcomes | Impact (including effect sizes wherever available) | No of studies | Certainty of the evidence | Comments |
| Health professional (GP) behaviour‐related outcomes | ||||
| Guideline‐consistent advice during consultation | Stross 1985 showed that the intervention may increase the use of intra‐articular corticosteroids (RD large at 29%). | ⊕⊕⊖⊖ low1 | ||
| Guideline‐consistent prescribing of medication | Rahme 2005 showed that the intervention may result in a slight improvement in osteoarthritis guideline‐consistent GP prescribing of medication (acetaminophen, NSAIDs and COX‐2 inhibitors) 5 months afterwards (RD 5% after dissemination of educational material, RD 7% after a workshop and RD 13% for the combined intervention) Rosemann 2007 showed that prescriptions for painkillers may slightly increase following the intervention (RDs between ‐2.2% and 11.1%). Stross 1985 showed that the intervention may reduce the use of systemic corticosteroids according to the guidelines (RD moderate at 19%). | ⊕⊕⊖⊖ low1 | ||
| Guideline‐consistent referrals for investigations (e.g.. x‐rays) | None of the included studies assessed this outcome | |||
| Guideline‐consistent referrals to other services | Stross 1985 showed that the intervention may increase the utilisation of physical therapy pre‐operatively (RD large at 57%). | ⊕⊕⊖⊖ low1 | ||
| Number of investigations | Rosemann 2007 showed that the intervention may result in some small reduction in the number of GP referrals for radiographs (SMD 0.2‐0.4). | ⊕⊕⊖⊖low3 | ||
| Number of referrals to other services | Rosemann 2007 showed that the intervention may result in a reduction in the number of GP referrals to orthopaedics (SMD 0.8 for the educational intervention and 0.2 for the combined intervention after adding nurse case management). | ⊕⊕⊖⊖ low4 | ||
| Patient outcomes | ||||
| Functional capacity/activity scores | Chassany 2006 showed that the intervention may result in small improvements with regard to physical function scores (WOMAC index physical function score) (SMD 0.3, P<0.05). | ⊕⊕⊖⊖ low5 | Results were assessed within two weeks of the Chassany 2006 trial, so it is unclear whether the positive patient outcomes persisted. | |
| Pain control | Chassany 2006 showed that the intervention may result in small improvements with regard to pain scores (VAS score, Pain relief (SPID), WOMAC index pain score) (SMD 0.2, P<0.05 across all outcomes). | ⊕⊕⊖⊖ low5 | Results were assessed within two weeks of the Chassany 2006 trial, so it is unclear whether the positive patient outcomes persisted. | |
| Work absence | None of the included studies assessed this outcome | |||
| Quality of life | Rosemann 2007 showed that the intervention may result in small or no improvement with regard to patient related outcomes (SMD <0.40). | ⊕⊕⊖⊖ low3 | ||
| Economic outcomes
| None of the included studies assessed these outcomes | |||
| *The basis for the assumed risk (e.g. the median control group risk across studies) is provided in footnotes. The corresponding risk (and its 95% confidence interval) is based on the assumed risk in the comparison group and the relative effect of the intervention (and its 95% CI). | ||||
| GRADE Working Group grades of evidence | ||||
| 1 The quality of evidence was downgraded because the results are based on one study only with high risk of bias and a small number of participants (114). 2 The quality of evidence was downgraded because the studies have high heterogeneity in terms of the types of interventions and the types of medications prescribed. 3 The quality of evidence was downgraded because the results are based on just one study and the effect size was small. 4 The quality of evidence was downgraded because the results are based on just one study and the effect size varies considerably between the two intervention groups. 5 The quality of evidence was downgraded because the results are based on just one study and were assessed just 2 weeks following the intervention. NSAIDs: Non steroidal anti‐inflammatory drugs, COX‐2 inhibitors: Cyclo‐oxygenase 2 inhibitors, WOMAC: Western Ontario and McMaster Universities Osteoarthritis Index, VAS: Visual analogue scale, SPID: sum of pain intensity differences. | ||||
| Professional interventions for GPs on the management of shoulder pain compared to usual care | ||||
| Patient or population: General practitioners/family doctors involved in the management of patients with shoulder pain Settings: Primary care Intervention: Professional interventions (targeting physician‐only) Comparison: Usual care | ||||
| Outcomes | Impact (including effect sizes wherever available) | Number of studies | Certainty of the evidence | Comments |
| Health professional (GP) behaviour‐related outcomes | ||||
| Guideline‐consistent advice during consultation | None of the included studies assessed this outcome | |||
| Guideline‐consistent prescribing of medication | None of the included studies assessed this outcome | |||
| Guideline‐consistent referrals for investigations (e.g.. x‐rays) | None of the included studies assessed this outcome | |||
| Guideline‐consistent referrals to other services | None of the included studies assessed this outcome | |||
| Number of investigations | Broadhurst 2007 showed that the intervention may result in a temporary, slight reduction in ultrasound requests, but little or no change in the x‐ray requests. | ⊕⊕⊖⊖ low1 | ||
| Number of referrals to other services | None of the included studies assessed this outcome | |||
| Patient outcomes | ||||
| Functional capacity/activity scores | Watson 2008 showed that the intervention may result in little or no improvement in function a year later (BSDQ SMD 0.2, SF‐36 for physical component SMD 0 and SF‐36 mental component SMD 0.1) | ⊕⊕⊖⊖ low2 | ||
| Pain control | None of the included studies assessed this outcome | |||
| Work absence | None of the included studies assessed this outcome | |||
| Quality of life | None of the included studies assessed this outcome | |||
| Economic outcomes
| McKenna 2009 assessed the cost effectiveness of providing practical training to GPs in the SAPPHIRE study by Watson 2008. It reported an incremental cost‐effectiveness ratio of GBP 2,813 per QALY gained for trained GPs. | ⊕⊕⊖⊖ low2 | ||
| *The basis for the assumed risk (e.g. the median control group risk across studies) is provided in footnotes. The corresponding risk (and its 95% confidence interval) is based on the assumed risk in the comparison group and the relative effect of the intervention (and its 95% CI). | ||||
| GRADE Working Group grades of evidence | ||||
| 1 The quality of evidence was downgraded because the results are based on just one study (CBA) with high risk of bias. 2 The quality of evidence was downgraded because the results are based on just one study and the effect size was small. BSDQ: British Shoulder Disability questionnaire, SF‐36: Short‐form 36 item Health Survey, GBP: Great Britain Pound | ||||
| Professional interventions for GPs on the management of shoulder pain compared to usual care | ||||
| Patient or population: General practitioners/family doctors involved in the management of patients with other musculoskeletal conditions Settings: Primary care Intervention: Professional interventions (targeting physician‐only) Comparison: Usual care | ||||
| Outcomes | Impact (including effect sizes wherever available) | No of studies | Certainty of the evidence | Comments |
| Health professional (GP) behaviour‐related outcomes | ||||
| Guideline‐consistent advice during consultation | None of the included studies assessed this outcome | |||
| Guideline‐consistent prescribing of medication | Huas 2006 showed that the intervention may result in increased level 3 (WHO classification) analgesic prescribing (SMD 1.2, P=0.02) | ⊕⊕⊖⊖ low1 | ||
| Guideline‐consistent referrals for investigations (e.g.. x‐rays) | None of the included studies assessed this outcome | |||
| Guideline‐consistent referrals to other services | None of the included studies assessed this outcome | |||
| Number of investigations | Kerry 2000 showed that the intervention may result in little or no reduction in GP knee radiology requests (relative change 10%, not statistically significant). | ⊕⊕⊖⊖ low2 | ||
| Number of referrals to other services | None of the included studies assessed this outcome | |||
| Patient outcomes | ||||
| Functional capacity/activity scores | None of the included studies assessed this outcome | |||
| Pain control | Huas 2006 showed that the intervention may result in worse patient‐related outcomes: pain relief scores (SMD 2, P=0.0004) | ⊕⊕⊖⊖ low1 | ||
| Work absence | None of the included studies assessed this outcome | |||
| Quality of life | None of the included studies assessed this outcome | |||
| Economic outcomes
| None of the included studies assessed these outcomes | |||
| *The basis for the assumed risk (e.g. the median control group risk across studies) is provided in footnotes. The corresponding risk (and its 95% confidence interval) is based on the assumed risk in the comparison group and the relative effect of the intervention (and its 95% CI). | ||||
| GRADE Working Group grades of evidence | ||||
| 1 The quality of evidence was downgraded because the results are based on just one study with high risk of bias. 2 The quality of evidence was downgraded because the results are based on just one study and the effect size was small. | ||||
| Table 1: Classification of relevant interventions from EPOC taxonomy | |
| Intervention | Description |
| Distribution of educational materials | Distribution of published or printed recommendations for clinical care, including clinical practice guidelines, audio‐visual materials and electronic publications. The materials may have been delivered personally or through mass mailings. |
| Educational meetings | Healthcare providers who have participated in conferences, lectures, workshops or traineeships |
| Local consensus processes | Inclusion of participating providers in discussion to ensure that they agreed that the chosen clinical problem was important and the approach to managing the problem was appropriate |
| Educational outreach visits | Use of a trained person who met with providers in their practice settings to give information with the intent of changing the provider’s practice. The information given may have included feedback on the performance of the provider(s) |
| Local opinion leaders | Use of providers nominated by their colleagues as ‘educationally influential’. The investigators must have explicitly stated that their colleagues identified the opinion leaders |
| Patient‐mediated | New clinical information (not previously available) collected directly from patients and given to the provider e.g. depression scores from an instrument |
| Audit and feedback | Any summary of clinical performance of health care over a specified period of time. The summary may also have included recommendations for clinical action. The information may have been obtained from medical records, computerised databases, or observations from patients |
| Reminders | Patient or encounter specific information, provided verbally, on paper or on a computer screen, which is designed or intended to prompt a health professional to recall information. This would usually be encountered through their general education; in the medical records or through interactions with peers, and so remind them to perform or avoid some action to aid individual patient care. Computer aided decision support and drugs dosage are included. |
| Marketing | Use of personal interviewing, group discussion (‘focus groups’), or a survey of targeted providers to identify barriers to change and subsequent design of an intervention that addresses identified barriers |
| Mass media | (i) Varied use of communication that reached great numbers of people including television, radio, newspapers, posters, leaflets, and booklets, alone or in conjunction with other interventions; (ii) Targeted at the population level |
| Other | Patient‐directed (education and reminders to see their primary care physician) |
| Table 2. Intervention types used in each study (N.B. All interventions evaluated were professional) | ||
| Intervention methods 1,2 | No. of Studies | Studies 3 |
| Distribution of educational materials | 27 | Becker 2008; Bessette 2011; Bishop 2006; Boyd 2002; Broadhurst 2007; Chassany 2006; Ciaschini 2010; Cranney 2008; Dey 2004; Eccles 2001; Engers 2005; Feldstein 2006; French 2013; Hazard 1997; Hollingworth 2002; Kerry 2000; Leslie 2012; Majumdar 2008; Rahme 2005; Robling 2002; Rosemann 2007; Roux 2013; Rozental 2008; Schectman 2003; Solomon 2007a; Stross 1985; Watson 2008 |
| Educational meetings | 10 | Becker 2008; Chassany 2006; Engers 2005; French 2013; Gormley 2003; Huas 2006; Rahme 2005; Rosemann 2007; Schectman 2003, Watson 2008 |
| Local consensus processes | 0 | |
| Educational outreach visits | 6 | Becker 2008; Broadhurst 2007; Dey 2004; Robling 2002; Schectman 2003; Solomon 2007a |
| Local opinion leaders | 3 | |
| Patient‐mediated | 6 | Boyd 2002; Ciaschini 2010; Cranney 2008; Huas 2006; Roux 2013; Rozental 2008 |
| Audit and feedback | 4 | |
| Reminders | 11 | Bishop 2006; Ciaschini 2010; Cranney 2008; Eccles 2001; Feldstein 2006; Hazard 1997; Lafata 2007; Leslie 2012; Majumdar 2008; Roux 2013; Rozental 2008 |
| Marketing | 0 | |
| Mass media | 0 | |
| Patient‐directed4 | 12 | Becker 2008; Bessette 2011; Bishop 2006; Leslie 2012; Ciaschini 2010; Cranney 2008; Feldstein 2006; Lafata 2007; Majumdar 2008; Rosemann 2007; Roux 2013; Solomon 2007a |
| 1. Category of intervention as classified by the EPOC taxonomy EPOC 2007 [9] 2. See Table 1 for definition of each intervention 3. Some studies used more than one intervention type and these are listed against their corresponding category 4. Patient‐directed interventions targeted patients and included patient education and reminders to see their primary‐care physician. These were included in the review only if they were a component of a professional intervention targeting primary‐care physicians | ||
| Table 3. Intervention combinations compared to a no‐intervention control group | ||
| Intervention combinations | No. of comparisons | Study ID |
| Single component interventions: | ||
| Distribution of educational materials | 1 | |
| Patient‐directed | 3 | |
| Educational meetings, workshops | 1 | |
| Multifaceted interventions: Two intervention components | ||
| Distribution of educational material + reminders | 4 | |
| Distribution of educational material + educational outreach visits | 4 | |
| Distribution of educational material + educational meeting/workshop | 6 | Chassany 2006; Engers 2005; French 2013; Rahme 2005; Rosemann 2007; Watson 2008 |
| Distribution of educational material + local opinion leaders | 1 | |
| Distribution of educational material + audit/feedback | 1 | |
| Patient‐mediated + educational meeting/workshop | 1 | |
| Patient‐directed +reminder | 1 | |
| Patient‐directed + educational material | 1 | |
| Multifaceted interventions: Three intervention components | ||
| Patient‐directed + educational material + reminder | 3 | |
| Patient‐directed + educational material + educational meeting/workshop | 1 | |
| Patient‐directed + educational material + educational outreach visit | 1 | |
| Multifaceted interventions: Four intervention components | ||
| Patient‐directed + distribution of educational material + reminder + local opinion leaders | 1 | |
| Patient‐mediated + distribution of educational material + reminders + patient‐directed (education and reminders) | 3 | |
| Multifaceted interventions: Five intervention components | ||
| Distribution of educational material + educational meetings/workshops + audit + educational outreach visit + local opinion leaders | 1 | |
| Table 4. Intervention combinations compared to a different intervention | ||
| Intervention combinations | No. of comparisons | Study ID |
| Single component interventions: | ||
| Educational meetings/workshops vs distribution of educational material | 1 | |
| Educational meetings/workshops vs a different educational meeting/workshop | 1 | |
| Multifaceted interventions: Two intervention components | ||
| Distribution of educational material + patient‐mediated vs the same intervention but less intensive | 1 | |
| Distribution of educational material + educational outreach visit vs distribution of educational material | 1 | |
| Distribution of educational material + audit vs distribution of educational material | 2 | |
| Distribution of educational material + audit vs distribution of educational material + reminder | 1 | |
| Distribution of educational material + outreach vs distribution of educational material + audit | 1 | |
| Distribution of educational material + educational outreach visit vs patient‐directed | 1 | |
| Distribution of educational material + patient‐directed vs the same (more intensive) | 1 | |
| Patient‐directed + reminder vs patient‐directed | 1 | |
| Distribution of educational material + reminder vs distribution of educational material | 1 | |
| Distribution of educational material + reminder vs patient‐mediated | 1 | |
| Distribution of educational material + educational meeting/workshop vs educational meeting/workshop | 1 | |
| Distribution of educational material + educational meeting/workshop vs distribution of educational material | 1 | |
| Multifaceted interventions: Three intervention components | ||
| Distribution of educational material + reminders + patient‐directed vs distribution of educational material + reminders | 2 | |
| Distribution of educational material + reminder + patient‐directed vs patient‐directed | 1 | |
| Distribution of educational material + audit + reminders vs distribution of educational material | 1 | |
| Distribution of educational material + audit + reminders vs distribution of educational material + audit | 1 | |
| Distribution of educational material + audit + reminders vs distribution of educational material + reminders | ||
| Distribution of educational material + audit + outreach vs distribution of educational material + outreach | 1 | |
| Distribution of educational material + audit + outreach vs distribution of educational material + audit | 1 | |
| Distribution of educational material + audit + outreach vs distribution of educational material | 1 | |
| Distribution of educational material + educational meetings/workshops + educational outreach visits vs distribution of educational material | 1 | |
| Distribution of educational material + educational outreach visit + patient‐directed vs patient‐directed | 1 | |
| Distribution of educational material + educational outreach visit + patient‐directed vs distribution of educational material + educational outreach visit | 1 | |
| Distribution of educational material + educational meeting/workshop + patient‐directed vs distribution of educational material + educational meeting/workshop | 1 | |
| Multifaceted interventions: Four intervention components | ||
| Distribution of educational material + educational meetings/workshops + educational outreach visits + patient‐directed vs distribution of educational material | 1 | |
| Distribution of educational material + educational meetings/workshops +educational outreach visits + patient directed vs distribution of educational material + educational meetings/workshops + educational outreach visits | 1 | |
| Patient‐mediated + distribution of education material + reminders + patient‐directed (education and reminders) vs patient‐mediated + distribution of education material + reminders + patient‐directed (education and reminders) | 1 | |
| (Study) Intervention | Int pre (%) 1 | C pre (%)2 | Int post (%)3 | C post (%)4 | ARD 5 | Risk difference 6 (P value if reported by authors) | Relative % change post 7 | Risk ratio 8 |
| Patient education and reminder to see their physician (patient directed), education of physician via the patient (distribution of educational material) | ‐ | ‐ | 14.72% | 11.96% | ‐ | 2.8% | 23% | 1.2 |
| Patient education (including video on osteoporosis) and reminder to see their physician, education of physician via the patient (distribution of educational material) | ‐ | ‐ | 15.81% | 11.96% | ‐ | 3.9% | 32% | 1.3 |
| (Cranney 2008)** Patient‐specific mailed letter to primary are physician (including guidelines) and patient education and reminder | ‐ | ‐ | 64/125 (51%) | 36/145 (25%) | ‐ | 26.4% (P< 0.0001) | 106% | 2.1 |
| Patient‐specific Electronic Medical Record (EMR) reminders to primary‐care provider informing them of patient increased risk and guidelines. Sent twice. | ‐ | ‐ | 40/101 (39.6%) | 2/103 (1.9%) | ‐ | 37.7% (P< 0.01) | 1940% | 20.4 |
| EMR reminder plus patient‐directed intervention: education and reminder | ‐ | ‐ | 36/110 (32.7%) | 2/103 (1.9%) | ‐ | 30.8% (P< 0.01) | 1585% | 16.9 |
| (Lafata 2007)** Patient‐directed: 2 mailings (educational and reminders) | ‐ | ‐ | 720/3367 (21.4%) | 313/2901 (10.8%) | ‐ | 10.6% (P< 0.001) | 98% | 2 |
| (Lafata 2007)** Physician prompt: Electronic Medical Record (EMR) reminder to physician and biweekly mailing plus patient‐directed: 2 mailings (educational and reminders) | ‐ | ‐ | 1181/4086 (28.9%) | 313/2901 (10.8%) | ‐ | 18.1% (P< 0.001) | 168% | 2.7 |
| Physician reminder plus educational material | 224/1363 (16.4%) | 58/1480 (3.9%) | ‐ | 12.5% | 319% | 4.2 | ||
| Physician reminder plus educational material plus patient‐directed intervention (reminder to see their physician) | ‐ | ‐ | 258/1421 (18.2%) | 58/1480 (3.9%) | ‐ | 14.2% | 363% | 4.6 |
| Patient education, physician patient‐specific reminders by mail/fax, physician guidelines endorsed by opinion leaders | ‐ | ‐ | 71/137 (51.8%) | 24/135 (17.8%) | ‐ | 34% (P< 0.001) | 192% | 2.9 |
| (Solomon 2007a)** Patient directed (3 mailed letters educational) | ‐ | ‐ | 249/3274 (7.6%) | 224/3268 (6.9%) | ‐ | 0.8% (NS) | 11% | 1.1 |
| (Solomon 2007a)** Physician education following an academic‐detailing approach | ‐ | ‐ | 183/3574 (5.1%) | 224/3268 (6.9%) | ‐ | ‐1.7% (NS) | ‐25% | 0.7 |
| (Solomon 2007b)** Combination of both physician and patient education | ‐ | ‐ | 223/3339 (6.7%) | 224/3268 (6.9%) | ‐ | ‐0.2% (NS) | ‐3% | 1 |
| 1. Intervention group pre‐intervention proportion 2. Control group pre‐intervention proportion 3. Intervention group post‐intervention proportion 4. Control group post‐intervention proportion 5. ARD = [Int post (%) minus C post (%)] minus [Int pre (%) minus C pre (%)]. The direction of effect has been adjusted so that a positive result represents a beneficial intervention outcome, according to Grimshaw 2004. 6. Risk Difference (RD) is the absolute % change post‐intervention = Int post (%) minus C post (%). This is considered to be "small" if ≤ 5%, "modest" if > 5% and ≤10%,"moderate" if > 10% but ≤ 20%, and "large" if > 20%.The direction of effect has been adjusted so that a positive result represents a beneficial intervention outcome, according to Grimshaw 2004. 7. Relative % change post = absolute % change post divided by C post (%). The direction of effect has been adjusted so that a positive result represents a beneficial intervention outcome, according to Grimshaw 2004. 8. Risk ratio (RR) = Int post (%) divided by C post (%) BMD: bone mineral density; C: control group; Int: intervention group; ARD: adjusted risk difference; NS: not significant * In the study by Bessette 2011, the outcomes reported above include the participants with a diagnosis following the intervention. The women were considered "diagnosed" if they received a BMD test, if they were informed by their physician that they were suffering from osteoporosis and/or if they were initiated on osteoporosis medication. Therefore, the above percentages do not necessarily mean that the women received a BMD test. ** The data reported above for the studies by Cranney 2008, Lafata 2007 and Solomon 2007b does not account for clustering. We did not have access to sufficient information to adjust the data for clustering. | ||||||||
| (Study) Intervention | Int pre (%) 1 | C pre (%)2 | Int post (%)3 | C post (%)4 | ARD 5 | Risk difference 6 (P value if reported by authors) | Relative % change post 7 | Risk ratio 8 |
| Patient education (patient directed), education of physician via the patient (for group of patients without diagnosis or treatment at randomisation) | ‐ | ‐ | 11.79% | 7.78% | ‐ | 4% | 52% | 1.5 |
| Patient education (including video on osteoporosis), education of physician via the patient (for group of patients without diagnosis or treatment at randomisation) | ‐ | ‐ | 10.64% | 7.78% | ‐ | 2.9% | 37% | 1.4 |
| Patient education (patient directed), education of physician via the patient (for group of patients without treatment at randomisation) | ‐ | ‐ | 13.49% | 10.31% | ‐ | 3.2% | 31% | 1.3 |
| Patient education (including video on osteoporosis), education of physician via the patient (for group of patients without treatment at randomisation) | ‐ | ‐ | 12.71% | 10.31% | ‐ | 2.4% | 23% | 1.2 |
| Patient education, education of physician via the patient where the patient did pass the information on to the physician (for group of patients without treatment at randomisation) | ‐ | ‐ | 15% | 10% | ‐ | 5% | 50% | 1.5 |
| Patient‐specific evidence‐based recommendations targeted to improve osteoporosis treatment to both the patients and their primary‐care providers | ‐ | ‐ | 29/52 (55.8%) | 16/60 (26.7%) | ‐ | 29.1% | 109% | 2.1 |
| (Cranney 2008)* Patient‐specific mailed letter to primary are physician (including guidelines) and patient education and reminder | ‐ | ‐ | 35/125 (28%) | 15/145 (10.3%) | ‐ | 17.7% (P=0.0002) | 171% | 2.7 |
| Patient‐specific Electronic Medical Record (EMR) reminders to primary‐care provider informing them of patient increased risk and guidelines. Sent twice. | ‐ | ‐ | 28/101 (27.7%) | 5/103 (5%) | ‐ | 22.9% (P< 0.01) | 471% | 5.7 |
| EMR reminder plus patient‐directed intervention: education and reminder | ‐ | ‐ | 22/110 (20.2%) | 5/103 (5%) | ‐ | 15.1% (P< 0.01) | 312% | 4.1 |
| (Lafata 2007)* Patient‐directed: x2 mailings (educational and reminders) | ‐ | ‐ | 11/128 (8.6%) | 3/51 (5.9%) | ‐ | 2.7% | 46% | 1.5 |
| (Lafata 2007)* Physician prompt: Electronic Medical Record (EMR) reminder to physician and biweekly mailing plus Patient‐directed: 2 mailings (educational and reminders) | ‐ | ‐ | 15/162 (9.3%) | 3/51 (5.9%) | ‐ | 3.4% | 57% | 1.6 |
| Physician reminder plus educational material | ‐ | ‐ | 200/1363 (14.7%) | 157/1480 (10.6%) | ‐ | 4.1% | 38% | 1.4 |
| Physician reminder plus educational material plus patient‐directed intervention (reminder to see their physician) | ‐ | ‐ | 234/1421 (16.5%) | 157/1480 (10.6%) | ‐ | 5.9% | 55% | 1.6 |
| Patient education, physician patient‐specific reminders by mail/fax, physician guidelines endorsed by opinion leaders | ‐ | ‐ | 30/137 (21.9%) | 10/135 (7.4%) | ‐ | 14.5% (P<0.001) | 196% | 3 |
| Verbal and written information on osteoporosis to patient and letter with specific management plan sent to their treating physician. Patient reminders at 6 and 12 months. Reminder to physician if patient untreated at 6 months | 82/275 (29.8%) | 45/199 (22.6%) | 151/275 (54.9%) | 71/199 (35.7%) | 12% | 19.2% (P< 0.005) | 54% | 1.5 |
| Verbal and written information on osteoporosis to patient and letter with specific management plan sent to their treating physician. Blood tests and BMD test ordered for patient and results sent to the physician. Patient reminders at 4,8 and 12 months and physician reminders at 4 and 8 months if patient remained untreated | 65/251 (25.9%) | 45/199 (22.6%) | 156/251 (62.2%) | 71/199 (35.7%) | 23.2% | 26.5% (P< 0.005) | 74% | 1.7 |
| Patient directed (x3 mailed letters educational) | ‐ | ‐ | 208/3274 (6.4%) | 231/3268 (7.1%) | ‐ | ‐0.7% | ‐10% | 0.9 |
| Physician education following an academic detailing approach | ‐ | ‐ | 197/3574 (5.5%) | 231/3268 (7.1%) | ‐ | ‐1.6% | ‐22% | 0.8 |
| Combination of both physician and patient education | ‐ | ‐ | 236/3339 (7.1%) | 231/3268 (7.1%) | ‐ | 0 | 0 | 1 |
| 1. Intervention group pre‐intervention proportion 2. Control group pre‐intervention proportion 3. Intervention group post‐intervention proportion 4. Control group post‐intervention proportion 5. ARD = [Int post (%) minus C post (%)] minus [Int pre (%) minus C pre (%)]. The direction of effect has been adjusted so that a positive result represents a beneficial intervention outcome, according to Grimshaw 2004. 6. Risk Difference (RD) is the absolute % change post‐intervention = Int post (%) minus C post (%). This is considered to be "small" if ≤ 5%, "modest" if > 5% and ≤10%,"moderate" if > 10% but ≤ 20%, and "large" if > 20%.The direction of effect has been adjusted so that a positive result represents a beneficial intervention outcome, according to Grimshaw 2004. 7. Relative % change post = absolute % change post divided by C post (%). The direction of effect has been adjusted so that a positive result represents a beneficial intervention outcome, according to Grimshaw 2004. 8. Risk ratio (RR) = Int post (%) divided by C post (%) BMD: bone mineral density; C: control group; Int: intervention group; ARD: adjusted risk difference; NS: not significant * The data reported above for the studies by Cranney 2008, Lafata 2007 and Solomon 2007b does not account for clustering. We did not have access to sufficient information to adjust the data for clustering. | ||||||||
| (Study) Interventions | Int 1 pre (%) 1 | Int 2 pre (%)2 | Int 1 post (%)3 | Int 2 post (%)4 | ARD 5 | Risk difference6 (P value if reported by authors) | Relative % change post 7 | Risk ratio 8 |
| Patient education, education of physician via the patient, reminder to family physician versus Patient education (including video on osteoporosis), education of physician via the patient, reminder to family physician | 14.72% | 15.81% | ‐1.1% | ‐7% | 0.9 | |||
| Patient‐specific letter to primary care physician containing information on results and recommendations: standard versus extended letter | ‐ | ‐ | 25/83 (30.1%) | 29/78 (37.2%) | ‐ | ‐7.1% | ‐19% | 0.8 |
| Patient‐specific Electronic Medical Record (EMR) reminders to primary‐care provider informing them of patient increased risk and guidelines (sent twice) versus EMR plus patient‐directed intervention (education and reminder) | ‐ | ‐ | 40/101 (39.6%) | 36/110 (32.7%) | ‐ | 6.9% | 21% | 1.2 |
| (Lafata 2007)** Patient‐directed: 2 mailings (educational and reminders) versus physician prompt: Electronic Medical Record (EMR) reminder to physician and biweekly mailing plus patient‐directed: 2 mailings (educational and reminders) | ‐ | ‐ | 720/3367 (21.4%) | 1181/4086 (28.9%) | ‐ | ‐7.5% | ‐26% | 0.7 |
| Physician reminder plus educational material versus physician reminder plus educational material plus patient‐directed intervention (reminder to see their physician) | ‐ | ‐ | 224/1363 (16.4%) | 258/1421 (18.2%) | ‐ | ‐1.7% (NS) | ‐9% | 0.9 |
| Patient‐specific letter to primary‐care physician outlining guidelines versus orthopaedic surgeon ordering BMD and forwarding results to primary‐care physician | 7/23 (30.4%) | 25/27(92.6%) | ‐ | ‐62.2% | ‐67% | 0.3 | ||
| (Solomon 2007a)** Patient‐directed (3 mailed letters educational) versus physician education following an academic‐detailing approach | ‐ | ‐ | 249/3274 (7.6%) | 183/3574 (5.1%) | ‐ | 2.5% | 49% | 1.5 |
| (Solomon 2007a)** Patient‐directed (3 mailed letters educational) versus combination of both physician and patient education | ‐ | ‐ | 249/3274 (7.6%) | 223/3339 (6.7%) | ‐ | 0.9% | 14% | 1.1 |
| (Solomon 2007a)** Physician education following an academic‐detailing approach versus combination of both physician and patient education | ‐ | ‐ | 183/3574 (5.1%) | 223/3339 (6.7%) | ‐ | ‐1.6% | ‐23% | 0.8 |
| 1. Intervention 1 group pre‐intervention proportion 2. Intervention 2 group pre‐intervention proportion 3. Intervention 1 group post‐intervention proportion 4. Intervention 2 group post‐intervention proportion 5. ARD = [Int 1 post (%) minus Int 2 post (%)] minus [Int 1 pre (%) minus Int 2 pre (%)]. The direction of effect has been adjusted so that a positive result represents a beneficial intervention 1 outcome, according to Grimshaw 2004. 6. Risk Difference (RD) is the absolute % change post‐intervention = Int 1 post (%) minus Int 2 post (%). This is considered to be "small" if ≤ 5%, "modest" if > 5% and ≤10%,"moderate" if > 10% but ≤ 20%, and "large" if > 20%.The direction of effect has been adjusted so that a positive result represents a beneficial intervention 1 outcome. 7. Relative % change post = absolute % change post divided by Int 2 post (%). The direction of effect has been adjusted so that a positive result represents a beneficial intervention 1 outcome, according to Grimshaw 2004. 8. Risk ratio (RR) = Int 1 post (%) divided by Int 2 post (%) BMD: bone mineral density; Int 1: intervention 1 group; Int 2: Intervention 2 group; ARD: adjusted risk difference; NS: not significant * In the study by Bessette 2011, the outcomes reported above include the participants with a diagnosis following the intervention. The women were considered "diagnosed" if they received a BMD test, if they were informed by their physician that they were suffering from osteoporosis and/or if they were initiated on osteoporosis medication. Therefore, the above percentages do not necessarily mean that the women received a BMD test. **The data reported above for the studies by Lafata 2007 and Solomon 2007b does not account for clustering. We did not have access to sufficient information to adjust the data for clustering. | ||||||||
| (Study) Interventions | Int 1 pre (%) 1 | Int 2 pre (%)2 | Int 1 post (%)3 | Int 2 post (%)4 | ARD 5 | Risk difference 6 (P value if reported by authors) | Relative % change post 7 | Risk ratio 8 |
| Patient education, education of physician via the patient, reminder to family physician (for group of patients without diagnosis or treatment at randomisation) versus Patient education (including video on osteoporosis), education of physician via the patient, reminder to family physician (for group of patients without diagnosis and treatment at randomisation) | ‐ | ‐ | 11.79% | 10.64% | ‐ | 1.2% | 11% | 1.1 |
| Patient education, education of physician via the patient, reminder to family physician (for group of patients without diagnosis or treatment at randomisation) versus Patient education (including video on osteoporosis), education of physician via the patient, reminder to family physician (for group of patients without treatment at randomisation) | ‐ | ‐ | 13.49% | 12.71% | ‐ | 0.8% | 6% | 1.1 |
| Patient‐specific letter to primary care physician containing information on results and recommendations: standard versus extended letter | ‐ | ‐ | 11/104 (10.6%) | 14/93 (15.1%) | ‐ | ‐4.5% | ‐30% | 0.7 |
| Patient specific Electronic Medical Record (EMR) reminders to primary care provider informing them of patient increased risk and guidelines (sent twice) versus EMR plus patient‐directed intervention (education and reminder). | ‐ | ‐ | 28/101 (27.7%) | 22/110 (20%) | ‐ | 7.7% | 39% | 1.4 |
| (Lafata 2007)* Patient‐directed: 2 mailings (educational and reminders) versus physician prompt: Electronic Medical Record (EMR) reminder to physician and biweekly mailing plus patient‐directed: 2 mailings (educational and reminders) | ‐ | ‐ | 11/128 (8.6%) | 15/162 (9.3%) | ‐ | ‐0.7% | ‐7% | 0.9 |
| Physician reminder plus educational material versus physician reminder plus educational material plus patient‐directed intervention (reminder to see their physician) | ‐ | ‐ | 200/1363 (14.7%) | 234/1421 (16.5%) | ‐ | ‐1.8% (NS) | ‐11% | 0.9 |
| Verbal and written information on osteoporosis to patient and letter with specific management plan sent to their treating physician. Patient reminders at 6 and 12 months. Reminder to physician if patient untreated at 6 months versus verbal and written information on osteoporosis to patient and letter with specific management plan sent to their treating physician. Blood tests and BMD test ordered for patient and results sent to the physician. Patient reminders at 4,8 and 12 months and physician reminders at 4 and 8 months if patient remained untreated | 82/275 (29.8%) | 65/251 (25.9%) | 151/275 (54.9%) | 156/251 (62.2%) | ‐11.2% | ‐7.2% (P<0.001) | ‐12% | 0.9 |
| Patient specific letter to primary care physician outlining guidelines versus orthopaedic surgeon ordering BMD and forwarding results to primary‐care physician | 6/23 (26.1%) | 20/27(74.1%) | ‐ | ‐48% | ‐65% | 0.4 | ||
| Patient directed (x3 mailed letters educational) versus physician education following an academic detailing approach | ‐ | ‐ | 208/3274 (6.4%) | 197/3574 (5.5%) | ‐ | 0.8% | 15% | 1.2 |
| Patient directed (x3 mailed letters educational) versus combination of both physician and patient education | ‐ | ‐ | 208/3274 (6.4%) | 236/3339 (7.1%) | ‐ | ‐0.7% | ‐10% | 0.9 |
| Physician education following an academic detailing approach versus combination of both physician and patient education | ‐ | ‐ | 197/3574 (5.5%) | 236/3339 (7.1%) | ‐ | ‐1.6% | ‐22% | 0.8 |
| 1. Intervention 1 group pre‐intervention proportion 2. Intervention 2 group pre‐intervention proportion 3. Intervention 1 group post‐intervention proportion 4. Intervention 2 group post‐intervention proportion 5. ARD = [Int 1 post (%) minus Int 2 post (%)] minus [Int 1 pre (%) minus Int 2 pre (%)]. The direction of effect has been adjusted so that a positive result represents a beneficial intervention 1 outcome, according to Grimshaw 2004. 6. Risk Difference (RD) is the absolute % change post‐intervention = Int 1 post (%) minus Int 2 post (%). This is considered to be "small" if ≤ 5%, "modest" if > 5% and ≤10%,"moderate" if > 10% but ≤ 20%, and "large" if > 20%.The direction of effect has been adjusted so that a positive result represents a beneficial intervention 1 outcome. 7. Relative % change post = absolute % change post divided by Int 2 post (%). The direction of effect has been adjusted so that a positive result represents a beneficial intervention 1 outcome, according to Grimshaw 2004. 8. Risk ratio (RR) = Int 1 post (%) divided by Int 2 post (%) BMD: bone mineral density; Int 1: intervention 1 group; Int 2: Intervention 2 group; ARD: Adjusted risk difference; NS: not significant * The data reported above for the studies by Lafata 2007 and Solomon 2007b does not account for clustering. We did not have access to sufficient information to adjust the data for clustering. | ||||||||
| (Study) Intervention | Outcome | Int pre (%) 1 | C pre (%)2 | Int post (%)3 | C post (%)4 | ARD 5 | Risk difference 6 (P value if reported by authors) | Relative % change post 7 | Risk ratio 8 |
| Physician education (guidelines) and 3 patient‐specific reminder letters | Education and reassurance according to guideline 0 ‐ 4 weeks post‐onset | ‐ | ‐ | 10% (16/162) | 7% (10/149) | 3.2% | 47% | 1.5 | |
| Exercise according to guideline 0 ‐ 4 weeks post‐onset | ‐ | ‐ | 38% (62/162) | 43% (64/149) | ‐4.7% | ‐11% | 0.9 | ||
| Appropriate medication according to guideline 0 ‐ 4 weeks post‐onset | ‐ | ‐ | 85% (138/162) | 77% (115/149) | 8% (P=0.14) | 10% | 1.1 | ||
| Spinal manipulation according to guideline 0 ‐ 4 weeks post‐onset | ‐ | ‐ | 2.5% (4/162) | 6% (9/149) | ‐3.6% | ‐59% | 0.4 | ||
| Guideline‐discordant physician recommended treatment 0 ‐ 4 weeks post‐onset | ‐ | ‐ | 10% (16/162) | 17% (25/149) | 6.9% (P=0.05) | 41% | 0.6 | ||
| Supervised exercise programme (recommended treatment 5 ‐ 12 weeks post‐onset) | ‐ | ‐ | 19% (29/154) | 14% (21/149) | 4.7% (P=0.11) | 34% | 1.3 | ||
| Return to work (recommended treatment 5 ‐ 12 weeks post‐onset) | ‐ | ‐ | 24% (37/154) | 17% (25/149) | 7.2% (P=0.18) | 43% | 1.4 | ||
| Refer to interdisciplinary programme (recommended treatment 5 ‐ 12 weeks post‐onset) | ‐ | ‐ | 4% (6/154) | 2% (3/149) | 1.9% | 94% | 1.9 | ||
| Physiotherapy > 4 weeks (guideline‐discordant) | ‐ | ‐ | 41% (63/154) | 43% (64/149) | 2% | 5% | 1 | ||
| Continued use of spinal manipulation therapy (guideline‐discordant) | ‐ | ‐ | ‐(no data available) | 33% (49/149) | ‐ (P=0.04) | ‐ | |||
| Physician education, reminders and also patient education and 3 reminders | Education and reassurance according to guideline 0 ‐ 4 weeks post‐onset | ‐ | ‐ | 6% (9/151) | 7% (10/149) | ‐0.8% | ‐11% | 0.9 | |
| Exercise according to guideline 0 ‐ 4 weeks post‐onset | ‐ | ‐ | 53% (80/151) | 43% (64/149) | 10% (P=0.05) | 23% | 1.2 | ||
| Appropriate medication according to guideline 0 ‐ 4 weeks post‐onset | ‐ | ‐ | 81% (122/151) | 77% (115/149) | 3.6% (P=0.08) | 5% | 1 | ||
| Spinal manipulation according to guideline 0 ‐ 4 weeks post‐onset | ‐ | ‐ | 5% (8/151) | 6% (9/149) | ‐0.7% | ‐12% | 0.9 | ||
| Guideline‐discordant physician recommended treatment 0 ‐ 4 weeks post‐onset | ‐ | ‐ | 18% (27/151) | 17% (25/149) | ‐1.1% | ‐7% | 1.1 | ||
| Supervised exercise programme (recommended treatment 5 ‐ 12 weeks post‐onset) | ‐ | ‐ | 18% (26/145) | 14% (21/149) | 3.8% (P=0.07) | 27% | 1.3 | ||
| Return to work (recommended treatment 5 ‐ 12 weeks post‐onset) | ‐ | ‐ | 23% (33/145) | 17% (25/149) | 6% (P=0.14) | 36% | 1.4 | ||
| Refer to interdisciplinary programme (recommended treatment 5 ‐ 12 weeks post‐onset) | ‐ | ‐ | 0 | 2% (3/149) | ‐2% | ‐100% | 0 | ||
| Physiotherapy > 4 weeks (guideline‐discordant) | ‐ | ‐ | 42% (61/145) | 43% (64/149) | 0.9% | 2% | 1 | ||
| Continued use of spinal manipulation therapy (guideline‐discordant) | ‐ | ‐ | 3% (4/145) | 33% (49/149) | 30.1% (P=0.05) | 92% | 0.1 | ||
| (Dey 2004)* Intervention (aimed at general practitioners): guidelines discussion (educational component), patient information leaflets, access to fast‐track physiotherapy and triage services for patients with persistent symptoms (organisational component) versus usual care (control)* | X‐ray referrals | 15.1% (43/284) | 13.7% (42/308) | ‐1.4% (P=0.62) | ‐10% | 1.1 | |||
| Sickness certificates | 17.9 % (34/190) | 19.2% (40/206) | 1.3% (P=0.74) | 7% | 0.9 | ||||
| Prescriptions for opioids or muscle relaxants | 18.6% (84/452) | 18.7% (92/491) | 0.1 (P=0.99) | 1 | 1 | ||||
| Referrals to secondary care | 3.4% (33/962) | 2.3% (24/1044) | ‐1.1% (P=0.12) | ‐49% | 1.5 | ||||
| Referrals to physiotherapy or educational programme | ‐ | ‐ | 26.3% (44/167) | 13.8% (25/181) | ‐ | ‐12.6% (P=0.01) | ‐91% | 1.9 | |
| (Engers 2005)** Intervention (aimed at general practitioners): guidelines on low back pain, 2‐hour workshop, 2 scientific articles, guidelines on low back pain for occupational physicians, tool for patient education and management‐decision tool. Control group: usual care | Referral to a therapist | ‐ | ‐ | 22.9% (75/328) | 27.4% (79/288) | ‐ | 4.6% | 17% | 0.8 |
| Prescription of pain medication on a time‐contingent basis | ‐ | ‐ | 70% (139/328) | 69% (130/288) | ‐ | 2.8% | 6% | 0.9 | |
| Handed patient information leaflet | ‐ | ‐ | 36.9% (121/328) | 38.2% (110/288) | ‐ | ‐1.3% | ‐3% | 1 | |
| Advised patient to stay active | ‐ | ‐ | 95.1% (312/328) | 89.2% (257/288) | ‐ | 5.9% | 7% | 1.1 | |
| Advised patient to gradually increase activity | ‐ | ‐ | 78% (256/328) | 65.3% (188/288) | ‐ | 12.8% | 20% | 1.2 | |
| Advised patient which activities to increase at what moment | ‐ | ‐ | 18% (58/328) | 9% (26/288) | ‐ | 8.7% | 96% | 2 | |
| (French 2013)*** Intervention (aimed at general practitioners): Interactive, educational workshops plus educational material disseminated (via DVDs); Control group: usual care** | Number of x‐ray requests out of total number of patients seen | ‐ | ‐ | 0.83% (67/8,085) | 1.02% (80/7,826) | 0.2% (P=0.2) | 19% | 0.8 | |
| Number of CT requests out of total number of patients seen | ‐ | ‐ | 0.61% (64/10,419) | 0.66% (66/10,085) | ‐ | 0.0% (P=0.6) | 7% | 0.9 | |
| Intervention (aimed at physicians): notification that patient was at a high risk of disability and guidelines on management. Control group: usual care | 3‐month work absence rates | ‐ | ‐ | 28.6% (8/28) | 24% (6/25) | ‐ | ‐4.6% (NS) | ‐19% | 1.2 |
| Intervention (aimed at physicians): guideline on low back pain, 90‐minute educational session on guideline implementation delivered by local opinion leaders and audit report summarising performance against the guideline plus outreach visit. Control group: usual care plus/minus patient education (pamphlet and video) | Lumbosacral X‐ray total utilisation (% of patients based on episode of care) | 31% | 21% | 19% | 18% | 9% | ‐1% | ‐6% | 1.1 |
| Lumbosacral X‐ray not consistent with guideline | 14.5% | 8.2% | 8.1% | 8.6% | 6.8% | 0.5% | 6% | 0.9 | |
| Lumbosacral CT/MRI total utilisation (% of patients based on episode of care) | 7.6% | 5.6% | 5.6% | 7.1% | 3.5% | 1.5% | 21% | 0.8 | |
| Lumbosacral CT/MRI not consistent with guideline | 5.7% | 3.5% | 3.5% | 5.4% | 4.1% | 1.9% | 35% | 0.6 | |
| Physical therapy referral total utilisation (% of patients based on episode of care) | 12% | 13% | 10% | 13% | 2% | 3% | 23% | 0.8 | |
| Physical therapy referral not consistent with guideline | 10% | 10.9% | 9.2% | 12% | 1.9% | 2.8% | 23% | 0.8 | |
| Specialty referral total utilisation (% of patients based on episode of care) | 12% | 5.9% | 8.6% | 7.1% | 4.6% | ‐1.5% | ‐21% | 1.2 | |
| Specialty referral not consistent with guideline | 9.5% | 4% | 7.1% | 5.6% | 4% | ‐1.5% | ‐27% | 1.3 | |
| 1. Intervention group pre‐intervention proportion 2. Control group pre‐intervention proportion 3. Intervention group post‐intervention proportion 4. Control group post‐intervention proportion 5. ARD = [Int post (%) minus C post (%)] minus [Int pre (%) minus C pre (%)]. The direction of effect has been adjusted so that a positive result represents a beneficial intervention outcome, according to Grimshaw 2004. 6. Risk Difference (RD) is the absolute % change post‐intervention = Int post (%) minus C post (%). This is considered to be "small" if ≤ 5%, "modest" if > 5% and ≤10%,"moderate" if > 10% but ≤ 20%, and "large" if > 20%.The direction of effect has been adjusted so that a positive result represents a beneficial intervention outcome, according to Grimshaw 2004. 7. Relative % change post = absolute % change post divided by C post (%). The direction of effect has been adjusted so that a positive result represents a beneficial intervention outcome, according to Grimshaw 2004. 8. Risk ratio (RR) = Int post (%) divided by C post (%) C: control group; Int: intervention group; ARD: adjusted risk difference; NS: not significant CT/MRI: computed tomography/magnetic resonance imaging * Dey 2004 reported the Intercluster Correlation (ICC) for the results (mean cluster size=95.1) and this was used to calculate the above effective sample sizes according to chapter 16.3.4 of the Cochrane Handbook, Higgins 2011a. ** The data reported above for the study by Engers 2005 does not account for clustering. We did not have access to sufficient information to adjust the data for clustering. ***French 2013 reported Intercluster Correlation (ICC for x‐rays 0.004 and for CTs 0.003, mean cluster size=2,154) and this was used to calculate the above effective sample sizes according to chapter 16.3.4 of the Cochrane Handbook, Higgins 2011a | |||||||||
| (Study) Intervention 1 versus intervention 2 | Outcome | Int 1 pre (%) 1 | Int 2 pre (%)2 | Int 1 post (%)3 | Int 2 post (%)4 | ARD 5 | Risk difference 6 (P value if reported by authors) | Relative % change post 7 | Risk ratio 8 |
| Physician education (guidelines) and 3 patient‐specific reminder letters versus physician education, reminders and also patient education and 3 reminders | Education and reassurance according to guideline 0 ‐ 4 weeks post‐onset | ‐ | ‐ | 10% (16/162) | 6% (9/151) | ‐ | 3.9% (NS) | 66% | 1.7 |
| Exercise according to guideline 0 ‐ 4 weeks post‐onset | ‐ | ‐ | 38% (62/162) | 53% (80/151) | ‐ | ‐14.7% (P=0.0083) | ‐28% | 0.7 | |
| Appropriate medication according to guideline 0 ‐ 4 weeks post‐onset | ‐ | ‐ | 85% (138/162) | 81% (122/151) | ‐ | 4.4% (NS) | 5% | 1.1 | |
| Spinal manipulation according to guideline 0 ‐ 4 weeks post‐onset | ‐ | ‐ | 2.5% (4/162) | 5% (13/151) | ‐ | ‐6.1% (P=0.018) | ‐71% | 0.3 | |
| Guideline‐discordant physician‐recommended treatment 0 ‐ 4 weeks post‐onset | ‐ | ‐ | 10% (16/162) | 18% (27/151) | ‐ | 8% (P=0.04) | 45% | 0.6 | |
| Supervised exercise programme (recommended treatment 5 ‐ 12 weeks post‐onset) | ‐ | ‐ | 19% (29/154) | 18% (26/145) | ‐ | 0.9% (NS) | 5% | 1.1 | |
| Return to work (recommended treatment 5 ‐ 12 weeks post‐onset) | ‐ | ‐ | 24% (37/154) | 23% (33/145) | ‐ | 1.3% (NS) | 6% | 1.1 | |
| Refer to interdisciplinary programme (recommended treatment 5 ‐ 12 weeks post‐onset) | ‐ | ‐ | 4% (6/154) | 0 | ‐ | 3.9% (P=0.02) | ‐ | ‐ | |
| Physiotherapy > 4 weeks (guideline‐discordant) | ‐ | ‐ | 41% (63/154) | 42% (61/145) | ‐ | 1.2% (NS) | 3% | 1 | |
| Continued use of spinal manipulation therapy (guideline‐discordant) | ‐ | ‐ | ‐ (no data available) | 3% (4/145) | ‐ | ‐ | ‐ | ‐ | |
| (Eccles 2001)* Feedback on number of spinal radiographs 6 months before and 6 months after the intervention plus guideline dissemination versus guideline dissemination | Lumbar spine radiographs concordant with guidelines | ‐ | ‐ | 35.4% (64/181) | 43.6% (120/275) | ‐ | ‐8.3% | ‐19% | 0.8 |
| (Eccles 2001)* Reminder messages on radiograph reports plus guideline dissemination versus guideline dissemination | Lumbar spine radiographs concordant with guidelines | ‐ | ‐ | 41.2% (35/85) | 43.6% (120/275) | ‐ | ‐2.5% | ‐6% | 0.9 |
| (Eccles 2001)* Feedback on number of spinal radiographs 6 months before and 6 months after the intervention plus guideline dissemination plus reminder messages on radiograph reports versus guideline dissemination | Lumbar spine radiographs concordant with guidelines | ‐ | ‐ | 36% (89/247) | 43.6% (120/275) | ‐ | ‐7.6% | ‐17% | 0.8 |
| (Eccles 2001)* Feedback on number of spinal radiographs 6 months before and 6 months after the intervention plus guideline dissemination versus reminder messages on radiograph reports plus guideline dissemination | Lumbar spine radiographs concordant with guidelines | ‐ | ‐ | 35.4% (64/181) | 41.2% (35/85) | ‐ | ‐5.8% | ‐14% | 0.9 |
| 1. Intervention 1 group pre‐intervention proportion 2. Intervention 2 group pre‐intervention proportion 3. Intervention 1 group post‐intervention proportion 4. Intervention 2 group post‐intervention proportion 5. ARD = [Int 1 post (%) minus Int 2 post (%)] minus [Int 1 pre (%) minus Int 2 pre (%)]. The direction of effect has been adjusted so that a positive result represents a beneficial intervention 1 outcome, according to Grimshaw 2004. 6. Risk Difference (RD) is the absolute % change post‐intervention = Int 1 post (%) minus Int 2 post (%). This is considered to be "small" if ≤ 5%, "modest" if > 5% and ≤10%,"moderate" if > 10% but ≤ 20%, and "large" if > 20%.The direction of effect has been adjusted so that a positive result represents a beneficial intervention 1 outcome. 7. Relative % change post = absolute % change post divided by Int 2 post (%). The direction of effect has been adjusted so that a positive result represents a beneficial intervention 1 outcome, according to Grimshaw 2004. 8. Risk ratio (RR) = Int 1 post (%) divided by Int 2 post (%) Int 1: intervention 1 group; Int 2: Intervention 2 group; ARD: Adjusted risk difference; NS: not significant *The data reported above for the study by Eccles 2001 does not account for clustering. We did not have access to sufficient information to adjust the data for clustering. | |||||||||
| (Study) Intervention 1 versus Intervention 2 | Outcome | Int 1 pre mean (SD)1 | Int 2 pre mean (SD)2 | Int 1 post mean (SD)3 | Int 2 post mean (SD)4 | MD 5 | Relative % change 6 | Adjusted relative % change7 | SMD8 (P value)9 |
| (Becker 2008*) Physician education: Guideline (in 4 versions including patient leaflet), 3 seminars and academic detailing versus guideline dissemination | Functional capacity measured by Hannover Functional Ability Questionnaire at 6 months | ‐ | ‐ | 72.9 | 70.3 | 2.7 | 4% | ‐ | 0.1 (P=0.12) |
| (Becker 2008*) Physician education (as above) plus practice nurse training in motivational counselling versus guideline dissemination | Functional capacity measured by Hannover Functional Ability Questionnaire at 6 months | ‐ | ‐ | 73.9 | 70.3 | 3.6 | 5% | ‐ | 0.2 (P=0.032) |
| (Becker 2008*) Physician education: Guideline (in 4 versions including patient leaflet), 3 seminars and academic detailing versus guideline dissemination | Days in pain at 6 months | ‐ | ‐ | 63.3 | 80.8 | 17.4 | 22% | ‐ | 0.2 (P=0.002) |
| (Becker 2008*) Physician education (as above) plus practice nurse training in motivational counselling versus guideline dissemination | Days in pain at 6 months | ‐ | ‐ | 62.9 | 80.8 | 17.9 | 22% | ‐ | 0.2 (P=0.001) |
| (Becker 2008*) Physician education: Guideline (in 4 versions including patient leaflet), 3 seminars and academic detailing versus guideline dissemination | Overall activity at 6 months | ‐ | ‐ | 36.5 | 33.5 | 3 | 9% | ‐ | 0.1 (P=0.203) |
| (Becker 2008*) Physician education (as above) plus practice nurse training in motivational counselling versus guideline dissemination | Overall activity at 6 months | ‐ | ‐ | 36.3 | 33.5 | 2.8 | 8% | ‐ | 0.1 (P=0.230) |
| (Becker 2008*) Physician education: Guideline (in 4 versions including patient leaflet), 3 seminars and academic detailing versus guideline dissemination | Days of sick leave at 6 months | ‐ | ‐ | 13 | 14.3 | 1.3 | 9% | ‐ | 0 (P=0.569) |
| (Becker 2008*) Physician education (as above) plus practice nurse training in motivational counselling versus guideline dissemination | Days of sick leave at 6 months | ‐ | ‐ | 13 | 14.3 | 1.3 | 9% | ‐ | 0 (P=0.584) |
| (Becker 2008*) Physician education: Guideline (in 4 versions including patient leaflet), 3 seminars and academic detailing versus guideline dissemination | Quality of life at 6 months | ‐ | ‐ | 66.6 | 66.8 | ‐0.3 | 0% | ‐ | 0 (P=0.847) |
| (Becker 2008*) Physician education (as above) plus practice nurse training in motivational counselling versus guideline dissemination | Quality of life at 6 months | ‐ | ‐ | 67.5 | 66.8 | 0.7 | 1% | ‐‐ | 0 (P=0.602) |
| (Becker 2008*) Physician education: Guideline (in 4 versions including patient leaflet), 3 seminars and academic detailing versus guideline dissemination | Functional capacity measured by Hannover Functional Ability Questionnaire at 12 months | ‐ | ‐ | 73 | 71.6 | 1.4 | 2% | ‐ | 0.1 (P=0.446) |
| (Becker 2008*) Physician education (as above) plus practice nurse training in motivational counselling versus guideline dissemination | Functional capacity measured by Hannover Functional Ability Questionnaire at 12 months | ‐ | ‐ | 74.6 | 71.6 | 3.1 | 4% | ‐ | 0.1 (P=0.088) |
| (Becker 2008*) Physician education: Guideline (in 4 versions including patient leaflet), 3 seminars and academic detailing versus guideline dissemination | Days in pain at 12 months | ‐ | ‐ | 58.5 | 71.3 | 12.8 | 18% | ‐ | 0.2 (P=0.018) |
| (Becker 2008*) Physician education (as above) plus practice nurse training in motivational counselling versus guideline dissemination | Days in pain at 12 months | ‐ | ‐ | 61.6 | 71.3 | 9.8 | 14% | ‐ | 0.1 (P=0.067) |
| (Becker 2008*) Physician education: Guideline (in 4 versions including patient leaflet), 3 seminars and academic detailing versus guideline dissemination | Overall activity at 12 months | ‐ | ‐ | 46.4 | 42.9 | 3.5 | 8% | ‐ | 0.1 (P=0.202) |
| (Becker 2008*) Physician education (as above) plus practice nurse training in motivational counselling versus guideline dissemination | Overall activity at 12 months | ‐ | ‐ | 45.4 | 42.9 | 2.5 | 6% | ‐ | 0.1 (P=0.396) |
| (Becker 2008*) Physician education: Guideline (in 4 versions including patient leaflet), 3 seminars and academic detailing versus guideline dissemination | Days of sick leave at 12 months | ‐ | ‐ | 6.2 | 9.3 | 3.1 | 34% | ‐ | 0.1 (P=0.256) |
| (Becker 2008*) Physician education (as above) plus practice nurse training in motivational counselling versus guideline dissemination | Days of sick leave at 12 months | ‐ | ‐ | 6.5 | 9.3 | 2.8 | 30% | ‐ | 0.1 (P=0.320) |
| (Becker 2008*) Physician education: Guideline (in 4 versions including patient leaflet), 3 seminars and academic detailing versus guideline dissemination | Quality of life at 12 months | ‐ | ‐ | 68.5 | 67.7 | 0.8 | 1% | ‐ | 0 (P=0.535) |
| (Becker 2008*) Physician education (as above) plus practice nurse training in motivational counselling versus guideline dissemination | Quality of life at 12 months | ‐ | ‐ | 70.4 | 67.7 | 2.7 | 4% | ‐ | 0.1 (P=0.036) |
| (Becker 2008*) Physician education: Guideline (in 4 versions including patient leaflet), 3 seminars and academic detailing vs physician education plus practice nurse training in motivational counselling | Functional capacity measured by Hannover Functional Ability Questionnaire at 6 months | ‐ | ‐ | 72.9 | 73.9 | ‐1 | ‐1% | ‐ | 0 (NR) |
| (Becker 2008*) Physician education: Guideline (in 4 versions including patient leaflet), 3 seminars and academic detailing vs physician education plus practice nurse training in motivational counselling | Days in pain at 6 months | ‐ | ‐ | 63.3 | 62.9 | ‐0.4 | ‐1% | ‐ | 0 (NR) |
| (Becker 2008*) Physician education: Guideline (in 4 versions including patient leaflet), 3 seminars and academic detailing vs physician education plus practice nurse training in motivational counselling | Overall activity at 6 months | ‐ | ‐ | 36.5 | 36.3 | 0.2 | 0% | ‐ | 0 (NR) |
| (Becker 2008*) Physician education: Guideline (in 4 versions including patient leaflet), 3 seminars and academic detailing vs Physician education plus practice nurse training in motivational counselling | Days of sick leave at 6 months | ‐ | ‐ | 13 | 13.1 | 0.1 | 0% | ‐ | 0 (NR) |
| (Becker 2008*) Physician education: Guideline (in 4 versions including patient leaflet), 3 seminars and academic detailing vs Physician education plus practice nurse training in motivational counselling | Quality of life at 6 months | ‐ | ‐ | 66.6 | 67.5 | ‐0.9 | ‐1% | ‐ | 0 (NR) |
| (Becker 2008*) Physician education: Guideline (in 4 versions including patient leaflet), 3 seminars and academic detailing vs Physician education plus practice nurse training in motivational counselling | Functional capacity measured by Hannover Functional Ability Questionnaire at 12 months | ‐ | ‐ | 73 | 74.6 | ‐1.7 | ‐2% | ‐ | ‐0.1 (NR) |
| (Becker 2008*) Physician education: Guideline (in 4 versions including patient leaflet), 3 seminars and academic detailing vs Physician education plus practice nurse training in motivational counselling | Days in pain at 12 months | ‐ | ‐ | 58.5 | 61.6 | 3.1 | 5% | ‐ | 0 (NR) |
| (Becker 2008*) Physician education: Guideline (in 4 versions including patient leaflet), 3 seminars and academic detailing vs Physician education plus practice nurse training in motivational counselling | Overall activity at 12 months | ‐ | ‐ | 46.4 | 45.4 | 1 | 2% | ‐ | 0 (NR) |
| (Becker 2008*) Physician education: Guideline (in 4 versions including patient leaflet), 3 seminars and academic detailing vs Physician education plus practice nurse training in motivational counselling | Days of sick leave at 12 months | ‐ | ‐ | 6.2 | 6.458 | 0.3 | 5% | ‐ | 0 (NR) |
| (Becker 2008*) Physician education: Guideline (in 4 versions including patient leaflet), 3 seminars and academic detailing vs Physician education plus practice nurse training in motivational counselling | Quality of life at 12 months | ‐ | ‐ | 68.5 | 70.4 | ‐1.9 | ‐3% | ‐ | ‐0.1 (NR) |
| (Eccles 2001)* Feedback on number of spinal radiographs 6 months before and 6 months after the intervention plus guideline dissemination versus guideline dissemination | Number of lumbar spine radiographs per 1000 patients | 7.24 (4.8) | 7.53 (4.1) | 5.97 (4.2) | 6.80 (4.3) | 0.83 | 12% | 8% | 0.2 (NR) |
| (Eccles 2001)* Reminder messages on radiograph reports plus guideline dissemination versus guideline dissemination | Number of lumbar spine radiographs per 1000 patients | 7.31 (5.2) | 7.53 (4.1) | 5.14 (3.7) | 6.80 (4.3) | 1.66 | 24% | 21% | 0.4 (P=0.05) |
| (Eccles 2001)* Feedback on number of spinal radiographs 6 months before and 6 months after the intervention plus guideline dissemination plus reminder messages on radiograph reports versus guideline dissemination | Number of lumbar spine radiographs per 1000 patients | 8.30 (5.1) | 7.53 (4.1) | 5.23 (3.7) | 6.80 (4.3) | 1.57 | 23% | 34% | 0.4 (NR) |
| (Eccles 2001)* Feedback on number of spinal radiographs 6 months before and 6 months after the intervention plus guideline dissemination versus reminder messages on radiograph reports plus guideline dissemination | Number of lumbar spine radiographs per 1000 patients | 7.24 (4.8) | 7.31 (5.2) | 5.97 (4.2) | 5.14 (3.7) | ‐0.83 | ‐16% | ‐18% | ‐0.2 (NR) |
| 1. Intervention 1 group pre‐intervention mean (standard deviation) 2. Intervention 2 group pre‐intervention mean (standard deviation) 3. Intervention 1 group post‐intervention mean (standard deviation) 4. Intervention 2 group postintervention mean (standard deviation) 5. Mean Difference (MD)=Difference between post‐intervention means. The direction of effect has been adjusted so that a positive result represents a beneficial intervention 1 outcome, according to Grimshaw 2004. 6. Relative percentage change post‐intervention = (Int1 post mean ‐ Int2 post mean)/Int2 post mean. The direction of effect has been adjusted so that a positive result represents a beneficial intervention 1 outcome, according to Grimshaw 2004. 7. Adjusted relative percentage change= (Int1 post mean‐Int2 post mean)‐(Int1 pre mean ‐ Int2 pre mean)/Int2 post mean. The direction of effect has been adjusted so that a positive result represents a beneficial intervention 1 outcome. 8. SMD=Standardised Mean Difference=(Int1 post mean‐Int2 post mean)/SD pooled. The direction of effect has been adjusted so that a positive result represents a beneficial intervention 1 outcome, according to Grimshaw 2004. 9. P value reported by study authors Int 1: intervention 1 group; Int 2: Intervention 2 group; NR: not reported; SD: standard deviation *The data reported above for Becker 2008 and Eccles 2001 was adjusted for clustering by the authors | |||||||||
| Study | Intervention | Outcome | Mean pre (SD) | Mean post (SD) | Mean post minus mean pre | Relative % change pre to post | SMD pre to post | Mean change in level (p value) | Mean change in slope (p value) |
| Educational material | Back x‐rays ordered | 1133 (50) | 1208.7 (111.5) | ‐75.7 | ‐6.7 | ‐1.51 | ‐121.5 (P = 0.167) | 6.8 (P = 0.776) |
| (Study) Intervention | Outcome | Int pre mean (SD)1 | C pre mean (SD)2 | Int post mean (SD)3 | C post mean (SD)4 | MD 5 | Relative % change 6 | Adjusted relative % change7 | SMD8 (P value)9 |
| GP training on relationships and communication, pain evaluation, prescription and negotiation of a patient contract delivered in a 4‐hour interactive session plus 8 reminders on recommendations | Pain relief (SPID) | ‐ | ‐ | 315.6 (289.5) | 264.7 (242.9) | 50.9 | 19% | 19% | 0.2 (P< 0.0001) |
| Intensity of pain in motion on VAS | 63.7 (13.8) | 62.8 (13.5) | ‐29 (23.1) | ‐24.8 (21.1) | 4.2 | 17% | ‐21% | 0.2 (P=0.01) | |
| Lequesne Index | 9.2 (2.9) | 9.8 (3.2) | ‐2.5 (2.5) | ‐2.0 (2.4) | 0.5 | 25% | 5% | 0.2 (P< 0.0001) | |
| WOMAC index pain | 9.3 (3.0) | 9.6 (2.8) | ‐2.9 (3.4) | ‐2.2 (2.9) | 0.7 | 32% | ‐18% | 0.2 (P< 0.0001) | |
| WOMAC index stiffness | 4.1 (1.4) | 4.0 (1.4) | ‐1.2 (1.6) | ‐0.8 (1.4) | 0.4 | 50% | ‐62% | 0.3 (P=0.0004) | |
| WOMAC index physical function | 31.2 (10.9) | 32.8 (9.5) | ‐8.7 (10.7) | ‐6.1 (8.8) | 2.6 | 43% | ‐16% | 0.3 (P< 0.0001) | |
| WOMAC index global score | 44.6 (14.4) | 46.4 (12.5) | ‐12.9 (14.8) | ‐9.2 (12.2) | 3.7 | 40% | ‐21% | 0.3 (P< 0.0001) | |
| Acetaminophen consumption | ‐ | ‐ | 3400 (800) | 2900 (900) | ‐500 | ‐17% | ‐17% | ‐0.6 (P< 0.0001) | |
| Intervention (aimed at GPs): 2 interactive 8‐hour meetings focusing on arthritis self management, guideline dissemination and patient information material versus control (usual care) | Quality of life (AIMS2‐SF scores) Lower body | 2.67 (1.88) | 2.65 (1.85) | 2.48 | 2.62 | ‐0.14 | ‐5% | ‐6% | ‐0.1 (P=0.349) |
| Quality of life (AIMS2‐SF scores) Upper body | 1.47 (2.25) | 1.33 (2.09) | 1.43 | 1.34 | 0.09 | 7% | ‐4% | 0.1 P=0.694) | |
| Quality of life (AIMS2‐SF scores) Symptom | 4.87 (2.13) | 4.81 (2.18) | 4.51 | 4.72 | ‐0.21 | ‐4% | ‐6% | ‐0.2 (P=0.119) | |
| Quality of life (AIMS2‐SF scores) Affect | 2.89 (1.35) | 2.88 (1.33) | 2.92 | 2.83 | 0.09 | 3% | 3% | 0.1 (P=0.610) | |
| Quality of life (AIMS2‐SF scores) Social | 4.52 (1.88) | 4.69 (1.80) | 4.43 | 4.62 | ‐0.19 | ‐4% | 0% | ‐0.3 P=0.776 | |
| GP contacts | 4.56 (6.13) | 4.82 (6.00) | 4.44 | 4.6 | 0.16 | 3% | ‐2% | 0.1 (P=0.339) | |
| Referrals to orthopaedics | 1.58 (3.43) | 1.76 (3.52) | 1.49 | 1.75 | 0.26 | 15% | 5% | 0.8 (P=0.153) | |
| Radiographs | 0.82 (3.12) | 0.79 (2.78) | 0.75 | 0.85 | 0.1 | 12% | 15% | 0.2 (P=0.05) | |
| Non‐medical practitioners | 0.11 (3.01) | 0.36 (3.28) | 0.09 | 0.32 | 0.23 | 72% | ‐6% | 0.6 (P=0.687) | |
| Physiotherapy | 4.70 (9.10) | 5.81 (11.10) | 4.63 | 5.77 | 1.14 | 20% | 1% | 2 (P=0.242) | |
| Acupuncture | 0.83 (3.45) | 0.97 (3.80) | 0.8 | 0.97 | 0.17 | 18% | 3% | 0.2 (P=0.821) | |
| Intervention (aimed at GPs) as above plus patient case management via telephone by practice nurses versus control (usual care) | Quality of life (AIMS2‐SF scores) Lower body | 3.01 (2.11) | 2.65 (1.85) | 2.61 | 2.62 | ‐0.01 | 0% | ‐14% | 0 (P=0.049) |
| Quality of life (AIMS2‐SF scores) Upper body | 1.68 (2.44) | 1.33 (2.09) | 1.62 | 1.34 | 0.28 | 21% | ‐5% | 0.2 (P=0.621) | |
| Quality of life (AIMS2‐SF scores) Symptom | 5.02 (2.29) | 4.81 (2.18) | 4.42 | 4.72 | ‐0.3 | ‐6% | ‐11% | ‐0.2 (P=0.048) | |
| Quality of life (AIMS2‐SF scores) Affect | 3.04 (1.39) | 2.88 (1.33) | 2.98 | 2.83 | 0.15 | 5% | 0% | 0.2 (P=0.691) | |
| Quality of life (AIMS2‐SF scores) Social | 4.79 (1.80) | 4.69 (1.80) | 4.736 | 4.62 | 0.116 | 3% | 0% | 0.1 (P< 0.001) | |
| GP contacts | 5.01 (5.78) | 4.82 (6.00) | 4.9 | 4.6 | ‐0.3 | ‐7% | ‐2% | ‐0.2 (P=0.823) | |
| Referrals to orthopaedics | 1.76 (3.52) | 1.76 (3.52) | 1.52 | 1.75 | 0.23 | 13% | 13% | 0.2 (P=0.044) | |
| Radiographs | 0.80 (3.01) | 0.79 (2.78) | 0.71 | 0.85 | 0.14 | 16% | 18% | 0.4 (P=0.031) | |
| Non‐medical practitioners | 0.50 (4.20) | 0.36 (3.28) | 0.47 | 0.32 | ‐0.15 | ‐47% | ‐3% | ‐0.4 (P=0.225) | |
| Physiotherapy | 5.22 (10.03) | 5.81 (11.10) | 5.08 | 5.77 | 0.69 | 12% | 2% | 1.3 (P=0.129) | |
| Acupuncture | 0.77 (3.99) | 0.97 (3.80) | 0.72 | 1.09 | 0.37 | 34% | 16% | 0.4 (P=0.769) | |
| (Stross 1985)** Intervention: Educationally‐influential physicians (EIs) led education of primary‐care physicians: self‐study programme including textbook, audiovisual materials and recent articles on osteoarthritis versus control (usual care) | Length of stay for OA patients | 8.8 | 8.4 | 8.4 | 8.6 | 0.2 | 2% | 7% | NR |
| Length of stay for total hip arthroplasty (THA) patients | 17.2 | 16.6 | 15.2 | 16.0 | 0.8 | 5% | 9% | NR | |
| 1. Intervention group pre‐intervention mean (standard deviation) 2. Control group pre‐intervention mean (standard deviation) 3. Intervention group post‐intervention mean (standard deviation) 4. Control group pos‐tintervention mean (standard deviation) 5. Mean Difference (MD)=Difference between post‐intervention means. The direction of effect has been adjusted so that a positive result represents a beneficial intervention outcome, according to Grimshaw 2004. 6. Relative percentage change post‐intervention = (Int post mean ‐ Control post mean)/Control post mean 7. Adjusted relative percentage change= (Int post mean‐Control post mean)‐(Int pre mean ‐ Control pre mean)/Control post mean. The direction of effect has been adjusted so that a positive result represents a beneficial intervention outcome. 8. SMD=Standardised Mean Difference=(Int post mean‐Control post mean)/SD pooled. The direction of effect has been adjusted so that a positive result represents a beneficial intervention outcome, according to Grimshaw 2004. 9. P value reported by study authors AIMS2‐SF: Arthritis Impact Measurement Scales Short Form * There are potential unit of analysis errors in the reported results as the study did not account for clustering and did not provide sufficient data to allow an approximate analysis according to chapter 16.3.4 of the Cochrane Handbook, Higgins 2011a. **The study did not report standard deviations and therefore we were unable to calculate the SMD. There are potential unit of analysis errors in the reported results as the study did not account for clustering and did not provide sufficient data to allow an approximate analysis according to chapter 16.3.4 of the Cochrane Handbook, Higgins 2011a. | |||||||||
| (Study) Intervention | Outcome | Int pre (%) 1 | C pre (%)2 | Int post (%)3 | C post (%)4 | ARD 5 | Risk difference 6 (P Value if reported by authors) | Relative % change post 7 | Risk ratio 8 |
| (Rahme 2005)* Intervention (aimed at GPs): 90‐minute workshop on management of osteoarthritis versus control group (usual care) | Number of adequate prescription, according to the guidelines | 51% (273/536) | 47% (675/1437) | 56% (251/450) | 49% (593/1209) | 3% | 7% | 14% | 1.1 |
| (Rahme 2005)* Intervention (aimed at GPs): decision tree on treatment choices for osteoarthritis patients versus control (usual care) | Number of adequate prescription, according to the guidelines | 51% (799/1569) | 47% (675/1437) | 54% (712/1317) | 49% (593/1209) | 1% | 5% | 10% | 1.1 |
| (Rahme 2005)* Intervention (aimed at GPs): 90‐minute workshop and decision tree as above versus control (usual care) | Number of adequate prescription, according to the guidelines | 58% (1022/1776) | 47% (675/1437) | 62% (1008/1634) | 49% (593/1209) | 2% | 13% | 26% | 1.3 |
| Intervention (aimed at GPs): 2 interactive 8‐hour meetings focusing on arthritis self management, guideline dissemination and patient information material versus control (usual care) | Paracetamol prescriptions | 8.9% (31/345) | 6.6% (22/332) | 16.4% | 5.3% | 8.7% | 11.1% (<0.001) | 209% | 3.1 |
| Opioids | 5.8% (20/345) | 6.9% (23/332) | 10.1% | 7.9% | 3.4% | 2.2% (NS) | 28% | 1.3 | |
| NSAID | 40% (138/345) | 41.9% (139/332) | 44.3% | 44.2% | 2.0% | 0.1% (NS) | 23% | 1.0 | |
| Homeopathics | 6.1% (21/345) | 8.1% (27/332) | 7.7% | 9.8% | ‐0.1% | ‐2.2% (NS) | ‐22% | 0.8 | |
| Intervention (aimed at GPs) as above plus patient case management via telephone by practice nurses versus control (usual care) | Paracetamol prescriptions | 7.3% (25/345) | 6.6% (22/332) | 14.1% | 5.3% | 8.2% | 8.8% (<0.01) | 166% | 2.7 |
| Opioids | 7.3% (25/345) | 6.9% (23/332) | 16.0% | 7.9% | 7.8% | 8.1% (< 0.01) | 102% | 2.0 | |
| NSAID | 43.3% (149/345) | 41.9% (139/332) | 49.7% | 44.2% | 4.3% | 5.6% (0.019) | 13% | 1.1 | |
| Homeopathics | 6.7% (23/345) | 8.1% (27/332) | 9.6% | 9.8% | 1.2% | ‐0.2% (NS) | ‐2% | 1.0 | |
| (Stross 1985)* Intervention: Educationally‐influential physicians (EIs) led education of primary‐care physicians: self‐study programme including textbook, audiovisual materials and recent articles on osteoarthritis versus control (usual care) | Management of OA patients with aspirin | 39% (9/23) | 50% (9/18) | 20% (6/30) | 28% (5/18) | 3% | ‐8% | ‐28% | 0.7 |
| Management of OA patients with NSAIDs | 83% (19/23) | 78% (14/18) | 87% (26/30) | 94% (17/18) | ‐13% | ‐8% | ‐8% | 0.9 | |
| Management of OA patients with systemic corticosteroids | 13% (3/23) | 17% (3/18) | 3% (1/30) | 22% (4/18) | 15% | 19% (< 0.05) | 85% | 0.2 | |
| Management of OA patients with intra‐articular corticosteroids | 17% (4/23) | 11% (2/18) | 40% (12/30) | 11% (2/18) | 23% | 29% (<0.05) | 260% | 3.6 | |
| Management of OA patients with physical therapy | 87% (20/23) | 83% (15/18) | 93% (28/30) | 83% (15/18) | 6% | 10% | 12% | 1.1 | |
| Referral of OA patients | 39% (9/23) | 39% (7/18) | 30% (9/30) | 33% (6/18) | ‐4% | 3% | 10% | 0.9 | |
| Pre‐op physical therapy of THA patients | 56% (10/18) | 46% (12/26) | 97% (35/36) | 40% (12/30) | 48% | 57% (< 0.05) | 143% | 2.4 | |
| Post‐op narcotics of THA patients | 72% (13/18) | 77% (20/26) | 89% (32/36) | 93% (28/30) | 0% | 4% | 5% | 1.0 | |
| Post‐op physical therapy of THA patients | 100% (18/18) | 100% (26/26) | 100% (36/36) | 100% (30/30) | 0% | 0% | 0% | 1.0 | |
| Post‐op complications of THA patients | 11% (2/18) | 15% (4/26) | 6% (2/36) | 13% (4/30) | 4% | 8% | 58% | 0.4 | |
| 1. Intervention group pre‐intervention proportion 2. Control group pre‐intervention proportion 3. Intervention group post‐intervention proportion 4. Control group post‐intervention proportion 5. ARD = [Int post (%) minus C post (%)] minus [Int pre (%) minus C pre (%)]. The direction of effect has been adjusted so that a positive result represents a beneficial intervention outcome, according to Grimshaw 2004. 6. Risk Difference (RD) is the absolute % change post‐intervention = Int post (%) minus C post (%). This is considered to be "small" if ≤ 5%, "modest" if > 5% and ≤10%,"moderate" if > 10% but ≤ 20%, and "large" if > 20%.The direction of effect has been adjusted so that a positive result represents a beneficial intervention outcome, according to Grimshaw 2004. 7. Relative % change post = absolute % change post divided by C post (%). The direction of effect has been adjusted so that a positive result represents a beneficial intervention outcome, according to Grimshaw 2004. 8. Risk ratio (RR) = Int post (%) divided by C post (%) C: control group; Int: intervention group; ARD: Adjusted risk difference; NS: not significant NSAID: non‐steroidal anti‐inflammatory drug, THA: total hip arthroplasty * There are unit of analysis errors in the reported results because the available data did not account for the effect of clustering. | |||||||||
| (Study) Intervention 1 versus intervention 2 | Outcome | Int 1 pre (%) 1 | Int 2 pre (%)2 | Int 1 post (%)3 | Int 2 post (%)4 | ARD 5 | Risk difference 6 (P value if reported by authors) | Relative % change post 7 | Risk ratio 8 |
| (Rahme 2005)* Intervention 1 (aimed at GPs): 90‐minute workshop on management of osteoarthritis versus Intervention 2 (aimed at GPs): decision tree on treatment choices for osteoarthritis patients | Number of adequate prescription, according to the guidelines | 51% (273/536) | 51% (799/1569) | 56% (251/450) | 54% (712/1317) | 1.7% | 1.7% | 3% | 1 |
| (Rahme 2005)* Intervention 1 (aimed at GPs): 90‐minute workshop on management of osteoarthritis versus Intervention 2 (aimed at GPs): 90‐minute workshop and decision tree | Number of adequate prescription, according to the guidelines | 51% (273/536) | 58% (1022/1776) | 56% (251/450) | 62% (1008/1634) | 0.7% | ‐5.9% | ‐10% | 0.9 |
| (Rahme 2005)* Intervention 1 (aimed at GPs):decision tree on treatment choices for osteoarthritis patients versus Intervention 2 (aimed at GPs): 90‐minute workshop and decision tree | Number of adequate prescription, according to the guidelines | 51% (799/1569) | 58% (1022/1776) | 54% (712/1317) | 62% (1008/1634) | ‐1% | ‐7.6% | ‐12% | 0.9 |
| Intervention (aimed at GPs): 2 interactive 8‐hour meetings focusing on arthritis self management, guideline dissemination and patient information material versus Intervention (aimed at GPs) as above plus patient case management via telephone by practice nurses | Paracetamol prescriptions | 8.9% (31/345) | 7.3% (25/345) | 16.4% | 14.1% | 0.5% | 2.3% | 16% | 1.2 |
| Opioids | 5.8% (20/345) | 7.3% (25/345) | 10.1% | 16.0% | ‐4.5% | ‐5.9% | ‐37% | 1.2 | |
| NSAID | 40% (138/345) | 43.3% (149/345) | 44.3% | 49.7% | ‐2.2% | ‐5.4% | ‐11% | 1.2 | |
| Homeopathics | 6.1% (21/345) | 6.7% (23/345) | 7.7% | 9.6% | ‐1.4% | ‐1.9% | ‐20% | 1.2 | |
| 1. Intervention 1 group pre‐intervention proportion 2. Intervention 2 group pre‐intervention proportion 3. Intervention 1 group post‐intervention proportion 4. Intervention 2 group post‐intervention proportion 5. ARD = [Int 1 post (%) minus Int 2 post (%)] minus [Int 1 pre (%) minus Int 2 pre (%)]. The direction of effect has been adjusted so that a positive result represents a beneficial intervention 1 outcome, according to Grimshaw 2004. 6. Risk Difference (RD) is the absolute % change post‐intervention = Int 1 post (%) minus Int 2 post (%). This is considered to be "small" if ≤ 5%, "modest" if > 5% and ≤10%,"moderate" if > 10% but ≤ 20%, and "large" if > 20%.The direction of effect has been adjusted so that a positive result represents a beneficial intervention 1 outcome. 7. Relative % change post = absolute % change post divided by Int 2 post (%). The direction of effect has been adjusted so that a positive result represents a beneficial intervention 1 outcome, according to Grimshaw 2004. 8. Risk ratio (RR) = Int 1 post (%) divided by Int 2 post (%) Int 1: intervention 1 group; Int 2: Intervention 2 group; ARD: adjusted risk difference; NS: not significant, NSAID: non‐steroidal anti‐inflammatory drug * There are unit of analysis errors in the reported results because the available data did not account for the effect of clustering. | |||||||||
| (Study) Intervention 1 versus Intervention 2 | Outcome | Int 1 pre mean (SD)1 | Int 2 pre mean (SD)2 | Int 1 post mean (SD)3 | Int 2 post mean (SD)4 | MD 5 | Relative % change 6 | Adjusted relative % change7 | SMD8 (P value)9 |
| Intervention (aimed at GPs): 2 interactive 8‐hour meetings focusing on arthritis self management, guideline dissemination and patient information material versus Intervention (aimed at GPs) as above plus patient case management via telephone by practice nurses | Quality of life (AIMS2‐SF scores) Lower body | 2.67 (1.88) | 3.01 (2.11) | 2.48 (1.1) | 2.61 (1.4) | ‐0.13 | ‐5% | 0% | ‐0.1 |
| Quality of life (AIMS2‐SF scores) Upper body | 1.47 (2.25) | 1.68 (2.44) | 1.43 (1.5) | 1.62 (1.3) | ‐0.19 | ‐12% | ‐6% | ‐0.1 | |
| Quality of life (AIMS2‐SF scores) Symptom | 4.87 (2.13) | 5.02 (2.29) | 4.51 (1.0) | 4.42 (1.8) | 0.09 | 2% | 12% | 0.1 | |
| Quality of life (AIMS2‐SF scores) Affect | 2.89 (1.35) | 3.04 (1.39) | 2.92 (0.8) | 2.98 (0.9) | ‐0.06 | ‐2% | ‐1% | ‐0.1 | |
| Quality of life (AIMS2‐SF scores) Social | 4.52 (1.88) | 4.79 (1.80) | 4.43 (0.6) | 4.736 (1.2) | ‐0.31 | ‐6% | ‐25% | ‐0.3 | |
| GP contacts | 4.56 (6.13) | 5.01 (5.78) | 4.44 (1.7) | 4.9 (1.6) | 0.46 | 9% | 37% | 0.3 | |
| Referrals to orthopaedics | 1.58 (3.43) | 1.76 (3.52) | 1.49 (0.4) | 1.52 (1.3) | 0.03 | 2% | ‐9% | 0.0 | |
| Radiographs | 0.82 (3.12) | 0.80 (3.01) | 0.75 (0.6) | 0.71 (0.4) | ‐0.04 | ‐6% | ‐1% | ‐0.1 | |
| Non‐medical practitioners | 0.11 (3.01) | 0.50 (4.20) | 0.09 (0.4) | 0.47 (0.4) | 0.38 | 81% | ‐45% | 0.9 | |
| Physiotherapy | 4.70 (9.10) | 5.22 (10.03) | 4.63 (0.6) | 5.08 (0.6) | 0.45 | 9% | 35% | 0.7 | |
| Acupuncture | 0.83 (3.45) | 0.77 (3.99) | 0.8 (1.3) | 0.72 (1.3) | ‐0.08 | ‐11% | 0% | ‐0.1 | |
| 1. Intervention 1 group pre‐intervention mean (standard deviation) 2. Intervention 2 group pre‐intervention mean (standard deviation) 3. Intervention 1 group post‐intervention mean (standard deviation) 4. Intervention 2 group postintervention mean (standard deviation) 5. Mean Difference (MD)=Difference between post‐intervention means. The direction of effect has been adjusted so that a positive result represents a beneficial intervention 1 outcome, according to Grimshaw 2004. 6. Relative percentage change post‐intervention = (Int1 post mean ‐ Int2 post mean)/Int2 post mean. The direction of effect has been adjusted so that a positive result represents a beneficial intervention 1 outcome, according to Grimshaw 2004. 7. Adjusted relative percentage change= (Int1 post mean‐Int2 post mean)‐(Int1 pre mean ‐ Int2 pre mean)/Int2 post mean. The direction of effect has been adjusted so that a positive result represents a beneficial intervention 1 outcome. 8. SMD=Standardised Mean Difference=(Int1 post mean‐Int2 post mean)/SD pooled. The direction of effect has been adjusted so that a positive result represents a beneficial intervention 1 outcome, according to Grimshaw 2004. 9. P value reported by study authors AIMS2‐SF: Arthritis Impact Measurement Scales Short Form * There are unit of analysis errors in the reported results because the available data did not account for the effect of clustering. | |||||||||
| (Study) Intervention | Outcome | Int pre mean (SD)1 | C pre mean (SD)2 | Int post mean (SD)3 | C post mean (SD)4 | MD 5 | Relative % change 6 | Adjusted relative % change7 | SMD8 (P value)9 |
| Intervention: 60‐minute lecture on shoulder disorders, handouts, training in injection techniques versus control group (usual care) | British Shoulder Disability Questionnaire (BSDQ) | 12.22 (4.21) | 13.11 (4.43) | 8.51 (0.60) | 9.46 (0.82) | 0.95 | 10% | 1% | 0.2 (P=0.36) |
| Short form 36 item (SF‐36) Health Survey ‐ physical component score | 37.78 (8.69) | 35.96 (8.93) | 40.55 (0.60) | 40.80 (0.90) | ‐0.25 | ‐1% | ‐5% | 0.0 (P=0.82) | |
| Short form 36 item (SF‐36) Health Survey ‐ mental component score | 45.42 (13.33) | 44.64 (13.09) | 46.81 (0.93) | 45.64 (1.28) | 1.17 | 3% | 1% | 0.1 (P=0.47) | |
| 1. Intervention group pre‐intervention mean (standard deviation) 2. Control group pre‐intervention mean (standard deviation) 3. Intervention group post‐intervention mean (standard deviation) 4. Control group pos‐tintervention mean (standard deviation) 5. Mean Difference (MD)=Difference between post‐intervention means. The direction of effect has been adjusted so that a positive result represents a beneficial intervention outcome, according to Grimshaw 2004. 6. Relative percentage change post‐intervention = (Int post mean ‐ Control post mean)/Control post mean 7. Adjusted relative percentage change= (Int post mean‐Control post mean)‐(Int pre mean ‐ Control pre mean)/Control post mean. The direction of effect has been adjusted so that a positive result represents a beneficial intervention outcome. 8. SMD=Standardised Mean Difference=(Int post mean‐Control post mean)/SD pooled. The direction of effect has been adjusted so that a positive result represents a beneficial intervention outcome, according to Grimshaw 2004. 9. P value reported by study authors | |||||||||
| (Study) Intervention 1 versus Intervention 2 | Outcome | Int 1 pre mean (SD)1 | Int 2 pre mean (SD)2 | Int 1 post mean (SD)3 | Int 2 post mean (SD)4 | MD 5 | Relative % change 6 | Adjusted relative % change7 | SMD8 (P value)9 |
| (Gormley 2003*) Shoulder injection training on mannequins versus shoulder injection training on mannequins and real patients | Shoulder injections performed by general practitioner | 3.5 | 3.4 | 4.5 | 7.8 | ‐3.3 | ‐42% | ‐44% | (P=0.02) |
| Referrals to shoulder injection clinics | 2.3 | 2.0 | 1.5 | 0.6 | ‐0.9 | ‐150% | ‐100% | (P=0.36) | |
| Referrals to physiotherapy | 5.9 | 5.6 | 4.7 | 3.2 | ‐1.5 | ‐47% | ‐38% | (P=0.20) | |
| 1. Intervention 1 group pre‐intervention mean (standard deviation) 2. Intervention 2 group pre‐intervention mean (standard deviation) 3. Intervention 1 group post‐intervention mean (standard deviation) 4. Intervention 2 group postintervention mean (standard deviation) 5. Mean Difference (MD)=Difference between post‐intervention means. The direction of effect has been adjusted so that a positive result represents a beneficial intervention 1 outcome, according to Grimshaw 2004. 6. Relative percentage change post‐intervention = (Int1 post mean ‐ Int2 post mean)/Int2 post mean. The direction of effect has been adjusted so that a positive result represents a beneficial intervention 1 outcome, according to Grimshaw 2004. 7. Adjusted relative percentage change= (Int1 post mean‐Int2 post mean)‐(Int1 pre mean ‐ Int2 pre mean)/Int2 post mean. The direction of effect has been adjusted so that a positive result represents a beneficial intervention 1 outcome. 8. SMD=Standardised Mean Difference=(Int1 post mean‐Int2 post mean)/SD pooled. The direction of effect has been adjusted so that a positive result represents a beneficial intervention 1 outcome, according to Grimshaw 2004. 9. P value reported by study authors * The study does not report SD and therefore we were not able to calculate the SMD | |||||||||
| (Study) Intervention | Outcome | Int pre mean (SD)1 | C pre mean (SD)2 | Int post mean (SD)3 | C post mean (SD)4 | MD 5 | Relative % change 6 | Adjusted relative % change7 | SMD8 (P value)9 |
| Training of general practitioners on the use of 2 validated assessment instruments for pain versus control group (usual care) | Pain relief a week after last consultation with general practitioner | 41.1 (4.6) | 50.7 (4.8) | ‐9.6 | ‐19% | ‐2 (P=0.0004) | |||
| Pain relief a week after last consultation with general practitioner not including patients on Level 3 analgesics | 40.8 (4.0) | 50.7 (4.2) | ‐9.9 | ‐20% | ‐2.4 (P=0.0001) | ||||
| Level 1 analgesic treatment (as defined by WHO classification system) | 34.7 (10.6) | 42.9 (18.4) | 29.6 (9.9) | 34.2 (12.4) | ‐4.6 | ‐13% | 11% | ‐0.3 (P=0.38) | |
| Level 2 analgesic treatment (as defined by WHO classification system) | 42.2 (5.9) | 44.1 (19.6) | 35.4 (6.3) | 47.7 (8.8) | ‐12.3 | ‐26% | ‐22% | ‐0.9 (P=0.003) | |
| Level 3 analgesic treatment (as defined by WHO classification system) | 7.5 (5.6) | 2.5 (2.1) | 7.2 (4.7) | 1.8 (2.5) | 5.4 | 300% | 22% | 1.2 (P=0.007) | |
| Co‐analgesics (antidepressants, anxiolytics, anti‐epileptics) | 46.0 (7.6) | 38.7 (7.5) | 38.4 (11.4) | 33.0 (15.1) | 5.4 | 16% | ‐6% | 0.7 (P=0.38) | |
| Other drugs (non‐psychotropic muscle relaxants) | 21.6 (7.1) | 27.3 (13.5) | 19.0 (5.3) | 22.9 (11.5) | ‐3.9 | ‐17% | 8% | ‐0.4 (P=0.34) | |
| Non‐medicinal treatment (physiotherapy, homeopathy, acupuncture, compression bandages, etc) | 44.3 (10.2) | 44.9 (11.1) | 33.8 (11.8) | 39.3 (12.5) | ‐5.5 | ‐14% | ‐12% | ‐0.5 (P=0.30) | |
| 1. Intervention group pre‐intervention mean (standard deviation) 2. Control group pre‐intervention mean (standard deviation) 3. Intervention group post‐intervention mean (standard deviation) 4. Control group pos‐tintervention mean (standard deviation) 5. Mean Difference (MD)=Difference between post‐intervention means. The direction of effect has been adjusted so that a positive result represents a beneficial intervention outcome, according to Grimshaw 2004. 6. Relative percentage change post‐intervention = (Int post mean ‐ Control post mean)/Control post mean 7. Adjusted relative percentage change= (Int post mean‐Control post mean)‐(Int pre mean ‐ Control pre mean)/Control post mean. The direction of effect has been adjusted so that a positive result represents a beneficial intervention outcome. 8. SMD=Standardised Mean Difference=(Int post mean‐Control post mean)/SD pooled. The direction of effect has been adjusted so that a positive result represents a beneficial intervention outcome, according to Grimshaw 2004. 9. P value reported by study authors | |||||||||
| (Study) Intervention 1 versus intervention 2 | Outcome | Int 1 pre (%) 1 | Int 2 pre (%)2 | Int 1 post (%)3 | Int 2 post (%)4 | ARD 5 | Risk difference 6 (P value if reported by authors) | Relative % change post 7 | Risk ratio 8 |
| (Robling 2002)* Guidelines and seminar versus guideline dissemination by post* | Concordant requests | ‐ | ‐ | 79% (23/29) | 79% (32/41) | ‐ | 0% | 0% | 1 |
| (Robling 2002)* Guidelines and feedback versus guideline dissemination by post* | Concordant requests | ‐ | ‐ | 67% (21/32) | 79% (32/41) | ‐ | ‐12.1% | ‐15% | 0.8 |
| (Robling 2002)* Guidelines, seminar and feedback versus guideline dissemination by post* | Concordant requests | ‐ | ‐ | 71% (27/37) | 79% (32/41) | ‐ | ‐7.6% | ‐10% | 0.9 |
| (Robling 2002)* Guidelines and seminar versus guidelines and feedback* | Concordant requests | ‐ | ‐ | 79% (23/29 | 67% (21/32) | ‐ | 12.1% | 18% | 1.2 |
| (Robling 2002)* Guidelines and seminar versus guidelines, seminar and feedback* | Concordant requests | ‐ | ‐ | 79% (23/29) | 71% (27/37) | ‐ | 7.6% | 11% | 1.1 |
| (Robling 2002)* Guidelines and feedback versus guidelines, seminar and feedback* | Concordant requests | ‐ | ‐ | 67% (21/32) | 71% (27/37) | ‐ | ‐4.5% | ‐6% | 0.9 |
| (Eccles 2001)** Feedback on number of knee radiographs 6 months before and 6 months after the intervention plus guideline dissemination versus guideline dissemination | Knee radiographs concordant with guidelines | ‐ | ‐ | 22% (52/240) | 25% (83/328) | ‐ | ‐3.6% | ‐14% | 0.9 |
| (Eccles 2001)** Reminder messages on radiograph reports plus guideline dissemination versus guideline dissemination | Knee radiographs concordant with guidelines | ‐ | ‐ | 31% (26/85) | 25% (83/328) | ‐ | 5.3% | 21% | 1.2 |
| (Eccles 2001)** Feedback on number of knee radiographs 6 months before and 6 months after the intervention plus guideline dissemination plus reminder messages on radiograph reports versus guideline dissemination | Knee radiographs concordant with guidelines | ‐ | ‐ | 28% (70/252) | 25% (83/328) | ‐ | 2.5% | 10% | 1.1 |
| (Eccles 2001)** Feedback on number of knee radiographs 6 months before and 6 months after the intervention plus guideline dissemination versus reminder messages on radiograph reports plus guideline dissemination | Knee radiographs concordant with guidelines | ‐ | ‐ | 22% (52/240) | 31% (26/85) | ‐ | ‐8.9% | ‐29% | 0.7 |
| 1. Intervention 1 group pre‐intervention proportion 2. Intervention 2 group pre‐intervention proportion 3. Intervention 1 group post‐intervention proportion 4. Intervention 2 group post‐intervention proportion 5. ARD = [Int 1 post (%) minus Int 2 post (%)] minus [Int 1 pre (%) minus Int 2 pre (%)]. The direction of effect has been adjusted so that a positive result represents a beneficial intervention 1 outcome, according to Grimshaw 2004. 6. Risk Difference (RD) is the absolute % change post‐intervention = Int 1 post (%) minus Int 2 post (%). This is considered to be "small" if ≤ 5%, "modest" if > 5% and ≤10%,"moderate" if > 10% but ≤ 20%, and "large" if > 20%.The direction of effect has been adjusted so that a positive result represents a beneficial intervention 1 outcome. 7. Relative % change post = absolute % change post divided by Int 2 post (%). The direction of effect has been adjusted so that a positive result represents a beneficial intervention 1 outcome, according to Grimshaw 2004. 8. Risk ratio (RR) = Int 1 post (%) divided by Int 2 post (%) Int 1: intervention 1 group; Int 2: Intervention 2 group; ARD: adjusted risk difference; NS: not significant *The results have been re‐calculated taking into account the reported Intercluster Correlation (ICC=0.0269) and average cluster size 12.5 according to chapter 16.3.4 of the Cochrane Handbook, Higgins 2011a. ** The data reported above for the study by Eccles 2001 does not account for clustering. We did not have access to sufficient information to adjust the data for clustering. | |||||||||
| (Study) Intervention 1 versus Intervention 2 | Outcome | Int 1 pre mean (SD)1 | Int 2 pre mean (SD)2 | Int 1 post mean (SD)3 | Int 2 post mean (SD)4 | MD 5 | Relative % change 6 | Adjusted relative % change7 | SMD8 (P value)9 |
| (Eccles 2001)* Feedback on number of knee radiographs 6 months before and 6 months after the intervention plus guideline dissemination versus guideline dissemination | Number of knee radiographs per 1000 patients | 7.03 (5.1) | 6.67 (3.9) | 6.32 (4.0) | 7.02 (3.6) | 0.7 | 10% | 15% | 0.2 (NR) |
| (Eccles 2001)* Reminder messages on radiograph reports plus guideline dissemination versus guideline dissemination | Number of knee radiographs per 1000 patients | 7.18 (5.0) | 6.67 (3.9) | 5.22 (3.6) | 7.02 (3.6) | 1.8 | 26% | 33% | 0.5 (P< 0.05) |
| (Eccles 2001)* Feedback on number of knee radiographs 6 months before and 6 months after the intervention plus guideline dissemination plus reminder messages on radiograph reports versus guideline dissemination | Number of knee radiographs per 1000 patients | 9.34 (6.1) | 6.67 (3.9) | 5.21 (3.7) | 7.02 (3.6) | 1.8 | 26% | 64% | 0.5 (NR) |
| (Eccles 2001)* Feedback on number of knee radiographs 6 months before and 6 months after the intervention plus guideline dissemination versus reminder messages on radiograph reports plus guideline dissemination | Number of knee radiographs per 1000 patients | 7.03 (5.1) | 7.18 (5.0) | 6.32 (4.0) | 5.22 (3.6) | ‐1.1 | ‐21% | ‐24% | ‐0.3 (NR) |
| 1. Intervention 1 group pre‐intervention mean (standard deviation) 2. Intervention 2 group pre‐intervention mean (standard deviation) 3. Intervention 1 group post‐intervention mean (standard deviation) 4. Intervention 2 group postintervention mean (standard deviation) 5. Mean Difference (MD)=Difference between post‐intervention means. The direction of effect has been adjusted so that a positive result represents a beneficial intervention 1 outcome, according to Grimshaw 2004. 6. Relative percentage change post‐intervention = (Int1 post mean ‐ Int2 post mean)/Int2 post mean. The direction of effect has been adjusted so that a positive result represents a beneficial intervention 1 outcome, according to Grimshaw 2004. 7. Adjusted relative percentage change= (Int1 post mean‐Int2 post mean)‐(Int1 pre mean ‐ Int2 pre mean)/Int2 post mean. The direction of effect has been adjusted so that a positive result represents a beneficial intervention 1 outcome. 8. SMD=Standardised Mean Difference=(Int1 post mean‐Int2 post mean)/SD pooled. The direction of effect has been adjusted so that a positive result represents a beneficial intervention 1 outcome, according to Grimshaw 2004. 9. P value reported by study authors *The above data reported above for Eccles 2001 was adjusted for clustering by the authors | |||||||||
| Table 23: Summary of median absolute effect sizes (risk difference) of dichotomous outcomes for interventions aiming to increase or decrease a clinical behaviour | ||||
| Study characteristic: behaviour targeted | Number of comparisons (n studies) | Median absolute effect size | Interquartile range | Range |
| Increase an existing clinical behaviour according to guidelines | 68 (14) | 5% | 0.6% to 12.6% | ‐7.8% to 57.2% |
| Decrease an existing clinical behaviour according to guidelines | 26 (7) | 1.1% | ‐1.1% to 3% | ‐12.6% to 30.1% |
| Table 24: Summary of median effect sizes (risk difference) of dichotomous outcomes for interventions aiming to increase or decrease a clinical behaviour (including only comparisons from Low Back Pain studies) | ||||
| Study characteristic: behaviour targeted | Number of comparisons (n studies) | Median absolute effect size | Interquartile range | Range |
| Increase an existing clinical behaviour according to guidelines | 18 (2) | 3.7% | ‐0.8% to 6.9% | ‐4.7% to 12.8% |
| Decrease an existing clinical behaviour according to guidelines | 23 (6) | 0.5% | ‐1.1% to 2.4% | ‐12.6% to 30.1% |
| Table 25: Summary of median effect sizes (risk difference) of dichotomous outcomes for interventions aiming to increase or decrease a clinical behaviour (including only comparisons from Osteoarthritis studies) | ||||
| Study characteristic: behaviour targeted | Number of comparisons (n studies) | Median absolute effect size | Interquartile range | Range |
| Increase an existing clinical behaviour according to guidelines | 18 (3) | 6.3% | ‐0.2% to 10% | ‐7.8% to 57.2% |
| Decrease an existing clinical behaviour according to guidelines | 3 (1) | 7.8% | 6.1% to 13.4% | 4.4% to 18.9% |
| Outcome or subgroup title | No. of studies | No. of participants | Statistical method | Effect size |
| 1 Bone Mineral Density Show forest plot | 3 | 3386 | Risk Ratio (M‐H, Fixed, 95% CI) | 4.44 [3.54, 5.55] |
| 2 Osteoporosis medication Show forest plot | 5 | 4223 | Risk Ratio (M‐H, Fixed, 95% CI) | 1.71 [1.50, 1.94] |
| Outcome or subgroup title | No. of studies | No. of participants | Statistical method | Effect size |
| 1 Bone mineral density Show forest plot | 2 | 3047 | Risk Ratio (M‐H, Fixed, 95% CI) | 4.75 [3.62, 6.24] |
| 2 Osteoporosis medication Show forest plot | 2 | 3047 | Risk Ratio (M‐H, Fixed, 95% CI) | 1.52 [1.26, 1.84] |
| Outcome or subgroup title | No. of studies | No. of participants | Statistical method | Effect size |
| 1 Bone mineral density Show forest plot | 2 | 2995 | Odds Ratio (M‐H, Fixed, 95% CI) | 0.93 [0.77, 1.12] |
| 2 Medication Show forest plot | 2 | 2995 | Risk Ratio (M‐H, Fixed, 95% CI) | 0.93 [0.79, 1.10] |