مداخلات حرفهای برای پزشکان عمومی به منظور مدیریت بالینی بیماریهای عضلانیاسکلتی
Referencias
منابع مطالعات واردشده در این مرور
منابع مطالعات خارجشده از این مرور
منابع اضافی
منابع دیگر نسخههای منتشرشده این مرور
Characteristics of studies
Characteristics of included studies [ordered by study ID]
Ir a:
| Methods | Study Design: Cluster‐RCT | |
| Participants | Setting: Primary care Country: Germany. Participants: All 883 family physicians in 2 German regions were invited to participate 118 practices (126 GPs) agreed to participate and were randomised at practice level. 1 practice withdrew and 1 was excluded because it did not recruit any participants. Total participants recruited: 1378 Condition: Low back pain Inclusion criteria for patients were LBP as presenting symptom on the day of recruitment, written consent to participate in the study, and age above 19 years. Exclusion | |
| Interventions | Practices were randomised into 2 intervention and 1 "control" group. 1. Intervention: Distribution of guidelines on low back pain, 3 interactive seminars, 2 individual academic‐detailing sessions, patient leaflets (educational material + outreach visits +educational meetings) 2. Intervention: Distribution of guidelines on low back pain, 3 interactive seminars, 2 individual academic‐detailing sessions, patient leaflets. Also, motivational counselling session for GPs and 20‐hour training for 2 nurses per practice. Patients recruited received 3 counselling sessions by the nurses (patient‐directed component). 3."Control": Distribution of guidelines on low back pain (educational material) | |
| Outcomes | GP outcomes: None Patient outcomes: Functional capacity (measured by Hannover Functional Ability Questionnaire), days in pain, days of sick leave physical activity, quality of life (measured with EuroQol), and Fear Avoidance Beliefs questionnaire | |
| Notes | We were unable to confirm the results and calculate the standardised mean differences (SMD) due to non‐reported standard deviations Sources of funding: The study was funded by the German Ministry for Education and Research (BMBF, FKZ 01 EM 0113). Conflicts of interest as declared by the authors: Federal funds were received in support of this work. No benefits in any form have been or will be received from a commercial party related | |
| Risk of bias | ||
| Bias | Authors' judgement | Support for judgement |
| Random sequence generation (selection bias) | Low risk | “Practices were assigned to the 3 study arms by central permuted block randomisation with allocation concealment.” |
| Allocation concealment (selection bias) | Low risk | “Practices were assigned to the 3 study arms by central permuted block randomisation with allocation concealment.” |
| Protection against contamination | Unclear risk | Allocation was by practice but it is unclear if communication between intervention and control practices could have occurred |
| Baseline outcomes similar | Low risk | No important differences present across study groups. |
| Baseline characteristics similar | Low risk | Baseline characteristics were reported and were similar between the 2 groups |
| Blinding of outcome assessment (detection bias) | Low risk | "Outcome measure was objective and recorded by interviewers and trained nurses." |
| Incomplete outcome data (attrition bias) | Low risk | All outcomes were reported |
| Selective reporting (reporting bias) | Unclear risk | No study protocol was published in order to be able to verify this. |
| Other bias | Unclear risk | Possibility of bias during participant recruitment but GPs were asked to recruit consecutive patients |
| Methods | Study design: RCT | |
| Participants | Country: Canada (Quebec) Condition: osteoporosis Participants: 1314 women without osteoporosis treatment were randomised. Inclusion Criteria: Women, aged 50 years and over Not residing in a long‐term care hospital before the fracture Able to understand the programme information and consent form Must voluntarily accept to participate in this programme and sign the consent form Participants must have a fragility or traumatic fracture of one of the following sites: wrist, forearm, humerus, scapula, clavicle, sternum, thoracic or lumbar vertebrae, pelvis, sacrum, hip, femur, proximal and distal tibia, fibula (including ankle), and foot Participants must be able to answer the questionnaires via phone interviews Exclusion Criteria: Unable to understand the purpose of the programme Participants with a traumatic fracture of one of the following sites: cervical, skull and face, hand and finger, toe, metatarsus, and patella Pathological fracture Women currently participating in a clinical trial requiring them to take a medication for osteoporosis | |
| Interventions | Experimental group 1: Written educational material on osteoporosis for the physician (distribution of educational material) plus education of patients with advice to see their GP and give them written material (patient‐directed component) Experimental group 2: 15‐minute educational video on osteoporosis as well as written documentation on osteoporosis for the physician (distribution of educational material) plus education of participants with written material and video and advice to see their GP and give them written material (patient‐directed component) Control group: No intervention. However the control group completed a questionnaire on osteoporosis which may have increased their awareness | |
| Outcomes | Treatment for osteoporosis (using bisphonates, raloxifene, nasal calcitonin or teriparatide) | |
| Notes | The analysis of the delivery of the reading material to physicians was completed as post hoc observation Conflicts of interest and funding sources as declared by the authors: Conflicts of interest Dr. Bessette has received research grants from | |
| Risk of bias | ||
| Bias | Authors' judgement | Support for judgement |
| Random sequence generation (selection bias) | Unclear risk | The manner of randomisation has not been reported |
| Allocation concealment (selection bias) | Unclear risk | Not reported |
| Protection against contamination | Low risk | There were 4452 physicians available to treat 1174 included patients and we therefore felt the risk of contamination to be small |
| Baseline outcomes similar | Low risk | There were no statistically significant baseline differences among the groups for any investigated variable |
| Baseline characteristics similar | Low risk | The distribution of baseline characteristics was similar among the groups |
| Blinding of outcome assessment (detection bias) | Unclear risk | There was no reported blinding of outcome assessment |
| Incomplete outcome data (attrition bias) | High risk | The main outcomes (treatment rates) were reported as percentages. The analysis of the delivery of the reading material to physicians was completed as post hoc observation |
| Selective reporting (reporting bias) | Low risk | The main outcomes were treatment rates. The protocol of the study was published. |
| Other bias | Unclear risk | The analysis of the delivery of the reading material to physicians was completed as post hoc observation |
| Methods | Study design: RCT | |
| Participants | Setting: Primary care Country: Canada 462 providers, 428 patients Condition: Acute low back pain. Inclusion criteria: The patients included in this study were all residents of British Columbia, Canada, aged between 19 and 65 years. | |
| Interventions | 1.Distribution of educational materials to GP only + 3 reminders at 0 ‐ 4 weeks (via letters), 5 ‐ 12 weeks and after 12 weeks 2.Distribution of educational materials to participant and GP + 3 reminders (both to participant and GP) at 0 ‐ 4 weeks, 5 ‐ 12 weeks and after 12 weeks (distribution of educational material, reminders and patient‐directed component) 3. Control: no educational material, usual care | |
| Outcomes | GP outcomes: Concordance with specific clinical guideline‐derived history‐taking items, physical examination procedures and treatment recommendations Patient outcome: None Conflicts of interest and sources of funding as declared by the authors: FDA device/drug status: not applicable. | |
| Notes | ||
| Risk of bias | ||
| Bias | Authors' judgement | Support for judgement |
| Random sequence generation (selection bias) | Low risk | “Random number generator” used |
| Allocation concealment (selection bias) | High risk | In group 2 GPs received “ a letter from a study physician regarding a specific named patient.” |
| Protection against contamination | High risk | Randomisation happened at participant level and it is not clear if the same physician was part of both the intervention and the control group Also, there is a risk of contamination if communication occurred between physicians allocated in different groups who worked in the same practice |
| Baseline outcomes similar | Unclear risk | Not specified |
| Baseline characteristics similar | Unclear risk | Not specified |
| Blinding of outcome assessment (detection bias) | Unclear risk | Not reported |
| Incomplete outcome data (attrition bias) | Low risk | No missing outcome data |
| Selective reporting (reporting bias) | Unclear risk | No study protocol published and therefore this could not be verified |
| Other bias | Unclear risk | It is unclear if either participants or GPs were blinded (possibility of performance bias) |
| Methods | Study design: Randomised trial, no control | |
| Participants | Setting: Primary care Country: USA Fifty‐nine men (mean age 62.8) and 199 women (mean age 58.7) were involved in the survey; thirty‐seven men and 163 women were able to be questioned. Of Caucasian patients 169 of 223 were reached and of African American patients 30 of 35 were reached. | |
| Interventions | 1. Patient‐mediated: extended letter to physician about patient’s risk of osteoporosis after USS screening result including advice on management (educational material) | |
| Outcomes | Number of participants contacted by GPs following distribution of reminders Ordering BMD scan within 6 months Prescription of osteoporosis medication | |
| Notes | There was no control group Conflicts of interest and sources of funding as declared by the authors: Merck, Procter and Gamble, and Aventis pharmaceuticals for unrestricted grants for purchase of supplies and to support student activities related to the health fairs. | |
| Risk of bias | ||
| Bias | Authors' judgement | Support for judgement |
| Random sequence generation (selection bias) | Unclear risk | “Randomly assigned” is the only information provided |
| Allocation concealment (selection bias) | Unclear risk | Not reported |
| Protection against contamination | Unclear risk | Randomisation happened at physician level but it is not clear if physicians within the same practice were allocated in different groups |
| Baseline outcomes similar | Unclear risk | Not specified |
| Baseline characteristics similar | Unclear risk | Not specified |
| Blinding of outcome assessment (detection bias) | Unclear risk | Not reported |
| Incomplete outcome data (attrition bias) | High risk | Outcomes for only 63% of participants followed up |
| Selective reporting (reporting bias) | Unclear risk | No published protocol and therefore unable to verify this |
| Other bias | Unclear risk | Potential bias when recruiting participants: 149 GPs were sent letters, 258 patients were recruited, 200 patients were contacted by GPs Also, not clear if participants were blinded or if they were aware that they were taking part in the study (potential performance bias) |
| Methods | Study design: CBA 2 intervention and 2 control sites (2 divisions of general practice in Adelaide) | |
| Participants | Setting: Primary care Country: Australia 87 GPs were recruited in the intervention group. 90 in the control group. GPs were eligible to participate if they were members in one of these Condition: Shoulder pain | |
| Interventions | 1. Two sessions of academic detailing (outreach session) on shoulder assessment + educational material (DVD) + guideline + follow‐up session 3 months afterwards (distribution of educational material) 2. Control group: 90 randomly‐selected GPs who received no extra training | |
| Outcomes | GP outcomes: Knowledge score before, immediately after and 3 months after academic detailing + requests for ultrasound and Xray imaging | |
| Notes | Conflicts of interest and funding resources as declared by the authors: Funded by the Diagnostic Imaging Reform Implementation Package, Diagnostic | |
| Risk of bias | ||
| Bias | Authors' judgement | Support for judgement |
| Random sequence generation (selection bias) | High risk | Not a randomised study |
| Allocation concealment (selection bias) | High risk | Not done |
| Protection against contamination | Unclear risk | There is a possibility of contamination if communication occurred between physicians allocated in different groups but working in the same practice |
| Baseline outcomes similar | Unclear risk | Not specified |
| Baseline characteristics similar | Low risk | Baseline characteristics of the intervention and control providers are reported as similar |
| Blinding of outcome assessment (detection bias) | Unclear risk | Not reported |
| Incomplete outcome data (attrition bias) | Low risk | All outcomes reported |
| Selective reporting (reporting bias) | Unclear risk | No study protocol published and therefore unable to verify this |
| Other bias | High risk | Possible recruitment (self selection) bias of participants |
| Methods | Study design: RCT | |
| Participants | Setting: Primary care Country: France 180 GPs, randomisation at GP level. 842 patient participants were recruited by the GPs. Patients over 49 years of age could enter the study if they had radiographic confirmation of OA of the knee or hip for at least 6 months, had pain intensity on motion > or equal to 40 mm on a 100 mm visual analogue scale (VAS) the day before inclusion ; and were suitable for treatment with acetaminophen. Condition: Osteoarthritis pain management | |
| Interventions | 1. Course on chronic pain management (3 x 4‐hourly group sessions), 8 postal letters emphasising recommendations, patient leaflet with 5 statements about pain relief (educational meeting/workshop plus distribution of educational material) 2. Control, unrelated presentation received | |
| Outcomes | Outcomes: Change in the intensity of pain on motion as measure on a 100 mm VAS + Lequesne index score + Womac scores + Global perception of change + Acetaminophen use | |
| Notes | Conflicts of interest ad sources of funding as declared by the authors: Supported and sponsored by Sanofi‐Aventis OTC, Direction Medicale, Gentilly, France. | |
| Risk of bias | ||
| Bias | Authors' judgement | Support for judgement |
| Random sequence generation (selection bias) | Low risk | “Randomization stratified according to practice location and date of qualification." |
| Allocation concealment (selection bias) | High risk | Not done |
| Protection against contamination | Unclear risk | There is a possibility of contamination if communication occurred between GPs allocated to different groups but working in the same practice |
| Baseline outcomes similar | Low risk | No important differences present across study groups |
| Baseline characteristics similar | Low risk | Baseline characteristics are reported as similar |
| Blinding of outcome assessment (detection bias) | Unclear risk | Not reported |
| Incomplete outcome data (attrition bias) | Low risk | Missing data balanced in numbers across groups. Similar reasons for missing data across groups |
| Selective reporting (reporting bias) | Unclear risk | No evidence of published protocol |
| Other bias | Unclear risk | Possibility of bias during recruitment of patients by GPs. Unclear if participants were blinded |
| Methods | Study design: RCT | |
| Participants | Country: Canada, Ontario Participants: patients over the age of 55, able to give consent and identified to be at risk of future fracture Patients were eligible for inclusion in the study if they were community‐dwelling, aged 55 years or older, able 2. attended the hospital Emergency Department with a fall and found to be at high risk for falls as defined | |
| Interventions | Intervention group: The results of the patient's recent BMD test (patient‐mediated) and patient‐specific advice on prescribing according to the Osteoporosis Canada guidelines (reminders and educational material) were sent to the participant's physician. The participant received personalised counselling on osteoporosis from a research nurse, a written summary of the proposed management plan and educational material (patient‐directed component) Control group: usual care | |
| Outcomes | The main outcome was prescribing of osteoporosis medication (alendronate, risedronate, raloxifene) 6 months after the intervention | |
| Notes | The control participants received the intervention 6 months after randomisation (delayed protocol group) Conflicts of interest and sources of funding as declared by the authors: Financial support for completion of the study was given by Merck Frosst | |
| Risk of bias | ||
| Bias | Authors' judgement | Support for judgement |
| Random sequence generation (selection bias) | Low risk | A computer‐generated randomisation scheme was used |
| Allocation concealment (selection bias) | High risk | Participants and treating physicians were not blinded |
| Protection against contamination | Unclear risk | Not reported |
| Baseline outcomes similar | Low risk | No statistically significant baseline differences were detected among the groups |
| Baseline characteristics similar | Low risk | Baseline characteristics were similar among the groups |
| Blinding of outcome assessment (detection bias) | High risk | Outcome assessors could not be blinded; however the primary source of data was obtained from the Group Health Centre Electronic Medical record |
| Incomplete outcome data (attrition bias) | Low risk | |
| Selective reporting (reporting bias) | Low risk | All outcomes were reported. The protocol of the study was published |
| Other bias | Low risk | No other bias identified |
| Methods | Study design: Cluster‐RCT 56 cluster practices were in the intervention group and 63 in the control group | |
| Participants | Setting: Primary care Country: Canada 119 GP practices (these were randomised), 270 patients (the unit of analysis). Condition: Osteoporosis Participants patients inclusion criteria: Participants included postmenopausal women who had sustained a wrist fracture (confirmed by | |
| Interventions | 1. Personalised letter to GP from research co‐ordinator 2 weeks and 2 months post‐fracture (patient‐mediated and reminders) incorporating advice on management, recommended therapies and a treatment algorithm (distribution of educational material). Participants also received a letter 2 weeks and 2 months post‐fracture with advice to see their GP and an educational booklet (patient‐directed component) 2. Control: no information, usual care | |
| Outcomes | Outcomes: Proportion of women who stated that their primary care physician had: Discussed osteoporosis with them + started them on osteoporosis therapy within 6 months of fracture + BMD testing within 6 months + changes in the participant’s knowledge of osteoporosis using the Osteoporosis Knowledge Questionnaire (OPQ). Outcomes were assessed by telephone interviews | |
| Notes | Conflicts of interest and sources of funding as declared by the authors: This trial was funded by a peer‐reviewed grant from the The study did not provide sufficient information to allow the re‐calculation of adjusted for clustering effect sizes. | |
| Risk of bias | ||
| Bias | Authors' judgement | Support for judgement |
| Random sequence generation (selection bias) | Low risk | “Computer generated list of random numbers in a blinded fashion” |
| Allocation concealment (selection bias) | Low risk | As above |
| Protection against contamination | Unclear risk | Although the practices were randomised using a cluster design, it is still unclear if communication between physicians or patients of different groups was possible |
| Baseline outcomes similar | Low risk | No important differences present between the groups |
| Baseline characteristics similar | Low risk | Baseline characteristics were reported as similar |
| Blinding of outcome assessment (detection bias) | Unclear risk | Not clear if telephone interviews were conducted blindly |
| Incomplete outcome data (attrition bias) | Low risk | Similar reasons and rates of dropouts between both groups |
| Selective reporting (reporting bias) | Unclear risk | No evidence of published protocol |
| Other bias | Low risk | No other bias identified |
| Methods | Study design: cluster‐RCT | |
| Participants | Setting: primary care Country: UK Patients were eligible for this study if they were aged between 18 and 64 years, registered with a GP in | |
| Interventions | 1. Educational outreach visit + guidelines (educational material)+ poster of guidelines + referral forms with guidelines + access to fast‐track physiotherapy and a back clinic 2. Control: standard practice | |
| Outcomes | Rate of referral for lumbar spine x‐ray within 3 months Number of sickness certificates issued Number of prescribed opioids or muscle relaxants Number referred to secondary care Number referred to physio or educational programme | |
| Notes | Conflicts of interest and sources of funding as declared by the authors: None reported | |
| Risk of bias | ||
| Bias | Authors' judgement | Support for judgement |
| Random sequence generation (selection bias) | Low risk | Random allocation, each centre was given a unique identifier, stratification by primary care group |
| Allocation concealment (selection bias) | Low risk | Central allocation |
| Protection against contamination | Unclear risk | Although the practice was the unit of randomisation, it is not clear if communication between practices could affect the results |
| Baseline outcomes similar | Unclear risk | Not specified |
| Baseline characteristics similar | Low risk | Baseline characteristics are reported as similar |
| Blinding of outcome assessment (detection bias) | High risk | “Only one research assistant was employed and blind outcome assessment was not possible.” |
| Incomplete outcome data (attrition bias) | Low risk | No missing outcome data |
| Selective reporting (reporting bias) | Unclear risk | Insufficient information as no published protocol |
| Other bias | Low risk | No other bias identified |
| Methods | Study design: cluster‐RCT | |
| Participants | Setting: Primary care Country: UK The audit and | |
| Interventions | 2 x 2 factorial design 1. Distribution of educational materials + audit and feedback (number of practice referrals compared with peers) | |
| Outcomes | Number of lumbar or knee radiographs requested per 1000 patients for 2 years | |
| Notes | Intervention fidelity: Measured attachment rate of educational reminder messages to x‐ray reports Conflicts of interest and sources of funding as reported by the authors: The study was funded by the UK National Health Service Research and | |
| Risk of bias | ||
| Bias | Authors' judgement | Support for judgement |
| Random sequence generation (selection bias) | Low risk | Computer‐generated random number tables. |
| Allocation concealment (selection bias) | Low risk | Performed centrally by statistician |
| Protection against contamination | Low risk | The intervention was individualised messages and feedback to practices and therefore the risk of it being disseminated to other practices is low |
| Baseline outcomes similar | High risk | There was baseline imbalance between the groups |
| Baseline characteristics similar | Unclear risk | Not specified |
| Blinding of outcome assessment (detection bias) | Low risk | Outcomes were measured objectively by radiology departments |
| Incomplete outcome data (attrition bias) | Low risk | No missing outcome data |
| Selective reporting (reporting bias) | Unclear risk | No published protocol |
| Other bias | Unclear risk | The intervention of attaching messages to radiology reports was not consistently applied across sites. The site where the messages were attached by an operator pressing a key had an attachment rate of 40% while the other 2 sites had a rate of close to 100% |
| Methods | Study design: Cluster‐RCT | |
| Participants | Setting: Primary care Country: Netherlands 67 GPs eligible to participate, 41 of these completed outcome reports, 531 participants Condition: Low back pain The participating GPs were asked to recruit consecutive patients with a new episode of low back pain as the main reason | |
| Interventions | 1. Two‐hour workshop (negotiation skills) , guideline on low back pain and guidance on low back pain for occupational physicians, 2 scientific articles, a patient education tool and a management decision tool (distribution of educational materials) 2. Control: no intervention, usual care | |
| Outcomes | Number of referrals to a therapist (physical, exercise, or manual therapist) Prescription of pain medication on a time‐contingent basis Prescription of paracetamol versus NSAIDs Adequacy of patient education. | |
| Notes | Conflicts of interest and sources of funding as declared by the authors: The manuscript submitted does not contain information about medical | |
| Risk of bias | ||
| Bias | Authors' judgement | Support for judgement |
| Random sequence generation (selection bias) | Low risk | "Computer‐generated random‐ list of numbers” used |
| Allocation concealment (selection bias) | High risk | “Research team knew which practices received which intervention." |
| Protection against contamination | Unclear risk | The unit of allocation was the GP so there is a risk of communication between GPs allocated to different groups but working in the same practice |
| Baseline outcomes similar | Unclear risk | Not specified |
| Baseline characteristics similar | Unclear risk | Baseline characteristics were reported as similar |
| Blinding of outcome assessment (detection bias) | High risk | “Research team knew which practices received which intervention." |
| Incomplete outcome data (attrition bias) | Low risk | Intention‐to‐treat analysis performed |
| Selective reporting (reporting bias) | Unclear risk | No protocol was published (although the protocol is mentioned in the study) |
| Other bias | High risk | Possible bias as GPs recruited participants. Possible recollection or report bias due to self‐reported outcomes |
| Methods | Study design: RCT | |
| Participants | Setting: Primary care Country: USA The goal in participant selection was to identify older patients who had fractures indicating an increased | |
| Interventions | 1. Reminders: electronic medical record message about participant’s risk of osteoporosis + distribution of education materials (with guidelines) | |
| Outcomes | GP outcomes: proportion of study population who received medication for osteoporosis or a BMD test within 6 months after the intervention Participant outcomes: regular physical activity, total caloric expenditure, total calcium intake and patient satisfaction | |
| Notes | Conflicts of interest and sources of funding as declared by the authors: This study was supported by a research | |
| Risk of bias | ||
| Bias | Authors' judgement | Support for judgement |
| Random sequence generation (selection bias) | Low risk | Computerised random number generator used |
| Allocation concealment (selection bias) | Low risk | "The study statistician randomised and assigned participants to the study groups" |
| Protection against contamination | Unclear risk | Possible contamination as the participant was the unit of randomisation |
| Baseline outcomes similar | Unclear risk | Not specified |
| Baseline characteristics similar | Low risk | Baseline characteristics were reported as similar |
| Blinding of outcome assessment (detection bias) | Low risk | Study analyst “was blinded to the treatment groups.”
|
| Incomplete outcome data (attrition bias) | Low risk | No missing outcome data |
| Selective reporting (reporting bias) | Unclear risk | Protocol mentioned in the study but not published |
| Other bias | Unclear risk | Unclear if participants were blinded
|
| Methods | Study design: Cluster‐RCT | |
| Participants | Setting: Primary care Country: Australia Patient participant inclusion criteria were people presenting with acute (less than three months duration) non‐specific LBP and | |
| Interventions | Intervention group: 2 facilitated, interactive, educational workshops aiming to facilitate behaviour change plus distribution of educational DVDs to all physicians Control group: usual care | |
| Outcomes | Primary outcomes were patient outcomes but due to low numbers of patients recruited, these were not measured. Secondary outcomes included self‐reported behavioural change and number of x‐ray and CT requests | |
| Notes | Not all physicians participated in the full intervention. Only 36 (61%) attended the workshops and an additional 6 watched the DVDs. However the analysis included all physicians Conflicts of interest and sources of funding as declared by the authors: The authors have declared that no competing interests exist. The IMPLEMENT trial was funded by the Australian National Health and Medical Research Council (NHMRC) by way of a Primary Health Care Project | |
| Risk of bias | ||
| Bias | Authors' judgement | Support for judgement |
| Random sequence generation (selection bias) | Low risk | An independent and blinded statistician implemented the randomisation (computer‐generated random numbers) after stratifying practices based on the number of GPs and whether the practice was rural or not |
| Allocation concealment (selection bias) | Low risk | Allocation was concealed from the investigators until baseline data had been collected from GPs |
| Protection against contamination | Low risk | The whole practice was randomised to reduce risk of contamination |
| Baseline outcomes similar | Unclear risk | There is no information on baseline outcomes (on x‐ray and CT numbers) |
| Baseline characteristics similar | High risk | There was some baseline imbalance, with control GPs more likely to identify themselves as having an interest in low back pain (24% versus 9%) and more GPs in the intervention group undertaking low back pain continuing education in the past year (16% versus 5%) |
| Blinding of outcome assessment (detection bias) | Low risk | Investigators not involved in the intervention who entered the data and the statistician were blinded to group allocation until the statistical analysis was completed |
| Incomplete outcome data (attrition bias) | High risk | The primary outcomes were not measured due to low numbers of participants recruited |
| Selective reporting (reporting bias) | High risk | As above. Also, subgroup analysis to investigate the effect on GPs who attended the workshop (as per protocol) was not done |
| Other bias | High risk | Not all physicians participated in the full intervention. Only 36 (61%) attended the workshops and an additional 6 watched the DVDs. However the analysis included all physicians Participants could not be blinded. Primary outcomes not measured. Reported outcomes were self reported |
| Methods | Study design: RCT | |
| Participants | Setting: Primary care Country: Northern Ireland 40 GP principals randomised Condition: Shoulder pain | |
| Interventions | 1. Educational meeting/workshop on shoulder management and injection technique training on mannequins 2. As above plus injection training on real patients | |
| Outcomes | Number of shoulder injections Referrals to physiotherapy and injection clinics over last 6 months Level of confidence (10 cm VAS) | |
| Notes | Conflicts of interest and sources of funding as declared by the authors: None reported. | |
| Risk of bias | ||
| Bias | Authors' judgement | Support for judgement |
| Random sequence generation (selection bias) | Unclear risk | Not reported in the study |
| Allocation concealment (selection bias) | Unclear risk | Not reported in the study |
| Protection against contamination | Low risk | The randomisation was at physician level. The intervention required the physician to be present to practise their skills and therefore contamination is unlikely |
| Baseline outcomes similar | Low risk | No important differences between the groups |
| Baseline characteristics similar | Low risk | No important differences between the groups |
| Blinding of outcome assessment (detection bias) | High risk | Not done, this was self reported |
| Incomplete outcome data (attrition bias) | Unclear risk | "One GP's assessment return after training was incomplete and another failed to make a return. Both of these were in the "mannequin only" training group". It is unclear what the exact proportion of missing data was and if this could bias the results |
| Selective reporting (reporting bias) | Unclear risk | No published protocol of the study |
| Other bias | High risk | Results were based on self reporting by GPs. GPs were not blinded |
| Methods | Study design: RCT | |
| Participants | Setting: Primary care Country: USA 59 GPs 59 patients: workers 18‐60 years old with VDPQ scores suggesting a high risk of prolonged work disability (i.e. VDPQ score of at least 0.37 (scale = 0‐1)) Condition: Low back injury | |
| Interventions | 1.Distribution of educational materials + reminders to GPs (letters regarding the specific patient with advice on how to limit work loss) 2. Control | |
| Outcomes | 3‐month work absence rate VDPQ (disability) score Satisfaction with health care Impact of health care on return to work Days of work loss Days until first return to work | |
| Notes | Conflicts of interest and sources of funding as reported by the authors: Supported, in part, by The National Institute on Disability | |
| Risk of bias | ||
| Bias | Authors' judgement | Support for judgement |
| Random sequence generation (selection bias) | Low risk | "Each high risk worker was assigned to the physician intervention group or to the control group, according to a predetermined allotment list developed from a table of random digits balancing the assignments with every six workers". |
| Allocation concealment (selection bias) | High risk | “Physician was sent a letter identifying the patient and the patient's high risk for work absence 3 months after injury." "The workers themselves knew whether they were in the intervention or control groups". |
| Protection against contamination | Unclear risk | Physicians could be working in the same practice. |
| Baseline outcomes similar | Unclear risk | Not specified |
| Baseline characteristics similar | Unclear risk | Not specified |
| Blinding of outcome assessment (detection bias) | High risk | "The follow up interviewer was not blinded to the VDPQ scores or groups assignments". |
| Incomplete outcome data (attrition bias) | Low risk | No missing outcome data |
| Selective reporting (reporting bias) | Unclear risk | No published protocol of the study |
| Was knowledge of the allocated interventions adequately prevented during the study? | High risk | |
| Other bias | Unclear risk | Participants were not blinded |
| Methods | Study: ITS | |
| Participants | Setting: Primary care Country: UK Number of practices and GPs not reported. Analysed 2100 x‐ray referrals The mean age of the 2100 patients whose radiography reports were selected for review was 53.6 years (range = 7 to 94 years), 57.9% were female. | |
| Interventions | Distribution of guidelines (by Royal College of General Practitioners and Royal College of Radiologists) | |
| Outcomes | Number of primary care referrals for radiography of the lumbar spine | |
| Notes | Conflicts of interest and sources of funding as declared by the authors: The lead author is sponsored by a MRC training fellowship in Health | |
| Risk of bias | ||
| Bias | Authors' judgement | Support for judgement |
| Was the intervention independent of other changes? | Unclear risk | No other changes were reported at the time of the guideline dissemination. However, such changes (such as waiting times, funding arrangement changes or changes in the prevalence of low back pain were possible) |
| Was the shape of the intervention effect pre‐specified? | Unclear risk | This was not specified in the study |
| Was the intervention unlikely to affect data collection? | Low risk | The intervention was independent of the data collection method |
| Was knowledge of the allocated interventions adequately prevented during the study? | Low risk | Participants were not aware of the study |
| Were incomplete outcome data adequately addressed? | Unclear risk | The study does not give sufficient information on this |
| Other bias | Low risk | No other risks identified |
| Methods | Study design: Cluster‐RCT | |
| Participants | Setting: Primary care Country: France 155 GPs (randomisation was stratified by University; 20 different Universities), 772 participants Condition: Chronic musculoskeletal pain All included patients were over 18 years of age, had been suffering for at least 3 months from sustained daily chronic pain, of musculoskeletal origin affecting the locomotor system, and were regularly taking painkillers. | |
| Interventions | 1.Training in the use of VAS and HAD scales for pain (educational meeting + patient‐mediated intervention) 2. Control: usual care | |
| Outcomes | GP outcomes: changes in prescription of painkilling modalities Patient outcomes: Level of relief obtained (numerical relief scale) (self reported by participant) | |
| Notes | Conflicts of interest and sources of funding as declared by the authors: The Fondation de la Caisse Nationale de Prevoyance funded the study and the Nukleus company provided material support. | |
| Risk of bias | ||
| Bias | Authors' judgement | Support for judgement |
| Random sequence generation (selection bias) | Unclear risk | “Randomisation was stratified by University.” No further information provided
|
| Allocation concealment (selection bias) | Unclear risk | No information provided |
| Protection against contamination | Low risk | "In order to avoid contamination bias, physicians from both groups never met during the course of the study". |
| Baseline outcomes similar | Low risk | "Painkilling treatment prescribed at inclusion was comparable in both groups ‐ the main difference being that a larger number of patients in the scale group were taking level 3 analgesics, although the number of patients concerned was very small". |
| Baseline characteristics similar | Low risk | "The characteristics of the physicians were comparable for both groups", "The patient groups in the treatment and control groups were of similar nature", "pain location was comparable in the 2 groups except for back pain" |
| Blinding of outcome assessment (detection bias) | Unclear risk | Participants probably unaware of GPs' training. Not clear how secondary outcomes were assessed and by whom |
| Incomplete outcome data (attrition bias) | Unclear risk | Not reported |
| Selective reporting (reporting bias) | Unclear risk | No published protocol of the study |
| Other bias | Low risk | No other risks identified |
| Methods | Study design: cluster‐RCT | |
| Participants | Setting: Primary care Country: UK | |
| Interventions | 1. Distribution of guidelines + individual feedback on referral rates + graph of the average radiation dose for different examinations (educational material and audit/feedback) | |
| Outcomes | Professional practice: number of x‐rays requested (chest, limbs and joints, spine) within 12 months | |
| Notes | Conflict of interests and sources of funding as declared by the authors: This study was funded by The South Thames Project | |
| Risk of bias | ||
| Bias | Authors' judgement | Support for judgement |
| Random sequence generation (selection bias) | Low risk | “Practices were randomly allocated to an intervention or a control group using a stratified randomisation.” |
| Allocation concealment (selection bias) | Unclear risk | Not reported |
| Protection against contamination | Unclear risk | Randomisation was at practice level but unclear if practices of different groups could communicate |
| Baseline outcomes similar | Unclear risk | Not reported |
| Baseline characteristics similar | Unclear risk | Not reported. Although randomisation happened using 10 strata depending on "numbers of partners, referral rates, fund‐holding status, and having received guidelines in a previous study". |
| Blinding of outcome assessment (detection bias) | Low risk | Outcome objectively collected (routine data, collected electronically) |
| Incomplete outcome data (attrition bias) | Low risk | All outcomes were reported |
| Selective reporting (reporting bias) | High risk | Results (referrals for x‐rays) not reported per 1000 patients. Protocol of the study not published |
| Other bias | Low risk | No other risks identified |
| Methods | Study design: cluster‐RCT | |
| Participants | Setting: Primary care Country: USA 15 practices randomised after stratification (randomisation at practice level), 123 primary care physicians, 10,354 patients Condition: women 65 to 89 years of age on 3/31/2003 and high likelihood of osteoporosis with a visit between 4/1/2001 and 3/31/2003 to | |
| Interventions | 1. Patient‐directed component (educational material on osteoporosis) 2. Patient‐directed (educational material on osteoporosis) + physician prompt/reminder (reminder on electronic medical record and biweekly letter to physician listing patients needing treatment) 3. Control: standard care | |
| Outcomes | Professional practice: proportion of patients receiving BMD testing within 12 months; prescription of osteoporosis medication | |
| Notes | Possible risk of contamination Conflicts of interest and sources of funding as declared by the authors: Dr. Weiss and Dr. Chen are employees of Merck & Co. The study did not provide sufficient information to allow the re‐calculation of adjusted for clustering effect sizes. | |
| Risk of bias | ||
| Bias | Authors' judgement | Support for judgement |
| Random sequence generation (selection bias) | Low risk | "Within stratum, clinics were allocated to the three arms using a random numbers table" |
| Allocation concealment (selection bias) | Unclear risk | Not reported |
| Protection against contamination | Unclear risk | Randomisation was at practice level but unclear if practices of different groups could communicate |
| Baseline outcomes similar | Low risk | Women with previous BMD screening or on osteoporosis medication were excluded from the evaluation |
| Baseline characteristics similar | Unclear risk | "Although statistically significant baseline differences were found for most of the patient characteristics assessed, only a handful meaningful differences existed". "Women in the patient mailed reminder arm were less likely to be African American", "there was variation in health plan enrolment". There was no assessment of GP baseline characteristics |
| Blinding of outcome assessment (detection bias) | Low risk | Used "automated clinical and pharmacy data" |
| Incomplete outcome data (attrition bias) | Low risk | Missing outcome data balanced in numbers across intervention groups |
| Selective reporting (reporting bias) | Unclear risk | Insufficient information provided. No published protocol of the study |
| Other bias | Low risk | |
| Methods | Study design: RCT | |
| Participants | Setting: Primary care Country: Canada | |
| Interventions | 1. Notification letter to primary care physician (reminder) about the patient's fracture accompanied by educational material 2. Notification letter to primary care physician accompanied by educational material as above plus patient‐directed intervention (educational material and reminder) 3. Control group: usual care | |
| Outcomes | BMD and osteoporosis medication | |
| Notes | Conflicts of interest and sources of funding as declared by the authors: Wiliam Leslie has received speaker fees from Merck Frosst and Amgen; he has unrestricted research grants from Merck Frosst, Sanofi‐Aventis, Procter and Gamble, Novartis, Amgen and Genzyme; he is on the advisory boards for Genzyme, Novartis, and Amgen. Patricia A Caetano has received unrestricted research grant from Amgen. No other competing interests were declared. The article was funded by the Manitoba Patient Access Network whose mandate is to identify, advocate, support and guide health system change and process improvement initiatives. The network is financially supported by the Wait Times Reduction Fund and receives secretariat services from Manitoba Health`s Wait Times Task Force. | |
| Risk of bias | ||
| Bias | Authors' judgement | Support for judgement |
| Random sequence generation (selection bias) | Low risk | "The randomisation was done using a centralised computer‐based algorithm" |
| Allocation concealment (selection bias) | Low risk | "The computer‐based algorithm concealed the allocation process from the clinical investigators" |
| Protection against contamination | Unclear risk | It is not clear if primary care physicians in the control group were also physicians of patients under the intervention groups |
| Baseline outcomes similar | Low risk | "The groups were well balanced in terms of age, sex and site of fracture" |
| Baseline characteristics similar | Low risk | As above. The patients included had not received previous BMD test or osteoporosis medication |
| Blinding of outcome assessment (detection bias) | Low risk | The outcomes were taken from a centralised database |
| Incomplete outcome data (attrition bias) | Low risk | The analysis followed an intention‐to‐treat methodology and all participants were included |
| Selective reporting (reporting bias) | Low risk | All outcomes as per study protocol were reported |
| Other bias | Low risk | No other risks identified |
| Methods | Study design: RCT | |
| Participants | Setting: Primary care Country: Canada Condition: 50 years or older and distal forearm fracture (high likelihood of osteoporosis) Patients were excluded if they were already receiving treatment for osteoporosis with a bisphosphonate, | |
| Interventions | 1. Distribution of guidelines endorsed by five local leaders (educational material) + physician reminder (patient‐specific letter to GP) + patient‐directed component (education and counselling via telephone) | |
| Outcomes | Proportion of participants who had received BMD test Prescription of osteoporosis medication Composite measure of quality of guideline‐concordant or “appropriate” care Patient Outcomes: Health status (SF‐12) Osteoporosis‐related quality of life Wrist‐related functional outcomes Osteoporosis‐related knowledge Satisfaction with care Costs: intervention cost per patient (this outcome was reported in a different publication, Majumdar 2007) | |
| Notes | Conflicts of interest and sources of funding as declared by the authors: None declared for Sumit Majumdar, Jeffrey Johnson, | |
| Risk of bias | ||
| Bias | Authors' judgement | Support for judgement |
| Random sequence generation (selection bias) | Low risk | “Allocation was concealed by application of various block sizes and by use of a secure,centralised, Internet based computer‐generated randomisation system.” |
| Allocation concealment (selection bias) | Low risk | As above |
| Protection against contamination | High risk | The randomisation unit was the patient and therefore there could be contamination at physician level |
| Baseline outcomes similar | Unclear risk | Not reported |
| Baseline characteristics similar | Unclear risk | "Intervention and control patients were comparable" and "all multivariable analysis adjusted" for any differences. There was no assessment of physician characteristics |
| Blinding of outcome assessment (detection bias) | Low risk | "Research nurses collected outcome data without knowledge of allocation status". |
| Incomplete outcome data (attrition bias) | Low risk | All participants were accounted for |
| Selective reporting (reporting bias) | Unclear risk | All outcomes listed in Methods were reported. However, there was no published study protocol |
| Was knowledge of the allocated interventions adequately prevented during the study? | Low risk | |
| Other bias | Low risk | "Neither physicians nor patients were aware of the study outcomes" |
| Methods | Study design: Cluster‐RCT | |
| Participants | Setting: Primary care Country: Canada 249 providers, patients; before intervention = 3280, and post intervention = 2883 Condition: Osteoarthritis All NSAID, COX‐2 inhibitor, or acetaminophen prescriptions dispensed to patients with osteoarthritis were identified. | |
| Interventions | 1. Distribution of educational material (decision‐tree laminated sheet) without face‐to‐face discussion 2. 90‐minute workshops on osteoarthritis without distribution of the decision‐tree laminated sheet 3. 90‐minute workshop on osteoarthritis + distribution of the decision‐tree laminated sheet 4. Controls: standard care, no educational intervention | |
| Outcomes | Professional practice: prescription of medications for elderly patients suffering from osteoarthritis | |
| Notes | Conflicts of interest and sources of funding as declared by the authors: Drs. LeLorier, Choquette, Bessette and Rahme have served as consultants | |
| Risk of bias | ||
| Bias | Authors' judgement | Support for judgement |
| Random sequence generation (selection bias) | Unclear risk | “Each town was randomly allocated 1 of 4 intervention options”. No further details of the randomisation method are given |
| Allocation concealment (selection bias) | Unclear risk | Not reported |
| Protection against contamination | Low risk | "The towns were geographically distant to minimise cross‐contamination" |
| Baseline outcomes similar | Unclear risk | Not reported |
| Baseline characteristics similar | Low risk | "Patient and physician characteristics were on average similar among the four groups" |
| Blinding of outcome assessment (detection bias) | Low risk | Outcomes data were obtained from electronic databases (Provincial Health Care Fund database) |
| Incomplete outcome data (attrition bias) | Low risk | Intention‐to‐treat analysis performed. |
| Selective reporting (reporting bias) | Unclear risk | No study protocol was published |
| Other bias | Unclear risk | Not clear if participants were blinded with regards to the study outcomes |
| Methods | Study design: cluster‐RCT | |
| Participants | Setting: Primary care Country: UK | |
| Interventions | 1. Distribution of local guidelines + practice‐based seminar during which a 15‐minute video was shown (outreach visit) | |
| Outcomes | Professional practice: proportion of MRI requests that are in concordance with guideline (length of follow‐up not clear) | |
| Notes | Conflicts of interest and sources of funding: The study was funded by the NHS Research and Development Programme on the Primary Secondary Care Interface. | |
| Risk of bias | ||
| Bias | Authors' judgement | Support for judgement |
| Random sequence generation (selection bias) | Low risk | “Randomisation was performed using a random numbers table.” |
| Allocation concealment (selection bias) | Unclear risk | Not reported |
| Protection against contamination | Unclear risk | Randomisation was at practice level but it is unclear if practices of different groups could communicate |
| Baseline outcomes similar | Unclear risk | Not reported |
| Baseline characteristics similar | Unclear risk | Not reported |
| Blinding of outcome assessment (detection bias) | Low risk | "Anonymised interview data were assessed by a study panel" "Panel members were blinded to study randomisation" |
| Incomplete outcome data (attrition bias) | Unclear risk | Not reported |
| Selective reporting (reporting bias) | Unclear risk | Insufficient information, no study protocol was published. |
| Other bias | Unclear risk | It is unclear if participants were blinded on the outcome measures |
| Methods | Study design: Cluster‐RCT | |
| Participants | Setting: Primary care Country: Germany 75 practices, 75 GPs, 1021 patients. The GPs were the unit of randomisation. Condition: Osteoarthritis To be eligible for inclusion, patients had to be age 18 years and diagnosed with OA in | |
| Interventions | 1. Educational meeting/workshop (2 interactive quality circle meetings of 8 hours each on management of osteoarthritis and motivational skills) plus educational material (written educational material + patient educational material including leaflets, booklets and audio CDs) 2. 1 + practice nurse training to call participants and complete questionnaire on osteoarthritis management 3. Control | |
| Outcomes | Patient outcomes: Change in quality of life, assessed by the German version of the Arthritis Impact Measurement Scales Short Form (AIMS2‐SF), Health service utilisation Prescriptions Physical activity. | |
| Notes | Conflicts of interest and sources of funding as declared by the authors: None reported | |
| Risk of bias | ||
| Bias | Authors' judgement | Support for judgement |
| Random sequence generation (selection bias) | Low risk | GPs randomised by SPSS |
| Allocation concealment (selection bias) | Unclear risk | Not reported |
| Protection against contamination | High risk | As the randomisation was at GP level, it may have been possible that communication between intervention and control professionals could have occurred. |
| Baseline outcomes similar | Low risk | No significant differences between participant groups were identified |
| Baseline characteristics similar | Low risk | "No statistically significant differences in the outcome measures" at baseline were found |
| Blinding of outcome assessment (detection bias) | Unclear risk | Participant answers were cross‐checked by a research assistant but it is not clear if the assistants were blinded |
| Incomplete outcome data (attrition bias) | Low risk | No missing outcome data."No practice dropped out during the study" |
| Selective reporting (reporting bias) | Low risk | Published study protocol |
| Other bias | Unclear risk | The participants were not blinded and this may have affected the results |
| Methods | Study design: RCT | |
| Participants | Setting: Primary care Patients unable to speak French or English fluently, as well as those with known severe psychiatric problems, delirium, or dementia were not approached because of their inability to provide valid informed consent. 881 patients were randomised | |
| Interventions | Group 1: Verbal and written information on osteoporosis to patient (patient‐directed component) and letter with specific management plan sent to their treating physician (GP reminder). Patient reminders at 6 and 12 months. Reminder to physician if patient untreated at 6 months Group 2: Verbal and written information on osteoporosis to patient (patient‐directed component) and letter with specific management plan sent to their treating physician (GP reminder). Blood tests and BMD test ordered for patient and results sent to the physician (patient‐mediated intervention). Patient reminders at 4,8 and 12 months and physician reminders at 4 and 8 months if patient remained untreated Control group: Telephone interviews at 6 and 12 months to assess treatment scores. | |
| Outcomes | Osteoporosis‐related drug treatment at 12 months was the main outcome. | |
| Notes | Conflicts of interest and sources of funding as reported by the authors: Supported by unrestricted research grants from Merck Canada, The | |
| Risk of bias | ||
| Bias | Authors' judgement | Support for judgement |
| Random sequence generation (selection bias) | Low risk | Patients were recruited concurrently by a research co‐ordinate from consecutive fracture clinics. Attending surgeons did not play an active role in recruitment Recruitment to the control group was random but not randomised relative to recruitment to the intervention groups in order to avoid contamination between participants |
| Allocation concealment (selection bias) | Low risk | The consent form outlined all 3 interventions but did not suggest that any of the 3 was more effective. Primary care physicians were blinded to which group their patients were assigned to |
| Protection against contamination | Unclear risk | Participants were protected from contamination by separating the control and intervention groups but the possibility of physician contamination was not explored |
| Baseline outcomes similar | Low risk | There were no significant differences between groups |
| Baseline characteristics similar | High risk | The participants in the first intervention group were older (median age 67 while for the control group this was 64 and for the second intervention group was 63) |
| Blinding of outcome assessment (detection bias) | High risk | The assessors were not blinded |
| Incomplete outcome data (attrition bias) | Low risk | The data were analysed by intention‐to‐treat methodology |
| Selective reporting (reporting bias) | Unclear risk | The main outcome was reported but we could not find a published study protocol |
| Other bias | Unclear risk | Unclear if the participants were blinded |
| Methods | Study design: RT (no control group) | |
| Participants | Setting: Primary care Country: USA Aim 1: 240/298 patients: retrospective review Aim 2: RT 50 patients were randomised to 1 of 2 interventions Condition: Osteoporosis The inclusion criteria included an age of over fifty years (for women) or over sixty‐five years (for men), a fragility fracture | |
| Interventions | 1. Orthopaedic surgeon orders BMD and BMD results are forwarded to primary care physician (patient‐mediated) 2. Letter from orthopaedic surgeon to primary care physician outlining guidelines for osteoporosis screening (educational material and reminder) No control group | |
| Outcomes | Professional practice: the rates of evaluation (BMD testing) within 6 months and treatment (discussion and initiation) for osteoporosis | |
| Notes | Conflicts of interest and sources of funding as declared by the authors: In support of their research for or preparation of this work, one or more of the authors received, in any one year, outside funding or grants of | |
| Risk of bias | ||
| Bias | Authors' judgement | Support for judgement |
| Random sequence generation (selection bias) | Unclear risk | No information on how the randomisation took place |
| Allocation concealment (selection bias) | Unclear risk | No information is provided on allocation concealment |
| Protection against contamination | High risk | Randomisation happened at patient level |
| Baseline outcomes similar | Unclear risk | These were not assessed at baseline |
| Baseline characteristics similar | Low risk | Baseline characteristics between participant groups seemed similar |
| Blinding of outcome assessment (detection bias) | Unclear risk | Not specified in the paper.Not clear if the assessor was blinded |
| Incomplete outcome data (attrition bias) | Low risk | All participants were accounted for |
| Selective reporting (reporting bias) | Unclear risk | No study protocol was published |
| Other bias | Unclear risk | It is unclear if participants were blinded with regards to the outcomes |
| Methods | Study design: Cluster‐RCT | |
| Participants | Setting: Primary care Country: USA 85 physicians, 2020 patients, 14 group practice sites, randomisation at practice level Condition: Acute low back pain Patients were eligible for study inclusion if they met all three of the following criteria: (1) presence of low back pain; (2) duration | |
| Interventions | 1. Distribution of guideline on the management of acute low back pain + educational meeting + feedback on back pain encounters + individual follow‐up visit by investigator 6 months afterwards and another feedback on back encounters + educational material for patients including a videotape (educational material + meeting + audit + outreach) | |
| Outcomes | Professional practice: Proportion of lumbar plain x‐rays CT or MRI consistent with guideline within 12 months Subspecialty referral Physiotherapy referral Beliefs about care Satisfaction with care Clinical outcome measures using validated instruments | |
| Notes | Conflicts of interest and sources of funding as reported by the authors: Agency for Health Care Policy and Research, | |
| Risk of bias | ||
| Bias | Authors' judgement | Support for judgement |
| Random sequence generation (selection bias) | Unclear risk | “Clinician practices were stratified by affiliation and then, using sealed envelopes, randomised by an investigator to 4 groups in a 2 × 2 factorial design.” |
| Allocation concealment (selection bias) | Low risk | Sealed envelopes used |
| Protection against contamination | Unclear risk | Randomisation was at practice level and also stratification by affiliation was used which can reduce the risk of contamination. However, there may have been contamination at patient level |
| Baseline outcomes similar | High risk | "The intervention group had substantially higher utilization of radiologic and specialty services during the baseline period". "Similar baseline differences were found for utilization of services inconsistent with the guideline". "These differences remained, though were diminished, after adjustment for patient characteristics that were strongly associated with utilisation". |
| Baseline characteristics similar | High risk | Patient and clinician characteristics between the groups were not similar |
| Blinding of outcome assessment (detection bias) | Unclear risk | Not reported if assessors were blinded |
| Incomplete outcome data (attrition bias) | Unclear risk | Not recorded if all charts audited |
| Selective reporting (reporting bias) | Unclear risk | Insufficient information provided; no study protocol was published |
| Was knowledge of the allocated interventions adequately prevented during the study? | Unclear risk | It is unclear if the participants were blinded with regards to the outcomes |
| Other bias | High risk | "The four intervention groups were collapsed into two for analysis and reporting purposes" after the patient education intervention revealed no effect. This was not in accordance with the study protocol. Potential unit of analysis error, potential contamination between groups. |
| Methods | Study design: cluster‐RCT | |
| Participants | Setting: Primary care Country: USA 828 providers, 13,455 patients The at‐risk patients were women 65 years of age, men and women 65 years of age with a prior fracture, and men and women 65 yr of age who | |
| Interventions | 1. Physician education by trained pharmacists or nurses (academic‐detailing approach via outreach visits) + educational material and handouts for patients | |
| Outcomes | Professional practice (primary outcome): number of patients who began osteoporosis medication or had BMD test within 12 months Patient outcomes (secondary outcomes): fracture of wrist, humerus or hip | |
| Notes | Conflicts of interest and sources of funding: Dr Solomon possessed research grants in the past from Merck and Proctor & Gamble. Dr Gauthier is an employee of the Arthritis The study did not provide sufficient information to allow the re‐calculation of adjusted for clustering effect sizes. | |
| Risk of bias | ||
| Bias | Authors' judgement | Support for judgement |
| Random sequence generation (selection bias) | Low risk | Random‐number generator. The randomisation was at doctor level |
| Allocation concealment (selection bias) | Unclear risk | Not reported |
| Protection against contamination | Low risk | "All patients in a given physician's practice were randomised as a group (cluster randomisation) to avoid contamination within a given physician's practice". |
| Baseline outcomes similar | Unclear risk | Not reported |
| Baseline characteristics similar | Low risk | The baseline characteristics of patients and physicians were similar across the groups |
| Blinding of outcome assessment (detection bias) | Low risk |
Data used were electronic from outside sources (from Medicare, PACE, inpatient and outpatient coding) |
| Incomplete outcome data (attrition bias) | Low risk | No missing outcome data; intention‐to‐treat analysis |
| Selective reporting (reporting bias) | Low risk | Primary and secondary outcomes reported. There is published study protocol. |
| Other bias | Unclear risk | Unclear if the participants were blinded |
| Methods | Study: Cluster‐RCT | |
| Participants | Setting: Primary care Country: USA Participants: 6 communities in the state of Michigan: 3 were randomly selected to be controls and 3 were designated as intervention communities. 6 educationally influential physicians (EIs) recruited (1 in each community) | |
| Interventions | 1. Local opinion leaders' education: self‐study programme including textbook, audiovisual materials and recent articles on osteoarthritis (distribution of educational material and local opinion leaders) The aim was to improve the management of patients with OA by focusing on the role of intra‐articular corticosteroids, physical therapy and joint replacement 2. Standard care: no educational package | |
| Outcomes | Total hip arthroplasties, use of intra‐articular corticosteroids, use of physical therapy | |
| Notes | Conflicts of interest and sources of funding as declared by the authors: Supported by Multipurpose Arthritis Center grant 2P 60 | |
| Risk of bias | ||
| Bias | Authors' judgement | Support for judgement |
| Random sequence generation (selection bias) | Unclear risk | Unclear how the randomisation took place |
| Allocation concealment (selection bias) | Unclear risk | Not reported |
| Protection against contamination | Low risk | Contamination is less likely due to the randomisation at large cluster level |
| Baseline outcomes similar | Low risk | There were no significant baseline differences between the groups |
| Baseline characteristics similar | Unclear risk | Not reported |
| Blinding of outcome assessment (detection bias) | Unclear risk | Not reported, although data were obtained from hospital records |
| Incomplete outcome data (attrition bias) | Unclear risk | Not reported |
| Selective reporting (reporting bias) | Unclear risk | No published protocol of the study |
| Other bias | Unclear risk | It is not clear if the participants were blinded with regards to the outcomes |
| Methods | Study design: Cluster‐RCT | |
| Participants | Setting: Primary care Country: UK 160 providers, 91 practices were randomised to training or not training, 155 patients participated in the first part of the trial Condition: Acute shoulder pain Patients were eligible if: | |
| Interventions | 1. 60‐minute lecture on shoulder disorders, handouts, training in injection techniques (educational material + meeting) 2. Control (no educational intervention) | |
| Outcomes | Patient Outcomes: Shoulder pain assessed by 4 instruments: score on the British Shoulder Disability Questionnaire (BSDQ), SF‐36, EuroQol and three VAS (night, rest, movement) | |
| Notes | The study had a second part testing whether cortisone injections were better than anaesthetic injections for rotator cuff problems (patients were randomised into 2 groups). The study included a cost‐effectiveness analysis Conflicts of interest and sources of funding as declared by the authors: V.M. and J.W. received salary from the | |
| Risk of bias | ||
| Bias | Authors' judgement | Support for judgement |
| Random sequence generation (selection bias) | Low risk | “Computer generated sequence” used. Practices "were stratified by area" |
| Allocation concealment (selection bias) | High risk | “Patients were not informed of the allocation.” But the researchers were not blinded. |
| Protection against contamination | Unclear risk | Randomisation was at practice level but it is not clear if practices of different groups could communicate between themselves |
| Baseline outcomes similar | Unclear risk | Not reported |
| Baseline characteristics similar | Low risk | The participant baseline characteristics were reported and were similar |
| Blinding of outcome assessment (detection bias) | Unclear risk | Not reported; participants completed the pain‐assessment questionnaires |
| Incomplete outcome data (attrition bias) | Low risk | Intention‐to‐treat analysis was performed |
| Selective reporting (reporting bias) | Unclear risk | Not enough information is provided. The study protocol has not been published |
| Other bias | Unclear risk | Unclear if participants were blinded with regards to the outcomes. |
CBA: controlled before‐and‐after
BMD: bone mineral density
HAD: Hamilton anxiety and depression
ITS: interrupted time series
LBP: low back pain
RCT: randomised controlled trial
USS: ultrasound scan
VAS: visual analogue scale
VDPQ: Vermont Disability Prediction Questionnaire
Characteristics of excluded studies [ordered by study ID]
Ir a:
| Study | Reason for exclusion |
| This was a small controlled trial; not all outcomes were reported and the measurement of the main outcome (investigations for osteoporosis) was not well defined and not objectively measured or reported | |
| This was an organisational intervention and not a professional one according to the EPOC taxonomy | |
| Before‐and‐after study. 3 groups. There were no 2‐intervention and 2‐control groups | |
| Retrospective cohort study. No 2‐intervention and 2‐control groups | |
| CBA with no 2‐intervention and 2‐control groups | |
| Retrospective cohort study in a hospital setting | |
| The intervention was directed at patients and not their physicians | |
| GPs not more than 50% of participants | |
| GPs not more than 50% of participants | |
| Before‐and‐after study with no controls | |
| 2‐year cohort study with no controls | |
| Quasi‐experimental with no controls | |
| Observational study, no control group | |
| Pilot study, irrelevant topic (leg ulcer, persistent wheeze and stable angina) | |
| No objective measurement of primary outcomes | |
| Only 1/3 of participants trained in family medicine | |
| This was an ITS study addressed to paediatric physicians as opposed to general primary care physicians |
CBA: controlled before‐and‐after
Data and analyses
| Outcome or subgroup title | No. of studies | No. of participants | Statistical method | Effect size |
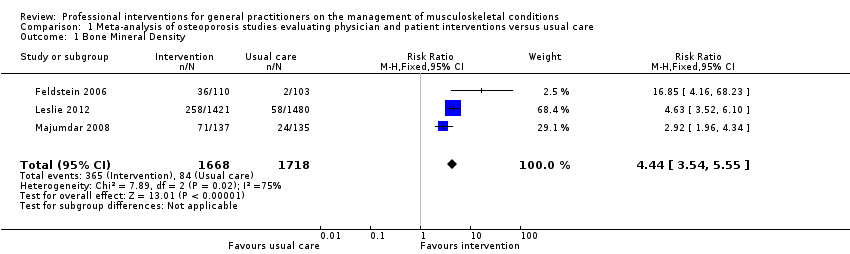
| 1 Bone Mineral Density Show forest plot | 3 | 3386 | Risk Ratio (M‐H, Fixed, 95% CI) | 4.44 [3.54, 5.55] |
| Analysis 1.1  Comparison 1 Meta‐analysis of osteoporosis studies evaluating physician and patient interventions versus usual care, Outcome 1 Bone Mineral Density. | ||||
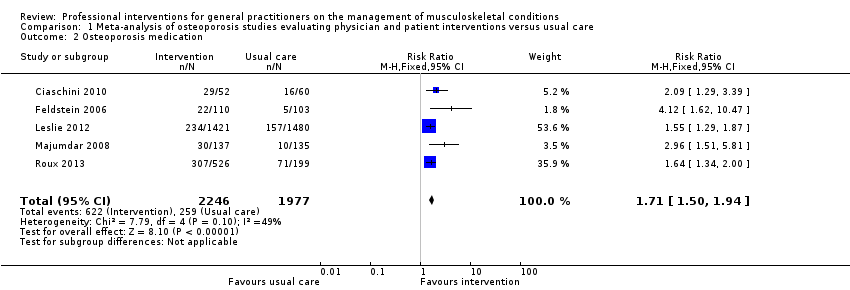
| 2 Osteoporosis medication Show forest plot | 5 | 4223 | Risk Ratio (M‐H, Fixed, 95% CI) | 1.71 [1.50, 1.94] |
| Analysis 1.2  Comparison 1 Meta‐analysis of osteoporosis studies evaluating physician and patient interventions versus usual care, Outcome 2 Osteoporosis medication. | ||||
| Outcome or subgroup title | No. of studies | No. of participants | Statistical method | Effect size |
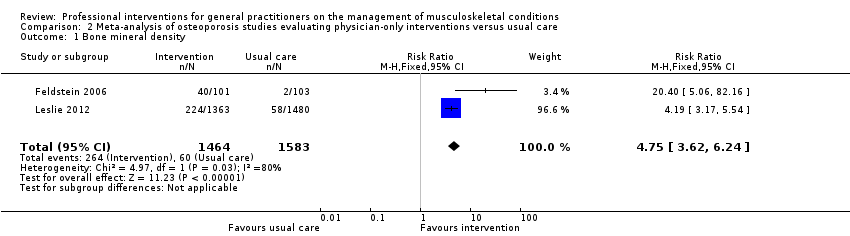
| 1 Bone mineral density Show forest plot | 2 | 3047 | Risk Ratio (M‐H, Fixed, 95% CI) | 4.75 [3.62, 6.24] |
| Analysis 2.1  Comparison 2 Meta‐analysis of osteoporosis studies evaluating physician‐only interventions versus usual care, Outcome 1 Bone mineral density. | ||||
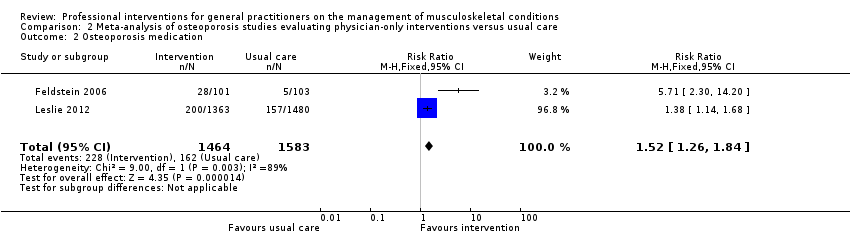
| 2 Osteoporosis medication Show forest plot | 2 | 3047 | Risk Ratio (M‐H, Fixed, 95% CI) | 1.52 [1.26, 1.84] |
| Analysis 2.2  Comparison 2 Meta‐analysis of osteoporosis studies evaluating physician‐only interventions versus usual care, Outcome 2 Osteoporosis medication. | ||||
| Outcome or subgroup title | No. of studies | No. of participants | Statistical method | Effect size |
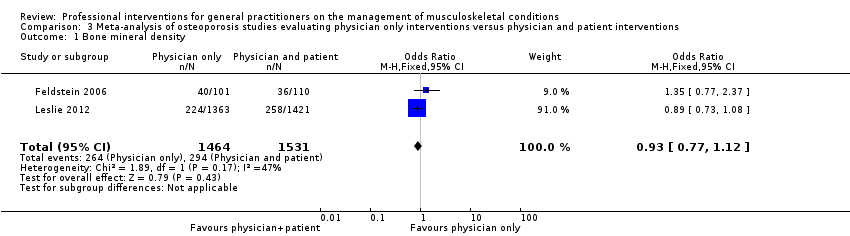
| 1 Bone mineral density Show forest plot | 2 | 2995 | Odds Ratio (M‐H, Fixed, 95% CI) | 0.93 [0.77, 1.12] |
| Analysis 3.1  Comparison 3 Meta‐analysis of osteoporosis studies evaluating physician only interventions versus physician and patient interventions, Outcome 1 Bone mineral density. | ||||
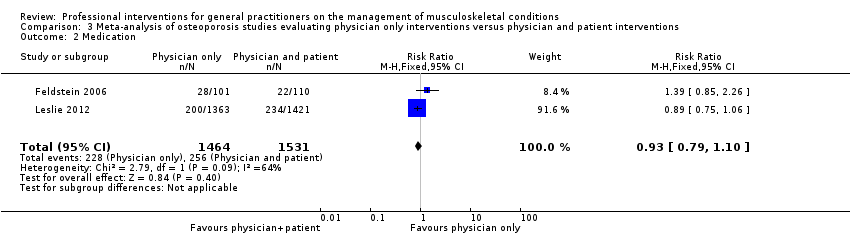
| 2 Medication Show forest plot | 2 | 2995 | Risk Ratio (M‐H, Fixed, 95% CI) | 0.93 [0.79, 1.10] |
| Analysis 3.2  Comparison 3 Meta‐analysis of osteoporosis studies evaluating physician only interventions versus physician and patient interventions, Outcome 2 Medication. | ||||
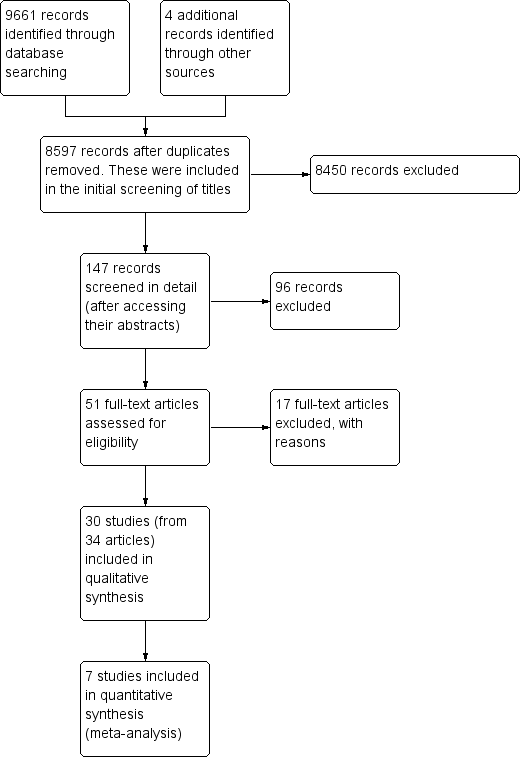
Prisma study flow diagram.
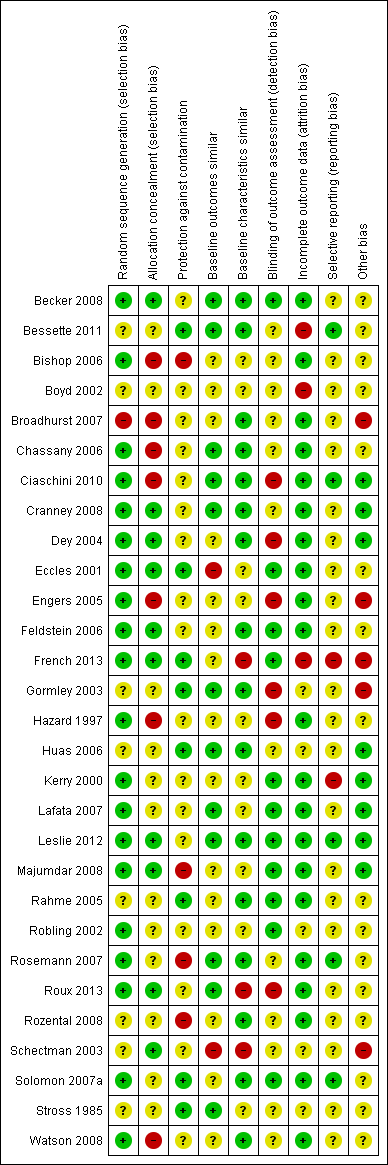
Risk of bias summary: review authors' judgements about each risk of bias item for each included study.
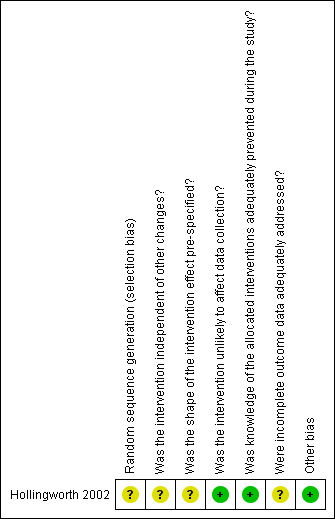
Risk of bias summary for ITS study design: review authors' judgements about each risk of bias item for each included study.
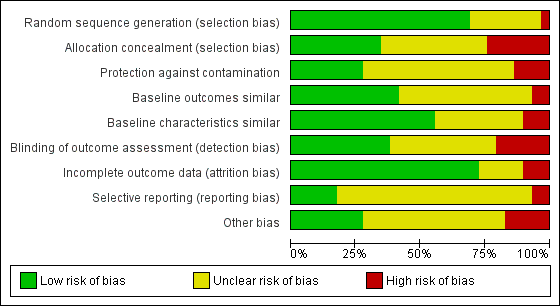
Risk of bias graph: review authors' judgements about each risk of bias item presented as percentages across all included studies.
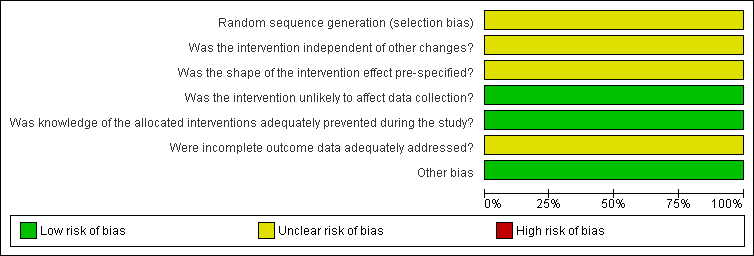
Risk of bias graph for ITS study design: review authors' judgements about each risk of bias item presented as percentages across all included studies.
Comparison 1 Meta‐analysis of osteoporosis studies evaluating physician and patient interventions versus usual care, Outcome 1 Bone Mineral Density.
Comparison 1 Meta‐analysis of osteoporosis studies evaluating physician and patient interventions versus usual care, Outcome 2 Osteoporosis medication.
Comparison 2 Meta‐analysis of osteoporosis studies evaluating physician‐only interventions versus usual care, Outcome 1 Bone mineral density.
Comparison 2 Meta‐analysis of osteoporosis studies evaluating physician‐only interventions versus usual care, Outcome 2 Osteoporosis medication.
Comparison 3 Meta‐analysis of osteoporosis studies evaluating physician only interventions versus physician and patient interventions, Outcome 1 Bone mineral density.
Comparison 3 Meta‐analysis of osteoporosis studies evaluating physician only interventions versus physician and patient interventions, Outcome 2 Medication.
| Primary care physician alerting system and a patient‐directed intervention (education and reminder to see their primary care physician) compared to usual care for osteoporosis management | ||||||
| Patient or population: General practitioners/family doctors involved in the management of patients with osteoporosis | ||||||
| Outcomes | Illustrative comparative risks* (95% CI) | Relative effect | No of Participants | Certainty of the evidence | Comments | |
| Assumed risk | Corresponding risk | |||||
| Usual care | A physician alerting system and a patient‐directed intervention (education and reminder to see their primary care physician) | |||||
| Bone Mineral Density 1 | Study population | RR 4.44 | 3386 | ⊕⊕⊕⊕ | ||
| 49 per 1000 | 220 per 1000 | |||||
| Moderate | ||||||
| 39 per 1000 | 176 per 1000 | |||||
| Osteoporosis medication 2 | Study population | RR 1.71 | 4223 | ⊕⊕⊕⊕ | ||
| 131 per 1000 | 241 per 1000 3 | |||||
| Moderate | ||||||
| 106 per 1000 | 195 per 1000 3 | |||||
| *The basis for the assumed risk (e.g. the median control group risk across studies) is provided in footnotes. The corresponding risk (and its 95% confidence interval) is based on the assumed risk in the comparison group and the relative effect of the intervention (and its 95% CI). | ||||||
| GRADE Working Group grades of evidence | ||||||
| 1 Bone mineral density (BMD) testing is an important outcome for osteoporosis because it leads to the diagnosis of the condition. This is one of the GP behaviour‐related outcomes (primary outcome) 2 Osteoporosis medication prescribing is an important outcome for osteoporosis management as it is the main aspect of treatment. This is one of the GP behaviour‐related outcomes (primary outcome) 3 One of the five studies (Roux 2013) had two intervention comparison groups which were combined to create a single pair‐wise comparison as recommended in chapter 16.5.4 of the Cochrane Handbook. | ||||||
| Primary care physician alerting system compared to usual care for osteoporosis management | ||||||
| Patient or population: General practitioners/family doctors involved in the management of patients with osteoporosis | ||||||
| Outcomes | Illustrative comparative risks* (95% CI) | Relative effect | No of Participants | Certainty of the evidence | Comments | |
| Assumed risk | Corresponding risk | |||||
| Usual care | Primary care physician alerting system | |||||
| Bone mineral density1 | Study population | RR 4.75 | 3047 | ⊕⊕⊕⊖ | ||
| 38 per 1000 | 302 per 1000 | |||||
| Moderate | ||||||
| 29 per 1000 | 231 per 1000 | |||||
| Osteoporosis medication2 | Study population | RR 1.52 | 3047 | ⊕⊕⊕⊖ | ||
| 102 per 1000 | 268 per 1000 | |||||
| Moderate | ||||||
| 77 per 1000 | 202 per 1000 | |||||
| *The basis for the assumed risk (e.g. the median control group risk across studies) is provided in footnotes. The corresponding risk (and its 95% confidence interval) is based on the assumed risk in the comparison group and the relative effect of the intervention (and its 95% CI). | ||||||
| GRADE Working Group grades of evidence | ||||||
| 1 Bone mineral density (BMD) testing is an important outcome for osteoporosis because it leads to the diagnosis of the condition. This is one of the GP behaviour‐related outcomes (primary outcome) 2 Osteoporosis medication prescribing is an important outcome for osteoporosis management as it is the main aspect of treatment. This is one of the GP behaviour‐related outcomes (primary outcome) 3 The quality of evidence was downgraded because only two studies were included, one of which had a small number of participants and events, and in view of the considerable statistical heterogeneity observed. | ||||||
| Primary care physician alerting system compared to Primary care physician alerting system and a patient‐directed intervention (education and reminder to see their primary care physician) for osteoporosis management | ||||||
| Patient or population: General practitioners/family doctors involved in the management of patients with osteoporosis | ||||||
| Outcomes | Illustrative comparative risks* (95% CI) | Relative effect | No of Participants | Certainty of the evidence | Comments | |
| Assumed risk | Corresponding risk | |||||
| Primary care physician alerting system and a patient‐directed intervention (education and reminder to see their primary care physician) | Primary care physician alerting system | |||||
| Bone mineral density1 | Study population | RR 0.94 (0.81 to 1.09) | 2995 | ⊕⊕⊕⊖ | ||
| 192 per 1000 | 194 per 1000 | |||||
| Moderate | ||||||
| 254 per 1000 | 257 per 1000 | |||||
| Medication2 Follow‐up: 6‐12 months | Study population | RR 0.93 | 2995 | ⊕⊕⊕⊖ moderate3 | ||
| 167 per 1000 | 176 per 1000 | |||||
| Moderate | ||||||
| 182 per 1000 | 191 per 1000 | |||||
| *The basis for the assumed risk (e.g. the median control group risk across studies) is provided in footnotes. The corresponding risk (and its 95% confidence interval) is based on the assumed risk in the comparison group and the relative effect of the intervention (and its 95% CI). | ||||||
| GRADE Working Group grades of evidence | ||||||
| 1 Bone mineral density (BMD) testing is an important outcome for osteoporosis because it leads to the diagnosis of the condition. This is one of the GP behaviour‐related outcomes (primary outcome) 2 Osteoporosis medication prescribing is an important outcome for osteoporosis management as it is the main aspect of treatment. This is one of the GP behaviour‐related outcomes (primary outcome) 3 The quality of evidence was downgraded because only two studies were included, one of which had a small number of participants and events. | ||||||
| Professional interventions for GPs on the management of osteoporosis compared to usual care | ||||
| Patient or population: General practitioners/family doctors involved in the management of patients with osteoporosis Settings: Primary care Intervention: Professional interventions (targeting physician‐only) Comparison: Usual care | ||||
| Outcomes | Impact (including effect sizes wherever available) | Number of Participants | Certainty of the evidence | Comments |
| Health professional (GP) behaviour‐related outcomes
|
|
|
| |
| Patient outcomes
| None of the included studies assessed these outcomes | |||
| Economic outcomes
| Majumdar 2007, assessed the cost effectiveness of the study Majumdar 2008, and concluded that the intervention led to a per patient cost saving of CAD 13 (USD 9) and a gain of 0.012 quality‐adjusted life years. | 272 participants (1 study) | ⊕⊕⊖⊖ low2 | |
| *The basis for the assumed risk (e.g. the median control group risk across studies) is provided in footnotes. The corresponding risk (and its 95% confidence interval) is based on the assumed risk in the comparison group and the relative effect of the intervention (and its 95% CI). | ||||
| GRADE Working Group grades of evidence | ||||
| 1The quality of evidence was downgraded because only two studies were included, one of which had a small number of participants and events, and in view of the considerable statistical heterogeneity observed. 2 The quality of evidence was downgraded because only one study was included which had some risk of bias. | ||||
| Professional interventions for GPs on the management of low back pain compared to usual care | ||||
| Patient or population: General practitioners/family doctors involved in the management of patients with low back pain Settings: Primary care Intervention: Professional interventions (targeting physician‐only) Comparison: Usual care | ||||
| Outcomes | Impact (including effect sizes wherever available) | No of studies | Certainty of the evidence | Comments |
| H ealth professional (GP) behaviour‐related outcomes | ||||
| Guideline‐consistent advice during consultation | Bishop 2006 showed that the intervention may result in little or no improvements (RD < 10%) with regard to guideline‐consistent advice about exercise, return to work and education and reassurance. Dey 2004 showed that the intervention probably results in a small reduction of sickness certification (RD 1.3). Engers 2005 showed that the intervention may lead to no improvement of GP behaviour with regards to patient education and advice during the consultation (RD range (‐1.3 to 12.8), authors reported OR ranging between 0.4 and 2.9). | 3 | ⊕⊕⊖⊖ low1 | |
| Guideline‐consistent prescribing of medication | Bishop 2006 showed that the intervention may lead to little improvements (RD < 10%) with regards to guideline‐consistent medication prescribing. Dey 2004 showed that the intervention probably results in no difference on prescribing rates of opioids (RD ‐1.3). Engers 2005 showed that the intervention may result in no improvement of GP behaviour with regard to prescribing (RD=2.8, OR=1, 95% CI (0.3 to 3), reported as not statistically significant). | 3 | ⊕⊕⊖⊖ low1 | |
| Guideline‐consistent referrals for investigations (e.g.. x‐rays) | Schectman 2003 showed that the intervention may result in little or no change in GP behaviour with regards to the number of guideline‐consistent referrals for lumbar spine x‐rays and CT scans (RD <5%). | 1 | ⊕⊕⊖⊖ low2 | |
| Guideline‐consistent referrals to other services | Bishop 2006 showed that the intervention may lead to little or no improvements (RD < 5%) with regards to guideline‐consistent referral to other services (such as physiotherapy). Schectman 2003 showed that the intervention may result in little or no difference with regards to the number of guideline‐consistent specialist or physiotherapy referrals (RD <5%). | 2 | ⊕⊕⊖⊖ low3 | |
| Number of investigations | Dey 2004 showed that the intervention probably results in a small increase in the ordering of x‐rays (RD 1.4). French 2013 showed that the intervention may lead to little or no difference in the number of x‐ray and CT requests (RD ‐0.2% and 0.0% respectively). Kerry 2000 showed that the intervention probably results in a cluster‐adjusted reduction of spinal x‐ray requests of 20% between the intervention and control groups (95% CI 4 to 36, P<0.05). Schectman 2003 showed that the intervention may result in little or no change in GP behaviour with regards to referrals for lumbar spine x‐rays and CT scans (RD <5%). | 4 | ⊕⊕⊖⊖low4 | |
| Number of referrals to other services | Dey 2004 showed that the intervention probably results in increased referrals to fast‐track physiotherapy and a back‐pain triage service (RD 12.6%). Engers 2005 showed that the intervention may lead to little reduction of onward referrals to a therapist (RD 4.6, 23% in the intervention group versus 28% in the control group, clustered adjusted OR 0.8, 95% CI (0.5 to 1.4)). Schectman 2003 showed that the intervention may result in little or no difference with regards to the number of specialist or physiotherapy referrals (RD <5%). | 3 | ⊕⊕⊖⊖ low4 | |
| Patient outcomes | ||||
| Functional capacity/activity scores | 0 | None of the included studies assessed this outcome | ||
| Pain control | 0 | None of the included studies assessed this outcome | ||
| Work absence | Hazard 1997 showed that the intervention may result in no improvement with respect to days of sick leave compared to the control group (RD ‐4.6%). | 1 | ⊕⊕⊖⊖ low2 | The study by Hazard 1997 was very small (just 53 participants) |
| Quality of life | 0 | None of the included studies assessed this outcome | ||
| Economic outcomes
| 0 | None of the included studies assessed these outcomes | ||
| *The basis for the assumed risk (e.g. the median control group risk across studies) is provided in footnotes. The corresponding risk (and its 95% confidence interval) is based on the assumed risk in the comparison group and the relative effect of the intervention (and its 95% CI). | ||||
| GRADE Working Group grades of evidence | ||||
| 1 The quality of evidence was downgraded because the studies have a high risk of bias and high heterogeneity in terms of the types of interventions evaluated. Additionally the effect sizes are small. 2 The quality of evidence was downgraded because the results are based only on one study with high risk of bias. 3 The quality of evidence was downgraded because the results are based on just two studies with high risk of bias. 4 The quality of evidence was downgraded because the studies have a high risk of bias and high heterogeneity in terms of the types of interventions evaluated. Additionally there is high inconsistency in the direction of effects across the studies. | ||||
| Professional interventions for GPs on the management of osteoarthritis compared to usual care | ||||
| Patient or population: General practitioners/family doctors involved in the management of patients with osteoarthritis Settings: Primary care Intervention: Professional interventions (targeting physician‐only) Comparison: Usual care | ||||
| Outcomes | Impact (including effect sizes wherever available) | No of studies | Certainty of the evidence | Comments |
| Health professional (GP) behaviour‐related outcomes | ||||
| Guideline‐consistent advice during consultation | Stross 1985 showed that the intervention may increase the use of intra‐articular corticosteroids (RD large at 29%). | ⊕⊕⊖⊖ low1 | ||
| Guideline‐consistent prescribing of medication | Rahme 2005 showed that the intervention may result in a slight improvement in osteoarthritis guideline‐consistent GP prescribing of medication (acetaminophen, NSAIDs and COX‐2 inhibitors) 5 months afterwards (RD 5% after dissemination of educational material, RD 7% after a workshop and RD 13% for the combined intervention) Rosemann 2007 showed that prescriptions for painkillers may slightly increase following the intervention (RDs between ‐2.2% and 11.1%). Stross 1985 showed that the intervention may reduce the use of systemic corticosteroids according to the guidelines (RD moderate at 19%). | ⊕⊕⊖⊖ low1 | ||
| Guideline‐consistent referrals for investigations (e.g.. x‐rays) | None of the included studies assessed this outcome | |||
| Guideline‐consistent referrals to other services | Stross 1985 showed that the intervention may increase the utilisation of physical therapy pre‐operatively (RD large at 57%). | ⊕⊕⊖⊖ low1 | ||
| Number of investigations | Rosemann 2007 showed that the intervention may result in some small reduction in the number of GP referrals for radiographs (SMD 0.2‐0.4). | ⊕⊕⊖⊖low3 | ||
| Number of referrals to other services | Rosemann 2007 showed that the intervention may result in a reduction in the number of GP referrals to orthopaedics (SMD 0.8 for the educational intervention and 0.2 for the combined intervention after adding nurse case management). | ⊕⊕⊖⊖ low4 | ||
| Patient outcomes | ||||
| Functional capacity/activity scores | Chassany 2006 showed that the intervention may result in small improvements with regard to physical function scores (WOMAC index physical function score) (SMD 0.3, P<0.05). | ⊕⊕⊖⊖ low5 | Results were assessed within two weeks of the Chassany 2006 trial, so it is unclear whether the positive patient outcomes persisted. | |
| Pain control | Chassany 2006 showed that the intervention may result in small improvements with regard to pain scores (VAS score, Pain relief (SPID), WOMAC index pain score) (SMD 0.2, P<0.05 across all outcomes). | ⊕⊕⊖⊖ low5 | Results were assessed within two weeks of the Chassany 2006 trial, so it is unclear whether the positive patient outcomes persisted. | |
| Work absence | None of the included studies assessed this outcome | |||
| Quality of life | Rosemann 2007 showed that the intervention may result in small or no improvement with regard to patient related outcomes (SMD <0.40). | ⊕⊕⊖⊖ low3 | ||
| Economic outcomes
| None of the included studies assessed these outcomes | |||
| *The basis for the assumed risk (e.g. the median control group risk across studies) is provided in footnotes. The corresponding risk (and its 95% confidence interval) is based on the assumed risk in the comparison group and the relative effect of the intervention (and its 95% CI). | ||||
| GRADE Working Group grades of evidence | ||||
| 1 The quality of evidence was downgraded because the results are based on one study only with high risk of bias and a small number of participants (114). 2 The quality of evidence was downgraded because the studies have high heterogeneity in terms of the types of interventions and the types of medications prescribed. 3 The quality of evidence was downgraded because the results are based on just one study and the effect size was small. 4 The quality of evidence was downgraded because the results are based on just one study and the effect size varies considerably between the two intervention groups. 5 The quality of evidence was downgraded because the results are based on just one study and were assessed just 2 weeks following the intervention. NSAIDs: Non steroidal anti‐inflammatory drugs, COX‐2 inhibitors: Cyclo‐oxygenase 2 inhibitors, WOMAC: Western Ontario and McMaster Universities Osteoarthritis Index, VAS: Visual analogue scale, SPID: sum of pain intensity differences. | ||||
| Professional interventions for GPs on the management of shoulder pain compared to usual care | ||||
| Patient or population: General practitioners/family doctors involved in the management of patients with shoulder pain Settings: Primary care Intervention: Professional interventions (targeting physician‐only) Comparison: Usual care | ||||
| Outcomes | Impact (including effect sizes wherever available) | Number of studies | Certainty of the evidence | Comments |
| Health professional (GP) behaviour‐related outcomes | ||||
| Guideline‐consistent advice during consultation | None of the included studies assessed this outcome | |||
| Guideline‐consistent prescribing of medication | None of the included studies assessed this outcome | |||
| Guideline‐consistent referrals for investigations (e.g.. x‐rays) | None of the included studies assessed this outcome | |||
| Guideline‐consistent referrals to other services | None of the included studies assessed this outcome | |||
| Number of investigations | Broadhurst 2007 showed that the intervention may result in a temporary, slight reduction in ultrasound requests, but little or no change in the x‐ray requests. | ⊕⊕⊖⊖ low1 | ||
| Number of referrals to other services | None of the included studies assessed this outcome | |||
| Patient outcomes | ||||
| Functional capacity/activity scores | Watson 2008 showed that the intervention may result in little or no improvement in function a year later (BSDQ SMD 0.2, SF‐36 for physical component SMD 0 and SF‐36 mental component SMD 0.1) | ⊕⊕⊖⊖ low2 | ||
| Pain control | None of the included studies assessed this outcome | |||
| Work absence | None of the included studies assessed this outcome | |||
| Quality of life | None of the included studies assessed this outcome | |||
| Economic outcomes
| McKenna 2009 assessed the cost effectiveness of providing practical training to GPs in the SAPPHIRE study by Watson 2008. It reported an incremental cost‐effectiveness ratio of GBP 2,813 per QALY gained for trained GPs. | ⊕⊕⊖⊖ low2 | ||
| *The basis for the assumed risk (e.g. the median control group risk across studies) is provided in footnotes. The corresponding risk (and its 95% confidence interval) is based on the assumed risk in the comparison group and the relative effect of the intervention (and its 95% CI). | ||||
| GRADE Working Group grades of evidence | ||||
| 1 The quality of evidence was downgraded because the results are based on just one study (CBA) with high risk of bias. 2 The quality of evidence was downgraded because the results are based on just one study and the effect size was small. BSDQ: British Shoulder Disability questionnaire, SF‐36: Short‐form 36 item Health Survey, GBP: Great Britain Pound | ||||
| Professional interventions for GPs on the management of shoulder pain compared to usual care | ||||
| Patient or population: General practitioners/family doctors involved in the management of patients with other musculoskeletal conditions Settings: Primary care Intervention: Professional interventions (targeting physician‐only) Comparison: Usual care | ||||
| Outcomes | Impact (including effect sizes wherever available) | No of studies | Certainty of the evidence | Comments |
| Health professional (GP) behaviour‐related outcomes | ||||
| Guideline‐consistent advice during consultation | None of the included studies assessed this outcome | |||
| Guideline‐consistent prescribing of medication | Huas 2006 showed that the intervention may result in increased level 3 (WHO classification) analgesic prescribing (SMD 1.2, P=0.02) | ⊕⊕⊖⊖ low1 | ||
| Guideline‐consistent referrals for investigations (e.g.. x‐rays) | None of the included studies assessed this outcome | |||
| Guideline‐consistent referrals to other services | None of the included studies assessed this outcome | |||
| Number of investigations | Kerry 2000 showed that the intervention may result in little or no reduction in GP knee radiology requests (relative change 10%, not statistically significant). | ⊕⊕⊖⊖ low2 | ||
| Number of referrals to other services | None of the included studies assessed this outcome | |||
| Patient outcomes | ||||
| Functional capacity/activity scores | None of the included studies assessed this outcome | |||
| Pain control | Huas 2006 showed that the intervention may result in worse patient‐related outcomes: pain relief scores (SMD 2, P=0.0004) | ⊕⊕⊖⊖ low1 | ||
| Work absence | None of the included studies assessed this outcome | |||
| Quality of life | None of the included studies assessed this outcome | |||
| Economic outcomes
| None of the included studies assessed these outcomes | |||
| *The basis for the assumed risk (e.g. the median control group risk across studies) is provided in footnotes. The corresponding risk (and its 95% confidence interval) is based on the assumed risk in the comparison group and the relative effect of the intervention (and its 95% CI). | ||||
| GRADE Working Group grades of evidence | ||||
| 1 The quality of evidence was downgraded because the results are based on just one study with high risk of bias. 2 The quality of evidence was downgraded because the results are based on just one study and the effect size was small. | ||||
| Table 1: Classification of relevant interventions from EPOC taxonomy | |
| Intervention | Description |
| Distribution of educational materials | Distribution of published or printed recommendations for clinical care, including clinical practice guidelines, audio‐visual materials and electronic publications. The materials may have been delivered personally or through mass mailings. |
| Educational meetings | Healthcare providers who have participated in conferences, lectures, workshops or traineeships |
| Local consensus processes | Inclusion of participating providers in discussion to ensure that they agreed that the chosen clinical problem was important and the approach to managing the problem was appropriate |
| Educational outreach visits | Use of a trained person who met with providers in their practice settings to give information with the intent of changing the provider’s practice. The information given may have included feedback on the performance of the provider(s) |
| Local opinion leaders | Use of providers nominated by their colleagues as ‘educationally influential’. The investigators must have explicitly stated that their colleagues identified the opinion leaders |
| Patient‐mediated | New clinical information (not previously available) collected directly from patients and given to the provider e.g. depression scores from an instrument |
| Audit and feedback | Any summary of clinical performance of health care over a specified period of time. The summary may also have included recommendations for clinical action. The information may have been obtained from medical records, computerised databases, or observations from patients |
| Reminders | Patient or encounter specific information, provided verbally, on paper or on a computer screen, which is designed or intended to prompt a health professional to recall information. This would usually be encountered through their general education; in the medical records or through interactions with peers, and so remind them to perform or avoid some action to aid individual patient care. Computer aided decision support and drugs dosage are included. |
| Marketing | Use of personal interviewing, group discussion (‘focus groups’), or a survey of targeted providers to identify barriers to change and subsequent design of an intervention that addresses identified barriers |
| Mass media | (i) Varied use of communication that reached great numbers of people including television, radio, newspapers, posters, leaflets, and booklets, alone or in conjunction with other interventions; (ii) Targeted at the population level |
| Other | Patient‐directed (education and reminders to see their primary care physician) |
| Table 2. Intervention types used in each study (N.B. All interventions evaluated were professional) | ||
| Intervention methods 1,2 | No. of Studies | Studies 3 |
| Distribution of educational materials | 27 | Becker 2008; Bessette 2011; Bishop 2006; Boyd 2002; Broadhurst 2007; Chassany 2006; Ciaschini 2010; Cranney 2008; Dey 2004; Eccles 2001; Engers 2005; Feldstein 2006; French 2013; Hazard 1997; Hollingworth 2002; Kerry 2000; Leslie 2012; Majumdar 2008; Rahme 2005; Robling 2002; Rosemann 2007; Roux 2013; Rozental 2008; Schectman 2003; Solomon 2007a; Stross 1985; Watson 2008 |
| Educational meetings | 10 | Becker 2008; Chassany 2006; Engers 2005; French 2013; Gormley 2003; Huas 2006; Rahme 2005; Rosemann 2007; Schectman 2003, Watson 2008 |
| Local consensus processes | 0 | |
| Educational outreach visits | 6 | Becker 2008; Broadhurst 2007; Dey 2004; Robling 2002; Schectman 2003; Solomon 2007a |
| Local opinion leaders | 3 | |
| Patient‐mediated | 6 | Boyd 2002; Ciaschini 2010; Cranney 2008; Huas 2006; Roux 2013; Rozental 2008 |
| Audit and feedback | 4 | |
| Reminders | 11 | Bishop 2006; Ciaschini 2010; Cranney 2008; Eccles 2001; Feldstein 2006; Hazard 1997; Lafata 2007; Leslie 2012; Majumdar 2008; Roux 2013; Rozental 2008 |
| Marketing | 0 | |
| Mass media | 0 | |
| Patient‐directed4 | 12 | Becker 2008; Bessette 2011; Bishop 2006; Leslie 2012; Ciaschini 2010; Cranney 2008; Feldstein 2006; Lafata 2007; Majumdar 2008; Rosemann 2007; Roux 2013; Solomon 2007a |
| 1. Category of intervention as classified by the EPOC taxonomy EPOC 2007 [9] 2. See Table 1 for definition of each intervention 3. Some studies used more than one intervention type and these are listed against their corresponding category 4. Patient‐directed interventions targeted patients and included patient education and reminders to see their primary‐care physician. These were included in the review only if they were a component of a professional intervention targeting primary‐care physicians | ||
| Table 3. Intervention combinations compared to a no‐intervention control group | ||
| Intervention combinations | No. of comparisons | Study ID |
| Single component interventions: | ||
| Distribution of educational materials | 1 | |
| Patient‐directed | 3 | |
| Educational meetings, workshops | 1 | |
| Multifaceted interventions: Two intervention components | ||
| Distribution of educational material + reminders | 4 | |
| Distribution of educational material + educational outreach visits | 4 | |
| Distribution of educational material + educational meeting/workshop | 6 | Chassany 2006; Engers 2005; French 2013; Rahme 2005; Rosemann 2007; Watson 2008 |
| Distribution of educational material + local opinion leaders | 1 | |
| Distribution of educational material + audit/feedback | 1 | |
| Patient‐mediated + educational meeting/workshop | 1 | |
| Patient‐directed +reminder | 1 | |
| Patient‐directed + educational material | 1 | |
| Multifaceted interventions: Three intervention components | ||
| Patient‐directed + educational material + reminder | 3 | |
| Patient‐directed + educational material + educational meeting/workshop | 1 | |
| Patient‐directed + educational material + educational outreach visit | 1 | |
| Multifaceted interventions: Four intervention components | ||
| Patient‐directed + distribution of educational material + reminder + local opinion leaders | 1 | |
| Patient‐mediated + distribution of educational material + reminders + patient‐directed (education and reminders) | 3 | |
| Multifaceted interventions: Five intervention components | ||
| Distribution of educational material + educational meetings/workshops + audit + educational outreach visit + local opinion leaders | 1 | |
| Table 4. Intervention combinations compared to a different intervention | ||
| Intervention combinations | No. of comparisons | Study ID |
| Single component interventions: | ||
| Educational meetings/workshops vs distribution of educational material | 1 | |
| Educational meetings/workshops vs a different educational meeting/workshop | 1 | |
| Multifaceted interventions: Two intervention components | ||
| Distribution of educational material + patient‐mediated vs the same intervention but less intensive | 1 | |
| Distribution of educational material + educational outreach visit vs distribution of educational material | 1 | |
| Distribution of educational material + audit vs distribution of educational material | 2 | |
| Distribution of educational material + audit vs distribution of educational material + reminder | 1 | |
| Distribution of educational material + outreach vs distribution of educational material + audit | 1 | |
| Distribution of educational material + educational outreach visit vs patient‐directed | 1 | |
| Distribution of educational material + patient‐directed vs the same (more intensive) | 1 | |
| Patient‐directed + reminder vs patient‐directed | 1 | |
| Distribution of educational material + reminder vs distribution of educational material | 1 | |
| Distribution of educational material + reminder vs patient‐mediated | 1 | |
| Distribution of educational material + educational meeting/workshop vs educational meeting/workshop | 1 | |
| Distribution of educational material + educational meeting/workshop vs distribution of educational material | 1 | |
| Multifaceted interventions: Three intervention components | ||
| Distribution of educational material + reminders + patient‐directed vs distribution of educational material + reminders | 2 | |
| Distribution of educational material + reminder + patient‐directed vs patient‐directed | 1 | |
| Distribution of educational material + audit + reminders vs distribution of educational material | 1 | |
| Distribution of educational material + audit + reminders vs distribution of educational material + audit | 1 | |
| Distribution of educational material + audit + reminders vs distribution of educational material + reminders | ||
| Distribution of educational material + audit + outreach vs distribution of educational material + outreach | 1 | |
| Distribution of educational material + audit + outreach vs distribution of educational material + audit | 1 | |
| Distribution of educational material + audit + outreach vs distribution of educational material | 1 | |
| Distribution of educational material + educational meetings/workshops + educational outreach visits vs distribution of educational material | 1 | |
| Distribution of educational material + educational outreach visit + patient‐directed vs patient‐directed | 1 | |
| Distribution of educational material + educational outreach visit + patient‐directed vs distribution of educational material + educational outreach visit | 1 | |
| Distribution of educational material + educational meeting/workshop + patient‐directed vs distribution of educational material + educational meeting/workshop | 1 | |
| Multifaceted interventions: Four intervention components | ||
| Distribution of educational material + educational meetings/workshops + educational outreach visits + patient‐directed vs distribution of educational material | 1 | |
| Distribution of educational material + educational meetings/workshops +educational outreach visits + patient directed vs distribution of educational material + educational meetings/workshops + educational outreach visits | 1 | |
| Patient‐mediated + distribution of education material + reminders + patient‐directed (education and reminders) vs patient‐mediated + distribution of education material + reminders + patient‐directed (education and reminders) | 1 | |
| (Study) Intervention | Int pre (%) 1 | C pre (%)2 | Int post (%)3 | C post (%)4 | ARD 5 | Risk difference 6 (P value if reported by authors) | Relative % change post 7 | Risk ratio 8 |
| Patient education and reminder to see their physician (patient directed), education of physician via the patient (distribution of educational material) | ‐ | ‐ | 14.72% | 11.96% | ‐ | 2.8% | 23% | 1.2 |
| Patient education (including video on osteoporosis) and reminder to see their physician, education of physician via the patient (distribution of educational material) | ‐ | ‐ | 15.81% | 11.96% | ‐ | 3.9% | 32% | 1.3 |
| (Cranney 2008)** Patient‐specific mailed letter to primary are physician (including guidelines) and patient education and reminder | ‐ | ‐ | 64/125 (51%) | 36/145 (25%) | ‐ | 26.4% (P< 0.0001) | 106% | 2.1 |
| Patient‐specific Electronic Medical Record (EMR) reminders to primary‐care provider informing them of patient increased risk and guidelines. Sent twice. | ‐ | ‐ | 40/101 (39.6%) | 2/103 (1.9%) | ‐ | 37.7% (P< 0.01) | 1940% | 20.4 |
| EMR reminder plus patient‐directed intervention: education and reminder | ‐ | ‐ | 36/110 (32.7%) | 2/103 (1.9%) | ‐ | 30.8% (P< 0.01) | 1585% | 16.9 |
| (Lafata 2007)** Patient‐directed: 2 mailings (educational and reminders) | ‐ | ‐ | 720/3367 (21.4%) | 313/2901 (10.8%) | ‐ | 10.6% (P< 0.001) | 98% | 2 |
| (Lafata 2007)** Physician prompt: Electronic Medical Record (EMR) reminder to physician and biweekly mailing plus patient‐directed: 2 mailings (educational and reminders) | ‐ | ‐ | 1181/4086 (28.9%) | 313/2901 (10.8%) | ‐ | 18.1% (P< 0.001) | 168% | 2.7 |
| Physician reminder plus educational material | 224/1363 (16.4%) | 58/1480 (3.9%) | ‐ | 12.5% | 319% | 4.2 | ||
| Physician reminder plus educational material plus patient‐directed intervention (reminder to see their physician) | ‐ | ‐ | 258/1421 (18.2%) | 58/1480 (3.9%) | ‐ | 14.2% | 363% | 4.6 |
| Patient education, physician patient‐specific reminders by mail/fax, physician guidelines endorsed by opinion leaders | ‐ | ‐ | 71/137 (51.8%) | 24/135 (17.8%) | ‐ | 34% (P< 0.001) | 192% | 2.9 |
| (Solomon 2007a)** Patient directed (3 mailed letters educational) | ‐ | ‐ | 249/3274 (7.6%) | 224/3268 (6.9%) | ‐ | 0.8% (NS) | 11% | 1.1 |
| (Solomon 2007a)** Physician education following an academic‐detailing approach | ‐ | ‐ | 183/3574 (5.1%) | 224/3268 (6.9%) | ‐ | ‐1.7% (NS) | ‐25% | 0.7 |
| (Solomon 2007b)** Combination of both physician and patient education | ‐ | ‐ | 223/3339 (6.7%) | 224/3268 (6.9%) | ‐ | ‐0.2% (NS) | ‐3% | 1 |
| 1. Intervention group pre‐intervention proportion 2. Control group pre‐intervention proportion 3. Intervention group post‐intervention proportion 4. Control group post‐intervention proportion 5. ARD = [Int post (%) minus C post (%)] minus [Int pre (%) minus C pre (%)]. The direction of effect has been adjusted so that a positive result represents a beneficial intervention outcome, according to Grimshaw 2004. 6. Risk Difference (RD) is the absolute % change post‐intervention = Int post (%) minus C post (%). This is considered to be "small" if ≤ 5%, "modest" if > 5% and ≤10%,"moderate" if > 10% but ≤ 20%, and "large" if > 20%.The direction of effect has been adjusted so that a positive result represents a beneficial intervention outcome, according to Grimshaw 2004. 7. Relative % change post = absolute % change post divided by C post (%). The direction of effect has been adjusted so that a positive result represents a beneficial intervention outcome, according to Grimshaw 2004. 8. Risk ratio (RR) = Int post (%) divided by C post (%) BMD: bone mineral density; C: control group; Int: intervention group; ARD: adjusted risk difference; NS: not significant * In the study by Bessette 2011, the outcomes reported above include the participants with a diagnosis following the intervention. The women were considered "diagnosed" if they received a BMD test, if they were informed by their physician that they were suffering from osteoporosis and/or if they were initiated on osteoporosis medication. Therefore, the above percentages do not necessarily mean that the women received a BMD test. ** The data reported above for the studies by Cranney 2008, Lafata 2007 and Solomon 2007b does not account for clustering. We did not have access to sufficient information to adjust the data for clustering. | ||||||||
| (Study) Intervention | Int pre (%) 1 | C pre (%)2 | Int post (%)3 | C post (%)4 | ARD 5 | Risk difference 6 (P value if reported by authors) | Relative % change post 7 | Risk ratio 8 |
| Patient education (patient directed), education of physician via the patient (for group of patients without diagnosis or treatment at randomisation) | ‐ | ‐ | 11.79% | 7.78% | ‐ | 4% | 52% | 1.5 |
| Patient education (including video on osteoporosis), education of physician via the patient (for group of patients without diagnosis or treatment at randomisation) | ‐ | ‐ | 10.64% | 7.78% | ‐ | 2.9% | 37% | 1.4 |
| Patient education (patient directed), education of physician via the patient (for group of patients without treatment at randomisation) | ‐ | ‐ | 13.49% | 10.31% | ‐ | 3.2% | 31% | 1.3 |
| Patient education (including video on osteoporosis), education of physician via the patient (for group of patients without treatment at randomisation) | ‐ | ‐ | 12.71% | 10.31% | ‐ | 2.4% | 23% | 1.2 |
| Patient education, education of physician via the patient where the patient did pass the information on to the physician (for group of patients without treatment at randomisation) | ‐ | ‐ | 15% | 10% | ‐ | 5% | 50% | 1.5 |
| Patient‐specific evidence‐based recommendations targeted to improve osteoporosis treatment to both the patients and their primary‐care providers | ‐ | ‐ | 29/52 (55.8%) | 16/60 (26.7%) | ‐ | 29.1% | 109% | 2.1 |
| (Cranney 2008)* Patient‐specific mailed letter to primary are physician (including guidelines) and patient education and reminder | ‐ | ‐ | 35/125 (28%) | 15/145 (10.3%) | ‐ | 17.7% (P=0.0002) | 171% | 2.7 |
| Patient‐specific Electronic Medical Record (EMR) reminders to primary‐care provider informing them of patient increased risk and guidelines. Sent twice. | ‐ | ‐ | 28/101 (27.7%) | 5/103 (5%) | ‐ | 22.9% (P< 0.01) | 471% | 5.7 |
| EMR reminder plus patient‐directed intervention: education and reminder | ‐ | ‐ | 22/110 (20.2%) | 5/103 (5%) | ‐ | 15.1% (P< 0.01) | 312% | 4.1 |
| (Lafata 2007)* Patient‐directed: x2 mailings (educational and reminders) | ‐ | ‐ | 11/128 (8.6%) | 3/51 (5.9%) | ‐ | 2.7% | 46% | 1.5 |
| (Lafata 2007)* Physician prompt: Electronic Medical Record (EMR) reminder to physician and biweekly mailing plus Patient‐directed: 2 mailings (educational and reminders) | ‐ | ‐ | 15/162 (9.3%) | 3/51 (5.9%) | ‐ | 3.4% | 57% | 1.6 |
| Physician reminder plus educational material | ‐ | ‐ | 200/1363 (14.7%) | 157/1480 (10.6%) | ‐ | 4.1% | 38% | 1.4 |
| Physician reminder plus educational material plus patient‐directed intervention (reminder to see their physician) | ‐ | ‐ | 234/1421 (16.5%) | 157/1480 (10.6%) | ‐ | 5.9% | 55% | 1.6 |
| Patient education, physician patient‐specific reminders by mail/fax, physician guidelines endorsed by opinion leaders | ‐ | ‐ | 30/137 (21.9%) | 10/135 (7.4%) | ‐ | 14.5% (P<0.001) | 196% | 3 |
| Verbal and written information on osteoporosis to patient and letter with specific management plan sent to their treating physician. Patient reminders at 6 and 12 months. Reminder to physician if patient untreated at 6 months | 82/275 (29.8%) | 45/199 (22.6%) | 151/275 (54.9%) | 71/199 (35.7%) | 12% | 19.2% (P< 0.005) | 54% | 1.5 |
| Verbal and written information on osteoporosis to patient and letter with specific management plan sent to their treating physician. Blood tests and BMD test ordered for patient and results sent to the physician. Patient reminders at 4,8 and 12 months and physician reminders at 4 and 8 months if patient remained untreated | 65/251 (25.9%) | 45/199 (22.6%) | 156/251 (62.2%) | 71/199 (35.7%) | 23.2% | 26.5% (P< 0.005) | 74% | 1.7 |
| Patient directed (x3 mailed letters educational) | ‐ | ‐ | 208/3274 (6.4%) | 231/3268 (7.1%) | ‐ | ‐0.7% | ‐10% | 0.9 |
| Physician education following an academic detailing approach | ‐ | ‐ | 197/3574 (5.5%) | 231/3268 (7.1%) | ‐ | ‐1.6% | ‐22% | 0.8 |
| Combination of both physician and patient education | ‐ | ‐ | 236/3339 (7.1%) | 231/3268 (7.1%) | ‐ | 0 | 0 | 1 |
| 1. Intervention group pre‐intervention proportion 2. Control group pre‐intervention proportion 3. Intervention group post‐intervention proportion 4. Control group post‐intervention proportion 5. ARD = [Int post (%) minus C post (%)] minus [Int pre (%) minus C pre (%)]. The direction of effect has been adjusted so that a positive result represents a beneficial intervention outcome, according to Grimshaw 2004. 6. Risk Difference (RD) is the absolute % change post‐intervention = Int post (%) minus C post (%). This is considered to be "small" if ≤ 5%, "modest" if > 5% and ≤10%,"moderate" if > 10% but ≤ 20%, and "large" if > 20%.The direction of effect has been adjusted so that a positive result represents a beneficial intervention outcome, according to Grimshaw 2004. 7. Relative % change post = absolute % change post divided by C post (%). The direction of effect has been adjusted so that a positive result represents a beneficial intervention outcome, according to Grimshaw 2004. 8. Risk ratio (RR) = Int post (%) divided by C post (%) BMD: bone mineral density; C: control group; Int: intervention group; ARD: adjusted risk difference; NS: not significant * The data reported above for the studies by Cranney 2008, Lafata 2007 and Solomon 2007b does not account for clustering. We did not have access to sufficient information to adjust the data for clustering. | ||||||||
| (Study) Interventions | Int 1 pre (%) 1 | Int 2 pre (%)2 | Int 1 post (%)3 | Int 2 post (%)4 | ARD 5 | Risk difference6 (P value if reported by authors) | Relative % change post 7 | Risk ratio 8 |
| Patient education, education of physician via the patient, reminder to family physician versus Patient education (including video on osteoporosis), education of physician via the patient, reminder to family physician | 14.72% | 15.81% | ‐1.1% | ‐7% | 0.9 | |||
| Patient‐specific letter to primary care physician containing information on results and recommendations: standard versus extended letter | ‐ | ‐ | 25/83 (30.1%) | 29/78 (37.2%) | ‐ | ‐7.1% | ‐19% | 0.8 |
| Patient‐specific Electronic Medical Record (EMR) reminders to primary‐care provider informing them of patient increased risk and guidelines (sent twice) versus EMR plus patient‐directed intervention (education and reminder) | ‐ | ‐ | 40/101 (39.6%) | 36/110 (32.7%) | ‐ | 6.9% | 21% | 1.2 |
| (Lafata 2007)** Patient‐directed: 2 mailings (educational and reminders) versus physician prompt: Electronic Medical Record (EMR) reminder to physician and biweekly mailing plus patient‐directed: 2 mailings (educational and reminders) | ‐ | ‐ | 720/3367 (21.4%) | 1181/4086 (28.9%) | ‐ | ‐7.5% | ‐26% | 0.7 |
| Physician reminder plus educational material versus physician reminder plus educational material plus patient‐directed intervention (reminder to see their physician) | ‐ | ‐ | 224/1363 (16.4%) | 258/1421 (18.2%) | ‐ | ‐1.7% (NS) | ‐9% | 0.9 |
| Patient‐specific letter to primary‐care physician outlining guidelines versus orthopaedic surgeon ordering BMD and forwarding results to primary‐care physician | 7/23 (30.4%) | 25/27(92.6%) | ‐ | ‐62.2% | ‐67% | 0.3 | ||
| (Solomon 2007a)** Patient‐directed (3 mailed letters educational) versus physician education following an academic‐detailing approach | ‐ | ‐ | 249/3274 (7.6%) | 183/3574 (5.1%) | ‐ | 2.5% | 49% | 1.5 |
| (Solomon 2007a)** Patient‐directed (3 mailed letters educational) versus combination of both physician and patient education | ‐ | ‐ | 249/3274 (7.6%) | 223/3339 (6.7%) | ‐ | 0.9% | 14% | 1.1 |
| (Solomon 2007a)** Physician education following an academic‐detailing approach versus combination of both physician and patient education | ‐ | ‐ | 183/3574 (5.1%) | 223/3339 (6.7%) | ‐ | ‐1.6% | ‐23% | 0.8 |
| 1. Intervention 1 group pre‐intervention proportion 2. Intervention 2 group pre‐intervention proportion 3. Intervention 1 group post‐intervention proportion 4. Intervention 2 group post‐intervention proportion 5. ARD = [Int 1 post (%) minus Int 2 post (%)] minus [Int 1 pre (%) minus Int 2 pre (%)]. The direction of effect has been adjusted so that a positive result represents a beneficial intervention 1 outcome, according to Grimshaw 2004. 6. Risk Difference (RD) is the absolute % change post‐intervention = Int 1 post (%) minus Int 2 post (%). This is considered to be "small" if ≤ 5%, "modest" if > 5% and ≤10%,"moderate" if > 10% but ≤ 20%, and "large" if > 20%.The direction of effect has been adjusted so that a positive result represents a beneficial intervention 1 outcome. 7. Relative % change post = absolute % change post divided by Int 2 post (%). The direction of effect has been adjusted so that a positive result represents a beneficial intervention 1 outcome, according to Grimshaw 2004. 8. Risk ratio (RR) = Int 1 post (%) divided by Int 2 post (%) BMD: bone mineral density; Int 1: intervention 1 group; Int 2: Intervention 2 group; ARD: adjusted risk difference; NS: not significant * In the study by Bessette 2011, the outcomes reported above include the participants with a diagnosis following the intervention. The women were considered "diagnosed" if they received a BMD test, if they were informed by their physician that they were suffering from osteoporosis and/or if they were initiated on osteoporosis medication. Therefore, the above percentages do not necessarily mean that the women received a BMD test. **The data reported above for the studies by Lafata 2007 and Solomon 2007b does not account for clustering. We did not have access to sufficient information to adjust the data for clustering. | ||||||||
| (Study) Interventions | Int 1 pre (%) 1 | Int 2 pre (%)2 | Int 1 post (%)3 | Int 2 post (%)4 | ARD 5 | Risk difference 6 (P value if reported by authors) | Relative % change post 7 | Risk ratio 8 |
| Patient education, education of physician via the patient, reminder to family physician (for group of patients without diagnosis or treatment at randomisation) versus Patient education (including video on osteoporosis), education of physician via the patient, reminder to family physician (for group of patients without diagnosis and treatment at randomisation) | ‐ | ‐ | 11.79% | 10.64% | ‐ | 1.2% | 11% | 1.1 |
| Patient education, education of physician via the patient, reminder to family physician (for group of patients without diagnosis or treatment at randomisation) versus Patient education (including video on osteoporosis), education of physician via the patient, reminder to family physician (for group of patients without treatment at randomisation) | ‐ | ‐ | 13.49% | 12.71% | ‐ | 0.8% | 6% | 1.1 |
| Patient‐specific letter to primary care physician containing information on results and recommendations: standard versus extended letter | ‐ | ‐ | 11/104 (10.6%) | 14/93 (15.1%) | ‐ | ‐4.5% | ‐30% | 0.7 |
| Patient specific Electronic Medical Record (EMR) reminders to primary care provider informing them of patient increased risk and guidelines (sent twice) versus EMR plus patient‐directed intervention (education and reminder). | ‐ | ‐ | 28/101 (27.7%) | 22/110 (20%) | ‐ | 7.7% | 39% | 1.4 |
| (Lafata 2007)* Patient‐directed: 2 mailings (educational and reminders) versus physician prompt: Electronic Medical Record (EMR) reminder to physician and biweekly mailing plus patient‐directed: 2 mailings (educational and reminders) | ‐ | ‐ | 11/128 (8.6%) | 15/162 (9.3%) | ‐ | ‐0.7% | ‐7% | 0.9 |
| Physician reminder plus educational material versus physician reminder plus educational material plus patient‐directed intervention (reminder to see their physician) | ‐ | ‐ | 200/1363 (14.7%) | 234/1421 (16.5%) | ‐ | ‐1.8% (NS) | ‐11% | 0.9 |
| Verbal and written information on osteoporosis to patient and letter with specific management plan sent to their treating physician. Patient reminders at 6 and 12 months. Reminder to physician if patient untreated at 6 months versus verbal and written information on osteoporosis to patient and letter with specific management plan sent to their treating physician. Blood tests and BMD test ordered for patient and results sent to the physician. Patient reminders at 4,8 and 12 months and physician reminders at 4 and 8 months if patient remained untreated | 82/275 (29.8%) | 65/251 (25.9%) | 151/275 (54.9%) | 156/251 (62.2%) | ‐11.2% | ‐7.2% (P<0.001) | ‐12% | 0.9 |
| Patient specific letter to primary care physician outlining guidelines versus orthopaedic surgeon ordering BMD and forwarding results to primary‐care physician | 6/23 (26.1%) | 20/27(74.1%) | ‐ | ‐48% | ‐65% | 0.4 | ||
| Patient directed (x3 mailed letters educational) versus physician education following an academic detailing approach | ‐ | ‐ | 208/3274 (6.4%) | 197/3574 (5.5%) | ‐ | 0.8% | 15% | 1.2 |
| Patient directed (x3 mailed letters educational) versus combination of both physician and patient education | ‐ | ‐ | 208/3274 (6.4%) | 236/3339 (7.1%) | ‐ | ‐0.7% | ‐10% | 0.9 |
| Physician education following an academic detailing approach versus combination of both physician and patient education | ‐ | ‐ | 197/3574 (5.5%) | 236/3339 (7.1%) | ‐ | ‐1.6% | ‐22% | 0.8 |
| 1. Intervention 1 group pre‐intervention proportion 2. Intervention 2 group pre‐intervention proportion 3. Intervention 1 group post‐intervention proportion 4. Intervention 2 group post‐intervention proportion 5. ARD = [Int 1 post (%) minus Int 2 post (%)] minus [Int 1 pre (%) minus Int 2 pre (%)]. The direction of effect has been adjusted so that a positive result represents a beneficial intervention 1 outcome, according to Grimshaw 2004. 6. Risk Difference (RD) is the absolute % change post‐intervention = Int 1 post (%) minus Int 2 post (%). This is considered to be "small" if ≤ 5%, "modest" if > 5% and ≤10%,"moderate" if > 10% but ≤ 20%, and "large" if > 20%.The direction of effect has been adjusted so that a positive result represents a beneficial intervention 1 outcome. 7. Relative % change post = absolute % change post divided by Int 2 post (%). The direction of effect has been adjusted so that a positive result represents a beneficial intervention 1 outcome, according to Grimshaw 2004. 8. Risk ratio (RR) = Int 1 post (%) divided by Int 2 post (%) BMD: bone mineral density; Int 1: intervention 1 group; Int 2: Intervention 2 group; ARD: Adjusted risk difference; NS: not significant * The data reported above for the studies by Lafata 2007 and Solomon 2007b does not account for clustering. We did not have access to sufficient information to adjust the data for clustering. | ||||||||
| (Study) Intervention | Outcome | Int pre (%) 1 | C pre (%)2 | Int post (%)3 | C post (%)4 | ARD 5 | Risk difference 6 (P value if reported by authors) | Relative % change post 7 | Risk ratio 8 |
| Physician education (guidelines) and 3 patient‐specific reminder letters | Education and reassurance according to guideline 0 ‐ 4 weeks post‐onset | ‐ | ‐ | 10% (16/162) | 7% (10/149) | 3.2% | 47% | 1.5 | |
| Exercise according to guideline 0 ‐ 4 weeks post‐onset | ‐ | ‐ | 38% (62/162) | 43% (64/149) | ‐4.7% | ‐11% | 0.9 | ||
| Appropriate medication according to guideline 0 ‐ 4 weeks post‐onset | ‐ | ‐ | 85% (138/162) | 77% (115/149) | 8% (P=0.14) | 10% | 1.1 | ||
| Spinal manipulation according to guideline 0 ‐ 4 weeks post‐onset | ‐ | ‐ | 2.5% (4/162) | 6% (9/149) | ‐3.6% | ‐59% | 0.4 | ||
| Guideline‐discordant physician recommended treatment 0 ‐ 4 weeks post‐onset | ‐ | ‐ | 10% (16/162) | 17% (25/149) | 6.9% (P=0.05) | 41% | 0.6 | ||
| Supervised exercise programme (recommended treatment 5 ‐ 12 weeks post‐onset) | ‐ | ‐ | 19% (29/154) | 14% (21/149) | 4.7% (P=0.11) | 34% | 1.3 | ||
| Return to work (recommended treatment 5 ‐ 12 weeks post‐onset) | ‐ | ‐ | 24% (37/154) | 17% (25/149) | 7.2% (P=0.18) | 43% | 1.4 | ||
| Refer to interdisciplinary programme (recommended treatment 5 ‐ 12 weeks post‐onset) | ‐ | ‐ | 4% (6/154) | 2% (3/149) | 1.9% | 94% | 1.9 | ||
| Physiotherapy > 4 weeks (guideline‐discordant) | ‐ | ‐ | 41% (63/154) | 43% (64/149) | 2% | 5% | 1 | ||
| Continued use of spinal manipulation therapy (guideline‐discordant) | ‐ | ‐ | ‐(no data available) | 33% (49/149) | ‐ (P=0.04) | ‐ | |||
| Physician education, reminders and also patient education and 3 reminders | Education and reassurance according to guideline 0 ‐ 4 weeks post‐onset | ‐ | ‐ | 6% (9/151) | 7% (10/149) | ‐0.8% | ‐11% | 0.9 | |
| Exercise according to guideline 0 ‐ 4 weeks post‐onset | ‐ | ‐ | 53% (80/151) | 43% (64/149) | 10% (P=0.05) | 23% | 1.2 | ||
| Appropriate medication according to guideline 0 ‐ 4 weeks post‐onset | ‐ | ‐ | 81% (122/151) | 77% (115/149) | 3.6% (P=0.08) | 5% | 1 | ||
| Spinal manipulation according to guideline 0 ‐ 4 weeks post‐onset | ‐ | ‐ | 5% (8/151) | 6% (9/149) | ‐0.7% | ‐12% | 0.9 | ||
| Guideline‐discordant physician recommended treatment 0 ‐ 4 weeks post‐onset | ‐ | ‐ | 18% (27/151) | 17% (25/149) | ‐1.1% | ‐7% | 1.1 | ||
| Supervised exercise programme (recommended treatment 5 ‐ 12 weeks post‐onset) | ‐ | ‐ | 18% (26/145) | 14% (21/149) | 3.8% (P=0.07) | 27% | 1.3 | ||
| Return to work (recommended treatment 5 ‐ 12 weeks post‐onset) | ‐ | ‐ | 23% (33/145) | 17% (25/149) | 6% (P=0.14) | 36% | 1.4 | ||
| Refer to interdisciplinary programme (recommended treatment 5 ‐ 12 weeks post‐onset) | ‐ | ‐ | 0 | 2% (3/149) | ‐2% | ‐100% | 0 | ||
| Physiotherapy > 4 weeks (guideline‐discordant) | ‐ | ‐ | 42% (61/145) | 43% (64/149) | 0.9% | 2% | 1 | ||
| Continued use of spinal manipulation therapy (guideline‐discordant) | ‐ | ‐ | 3% (4/145) | 33% (49/149) | 30.1% (P=0.05) | 92% | 0.1 | ||
| (Dey 2004)* Intervention (aimed at general practitioners): guidelines discussion (educational component), patient information leaflets, access to fast‐track physiotherapy and triage services for patients with persistent symptoms (organisational component) versus usual care (control)* | X‐ray referrals | 15.1% (43/284) | 13.7% (42/308) | ‐1.4% (P=0.62) | ‐10% | 1.1 | |||
| Sickness certificates | 17.9 % (34/190) | 19.2% (40/206) | 1.3% (P=0.74) | 7% | 0.9 | ||||
| Prescriptions for opioids or muscle relaxants | 18.6% (84/452) | 18.7% (92/491) | 0.1 (P=0.99) | 1 | 1 | ||||
| Referrals to secondary care | 3.4% (33/962) | 2.3% (24/1044) | ‐1.1% (P=0.12) | ‐49% | 1.5 | ||||
| Referrals to physiotherapy or educational programme | ‐ | ‐ | 26.3% (44/167) | 13.8% (25/181) | ‐ | ‐12.6% (P=0.01) | ‐91% | 1.9 | |
| (Engers 2005)** Intervention (aimed at general practitioners): guidelines on low back pain, 2‐hour workshop, 2 scientific articles, guidelines on low back pain for occupational physicians, tool for patient education and management‐decision tool. Control group: usual care | Referral to a therapist | ‐ | ‐ | 22.9% (75/328) | 27.4% (79/288) | ‐ | 4.6% | 17% | 0.8 |
| Prescription of pain medication on a time‐contingent basis | ‐ | ‐ | 70% (139/328) | 69% (130/288) | ‐ | 2.8% | 6% | 0.9 | |
| Handed patient information leaflet | ‐ | ‐ | 36.9% (121/328) | 38.2% (110/288) | ‐ | ‐1.3% | ‐3% | 1 | |
| Advised patient to stay active | ‐ | ‐ | 95.1% (312/328) | 89.2% (257/288) | ‐ | 5.9% | 7% | 1.1 | |
| Advised patient to gradually increase activity | ‐ | ‐ | 78% (256/328) | 65.3% (188/288) | ‐ | 12.8% | 20% | 1.2 | |
| Advised patient which activities to increase at what moment | ‐ | ‐ | 18% (58/328) | 9% (26/288) | ‐ | 8.7% | 96% | 2 | |
| (French 2013)*** Intervention (aimed at general practitioners): Interactive, educational workshops plus educational material disseminated (via DVDs); Control group: usual care** | Number of x‐ray requests out of total number of patients seen | ‐ | ‐ | 0.83% (67/8,085) | 1.02% (80/7,826) | 0.2% (P=0.2) | 19% | 0.8 | |
| Number of CT requests out of total number of patients seen | ‐ | ‐ | 0.61% (64/10,419) | 0.66% (66/10,085) | ‐ | 0.0% (P=0.6) | 7% | 0.9 | |
| Intervention (aimed at physicians): notification that patient was at a high risk of disability and guidelines on management. Control group: usual care | 3‐month work absence rates | ‐ | ‐ | 28.6% (8/28) | 24% (6/25) | ‐ | ‐4.6% (NS) | ‐19% | 1.2 |
| Intervention (aimed at physicians): guideline on low back pain, 90‐minute educational session on guideline implementation delivered by local opinion leaders and audit report summarising performance against the guideline plus outreach visit. Control group: usual care plus/minus patient education (pamphlet and video) | Lumbosacral X‐ray total utilisation (% of patients based on episode of care) | 31% | 21% | 19% | 18% | 9% | ‐1% | ‐6% | 1.1 |
| Lumbosacral X‐ray not consistent with guideline | 14.5% | 8.2% | 8.1% | 8.6% | 6.8% | 0.5% | 6% | 0.9 | |
| Lumbosacral CT/MRI total utilisation (% of patients based on episode of care) | 7.6% | 5.6% | 5.6% | 7.1% | 3.5% | 1.5% | 21% | 0.8 | |
| Lumbosacral CT/MRI not consistent with guideline | 5.7% | 3.5% | 3.5% | 5.4% | 4.1% | 1.9% | 35% | 0.6 | |
| Physical therapy referral total utilisation (% of patients based on episode of care) | 12% | 13% | 10% | 13% | 2% | 3% | 23% | 0.8 | |
| Physical therapy referral not consistent with guideline | 10% | 10.9% | 9.2% | 12% | 1.9% | 2.8% | 23% | 0.8 | |
| Specialty referral total utilisation (% of patients based on episode of care) | 12% | 5.9% | 8.6% | 7.1% | 4.6% | ‐1.5% | ‐21% | 1.2 | |
| Specialty referral not consistent with guideline | 9.5% | 4% | 7.1% | 5.6% | 4% | ‐1.5% | ‐27% | 1.3 | |
| 1. Intervention group pre‐intervention proportion 2. Control group pre‐intervention proportion 3. Intervention group post‐intervention proportion 4. Control group post‐intervention proportion 5. ARD = [Int post (%) minus C post (%)] minus [Int pre (%) minus C pre (%)]. The direction of effect has been adjusted so that a positive result represents a beneficial intervention outcome, according to Grimshaw 2004. 6. Risk Difference (RD) is the absolute % change post‐intervention = Int post (%) minus C post (%). This is considered to be "small" if ≤ 5%, "modest" if > 5% and ≤10%,"moderate" if > 10% but ≤ 20%, and "large" if > 20%.The direction of effect has been adjusted so that a positive result represents a beneficial intervention outcome, according to Grimshaw 2004. 7. Relative % change post = absolute % change post divided by C post (%). The direction of effect has been adjusted so that a positive result represents a beneficial intervention outcome, according to Grimshaw 2004. 8. Risk ratio (RR) = Int post (%) divided by C post (%) C: control group; Int: intervention group; ARD: adjusted risk difference; NS: not significant CT/MRI: computed tomography/magnetic resonance imaging * Dey 2004 reported the Intercluster Correlation (ICC) for the results (mean cluster size=95.1) and this was used to calculate the above effective sample sizes according to chapter 16.3.4 of the Cochrane Handbook, Higgins 2011a. ** The data reported above for the study by Engers 2005 does not account for clustering. We did not have access to sufficient information to adjust the data for clustering. ***French 2013 reported Intercluster Correlation (ICC for x‐rays 0.004 and for CTs 0.003, mean cluster size=2,154) and this was used to calculate the above effective sample sizes according to chapter 16.3.4 of the Cochrane Handbook, Higgins 2011a | |||||||||
| (Study) Intervention 1 versus intervention 2 | Outcome | Int 1 pre (%) 1 | Int 2 pre (%)2 | Int 1 post (%)3 | Int 2 post (%)4 | ARD 5 | Risk difference 6 (P value if reported by authors) | Relative % change post 7 | Risk ratio 8 |
| Physician education (guidelines) and 3 patient‐specific reminder letters versus physician education, reminders and also patient education and 3 reminders | Education and reassurance according to guideline 0 ‐ 4 weeks post‐onset | ‐ | ‐ | 10% (16/162) | 6% (9/151) | ‐ | 3.9% (NS) | 66% | 1.7 |
| Exercise according to guideline 0 ‐ 4 weeks post‐onset | ‐ | ‐ | 38% (62/162) | 53% (80/151) | ‐ | ‐14.7% (P=0.0083) | ‐28% | 0.7 | |
| Appropriate medication according to guideline 0 ‐ 4 weeks post‐onset | ‐ | ‐ | 85% (138/162) | 81% (122/151) | ‐ | 4.4% (NS) | 5% | 1.1 | |
| Spinal manipulation according to guideline 0 ‐ 4 weeks post‐onset | ‐ | ‐ | 2.5% (4/162) | 5% (13/151) | ‐ | ‐6.1% (P=0.018) | ‐71% | 0.3 | |
| Guideline‐discordant physician‐recommended treatment 0 ‐ 4 weeks post‐onset | ‐ | ‐ | 10% (16/162) | 18% (27/151) | ‐ | 8% (P=0.04) | 45% | 0.6 | |
| Supervised exercise programme (recommended treatment 5 ‐ 12 weeks post‐onset) | ‐ | ‐ | 19% (29/154) | 18% (26/145) | ‐ | 0.9% (NS) | 5% | 1.1 | |
| Return to work (recommended treatment 5 ‐ 12 weeks post‐onset) | ‐ | ‐ | 24% (37/154) | 23% (33/145) | ‐ | 1.3% (NS) | 6% | 1.1 | |
| Refer to interdisciplinary programme (recommended treatment 5 ‐ 12 weeks post‐onset) | ‐ | ‐ | 4% (6/154) | 0 | ‐ | 3.9% (P=0.02) | ‐ | ‐ | |
| Physiotherapy > 4 weeks (guideline‐discordant) | ‐ | ‐ | 41% (63/154) | 42% (61/145) | ‐ | 1.2% (NS) | 3% | 1 | |
| Continued use of spinal manipulation therapy (guideline‐discordant) | ‐ | ‐ | ‐ (no data available) | 3% (4/145) | ‐ | ‐ | ‐ | ‐ | |
| (Eccles 2001)* Feedback on number of spinal radiographs 6 months before and 6 months after the intervention plus guideline dissemination versus guideline dissemination | Lumbar spine radiographs concordant with guidelines | ‐ | ‐ | 35.4% (64/181) | 43.6% (120/275) | ‐ | ‐8.3% | ‐19% | 0.8 |
| (Eccles 2001)* Reminder messages on radiograph reports plus guideline dissemination versus guideline dissemination | Lumbar spine radiographs concordant with guidelines | ‐ | ‐ | 41.2% (35/85) | 43.6% (120/275) | ‐ | ‐2.5% | ‐6% | 0.9 |
| (Eccles 2001)* Feedback on number of spinal radiographs 6 months before and 6 months after the intervention plus guideline dissemination plus reminder messages on radiograph reports versus guideline dissemination | Lumbar spine radiographs concordant with guidelines | ‐ | ‐ | 36% (89/247) | 43.6% (120/275) | ‐ | ‐7.6% | ‐17% | 0.8 |
| (Eccles 2001)* Feedback on number of spinal radiographs 6 months before and 6 months after the intervention plus guideline dissemination versus reminder messages on radiograph reports plus guideline dissemination | Lumbar spine radiographs concordant with guidelines | ‐ | ‐ | 35.4% (64/181) | 41.2% (35/85) | ‐ | ‐5.8% | ‐14% | 0.9 |
| 1. Intervention 1 group pre‐intervention proportion 2. Intervention 2 group pre‐intervention proportion 3. Intervention 1 group post‐intervention proportion 4. Intervention 2 group post‐intervention proportion 5. ARD = [Int 1 post (%) minus Int 2 post (%)] minus [Int 1 pre (%) minus Int 2 pre (%)]. The direction of effect has been adjusted so that a positive result represents a beneficial intervention 1 outcome, according to Grimshaw 2004. 6. Risk Difference (RD) is the absolute % change post‐intervention = Int 1 post (%) minus Int 2 post (%). This is considered to be "small" if ≤ 5%, "modest" if > 5% and ≤10%,"moderate" if > 10% but ≤ 20%, and "large" if > 20%.The direction of effect has been adjusted so that a positive result represents a beneficial intervention 1 outcome. 7. Relative % change post = absolute % change post divided by Int 2 post (%). The direction of effect has been adjusted so that a positive result represents a beneficial intervention 1 outcome, according to Grimshaw 2004. 8. Risk ratio (RR) = Int 1 post (%) divided by Int 2 post (%) Int 1: intervention 1 group; Int 2: Intervention 2 group; ARD: Adjusted risk difference; NS: not significant *The data reported above for the study by Eccles 2001 does not account for clustering. We did not have access to sufficient information to adjust the data for clustering. | |||||||||
| (Study) Intervention 1 versus Intervention 2 | Outcome | Int 1 pre mean (SD)1 | Int 2 pre mean (SD)2 | Int 1 post mean (SD)3 | Int 2 post mean (SD)4 | MD 5 | Relative % change 6 | Adjusted relative % change7 | SMD8 (P value)9 |
| (Becker 2008*) Physician education: Guideline (in 4 versions including patient leaflet), 3 seminars and academic detailing versus guideline dissemination | Functional capacity measured by Hannover Functional Ability Questionnaire at 6 months | ‐ | ‐ | 72.9 | 70.3 | 2.7 | 4% | ‐ | 0.1 (P=0.12) |
| (Becker 2008*) Physician education (as above) plus practice nurse training in motivational counselling versus guideline dissemination | Functional capacity measured by Hannover Functional Ability Questionnaire at 6 months | ‐ | ‐ | 73.9 | 70.3 | 3.6 | 5% | ‐ | 0.2 (P=0.032) |
| (Becker 2008*) Physician education: Guideline (in 4 versions including patient leaflet), 3 seminars and academic detailing versus guideline dissemination | Days in pain at 6 months | ‐ | ‐ | 63.3 | 80.8 | 17.4 | 22% | ‐ | 0.2 (P=0.002) |
| (Becker 2008*) Physician education (as above) plus practice nurse training in motivational counselling versus guideline dissemination | Days in pain at 6 months | ‐ | ‐ | 62.9 | 80.8 | 17.9 | 22% | ‐ | 0.2 (P=0.001) |
| (Becker 2008*) Physician education: Guideline (in 4 versions including patient leaflet), 3 seminars and academic detailing versus guideline dissemination | Overall activity at 6 months | ‐ | ‐ | 36.5 | 33.5 | 3 | 9% | ‐ | 0.1 (P=0.203) |
| (Becker 2008*) Physician education (as above) plus practice nurse training in motivational counselling versus guideline dissemination | Overall activity at 6 months | ‐ | ‐ | 36.3 | 33.5 | 2.8 | 8% | ‐ | 0.1 (P=0.230) |
| (Becker 2008*) Physician education: Guideline (in 4 versions including patient leaflet), 3 seminars and academic detailing versus guideline dissemination | Days of sick leave at 6 months | ‐ | ‐ | 13 | 14.3 | 1.3 | 9% | ‐ | 0 (P=0.569) |
| (Becker 2008*) Physician education (as above) plus practice nurse training in motivational counselling versus guideline dissemination | Days of sick leave at 6 months | ‐ | ‐ | 13 | 14.3 | 1.3 | 9% | ‐ | 0 (P=0.584) |
| (Becker 2008*) Physician education: Guideline (in 4 versions including patient leaflet), 3 seminars and academic detailing versus guideline dissemination | Quality of life at 6 months | ‐ | ‐ | 66.6 | 66.8 | ‐0.3 | 0% | ‐ | 0 (P=0.847) |
| (Becker 2008*) Physician education (as above) plus practice nurse training in motivational counselling versus guideline dissemination | Quality of life at 6 months | ‐ | ‐ | 67.5 | 66.8 | 0.7 | 1% | ‐‐ | 0 (P=0.602) |
| (Becker 2008*) Physician education: Guideline (in 4 versions including patient leaflet), 3 seminars and academic detailing versus guideline dissemination | Functional capacity measured by Hannover Functional Ability Questionnaire at 12 months | ‐ | ‐ | 73 | 71.6 | 1.4 | 2% | ‐ | 0.1 (P=0.446) |
| (Becker 2008*) Physician education (as above) plus practice nurse training in motivational counselling versus guideline dissemination | Functional capacity measured by Hannover Functional Ability Questionnaire at 12 months | ‐ | ‐ | 74.6 | 71.6 | 3.1 | 4% | ‐ | 0.1 (P=0.088) |
| (Becker 2008*) Physician education: Guideline (in 4 versions including patient leaflet), 3 seminars and academic detailing versus guideline dissemination | Days in pain at 12 months | ‐ | ‐ | 58.5 | 71.3 | 12.8 | 18% | ‐ | 0.2 (P=0.018) |
| (Becker 2008*) Physician education (as above) plus practice nurse training in motivational counselling versus guideline dissemination | Days in pain at 12 months | ‐ | ‐ | 61.6 | 71.3 | 9.8 | 14% | ‐ | 0.1 (P=0.067) |
| (Becker 2008*) Physician education: Guideline (in 4 versions including patient leaflet), 3 seminars and academic detailing versus guideline dissemination | Overall activity at 12 months | ‐ | ‐ | 46.4 | 42.9 | 3.5 | 8% | ‐ | 0.1 (P=0.202) |
| (Becker 2008*) Physician education (as above) plus practice nurse training in motivational counselling versus guideline dissemination | Overall activity at 12 months | ‐ | ‐ | 45.4 | 42.9 | 2.5 | 6% | ‐ | 0.1 (P=0.396) |
| (Becker 2008*) Physician education: Guideline (in 4 versions including patient leaflet), 3 seminars and academic detailing versus guideline dissemination | Days of sick leave at 12 months | ‐ | ‐ | 6.2 | 9.3 | 3.1 | 34% | ‐ | 0.1 (P=0.256) |
| (Becker 2008*) Physician education (as above) plus practice nurse training in motivational counselling versus guideline dissemination | Days of sick leave at 12 months | ‐ | ‐ | 6.5 | 9.3 | 2.8 | 30% | ‐ | 0.1 (P=0.320) |
| (Becker 2008*) Physician education: Guideline (in 4 versions including patient leaflet), 3 seminars and academic detailing versus guideline dissemination | Quality of life at 12 months | ‐ | ‐ | 68.5 | 67.7 | 0.8 | 1% | ‐ | 0 (P=0.535) |
| (Becker 2008*) Physician education (as above) plus practice nurse training in motivational counselling versus guideline dissemination | Quality of life at 12 months | ‐ | ‐ | 70.4 | 67.7 | 2.7 | 4% | ‐ | 0.1 (P=0.036) |
| (Becker 2008*) Physician education: Guideline (in 4 versions including patient leaflet), 3 seminars and academic detailing vs physician education plus practice nurse training in motivational counselling | Functional capacity measured by Hannover Functional Ability Questionnaire at 6 months | ‐ | ‐ | 72.9 | 73.9 | ‐1 | ‐1% | ‐ | 0 (NR) |
| (Becker 2008*) Physician education: Guideline (in 4 versions including patient leaflet), 3 seminars and academic detailing vs physician education plus practice nurse training in motivational counselling | Days in pain at 6 months | ‐ | ‐ | 63.3 | 62.9 | ‐0.4 | ‐1% | ‐ | 0 (NR) |
| (Becker 2008*) Physician education: Guideline (in 4 versions including patient leaflet), 3 seminars and academic detailing vs physician education plus practice nurse training in motivational counselling | Overall activity at 6 months | ‐ | ‐ | 36.5 | 36.3 | 0.2 | 0% | ‐ | 0 (NR) |
| (Becker 2008*) Physician education: Guideline (in 4 versions including patient leaflet), 3 seminars and academic detailing vs Physician education plus practice nurse training in motivational counselling | Days of sick leave at 6 months | ‐ | ‐ | 13 | 13.1 | 0.1 | 0% | ‐ | 0 (NR) |
| (Becker 2008*) Physician education: Guideline (in 4 versions including patient leaflet), 3 seminars and academic detailing vs Physician education plus practice nurse training in motivational counselling | Quality of life at 6 months | ‐ | ‐ | 66.6 | 67.5 | ‐0.9 | ‐1% | ‐ | 0 (NR) |
| (Becker 2008*) Physician education: Guideline (in 4 versions including patient leaflet), 3 seminars and academic detailing vs Physician education plus practice nurse training in motivational counselling | Functional capacity measured by Hannover Functional Ability Questionnaire at 12 months | ‐ | ‐ | 73 | 74.6 | ‐1.7 | ‐2% | ‐ | ‐0.1 (NR) |
| (Becker 2008*) Physician education: Guideline (in 4 versions including patient leaflet), 3 seminars and academic detailing vs Physician education plus practice nurse training in motivational counselling | Days in pain at 12 months | ‐ | ‐ | 58.5 | 61.6 | 3.1 | 5% | ‐ | 0 (NR) |
| (Becker 2008*) Physician education: Guideline (in 4 versions including patient leaflet), 3 seminars and academic detailing vs Physician education plus practice nurse training in motivational counselling | Overall activity at 12 months | ‐ | ‐ | 46.4 | 45.4 | 1 | 2% | ‐ | 0 (NR) |
| (Becker 2008*) Physician education: Guideline (in 4 versions including patient leaflet), 3 seminars and academic detailing vs Physician education plus practice nurse training in motivational counselling | Days of sick leave at 12 months | ‐ | ‐ | 6.2 | 6.458 | 0.3 | 5% | ‐ | 0 (NR) |
| (Becker 2008*) Physician education: Guideline (in 4 versions including patient leaflet), 3 seminars and academic detailing vs Physician education plus practice nurse training in motivational counselling | Quality of life at 12 months | ‐ | ‐ | 68.5 | 70.4 | ‐1.9 | ‐3% | ‐ | ‐0.1 (NR) |
| (Eccles 2001)* Feedback on number of spinal radiographs 6 months before and 6 months after the intervention plus guideline dissemination versus guideline dissemination | Number of lumbar spine radiographs per 1000 patients | 7.24 (4.8) | 7.53 (4.1) | 5.97 (4.2) | 6.80 (4.3) | 0.83 | 12% | 8% | 0.2 (NR) |
| (Eccles 2001)* Reminder messages on radiograph reports plus guideline dissemination versus guideline dissemination | Number of lumbar spine radiographs per 1000 patients | 7.31 (5.2) | 7.53 (4.1) | 5.14 (3.7) | 6.80 (4.3) | 1.66 | 24% | 21% | 0.4 (P=0.05) |
| (Eccles 2001)* Feedback on number of spinal radiographs 6 months before and 6 months after the intervention plus guideline dissemination plus reminder messages on radiograph reports versus guideline dissemination | Number of lumbar spine radiographs per 1000 patients | 8.30 (5.1) | 7.53 (4.1) | 5.23 (3.7) | 6.80 (4.3) | 1.57 | 23% | 34% | 0.4 (NR) |
| (Eccles 2001)* Feedback on number of spinal radiographs 6 months before and 6 months after the intervention plus guideline dissemination versus reminder messages on radiograph reports plus guideline dissemination | Number of lumbar spine radiographs per 1000 patients | 7.24 (4.8) | 7.31 (5.2) | 5.97 (4.2) | 5.14 (3.7) | ‐0.83 | ‐16% | ‐18% | ‐0.2 (NR) |
| 1. Intervention 1 group pre‐intervention mean (standard deviation) 2. Intervention 2 group pre‐intervention mean (standard deviation) 3. Intervention 1 group post‐intervention mean (standard deviation) 4. Intervention 2 group postintervention mean (standard deviation) 5. Mean Difference (MD)=Difference between post‐intervention means. The direction of effect has been adjusted so that a positive result represents a beneficial intervention 1 outcome, according to Grimshaw 2004. 6. Relative percentage change post‐intervention = (Int1 post mean ‐ Int2 post mean)/Int2 post mean. The direction of effect has been adjusted so that a positive result represents a beneficial intervention 1 outcome, according to Grimshaw 2004. 7. Adjusted relative percentage change= (Int1 post mean‐Int2 post mean)‐(Int1 pre mean ‐ Int2 pre mean)/Int2 post mean. The direction of effect has been adjusted so that a positive result represents a beneficial intervention 1 outcome. 8. SMD=Standardised Mean Difference=(Int1 post mean‐Int2 post mean)/SD pooled. The direction of effect has been adjusted so that a positive result represents a beneficial intervention 1 outcome, according to Grimshaw 2004. 9. P value reported by study authors Int 1: intervention 1 group; Int 2: Intervention 2 group; NR: not reported; SD: standard deviation *The data reported above for Becker 2008 and Eccles 2001 was adjusted for clustering by the authors | |||||||||
| Study | Intervention | Outcome | Mean pre (SD) | Mean post (SD) | Mean post minus mean pre | Relative % change pre to post | SMD pre to post | Mean change in level (p value) | Mean change in slope (p value) |
| Educational material | Back x‐rays ordered | 1133 (50) | 1208.7 (111.5) | ‐75.7 | ‐6.7 | ‐1.51 | ‐121.5 (P = 0.167) | 6.8 (P = 0.776) |
| (Study) Intervention | Outcome | Int pre mean (SD)1 | C pre mean (SD)2 | Int post mean (SD)3 | C post mean (SD)4 | MD 5 | Relative % change 6 | Adjusted relative % change7 | SMD8 (P value)9 |
| GP training on relationships and communication, pain evaluation, prescription and negotiation of a patient contract delivered in a 4‐hour interactive session plus 8 reminders on recommendations | Pain relief (SPID) | ‐ | ‐ | 315.6 (289.5) | 264.7 (242.9) | 50.9 | 19% | 19% | 0.2 (P< 0.0001) |
| Intensity of pain in motion on VAS | 63.7 (13.8) | 62.8 (13.5) | ‐29 (23.1) | ‐24.8 (21.1) | 4.2 | 17% | ‐21% | 0.2 (P=0.01) | |
| Lequesne Index | 9.2 (2.9) | 9.8 (3.2) | ‐2.5 (2.5) | ‐2.0 (2.4) | 0.5 | 25% | 5% | 0.2 (P< 0.0001) | |
| WOMAC index pain | 9.3 (3.0) | 9.6 (2.8) | ‐2.9 (3.4) | ‐2.2 (2.9) | 0.7 | 32% | ‐18% | 0.2 (P< 0.0001) | |
| WOMAC index stiffness | 4.1 (1.4) | 4.0 (1.4) | ‐1.2 (1.6) | ‐0.8 (1.4) | 0.4 | 50% | ‐62% | 0.3 (P=0.0004) | |
| WOMAC index physical function | 31.2 (10.9) | 32.8 (9.5) | ‐8.7 (10.7) | ‐6.1 (8.8) | 2.6 | 43% | ‐16% | 0.3 (P< 0.0001) | |
| WOMAC index global score | 44.6 (14.4) | 46.4 (12.5) | ‐12.9 (14.8) | ‐9.2 (12.2) | 3.7 | 40% | ‐21% | 0.3 (P< 0.0001) | |
| Acetaminophen consumption | ‐ | ‐ | 3400 (800) | 2900 (900) | ‐500 | ‐17% | ‐17% | ‐0.6 (P< 0.0001) | |
| Intervention (aimed at GPs): 2 interactive 8‐hour meetings focusing on arthritis self management, guideline dissemination and patient information material versus control (usual care) | Quality of life (AIMS2‐SF scores) Lower body | 2.67 (1.88) | 2.65 (1.85) | 2.48 | 2.62 | ‐0.14 | ‐5% | ‐6% | ‐0.1 (P=0.349) |
| Quality of life (AIMS2‐SF scores) Upper body | 1.47 (2.25) | 1.33 (2.09) | 1.43 | 1.34 | 0.09 | 7% | ‐4% | 0.1 P=0.694) | |
| Quality of life (AIMS2‐SF scores) Symptom | 4.87 (2.13) | 4.81 (2.18) | 4.51 | 4.72 | ‐0.21 | ‐4% | ‐6% | ‐0.2 (P=0.119) | |
| Quality of life (AIMS2‐SF scores) Affect | 2.89 (1.35) | 2.88 (1.33) | 2.92 | 2.83 | 0.09 | 3% | 3% | 0.1 (P=0.610) | |
| Quality of life (AIMS2‐SF scores) Social | 4.52 (1.88) | 4.69 (1.80) | 4.43 | 4.62 | ‐0.19 | ‐4% | 0% | ‐0.3 P=0.776 | |
| GP contacts | 4.56 (6.13) | 4.82 (6.00) | 4.44 | 4.6 | 0.16 | 3% | ‐2% | 0.1 (P=0.339) | |
| Referrals to orthopaedics | 1.58 (3.43) | 1.76 (3.52) | 1.49 | 1.75 | 0.26 | 15% | 5% | 0.8 (P=0.153) | |
| Radiographs | 0.82 (3.12) | 0.79 (2.78) | 0.75 | 0.85 | 0.1 | 12% | 15% | 0.2 (P=0.05) | |
| Non‐medical practitioners | 0.11 (3.01) | 0.36 (3.28) | 0.09 | 0.32 | 0.23 | 72% | ‐6% | 0.6 (P=0.687) | |
| Physiotherapy | 4.70 (9.10) | 5.81 (11.10) | 4.63 | 5.77 | 1.14 | 20% | 1% | 2 (P=0.242) | |
| Acupuncture | 0.83 (3.45) | 0.97 (3.80) | 0.8 | 0.97 | 0.17 | 18% | 3% | 0.2 (P=0.821) | |
| Intervention (aimed at GPs) as above plus patient case management via telephone by practice nurses versus control (usual care) | Quality of life (AIMS2‐SF scores) Lower body | 3.01 (2.11) | 2.65 (1.85) | 2.61 | 2.62 | ‐0.01 | 0% | ‐14% | 0 (P=0.049) |
| Quality of life (AIMS2‐SF scores) Upper body | 1.68 (2.44) | 1.33 (2.09) | 1.62 | 1.34 | 0.28 | 21% | ‐5% | 0.2 (P=0.621) | |
| Quality of life (AIMS2‐SF scores) Symptom | 5.02 (2.29) | 4.81 (2.18) | 4.42 | 4.72 | ‐0.3 | ‐6% | ‐11% | ‐0.2 (P=0.048) | |
| Quality of life (AIMS2‐SF scores) Affect | 3.04 (1.39) | 2.88 (1.33) | 2.98 | 2.83 | 0.15 | 5% | 0% | 0.2 (P=0.691) | |
| Quality of life (AIMS2‐SF scores) Social | 4.79 (1.80) | 4.69 (1.80) | 4.736 | 4.62 | 0.116 | 3% | 0% | 0.1 (P< 0.001) | |
| GP contacts | 5.01 (5.78) | 4.82 (6.00) | 4.9 | 4.6 | ‐0.3 | ‐7% | ‐2% | ‐0.2 (P=0.823) | |
| Referrals to orthopaedics | 1.76 (3.52) | 1.76 (3.52) | 1.52 | 1.75 | 0.23 | 13% | 13% | 0.2 (P=0.044) | |
| Radiographs | 0.80 (3.01) | 0.79 (2.78) | 0.71 | 0.85 | 0.14 | 16% | 18% | 0.4 (P=0.031) | |
| Non‐medical practitioners | 0.50 (4.20) | 0.36 (3.28) | 0.47 | 0.32 | ‐0.15 | ‐47% | ‐3% | ‐0.4 (P=0.225) | |
| Physiotherapy | 5.22 (10.03) | 5.81 (11.10) | 5.08 | 5.77 | 0.69 | 12% | 2% | 1.3 (P=0.129) | |
| Acupuncture | 0.77 (3.99) | 0.97 (3.80) | 0.72 | 1.09 | 0.37 | 34% | 16% | 0.4 (P=0.769) | |
| (Stross 1985)** Intervention: Educationally‐influential physicians (EIs) led education of primary‐care physicians: self‐study programme including textbook, audiovisual materials and recent articles on osteoarthritis versus control (usual care) | Length of stay for OA patients | 8.8 | 8.4 | 8.4 | 8.6 | 0.2 | 2% | 7% | NR |
| Length of stay for total hip arthroplasty (THA) patients | 17.2 | 16.6 | 15.2 | 16.0 | 0.8 | 5% | 9% | NR | |
| 1. Intervention group pre‐intervention mean (standard deviation) 2. Control group pre‐intervention mean (standard deviation) 3. Intervention group post‐intervention mean (standard deviation) 4. Control group pos‐tintervention mean (standard deviation) 5. Mean Difference (MD)=Difference between post‐intervention means. The direction of effect has been adjusted so that a positive result represents a beneficial intervention outcome, according to Grimshaw 2004. 6. Relative percentage change post‐intervention = (Int post mean ‐ Control post mean)/Control post mean 7. Adjusted relative percentage change= (Int post mean‐Control post mean)‐(Int pre mean ‐ Control pre mean)/Control post mean. The direction of effect has been adjusted so that a positive result represents a beneficial intervention outcome. 8. SMD=Standardised Mean Difference=(Int post mean‐Control post mean)/SD pooled. The direction of effect has been adjusted so that a positive result represents a beneficial intervention outcome, according to Grimshaw 2004. 9. P value reported by study authors AIMS2‐SF: Arthritis Impact Measurement Scales Short Form * There are potential unit of analysis errors in the reported results as the study did not account for clustering and did not provide sufficient data to allow an approximate analysis according to chapter 16.3.4 of the Cochrane Handbook, Higgins 2011a. **The study did not report standard deviations and therefore we were unable to calculate the SMD. There are potential unit of analysis errors in the reported results as the study did not account for clustering and did not provide sufficient data to allow an approximate analysis according to chapter 16.3.4 of the Cochrane Handbook, Higgins 2011a. | |||||||||
| (Study) Intervention | Outcome | Int pre (%) 1 | C pre (%)2 | Int post (%)3 | C post (%)4 | ARD 5 | Risk difference 6 (P Value if reported by authors) | Relative % change post 7 | Risk ratio 8 |
| (Rahme 2005)* Intervention (aimed at GPs): 90‐minute workshop on management of osteoarthritis versus control group (usual care) | Number of adequate prescription, according to the guidelines | 51% (273/536) | 47% (675/1437) | 56% (251/450) | 49% (593/1209) | 3% | 7% | 14% | 1.1 |
| (Rahme 2005)* Intervention (aimed at GPs): decision tree on treatment choices for osteoarthritis patients versus control (usual care) | Number of adequate prescription, according to the guidelines | 51% (799/1569) | 47% (675/1437) | 54% (712/1317) | 49% (593/1209) | 1% | 5% | 10% | 1.1 |
| (Rahme 2005)* Intervention (aimed at GPs): 90‐minute workshop and decision tree as above versus control (usual care) | Number of adequate prescription, according to the guidelines | 58% (1022/1776) | 47% (675/1437) | 62% (1008/1634) | 49% (593/1209) | 2% | 13% | 26% | 1.3 |
| Intervention (aimed at GPs): 2 interactive 8‐hour meetings focusing on arthritis self management, guideline dissemination and patient information material versus control (usual care) | Paracetamol prescriptions | 8.9% (31/345) | 6.6% (22/332) | 16.4% | 5.3% | 8.7% | 11.1% (<0.001) | 209% | 3.1 |
| Opioids | 5.8% (20/345) | 6.9% (23/332) | 10.1% | 7.9% | 3.4% | 2.2% (NS) | 28% | 1.3 | |
| NSAID | 40% (138/345) | 41.9% (139/332) | 44.3% | 44.2% | 2.0% | 0.1% (NS) | 23% | 1.0 | |
| Homeopathics | 6.1% (21/345) | 8.1% (27/332) | 7.7% | 9.8% | ‐0.1% | ‐2.2% (NS) | ‐22% | 0.8 | |
| Intervention (aimed at GPs) as above plus patient case management via telephone by practice nurses versus control (usual care) | Paracetamol prescriptions | 7.3% (25/345) | 6.6% (22/332) | 14.1% | 5.3% | 8.2% | 8.8% (<0.01) | 166% | 2.7 |
| Opioids | 7.3% (25/345) | 6.9% (23/332) | 16.0% | 7.9% | 7.8% | 8.1% (< 0.01) | 102% | 2.0 | |
| NSAID | 43.3% (149/345) | 41.9% (139/332) | 49.7% | 44.2% | 4.3% | 5.6% (0.019) | 13% | 1.1 | |
| Homeopathics | 6.7% (23/345) | 8.1% (27/332) | 9.6% | 9.8% | 1.2% | ‐0.2% (NS) | ‐2% | 1.0 | |
| (Stross 1985)* Intervention: Educationally‐influential physicians (EIs) led education of primary‐care physicians: self‐study programme including textbook, audiovisual materials and recent articles on osteoarthritis versus control (usual care) | Management of OA patients with aspirin | 39% (9/23) | 50% (9/18) | 20% (6/30) | 28% (5/18) | 3% | ‐8% | ‐28% | 0.7 |
| Management of OA patients with NSAIDs | 83% (19/23) | 78% (14/18) | 87% (26/30) | 94% (17/18) | ‐13% | ‐8% | ‐8% | 0.9 | |
| Management of OA patients with systemic corticosteroids | 13% (3/23) | 17% (3/18) | 3% (1/30) | 22% (4/18) | 15% | 19% (< 0.05) | 85% | 0.2 | |
| Management of OA patients with intra‐articular corticosteroids | 17% (4/23) | 11% (2/18) | 40% (12/30) | 11% (2/18) | 23% | 29% (<0.05) | 260% | 3.6 | |
| Management of OA patients with physical therapy | 87% (20/23) | 83% (15/18) | 93% (28/30) | 83% (15/18) | 6% | 10% | 12% | 1.1 | |
| Referral of OA patients | 39% (9/23) | 39% (7/18) | 30% (9/30) | 33% (6/18) | ‐4% | 3% | 10% | 0.9 | |
| Pre‐op physical therapy of THA patients | 56% (10/18) | 46% (12/26) | 97% (35/36) | 40% (12/30) | 48% | 57% (< 0.05) | 143% | 2.4 | |
| Post‐op narcotics of THA patients | 72% (13/18) | 77% (20/26) | 89% (32/36) | 93% (28/30) | 0% | 4% | 5% | 1.0 | |
| Post‐op physical therapy of THA patients | 100% (18/18) | 100% (26/26) | 100% (36/36) | 100% (30/30) | 0% | 0% | 0% | 1.0 | |
| Post‐op complications of THA patients | 11% (2/18) | 15% (4/26) | 6% (2/36) | 13% (4/30) | 4% | 8% | 58% | 0.4 | |
| 1. Intervention group pre‐intervention proportion 2. Control group pre‐intervention proportion 3. Intervention group post‐intervention proportion 4. Control group post‐intervention proportion 5. ARD = [Int post (%) minus C post (%)] minus [Int pre (%) minus C pre (%)]. The direction of effect has been adjusted so that a positive result represents a beneficial intervention outcome, according to Grimshaw 2004. 6. Risk Difference (RD) is the absolute % change post‐intervention = Int post (%) minus C post (%). This is considered to be "small" if ≤ 5%, "modest" if > 5% and ≤10%,"moderate" if > 10% but ≤ 20%, and "large" if > 20%.The direction of effect has been adjusted so that a positive result represents a beneficial intervention outcome, according to Grimshaw 2004. 7. Relative % change post = absolute % change post divided by C post (%). The direction of effect has been adjusted so that a positive result represents a beneficial intervention outcome, according to Grimshaw 2004. 8. Risk ratio (RR) = Int post (%) divided by C post (%) C: control group; Int: intervention group; ARD: Adjusted risk difference; NS: not significant NSAID: non‐steroidal anti‐inflammatory drug, THA: total hip arthroplasty * There are unit of analysis errors in the reported results because the available data did not account for the effect of clustering. | |||||||||
| (Study) Intervention 1 versus intervention 2 | Outcome | Int 1 pre (%) 1 | Int 2 pre (%)2 | Int 1 post (%)3 | Int 2 post (%)4 | ARD 5 | Risk difference 6 (P value if reported by authors) | Relative % change post 7 | Risk ratio 8 |
| (Rahme 2005)* Intervention 1 (aimed at GPs): 90‐minute workshop on management of osteoarthritis versus Intervention 2 (aimed at GPs): decision tree on treatment choices for osteoarthritis patients | Number of adequate prescription, according to the guidelines | 51% (273/536) | 51% (799/1569) | 56% (251/450) | 54% (712/1317) | 1.7% | 1.7% | 3% | 1 |
| (Rahme 2005)* Intervention 1 (aimed at GPs): 90‐minute workshop on management of osteoarthritis versus Intervention 2 (aimed at GPs): 90‐minute workshop and decision tree | Number of adequate prescription, according to the guidelines | 51% (273/536) | 58% (1022/1776) | 56% (251/450) | 62% (1008/1634) | 0.7% | ‐5.9% | ‐10% | 0.9 |
| (Rahme 2005)* Intervention 1 (aimed at GPs):decision tree on treatment choices for osteoarthritis patients versus Intervention 2 (aimed at GPs): 90‐minute workshop and decision tree | Number of adequate prescription, according to the guidelines | 51% (799/1569) | 58% (1022/1776) | 54% (712/1317) | 62% (1008/1634) | ‐1% | ‐7.6% | ‐12% | 0.9 |
| Intervention (aimed at GPs): 2 interactive 8‐hour meetings focusing on arthritis self management, guideline dissemination and patient information material versus Intervention (aimed at GPs) as above plus patient case management via telephone by practice nurses | Paracetamol prescriptions | 8.9% (31/345) | 7.3% (25/345) | 16.4% | 14.1% | 0.5% | 2.3% | 16% | 1.2 |
| Opioids | 5.8% (20/345) | 7.3% (25/345) | 10.1% | 16.0% | ‐4.5% | ‐5.9% | ‐37% | 1.2 | |
| NSAID | 40% (138/345) | 43.3% (149/345) | 44.3% | 49.7% | ‐2.2% | ‐5.4% | ‐11% | 1.2 | |
| Homeopathics | 6.1% (21/345) | 6.7% (23/345) | 7.7% | 9.6% | ‐1.4% | ‐1.9% | ‐20% | 1.2 | |
| 1. Intervention 1 group pre‐intervention proportion 2. Intervention 2 group pre‐intervention proportion 3. Intervention 1 group post‐intervention proportion 4. Intervention 2 group post‐intervention proportion 5. ARD = [Int 1 post (%) minus Int 2 post (%)] minus [Int 1 pre (%) minus Int 2 pre (%)]. The direction of effect has been adjusted so that a positive result represents a beneficial intervention 1 outcome, according to Grimshaw 2004. 6. Risk Difference (RD) is the absolute % change post‐intervention = Int 1 post (%) minus Int 2 post (%). This is considered to be "small" if ≤ 5%, "modest" if > 5% and ≤10%,"moderate" if > 10% but ≤ 20%, and "large" if > 20%.The direction of effect has been adjusted so that a positive result represents a beneficial intervention 1 outcome. 7. Relative % change post = absolute % change post divided by Int 2 post (%). The direction of effect has been adjusted so that a positive result represents a beneficial intervention 1 outcome, according to Grimshaw 2004. 8. Risk ratio (RR) = Int 1 post (%) divided by Int 2 post (%) Int 1: intervention 1 group; Int 2: Intervention 2 group; ARD: adjusted risk difference; NS: not significant, NSAID: non‐steroidal anti‐inflammatory drug * There are unit of analysis errors in the reported results because the available data did not account for the effect of clustering. | |||||||||
| (Study) Intervention 1 versus Intervention 2 | Outcome | Int 1 pre mean (SD)1 | Int 2 pre mean (SD)2 | Int 1 post mean (SD)3 | Int 2 post mean (SD)4 | MD 5 | Relative % change 6 | Adjusted relative % change7 | SMD8 (P value)9 |
| Intervention (aimed at GPs): 2 interactive 8‐hour meetings focusing on arthritis self management, guideline dissemination and patient information material versus Intervention (aimed at GPs) as above plus patient case management via telephone by practice nurses | Quality of life (AIMS2‐SF scores) Lower body | 2.67 (1.88) | 3.01 (2.11) | 2.48 (1.1) | 2.61 (1.4) | ‐0.13 | ‐5% | 0% | ‐0.1 |
| Quality of life (AIMS2‐SF scores) Upper body | 1.47 (2.25) | 1.68 (2.44) | 1.43 (1.5) | 1.62 (1.3) | ‐0.19 | ‐12% | ‐6% | ‐0.1 | |
| Quality of life (AIMS2‐SF scores) Symptom | 4.87 (2.13) | 5.02 (2.29) | 4.51 (1.0) | 4.42 (1.8) | 0.09 | 2% | 12% | 0.1 | |
| Quality of life (AIMS2‐SF scores) Affect | 2.89 (1.35) | 3.04 (1.39) | 2.92 (0.8) | 2.98 (0.9) | ‐0.06 | ‐2% | ‐1% | ‐0.1 | |
| Quality of life (AIMS2‐SF scores) Social | 4.52 (1.88) | 4.79 (1.80) | 4.43 (0.6) | 4.736 (1.2) | ‐0.31 | ‐6% | ‐25% | ‐0.3 | |
| GP contacts | 4.56 (6.13) | 5.01 (5.78) | 4.44 (1.7) | 4.9 (1.6) | 0.46 | 9% | 37% | 0.3 | |
| Referrals to orthopaedics | 1.58 (3.43) | 1.76 (3.52) | 1.49 (0.4) | 1.52 (1.3) | 0.03 | 2% | ‐9% | 0.0 | |
| Radiographs | 0.82 (3.12) | 0.80 (3.01) | 0.75 (0.6) | 0.71 (0.4) | ‐0.04 | ‐6% | ‐1% | ‐0.1 | |
| Non‐medical practitioners | 0.11 (3.01) | 0.50 (4.20) | 0.09 (0.4) | 0.47 (0.4) | 0.38 | 81% | ‐45% | 0.9 | |
| Physiotherapy | 4.70 (9.10) | 5.22 (10.03) | 4.63 (0.6) | 5.08 (0.6) | 0.45 | 9% | 35% | 0.7 | |
| Acupuncture | 0.83 (3.45) | 0.77 (3.99) | 0.8 (1.3) | 0.72 (1.3) | ‐0.08 | ‐11% | 0% | ‐0.1 | |
| 1. Intervention 1 group pre‐intervention mean (standard deviation) 2. Intervention 2 group pre‐intervention mean (standard deviation) 3. Intervention 1 group post‐intervention mean (standard deviation) 4. Intervention 2 group postintervention mean (standard deviation) 5. Mean Difference (MD)=Difference between post‐intervention means. The direction of effect has been adjusted so that a positive result represents a beneficial intervention 1 outcome, according to Grimshaw 2004. 6. Relative percentage change post‐intervention = (Int1 post mean ‐ Int2 post mean)/Int2 post mean. The direction of effect has been adjusted so that a positive result represents a beneficial intervention 1 outcome, according to Grimshaw 2004. 7. Adjusted relative percentage change= (Int1 post mean‐Int2 post mean)‐(Int1 pre mean ‐ Int2 pre mean)/Int2 post mean. The direction of effect has been adjusted so that a positive result represents a beneficial intervention 1 outcome. 8. SMD=Standardised Mean Difference=(Int1 post mean‐Int2 post mean)/SD pooled. The direction of effect has been adjusted so that a positive result represents a beneficial intervention 1 outcome, according to Grimshaw 2004. 9. P value reported by study authors AIMS2‐SF: Arthritis Impact Measurement Scales Short Form * There are unit of analysis errors in the reported results because the available data did not account for the effect of clustering. | |||||||||
| (Study) Intervention | Outcome | Int pre mean (SD)1 | C pre mean (SD)2 | Int post mean (SD)3 | C post mean (SD)4 | MD 5 | Relative % change 6 | Adjusted relative % change7 | SMD8 (P value)9 |
| Intervention: 60‐minute lecture on shoulder disorders, handouts, training in injection techniques versus control group (usual care) | British Shoulder Disability Questionnaire (BSDQ) | 12.22 (4.21) | 13.11 (4.43) | 8.51 (0.60) | 9.46 (0.82) | 0.95 | 10% | 1% | 0.2 (P=0.36) |
| Short form 36 item (SF‐36) Health Survey ‐ physical component score | 37.78 (8.69) | 35.96 (8.93) | 40.55 (0.60) | 40.80 (0.90) | ‐0.25 | ‐1% | ‐5% | 0.0 (P=0.82) | |
| Short form 36 item (SF‐36) Health Survey ‐ mental component score | 45.42 (13.33) | 44.64 (13.09) | 46.81 (0.93) | 45.64 (1.28) | 1.17 | 3% | 1% | 0.1 (P=0.47) | |
| 1. Intervention group pre‐intervention mean (standard deviation) 2. Control group pre‐intervention mean (standard deviation) 3. Intervention group post‐intervention mean (standard deviation) 4. Control group pos‐tintervention mean (standard deviation) 5. Mean Difference (MD)=Difference between post‐intervention means. The direction of effect has been adjusted so that a positive result represents a beneficial intervention outcome, according to Grimshaw 2004. 6. Relative percentage change post‐intervention = (Int post mean ‐ Control post mean)/Control post mean 7. Adjusted relative percentage change= (Int post mean‐Control post mean)‐(Int pre mean ‐ Control pre mean)/Control post mean. The direction of effect has been adjusted so that a positive result represents a beneficial intervention outcome. 8. SMD=Standardised Mean Difference=(Int post mean‐Control post mean)/SD pooled. The direction of effect has been adjusted so that a positive result represents a beneficial intervention outcome, according to Grimshaw 2004. 9. P value reported by study authors | |||||||||
| (Study) Intervention 1 versus Intervention 2 | Outcome | Int 1 pre mean (SD)1 | Int 2 pre mean (SD)2 | Int 1 post mean (SD)3 | Int 2 post mean (SD)4 | MD 5 | Relative % change 6 | Adjusted relative % change7 | SMD8 (P value)9 |
| (Gormley 2003*) Shoulder injection training on mannequins versus shoulder injection training on mannequins and real patients | Shoulder injections performed by general practitioner | 3.5 | 3.4 | 4.5 | 7.8 | ‐3.3 | ‐42% | ‐44% | (P=0.02) |
| Referrals to shoulder injection clinics | 2.3 | 2.0 | 1.5 | 0.6 | ‐0.9 | ‐150% | ‐100% | (P=0.36) | |
| Referrals to physiotherapy | 5.9 | 5.6 | 4.7 | 3.2 | ‐1.5 | ‐47% | ‐38% | (P=0.20) | |
| 1. Intervention 1 group pre‐intervention mean (standard deviation) 2. Intervention 2 group pre‐intervention mean (standard deviation) 3. Intervention 1 group post‐intervention mean (standard deviation) 4. Intervention 2 group postintervention mean (standard deviation) 5. Mean Difference (MD)=Difference between post‐intervention means. The direction of effect has been adjusted so that a positive result represents a beneficial intervention 1 outcome, according to Grimshaw 2004. 6. Relative percentage change post‐intervention = (Int1 post mean ‐ Int2 post mean)/Int2 post mean. The direction of effect has been adjusted so that a positive result represents a beneficial intervention 1 outcome, according to Grimshaw 2004. 7. Adjusted relative percentage change= (Int1 post mean‐Int2 post mean)‐(Int1 pre mean ‐ Int2 pre mean)/Int2 post mean. The direction of effect has been adjusted so that a positive result represents a beneficial intervention 1 outcome. 8. SMD=Standardised Mean Difference=(Int1 post mean‐Int2 post mean)/SD pooled. The direction of effect has been adjusted so that a positive result represents a beneficial intervention 1 outcome, according to Grimshaw 2004. 9. P value reported by study authors * The study does not report SD and therefore we were not able to calculate the SMD | |||||||||
| (Study) Intervention | Outcome | Int pre mean (SD)1 | C pre mean (SD)2 | Int post mean (SD)3 | C post mean (SD)4 | MD 5 | Relative % change 6 | Adjusted relative % change7 | SMD8 (P value)9 |
| Training of general practitioners on the use of 2 validated assessment instruments for pain versus control group (usual care) | Pain relief a week after last consultation with general practitioner | 41.1 (4.6) | 50.7 (4.8) | ‐9.6 | ‐19% | ‐2 (P=0.0004) | |||
| Pain relief a week after last consultation with general practitioner not including patients on Level 3 analgesics | 40.8 (4.0) | 50.7 (4.2) | ‐9.9 | ‐20% | ‐2.4 (P=0.0001) | ||||
| Level 1 analgesic treatment (as defined by WHO classification system) | 34.7 (10.6) | 42.9 (18.4) | 29.6 (9.9) | 34.2 (12.4) | ‐4.6 | ‐13% | 11% | ‐0.3 (P=0.38) | |
| Level 2 analgesic treatment (as defined by WHO classification system) | 42.2 (5.9) | 44.1 (19.6) | 35.4 (6.3) | 47.7 (8.8) | ‐12.3 | ‐26% | ‐22% | ‐0.9 (P=0.003) | |
| Level 3 analgesic treatment (as defined by WHO classification system) | 7.5 (5.6) | 2.5 (2.1) | 7.2 (4.7) | 1.8 (2.5) | 5.4 | 300% | 22% | 1.2 (P=0.007) | |
| Co‐analgesics (antidepressants, anxiolytics, anti‐epileptics) | 46.0 (7.6) | 38.7 (7.5) | 38.4 (11.4) | 33.0 (15.1) | 5.4 | 16% | ‐6% | 0.7 (P=0.38) | |
| Other drugs (non‐psychotropic muscle relaxants) | 21.6 (7.1) | 27.3 (13.5) | 19.0 (5.3) | 22.9 (11.5) | ‐3.9 | ‐17% | 8% | ‐0.4 (P=0.34) | |
| Non‐medicinal treatment (physiotherapy, homeopathy, acupuncture, compression bandages, etc) | 44.3 (10.2) | 44.9 (11.1) | 33.8 (11.8) | 39.3 (12.5) | ‐5.5 | ‐14% | ‐12% | ‐0.5 (P=0.30) | |
| 1. Intervention group pre‐intervention mean (standard deviation) 2. Control group pre‐intervention mean (standard deviation) 3. Intervention group post‐intervention mean (standard deviation) 4. Control group pos‐tintervention mean (standard deviation) 5. Mean Difference (MD)=Difference between post‐intervention means. The direction of effect has been adjusted so that a positive result represents a beneficial intervention outcome, according to Grimshaw 2004. 6. Relative percentage change post‐intervention = (Int post mean ‐ Control post mean)/Control post mean 7. Adjusted relative percentage change= (Int post mean‐Control post mean)‐(Int pre mean ‐ Control pre mean)/Control post mean. The direction of effect has been adjusted so that a positive result represents a beneficial intervention outcome. 8. SMD=Standardised Mean Difference=(Int post mean‐Control post mean)/SD pooled. The direction of effect has been adjusted so that a positive result represents a beneficial intervention outcome, according to Grimshaw 2004. 9. P value reported by study authors | |||||||||
| (Study) Intervention 1 versus intervention 2 | Outcome | Int 1 pre (%) 1 | Int 2 pre (%)2 | Int 1 post (%)3 | Int 2 post (%)4 | ARD 5 | Risk difference 6 (P value if reported by authors) | Relative % change post 7 | Risk ratio 8 |
| (Robling 2002)* Guidelines and seminar versus guideline dissemination by post* | Concordant requests | ‐ | ‐ | 79% (23/29) | 79% (32/41) | ‐ | 0% | 0% | 1 |
| (Robling 2002)* Guidelines and feedback versus guideline dissemination by post* | Concordant requests | ‐ | ‐ | 67% (21/32) | 79% (32/41) | ‐ | ‐12.1% | ‐15% | 0.8 |
| (Robling 2002)* Guidelines, seminar and feedback versus guideline dissemination by post* | Concordant requests | ‐ | ‐ | 71% (27/37) | 79% (32/41) | ‐ | ‐7.6% | ‐10% | 0.9 |
| (Robling 2002)* Guidelines and seminar versus guidelines and feedback* | Concordant requests | ‐ | ‐ | 79% (23/29 | 67% (21/32) | ‐ | 12.1% | 18% | 1.2 |
| (Robling 2002)* Guidelines and seminar versus guidelines, seminar and feedback* | Concordant requests | ‐ | ‐ | 79% (23/29) | 71% (27/37) | ‐ | 7.6% | 11% | 1.1 |
| (Robling 2002)* Guidelines and feedback versus guidelines, seminar and feedback* | Concordant requests | ‐ | ‐ | 67% (21/32) | 71% (27/37) | ‐ | ‐4.5% | ‐6% | 0.9 |
| (Eccles 2001)** Feedback on number of knee radiographs 6 months before and 6 months after the intervention plus guideline dissemination versus guideline dissemination | Knee radiographs concordant with guidelines | ‐ | ‐ | 22% (52/240) | 25% (83/328) | ‐ | ‐3.6% | ‐14% | 0.9 |
| (Eccles 2001)** Reminder messages on radiograph reports plus guideline dissemination versus guideline dissemination | Knee radiographs concordant with guidelines | ‐ | ‐ | 31% (26/85) | 25% (83/328) | ‐ | 5.3% | 21% | 1.2 |
| (Eccles 2001)** Feedback on number of knee radiographs 6 months before and 6 months after the intervention plus guideline dissemination plus reminder messages on radiograph reports versus guideline dissemination | Knee radiographs concordant with guidelines | ‐ | ‐ | 28% (70/252) | 25% (83/328) | ‐ | 2.5% | 10% | 1.1 |
| (Eccles 2001)** Feedback on number of knee radiographs 6 months before and 6 months after the intervention plus guideline dissemination versus reminder messages on radiograph reports plus guideline dissemination | Knee radiographs concordant with guidelines | ‐ | ‐ | 22% (52/240) | 31% (26/85) | ‐ | ‐8.9% | ‐29% | 0.7 |
| 1. Intervention 1 group pre‐intervention proportion 2. Intervention 2 group pre‐intervention proportion 3. Intervention 1 group post‐intervention proportion 4. Intervention 2 group post‐intervention proportion 5. ARD = [Int 1 post (%) minus Int 2 post (%)] minus [Int 1 pre (%) minus Int 2 pre (%)]. The direction of effect has been adjusted so that a positive result represents a beneficial intervention 1 outcome, according to Grimshaw 2004. 6. Risk Difference (RD) is the absolute % change post‐intervention = Int 1 post (%) minus Int 2 post (%). This is considered to be "small" if ≤ 5%, "modest" if > 5% and ≤10%,"moderate" if > 10% but ≤ 20%, and "large" if > 20%.The direction of effect has been adjusted so that a positive result represents a beneficial intervention 1 outcome. 7. Relative % change post = absolute % change post divided by Int 2 post (%). The direction of effect has been adjusted so that a positive result represents a beneficial intervention 1 outcome, according to Grimshaw 2004. 8. Risk ratio (RR) = Int 1 post (%) divided by Int 2 post (%) Int 1: intervention 1 group; Int 2: Intervention 2 group; ARD: adjusted risk difference; NS: not significant *The results have been re‐calculated taking into account the reported Intercluster Correlation (ICC=0.0269) and average cluster size 12.5 according to chapter 16.3.4 of the Cochrane Handbook, Higgins 2011a. ** The data reported above for the study by Eccles 2001 does not account for clustering. We did not have access to sufficient information to adjust the data for clustering. | |||||||||
| (Study) Intervention 1 versus Intervention 2 | Outcome | Int 1 pre mean (SD)1 | Int 2 pre mean (SD)2 | Int 1 post mean (SD)3 | Int 2 post mean (SD)4 | MD 5 | Relative % change 6 | Adjusted relative % change7 | SMD8 (P value)9 |
| (Eccles 2001)* Feedback on number of knee radiographs 6 months before and 6 months after the intervention plus guideline dissemination versus guideline dissemination | Number of knee radiographs per 1000 patients | 7.03 (5.1) | 6.67 (3.9) | 6.32 (4.0) | 7.02 (3.6) | 0.7 | 10% | 15% | 0.2 (NR) |
| (Eccles 2001)* Reminder messages on radiograph reports plus guideline dissemination versus guideline dissemination | Number of knee radiographs per 1000 patients | 7.18 (5.0) | 6.67 (3.9) | 5.22 (3.6) | 7.02 (3.6) | 1.8 | 26% | 33% | 0.5 (P< 0.05) |
| (Eccles 2001)* Feedback on number of knee radiographs 6 months before and 6 months after the intervention plus guideline dissemination plus reminder messages on radiograph reports versus guideline dissemination | Number of knee radiographs per 1000 patients | 9.34 (6.1) | 6.67 (3.9) | 5.21 (3.7) | 7.02 (3.6) | 1.8 | 26% | 64% | 0.5 (NR) |
| (Eccles 2001)* Feedback on number of knee radiographs 6 months before and 6 months after the intervention plus guideline dissemination versus reminder messages on radiograph reports plus guideline dissemination | Number of knee radiographs per 1000 patients | 7.03 (5.1) | 7.18 (5.0) | 6.32 (4.0) | 5.22 (3.6) | ‐1.1 | ‐21% | ‐24% | ‐0.3 (NR) |
| 1. Intervention 1 group pre‐intervention mean (standard deviation) 2. Intervention 2 group pre‐intervention mean (standard deviation) 3. Intervention 1 group post‐intervention mean (standard deviation) 4. Intervention 2 group postintervention mean (standard deviation) 5. Mean Difference (MD)=Difference between post‐intervention means. The direction of effect has been adjusted so that a positive result represents a beneficial intervention 1 outcome, according to Grimshaw 2004. 6. Relative percentage change post‐intervention = (Int1 post mean ‐ Int2 post mean)/Int2 post mean. The direction of effect has been adjusted so that a positive result represents a beneficial intervention 1 outcome, according to Grimshaw 2004. 7. Adjusted relative percentage change= (Int1 post mean‐Int2 post mean)‐(Int1 pre mean ‐ Int2 pre mean)/Int2 post mean. The direction of effect has been adjusted so that a positive result represents a beneficial intervention 1 outcome. 8. SMD=Standardised Mean Difference=(Int1 post mean‐Int2 post mean)/SD pooled. The direction of effect has been adjusted so that a positive result represents a beneficial intervention 1 outcome, according to Grimshaw 2004. 9. P value reported by study authors *The above data reported above for Eccles 2001 was adjusted for clustering by the authors | |||||||||
| Table 23: Summary of median absolute effect sizes (risk difference) of dichotomous outcomes for interventions aiming to increase or decrease a clinical behaviour | ||||
| Study characteristic: behaviour targeted | Number of comparisons (n studies) | Median absolute effect size | Interquartile range | Range |
| Increase an existing clinical behaviour according to guidelines | 68 (14) | 5% | 0.6% to 12.6% | ‐7.8% to 57.2% |
| Decrease an existing clinical behaviour according to guidelines | 26 (7) | 1.1% | ‐1.1% to 3% | ‐12.6% to 30.1% |
| Table 24: Summary of median effect sizes (risk difference) of dichotomous outcomes for interventions aiming to increase or decrease a clinical behaviour (including only comparisons from Low Back Pain studies) | ||||
| Study characteristic: behaviour targeted | Number of comparisons (n studies) | Median absolute effect size | Interquartile range | Range |
| Increase an existing clinical behaviour according to guidelines | 18 (2) | 3.7% | ‐0.8% to 6.9% | ‐4.7% to 12.8% |
| Decrease an existing clinical behaviour according to guidelines | 23 (6) | 0.5% | ‐1.1% to 2.4% | ‐12.6% to 30.1% |
| Table 25: Summary of median effect sizes (risk difference) of dichotomous outcomes for interventions aiming to increase or decrease a clinical behaviour (including only comparisons from Osteoarthritis studies) | ||||
| Study characteristic: behaviour targeted | Number of comparisons (n studies) | Median absolute effect size | Interquartile range | Range |
| Increase an existing clinical behaviour according to guidelines | 18 (3) | 6.3% | ‐0.2% to 10% | ‐7.8% to 57.2% |
| Decrease an existing clinical behaviour according to guidelines | 3 (1) | 7.8% | 6.1% to 13.4% | 4.4% to 18.9% |
| Outcome or subgroup title | No. of studies | No. of participants | Statistical method | Effect size |
| 1 Bone Mineral Density Show forest plot | 3 | 3386 | Risk Ratio (M‐H, Fixed, 95% CI) | 4.44 [3.54, 5.55] |
| 2 Osteoporosis medication Show forest plot | 5 | 4223 | Risk Ratio (M‐H, Fixed, 95% CI) | 1.71 [1.50, 1.94] |
| Outcome or subgroup title | No. of studies | No. of participants | Statistical method | Effect size |
| 1 Bone mineral density Show forest plot | 2 | 3047 | Risk Ratio (M‐H, Fixed, 95% CI) | 4.75 [3.62, 6.24] |
| 2 Osteoporosis medication Show forest plot | 2 | 3047 | Risk Ratio (M‐H, Fixed, 95% CI) | 1.52 [1.26, 1.84] |
| Outcome or subgroup title | No. of studies | No. of participants | Statistical method | Effect size |
| 1 Bone mineral density Show forest plot | 2 | 2995 | Odds Ratio (M‐H, Fixed, 95% CI) | 0.93 [0.77, 1.12] |
| 2 Medication Show forest plot | 2 | 2995 | Risk Ratio (M‐H, Fixed, 95% CI) | 0.93 [0.79, 1.10] |