Capsaicina tópica (alta concentración) para el dolor neuropático crónico en adultos
Referencias
References to studies included in this review
References to studies excluded from this review
References to ongoing studies
Additional references
References to other published versions of this review
Characteristics of studies
Characteristics of included studies [ordered by study ID]
| Methods | RCT, DB, multicentre, parallel groups, single application, 12‐week duration. Patch applied to painful area, up to 1000 cm2. Oral pain medication continued without change. Transdermal opioids (≤ 60 mg morphine/day equivalent) permitted, but not topical analgesics. Rescue medication: after application participants allowed hydrocodone/paracetamol (5/500 mg) for ≤ 5 days Pain assessed daily (average pain for last 24 hours). PGIC assessed at endpoint. Clinic visits at 4, 8, 12 weeks | |
| Participants | Postherpetic neuropathy with at least moderate pain, ≥ 6 months since vesicle crusting. Exclusion: pain in/around facial area N = 402 M = 190, F = 212 Mean age 71 years Baseline pain 30 to 90 mm (mean 60 mm) | |
| Interventions | (1) Capsaicin patch 8%, n = 206 (2) Control patch, n = 196 Topical local anaesthetic applied for 60 min, then patch applied for 60 min Control patch contained 0.04% capsaicin to mimic AEs | |
| Outcomes | PI ‐ 11‐point numeric pain rating scale (responder: ≥ 30% and ≥ 2‐point reduction from baseline) PGIC ‐ 7‐point scale (responder: much and very much improved) Adverse events Withdrawals | |
| Notes | Oxford Quality Score: R1, DB2, W1. Total = 4/5 | |
| Risk of bias | ||
| Bias | Authors' judgement | Support for judgement |
| Random sequence generation (selection bias) | Unclear risk | Not described |
| Allocation concealment (selection bias) | Low risk | Remote treatment assignment, using unique number on printed labels affixed to outside of patch envelope |
| Blinding (performance bias and detection bias) | Low risk | Low concentration of capsaicin in "identically formulated" control patch to mimic local skin reaction of active treatment |
| Incomplete outcome data (attrition bias) | Low risk | Modified (no details) LOCF analysis for primary outcome, but no imputation for weekly scores. All participants included for safety analysis |
| Size | Low risk | 206/196 participants in treatment arms |
| Methods | RCT, DB, parallel groups, single application, 12‐week duration. Patches applied to both feet, up to 1120 cm2. Oral pain medication continued without change. Transdermal opioids (≤ 80 mg morphine/day equivalent) permitted, but not topical analgesics, or implanted medical device for pain relief. Rescue medication: during application participants allowed oral oxycodone solution (1 mg/ml) and local cooling; after application allowed hydrocodone/paracetamol (5/500 mg) for ≤ 5 days, and paracetamol (≤ 3 g/d) throughout Pain assessed daily (average pain for last 24 hours). PGIC assessed at 12 weeks. Clinic visits at 4, 8, 12 weeks | |
| Participants | HIV‐associated distal sensory neuropathy for ≥ 2 months Exclusion: previous use of NGX‐4010 N = 494 M = 432, F = 62 Mean age 50 years Baseline pain 30 to 90 mm (mean 60 mm) | |
| Interventions | (1) Capsaicin patch 8% 30 min, n = 167 Topical local anaesthetic applied for 60 min, then patch applied for 30 or 60 min Control patch contained 0.04% capsaicin to mimic AEs | |
| Outcomes | PI ‐ 11‐point numeric pain rating scale (responder: ≥ 30% reduction from baseline) PGIC ‐ 7‐point scale (reporting: slightly, much and very much improved) Adverse events Withdrawals | |
| Notes | Oxford Quality Score: R1, DB2, W1. Total = 4/5 | |
| Risk of bias | ||
| Bias | Authors' judgement | Support for judgement |
| Random sequence generation (selection bias) | Unclear risk | Not described; "allocation scheme prepared by Fisher Clinical Services" |
| Allocation concealment (selection bias) | Unclear risk | Not described |
| Blinding (performance bias and detection bias) | Unclear risk | Not described as identical; "low‐dose capsaicin control patches were used instead of placebo to provide effective blinding ....." |
| Incomplete outcome data (attrition bias) | Low risk | Modified LOCF analysis for primary outcome, but no imputation for weekly scores. All participants included for safety analysis |
| Size | Unclear risk | 50 to 200 participants per treatment arm |
| Methods | RCT, DB, multicentre, parallel‐group, single application, 12‐week duration. Patch applied to painful area, up to 1120 cm2. Oral pain medication continued without change. Transdermal opioids (≤ 60 mg morphine/day equivalent) permitted, but not topical analgesics. | |
| Participants | Postherpetic neuropathy with at least moderate pain, ≥ 6 months since vesicle crusting. Exclusion: pain above neck area N = 416 M = 190, F = 226 Mean age 70 years Baseline pain 30 to 90 mm (mean 57 mm) | |
| Interventions | (1) Capsaicin patch 8%, n = 212 | |
| Outcomes | PI ‐ 11‐point numeric pain rating scale (responder: ≥ 30%, ≥ 50%, and ≥ 2‐point reduction from baseline) PGIC ‐ 7‐point scale (responder: much and very much improved) Adverse events Withdrawals | |
| Notes | Oxford Quality Score: R1, DB2, W1. Total = 4/5 | |
| Risk of bias | ||
| Bias | Authors' judgement | Support for judgement |
| Random sequence generation (selection bias) | Unclear risk | Not described; "allocation scheme prepared by Fisher Clinical Services" |
| Allocation concealment (selection bias) | Low risk | Each kit "designated by a unique kit number, which was printed on the investigational drug label affixed to the outer bag enclosure and on each individual patch envelope" |
| Blinding (performance bias and detection bias) | Low risk | "The NGX‐4010 and control patches were identical in appearance, as were the blinded study kits" |
| Incomplete outcome data (attrition bias) | Low risk | Modified LOCF analysis for primary outcome, but no imputation for weekly scores. All participants included for safety analysis |
| Size | Low risk | > 200 participants per treatment arm |
| Methods | RCT, DB, multicentre, parallel groups, single application, 12‐week duration. Patches applied to both feet, up to maximum 1000 cm2. Oral pain medication continued without change. No topical analgesics. During application participants allowed oral oxycodone solution (1 mg/ml) or equivalent, after application allowed hydrocodone/paracetamol (5/500 mg) for ≤ 7 days Pain assessed daily (average pain for last 24 hours). PGIC assessed at 12 weeks. Clinic visits at 4, 8, 12 weeks | |
| Participants | HIV‐associated distal sensory polyneuropathy with ≥ 2 months' moderate to severe pain in both feet N = 307 M = 286, F = 21 Mean age 48 years (29 to 74) Baseline pain 30 to 90 mm (mean ˜60 mm) | |
| Interventions | (1) Capsaicin patch 8% 30 min, n = 72 (2) Capsaicin patch 8% 60 min, n = 78 (3) Capsaicin patch 8% 90 min, n = 75 (4) Control patch, n = 82 Topical local anaesthetic applied for 60 min, then patch applied for 30, 60 or 90 min | |
| Outcomes | PI: 11‐point numeric pain rating scale (responder: ≥ 30% reduction from baseline) Patient global: PGIC ‐ 7‐point scale (responder: much and very much improved) Adverse events Withdrawals | |
| Notes | Oxford Quality Score: R1, DB1, W1. Total = 3/5 | |
| Risk of bias | ||
| Bias | Authors' judgement | Support for judgement |
| Random sequence generation (selection bias) | Unclear risk | Described only as "randomised" |
| Allocation concealment (selection bias) | Unclear risk | Not described |
| Blinding (performance bias and detection bias) | Low risk | Control patch contained a low concentration of capsaicin to mimic local skin reaction of active treatment. Although it does not say "identical" or use similar wording, this was judged by the authors to be low risk. |
| Incomplete outcome data (attrition bias) | Low risk | BOCF or 'no improvement' imputed for missing values for dichotomous data analyses |
| Size | Unclear risk | 50 to 200 participants per treatment arm |
| Methods | RCT, DB, multicentre, parallel‐group, single application, 12‐week duration. Patch applied to painful area, up to 1120 cm2. Oral pain medication continued without change. Transdermal opioids (≤ 60 mg morphine/day equivalent) permitted, but not topical analgesics. Rescue medication: during application participants allowed oral oxycodone solution (1 mg/ml) and local cooling; after application allowed hydrocodone/paracetamol (5/500 mg) for ≤ 5 days, and paracetamol (≤ 2 g/d) throughout. | |
| Participants | Postherpetic neuropathy with at least moderate pain, ≥ 6 months since vesicle crusting. Exclusion: pain in/around facial area N = 299 M = 150, F = 149 Mean age 71 years Baseline pain 30 to 90 mm (mean 55 mm) | |
| Interventions | (1) Capsaicin patch 8% 30 min, n = 72 | |
| Outcomes | PI ‐ 11‐point numeric pain rating scale (responder: ≥ 30%, ≥ 50%, and ≥ 2‐point reduction from baseline) PGIC ‐ 7‐point scale (reporting: slightly, much and very much improved) Adverse events Withdrawals | |
| Notes | Oxford Quality Score: R1, DB2, W1. Total = 4/5 | |
| Risk of bias | ||
| Bias | Authors' judgement | Support for judgement |
| Random sequence generation (selection bias) | Unclear risk | Not described; "randomisation scheme prepared by Cardinal Health" |
| Allocation concealment (selection bias) | Unclear risk | Not described |
| Blinding (performance bias and detection bias) | Low risk | "identically appearing control patches" |
| Incomplete outcome data (attrition bias) | Low risk | Modified LOCF analysis for primary outcome, but no imputation for weekly scores. All participants included for safety analysis |
| Size | Unclear risk | 50 to 200 participants per treatment arm |
| Methods | RCT, DB, multicentre, parallel‐group, single application, 12‐week duration. Patch applied to painful area, up to 1000 cm2. Oral pain medication continued without change. Transdermal opioids (≤ 60 mg morphine/day equivalent) permitted, but not topical analgesics. Rescue medication: during application participants allowed oral oxycodone solution (1 mg/ml) and local cooling; after application allowed hydrocodone/paracetamol (5/500 mg) for ≤ 5 days, and paracetamol (≤ 2 g/d) throughout. | |
| Participants | Postherpetic neuropathy with at least moderate pain, ≥ 6 months since vesicle crusting. Exclusion: pain in/around facial area N = 155 M = 72, F = 83 Mean age 70 years Baseline pain 30 to 90 mm (mean 53 mm) | |
| Interventions | (1) Capsaicin patch 8%, n = 102 | |
| Outcomes | PI ‐ 11‐point numeric pain rating scale (responder: ≥ 30%, ≥ 50% and ≥ 2‐point reduction from baseline) PGIC ‐ 7‐point scale (responder: much and very much improved) Adverse events Withdrawals | |
| Notes | Oxford Quality Score: R1, DB2, W1. Total = 4/5 | |
| Risk of bias | ||
| Bias | Authors' judgement | Support for judgement |
| Random sequence generation (selection bias) | Unclear risk | Not described; "randomisation scheme prepared by Cardinal Health" |
| Allocation concealment (selection bias) | Unclear risk | Not described |
| Blinding (performance bias and detection bias) | Low risk | "identically‐appearing ...... control patch" |
| Incomplete outcome data (attrition bias) | Low risk | Modified LOCF analysis for primary outcome, but no imputation for weekly scores. All participants included for safety analysis |
| Size | Unclear risk | 50 to 200 participants pre treatment arm |
AE: adverse event; BOCF: baseline observation carried forward; DB: double‐blind(ing); LOCF: last observation carried forward; PGIC: patient global impression of change; R: randomisation; RCT: randomised controlled trial; W: withdrawals
Characteristics of excluded studies [ordered by study ID]
| Study | Reason for exclusion |
| Study duration only four weeks |
Characteristics of ongoing studies [ordered by study ID]
| Trial name or title | Study of NGX‐1998 for the treatment of postherpetic neuralgia |
| Methods | RCT, DB, multicentre, parallel groups, single application, 12‐week duration Treatment applied for 5 minutes |
| Participants | Postherpetic neuropathy with > 6 months of pain since vesicle crusting |
| Interventions | Capsaicin topical liquid 10% Capsaicin topical liquid 20% Placebo Stable pain medications continued unchanged throughout study |
| Outcomes | Participants with ≥ 30% decrease in pain from baseline at weeks 8 and 12 Participants with ≥ 2 unit decrease in pain from baseline at weeks 8 and 12 |
| Starting date | October 2010 |
| Contact information | Trudy Vanhove, VP Clinical Development, NeurogesX, Inc |
| Notes |
DB: double‐blind; RCT: randomised controlled trial
Data and analyses
| Outcome or subgroup title | No. of studies | No. of participants | Statistical method | Effect size |
| 1 PGIC much or very much improved at 8 and 12 weeks Show forest plot | 2 | Risk Ratio (M‐H, Fixed, 95% CI) | Subtotals only | |
| Analysis 1.1  Comparison 1 8% capsaicin versus control (single dose), Outcome 1 PGIC much or very much improved at 8 and 12 weeks. | ||||
| 1.1 8 weeks | 2 | 571 | Risk Ratio (M‐H, Fixed, 95% CI) | 1.42 [1.10, 1.84] |
| 1.2 12 weeks | 2 | 571 | Risk Ratio (M‐H, Fixed, 95% CI) | 1.55 [1.20, 1.99] |
| 2 PHN ‐ at least 50% pain intensity reduction over weeks 2 to 8 Show forest plot | 3 | 870 | Risk Ratio (M‐H, Fixed, 95% CI) | 1.44 [1.12, 1.86] |
| Analysis 1.2  Comparison 1 8% capsaicin versus control (single dose), Outcome 2 PHN ‐ at least 50% pain intensity reduction over weeks 2 to 8. | ||||
| 2.1 30‐minute application | 1 | 97 | Risk Ratio (M‐H, Fixed, 95% CI) | 2.95 [0.73, 11.88] |
| 2.2 60‐minute application | 3 | 674 | Risk Ratio (M‐H, Fixed, 95% CI) | 1.34 [1.03, 1.75] |
| 2.3 90‐minute application | 1 | 99 | Risk Ratio (M‐H, Fixed, 95% CI) | 2.02 [0.64, 6.33] |
| 3 PHN ‐ at least 50% pain intensity reduction over 2 to 12 weeks Show forest plot | 2 | 571 | Risk Ratio (M‐H, Fixed, 95% CI) | 1.31 [1.00, 1.71] |
| Analysis 1.3 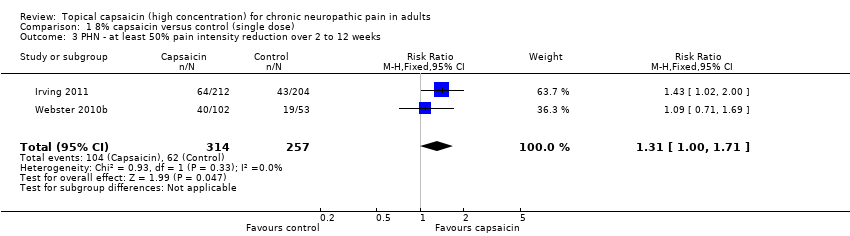 Comparison 1 8% capsaicin versus control (single dose), Outcome 3 PHN ‐ at least 50% pain intensity reduction over 2 to 12 weeks. | ||||
| 4 PHN ‐ at least 30% pain intensity reduction over weeks 2 to 8 Show forest plot | 4 | 1268 | Risk Ratio (M‐H, Fixed, 95% CI) | 1.31 [1.13, 1.52] |
| Analysis 1.4 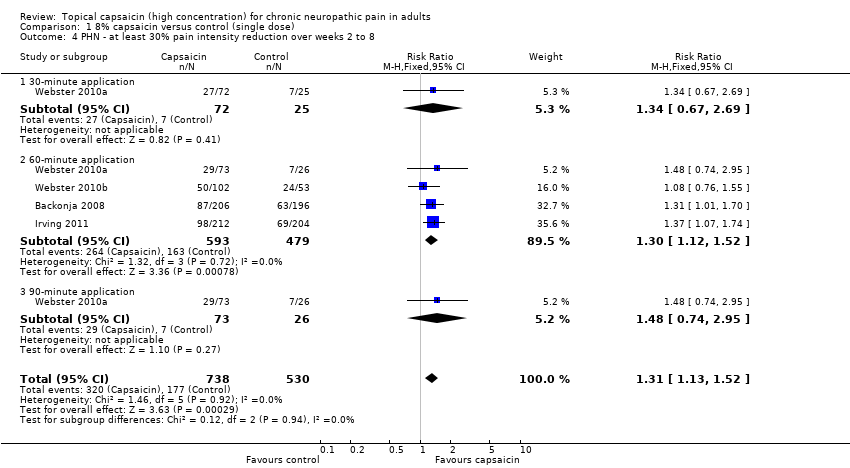 Comparison 1 8% capsaicin versus control (single dose), Outcome 4 PHN ‐ at least 30% pain intensity reduction over weeks 2 to 8. | ||||
| 4.1 30‐minute application | 1 | 97 | Risk Ratio (M‐H, Fixed, 95% CI) | 1.34 [0.67, 2.69] |
| 4.2 60‐minute application | 4 | 1072 | Risk Ratio (M‐H, Fixed, 95% CI) | 1.30 [1.12, 1.52] |
| 4.3 90‐minute application | 1 | 99 | Risk Ratio (M‐H, Fixed, 95% CI) | 1.48 [0.74, 2.95] |
| 5 PHN ‐ at least 30% pain intensity reduction over weeks 2 to 12 Show forest plot | 3 | 973 | Risk Ratio (M‐H, Fixed, 95% CI) | 1.25 [1.07, 1.45] |
| Analysis 1.5  Comparison 1 8% capsaicin versus control (single dose), Outcome 5 PHN ‐ at least 30% pain intensity reduction over weeks 2 to 12. | ||||
| 6 HIVN ‐ at least 30% pain intensity reduction over weeks 2 to 12 Show forest plot | 2 | 801 | Risk Ratio (M‐H, Fixed, 95% CI) | 1.35 [1.09, 1.68] |
| Analysis 1.6  Comparison 1 8% capsaicin versus control (single dose), Outcome 6 HIVN ‐ at least 30% pain intensity reduction over weeks 2 to 12. | ||||
| 6.1 30‐minute application | 2 | 340 | Risk Ratio (M‐H, Fixed, 95% CI) | 1.67 [1.14, 2.46] |
| 6.2 60‐minute application | 2 | 359 | Risk Ratio (M‐H, Fixed, 95% CI) | 1.10 [0.84, 1.44] |
| 6.3 90‐minute application | 1 | 102 | Risk Ratio (M‐H, Fixed, 95% CI) | 1.94 [0.83, 4.53] |
| 7 Local skin reactions ‐ group 1 Show forest plot | 3 | Risk Ratio (M‐H, Fixed, 95% CI) | Subtotals only | |
| Analysis 1.7 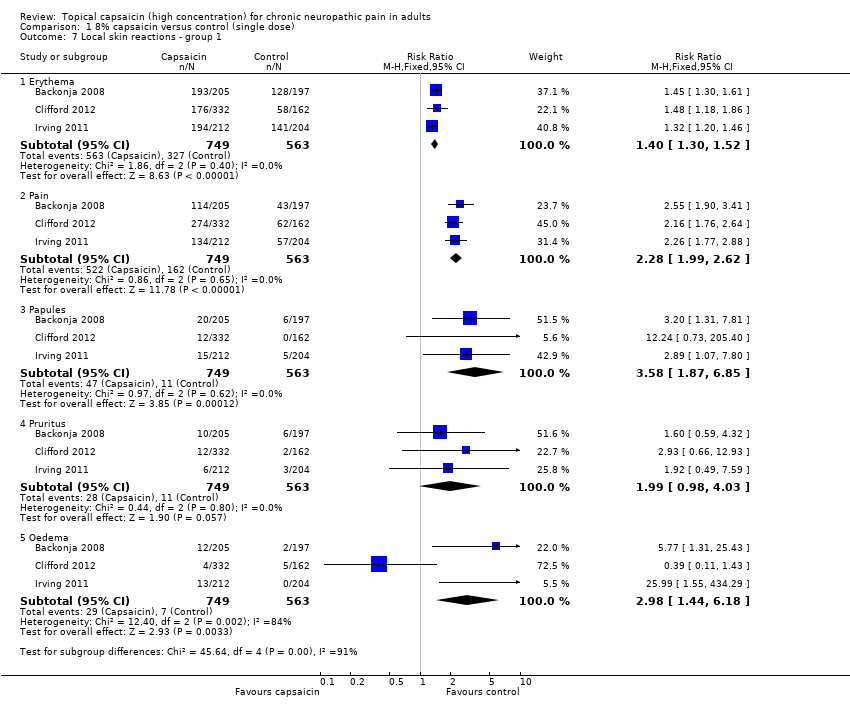 Comparison 1 8% capsaicin versus control (single dose), Outcome 7 Local skin reactions ‐ group 1. | ||||
| 7.1 Erythema | 3 | 1312 | Risk Ratio (M‐H, Fixed, 95% CI) | 1.40 [1.30, 1.52] |
| 7.2 Pain | 3 | 1312 | Risk Ratio (M‐H, Fixed, 95% CI) | 2.28 [1.99, 2.62] |
| 7.3 Papules | 3 | 1312 | Risk Ratio (M‐H, Fixed, 95% CI) | 3.58 [1.87, 6.85] |
| 7.4 Pruritus | 3 | 1312 | Risk Ratio (M‐H, Fixed, 95% CI) | 1.99 [0.98, 4.03] |
| 7.5 Oedema | 3 | 1312 | Risk Ratio (M‐H, Fixed, 95% CI) | 2.98 [1.44, 6.18] |
| 8 Local skin reactions ‐ group 2 Show forest plot | 3 | Risk Ratio (M‐H, Fixed, 95% CI) | Subtotals only | |
| Analysis 1.8  Comparison 1 8% capsaicin versus control (single dose), Outcome 8 Local skin reactions ‐ group 2. | ||||
| 8.1 Erythema | 1 | 129 | Risk Ratio (M‐H, Fixed, 95% CI) | 6.31 [0.35, 114.82] |
| 8.2 Pain | 3 | 735 | Risk Ratio (M‐H, Fixed, 95% CI) | 1.85 [0.99, 3.47] |
| 8.3 Papules | 3 | 735 | Risk Ratio (M‐H, Fixed, 95% CI) | 1.58 [0.59, 4.24] |
| 8.4 Pruritus | 3 | 735 | Risk Ratio (M‐H, Fixed, 95% CI) | 1.57 [0.98, 2.50] |
| 8.5 Oedema | 3 | 735 | Risk Ratio (M‐H, Fixed, 95% CI) | 1.34 [0.75, 2.39] |
| 9 Patch tolerability Show forest plot | 6 | Risk Ratio (M‐H, Fixed, 95% CI) | Subtotals only | |
| Analysis 1.9  Comparison 1 8% capsaicin versus control (single dose), Outcome 9 Patch tolerability. | ||||
| 9.1 < 90% of application time | 6 | 2074 | Risk Ratio (M‐H, Fixed, 95% CI) | 3.27 [1.17, 9.15] |
| 9.2 Dermal irritation score > 2 at 2 h | 3 | 1065 | Risk Ratio (M‐H, Fixed, 95% CI) | 11.80 [4.04, 34.48] |
| 9.3 Dermal irritation score > 0 at 2 h | 2 | 606 | Risk Ratio (M‐H, Fixed, 95% CI) | 2.28 [1.60, 3.26] |
| 9.4 Rescue medication 0 to 5 d | 6 | 2073 | Risk Ratio (M‐H, Fixed, 95% CI) | 2.47 [2.13, 2.87] |
| 10 Serious adverse events Show forest plot | 5 | 1579 | Risk Ratio (M‐H, Fixed, 95% CI) | 1.41 [0.82, 2.41] |
| Analysis 1.10 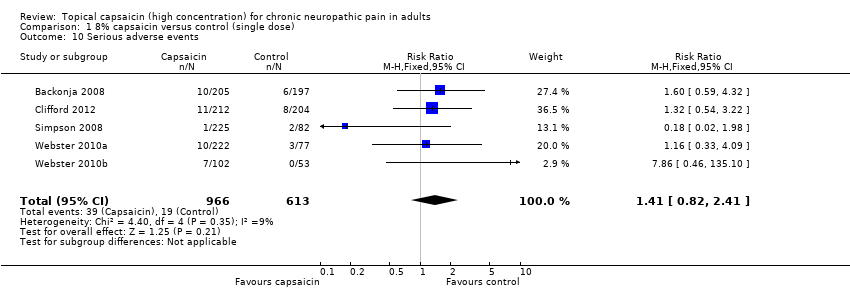 Comparison 1 8% capsaicin versus control (single dose), Outcome 10 Serious adverse events. | ||||
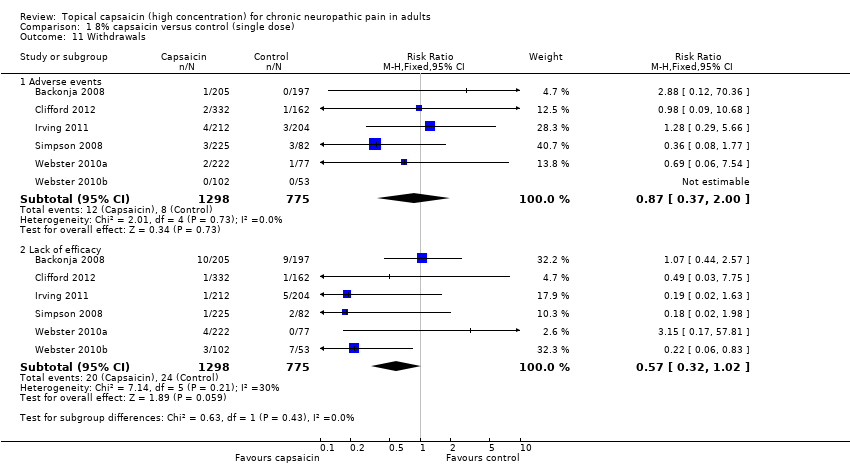
| 11 Withdrawals Show forest plot | 6 | Risk Ratio (M‐H, Fixed, 95% CI) | Subtotals only | |
| Analysis 1.11  Comparison 1 8% capsaicin versus control (single dose), Outcome 11 Withdrawals. | ||||
| 11.1 Adverse events | 6 | 2073 | Risk Ratio (M‐H, Fixed, 95% CI) | 0.87 [0.37, 2.00] |
| 11.2 Lack of efficacy | 6 | 2073 | Risk Ratio (M‐H, Fixed, 95% CI) | 0.57 [0.32, 1.02] |
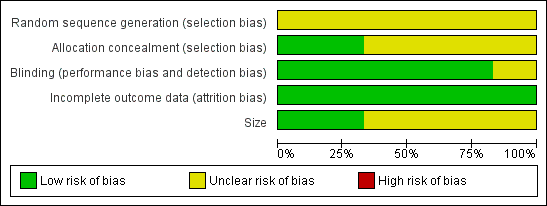
Methodological quality graph: review authors' judgements about each methodological quality item presented as percentages across all included studies.

Forest plot of comparison: 1 8% capsaicin versus control (single dose), outcome: 1.1 PGIC much or very much improved at 8 and 12 weeks.
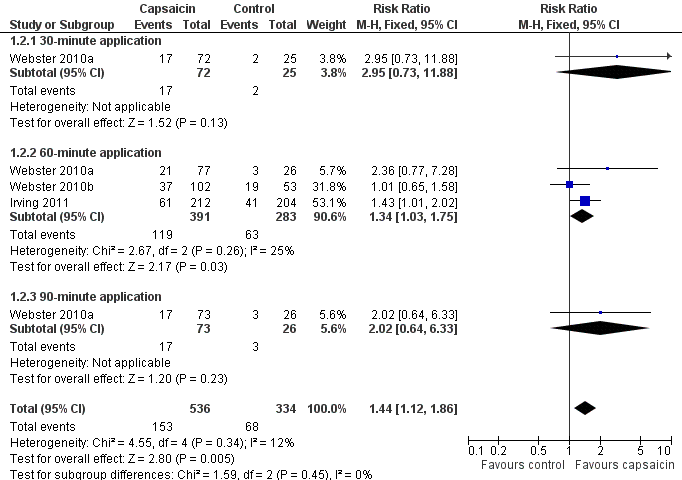
Forest plot of comparison: 1 8% capsaicin versus control (single dose), outcome: 1.2 PHN ‐ at least 50% pain intensity reduction over weeks 2 to 8.

Forest plot of comparison: 1 8% capsaicin versus control (single dose), outcome: 1.6 HIVN ‐ at least 30% pain intensity reduction over weeks 2 to 12.

Skin adverse event rates with capsaicin and control. Yellow symbols are studies recording all events (Group 1). Pink symbols are studies specifying that events are not recorded on the first day after treatment (Group 2). The blue symbol did not specify the period over which events were recorded (Group 2). Size of symbol is proportional to the size of the study

Forest plot of comparison: 1 8% capsaicin versus control (single dose), outcome: 1.10 Serious adverse events.

Comparison 1 8% capsaicin versus control (single dose), Outcome 1 PGIC much or very much improved at 8 and 12 weeks.

Comparison 1 8% capsaicin versus control (single dose), Outcome 2 PHN ‐ at least 50% pain intensity reduction over weeks 2 to 8.

Comparison 1 8% capsaicin versus control (single dose), Outcome 3 PHN ‐ at least 50% pain intensity reduction over 2 to 12 weeks.

Comparison 1 8% capsaicin versus control (single dose), Outcome 4 PHN ‐ at least 30% pain intensity reduction over weeks 2 to 8.

Comparison 1 8% capsaicin versus control (single dose), Outcome 5 PHN ‐ at least 30% pain intensity reduction over weeks 2 to 12.
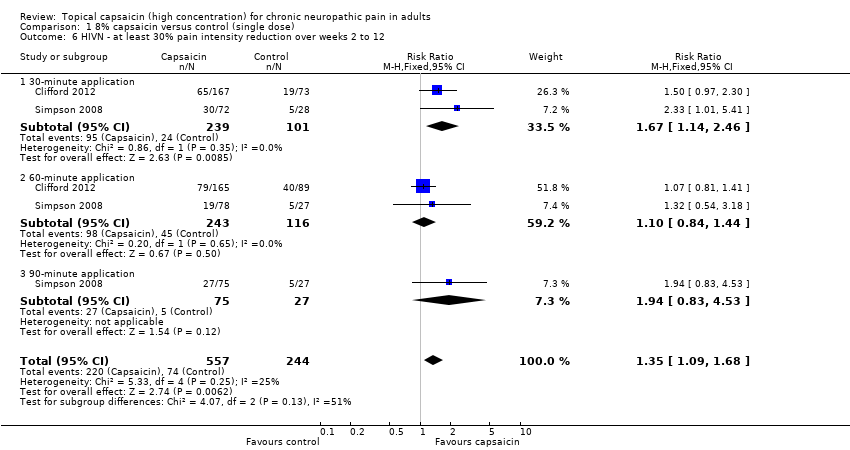
Comparison 1 8% capsaicin versus control (single dose), Outcome 6 HIVN ‐ at least 30% pain intensity reduction over weeks 2 to 12.

Comparison 1 8% capsaicin versus control (single dose), Outcome 7 Local skin reactions ‐ group 1.
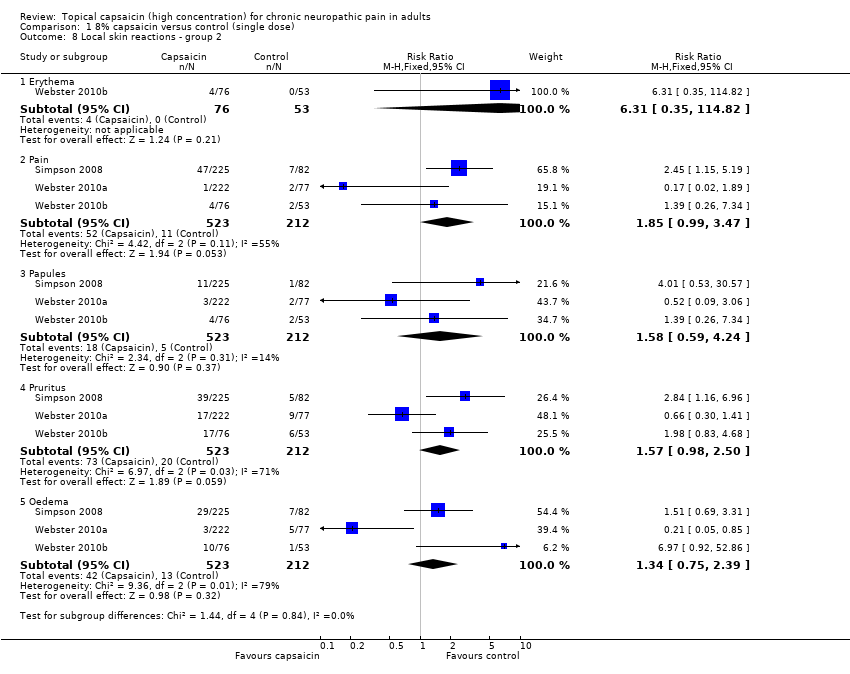
Comparison 1 8% capsaicin versus control (single dose), Outcome 8 Local skin reactions ‐ group 2.

Comparison 1 8% capsaicin versus control (single dose), Outcome 9 Patch tolerability.

Comparison 1 8% capsaicin versus control (single dose), Outcome 10 Serious adverse events.
Comparison 1 8% capsaicin versus control (single dose), Outcome 11 Withdrawals.
| Outcome or subgroup title | No. of studies | No. of participants | Statistical method | Effect size |
| 1 PGIC much or very much improved at 8 and 12 weeks Show forest plot | 2 | Risk Ratio (M‐H, Fixed, 95% CI) | Subtotals only | |
| 1.1 8 weeks | 2 | 571 | Risk Ratio (M‐H, Fixed, 95% CI) | 1.42 [1.10, 1.84] |
| 1.2 12 weeks | 2 | 571 | Risk Ratio (M‐H, Fixed, 95% CI) | 1.55 [1.20, 1.99] |
| 2 PHN ‐ at least 50% pain intensity reduction over weeks 2 to 8 Show forest plot | 3 | 870 | Risk Ratio (M‐H, Fixed, 95% CI) | 1.44 [1.12, 1.86] |
| 2.1 30‐minute application | 1 | 97 | Risk Ratio (M‐H, Fixed, 95% CI) | 2.95 [0.73, 11.88] |
| 2.2 60‐minute application | 3 | 674 | Risk Ratio (M‐H, Fixed, 95% CI) | 1.34 [1.03, 1.75] |
| 2.3 90‐minute application | 1 | 99 | Risk Ratio (M‐H, Fixed, 95% CI) | 2.02 [0.64, 6.33] |
| 3 PHN ‐ at least 50% pain intensity reduction over 2 to 12 weeks Show forest plot | 2 | 571 | Risk Ratio (M‐H, Fixed, 95% CI) | 1.31 [1.00, 1.71] |
| 4 PHN ‐ at least 30% pain intensity reduction over weeks 2 to 8 Show forest plot | 4 | 1268 | Risk Ratio (M‐H, Fixed, 95% CI) | 1.31 [1.13, 1.52] |
| 4.1 30‐minute application | 1 | 97 | Risk Ratio (M‐H, Fixed, 95% CI) | 1.34 [0.67, 2.69] |
| 4.2 60‐minute application | 4 | 1072 | Risk Ratio (M‐H, Fixed, 95% CI) | 1.30 [1.12, 1.52] |
| 4.3 90‐minute application | 1 | 99 | Risk Ratio (M‐H, Fixed, 95% CI) | 1.48 [0.74, 2.95] |
| 5 PHN ‐ at least 30% pain intensity reduction over weeks 2 to 12 Show forest plot | 3 | 973 | Risk Ratio (M‐H, Fixed, 95% CI) | 1.25 [1.07, 1.45] |
| 6 HIVN ‐ at least 30% pain intensity reduction over weeks 2 to 12 Show forest plot | 2 | 801 | Risk Ratio (M‐H, Fixed, 95% CI) | 1.35 [1.09, 1.68] |
| 6.1 30‐minute application | 2 | 340 | Risk Ratio (M‐H, Fixed, 95% CI) | 1.67 [1.14, 2.46] |
| 6.2 60‐minute application | 2 | 359 | Risk Ratio (M‐H, Fixed, 95% CI) | 1.10 [0.84, 1.44] |
| 6.3 90‐minute application | 1 | 102 | Risk Ratio (M‐H, Fixed, 95% CI) | 1.94 [0.83, 4.53] |
| 7 Local skin reactions ‐ group 1 Show forest plot | 3 | Risk Ratio (M‐H, Fixed, 95% CI) | Subtotals only | |
| 7.1 Erythema | 3 | 1312 | Risk Ratio (M‐H, Fixed, 95% CI) | 1.40 [1.30, 1.52] |
| 7.2 Pain | 3 | 1312 | Risk Ratio (M‐H, Fixed, 95% CI) | 2.28 [1.99, 2.62] |
| 7.3 Papules | 3 | 1312 | Risk Ratio (M‐H, Fixed, 95% CI) | 3.58 [1.87, 6.85] |
| 7.4 Pruritus | 3 | 1312 | Risk Ratio (M‐H, Fixed, 95% CI) | 1.99 [0.98, 4.03] |
| 7.5 Oedema | 3 | 1312 | Risk Ratio (M‐H, Fixed, 95% CI) | 2.98 [1.44, 6.18] |
| 8 Local skin reactions ‐ group 2 Show forest plot | 3 | Risk Ratio (M‐H, Fixed, 95% CI) | Subtotals only | |
| 8.1 Erythema | 1 | 129 | Risk Ratio (M‐H, Fixed, 95% CI) | 6.31 [0.35, 114.82] |
| 8.2 Pain | 3 | 735 | Risk Ratio (M‐H, Fixed, 95% CI) | 1.85 [0.99, 3.47] |
| 8.3 Papules | 3 | 735 | Risk Ratio (M‐H, Fixed, 95% CI) | 1.58 [0.59, 4.24] |
| 8.4 Pruritus | 3 | 735 | Risk Ratio (M‐H, Fixed, 95% CI) | 1.57 [0.98, 2.50] |
| 8.5 Oedema | 3 | 735 | Risk Ratio (M‐H, Fixed, 95% CI) | 1.34 [0.75, 2.39] |
| 9 Patch tolerability Show forest plot | 6 | Risk Ratio (M‐H, Fixed, 95% CI) | Subtotals only | |
| 9.1 < 90% of application time | 6 | 2074 | Risk Ratio (M‐H, Fixed, 95% CI) | 3.27 [1.17, 9.15] |
| 9.2 Dermal irritation score > 2 at 2 h | 3 | 1065 | Risk Ratio (M‐H, Fixed, 95% CI) | 11.80 [4.04, 34.48] |
| 9.3 Dermal irritation score > 0 at 2 h | 2 | 606 | Risk Ratio (M‐H, Fixed, 95% CI) | 2.28 [1.60, 3.26] |
| 9.4 Rescue medication 0 to 5 d | 6 | 2073 | Risk Ratio (M‐H, Fixed, 95% CI) | 2.47 [2.13, 2.87] |
| 10 Serious adverse events Show forest plot | 5 | 1579 | Risk Ratio (M‐H, Fixed, 95% CI) | 1.41 [0.82, 2.41] |
| 11 Withdrawals Show forest plot | 6 | Risk Ratio (M‐H, Fixed, 95% CI) | Subtotals only | |
| 11.1 Adverse events | 6 | 2073 | Risk Ratio (M‐H, Fixed, 95% CI) | 0.87 [0.37, 2.00] |
| 11.2 Lack of efficacy | 6 | 2073 | Risk Ratio (M‐H, Fixed, 95% CI) | 0.57 [0.32, 1.02] |