| 1 PGIC much or very much improved at 8 and 12 weeks Show forest plot | 2 | | Risk Ratio (M‐H, Fixed, 95% CI) | Subtotals only |
|
| 1.1 8 weeks | 2 | 571 | Risk Ratio (M‐H, Fixed, 95% CI) | 1.42 [1.10, 1.84] |
| 1.2 12 weeks | 2 | 571 | Risk Ratio (M‐H, Fixed, 95% CI) | 1.55 [1.20, 1.99] |
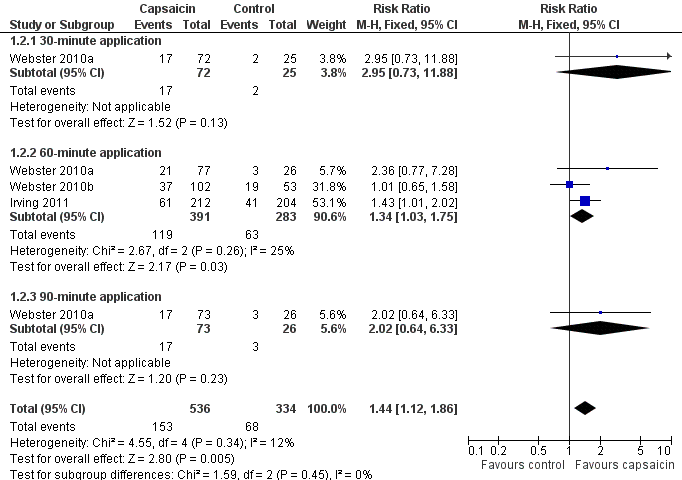
| 2 PHN ‐ at least 50% pain intensity reduction over weeks 2 to 8 Show forest plot | 3 | 870 | Risk Ratio (M‐H, Fixed, 95% CI) | 1.44 [1.12, 1.86] |
|
| 2.1 30‐minute application | 1 | 97 | Risk Ratio (M‐H, Fixed, 95% CI) | 2.95 [0.73, 11.88] |
| 2.2 60‐minute application | 3 | 674 | Risk Ratio (M‐H, Fixed, 95% CI) | 1.34 [1.03, 1.75] |
| 2.3 90‐minute application | 1 | 99 | Risk Ratio (M‐H, Fixed, 95% CI) | 2.02 [0.64, 6.33] |
| 3 PHN ‐ at least 50% pain intensity reduction over 2 to 12 weeks Show forest plot | 2 | 571 | Risk Ratio (M‐H, Fixed, 95% CI) | 1.31 [1.00, 1.71] |
|
| 4 PHN ‐ at least 30% pain intensity reduction over weeks 2 to 8 Show forest plot | 4 | 1268 | Risk Ratio (M‐H, Fixed, 95% CI) | 1.31 [1.13, 1.52] |
|
| 4.1 30‐minute application | 1 | 97 | Risk Ratio (M‐H, Fixed, 95% CI) | 1.34 [0.67, 2.69] |
| 4.2 60‐minute application | 4 | 1072 | Risk Ratio (M‐H, Fixed, 95% CI) | 1.30 [1.12, 1.52] |
| 4.3 90‐minute application | 1 | 99 | Risk Ratio (M‐H, Fixed, 95% CI) | 1.48 [0.74, 2.95] |
| 5 PHN ‐ at least 30% pain intensity reduction over weeks 2 to 12 Show forest plot | 3 | 973 | Risk Ratio (M‐H, Fixed, 95% CI) | 1.25 [1.07, 1.45] |
|
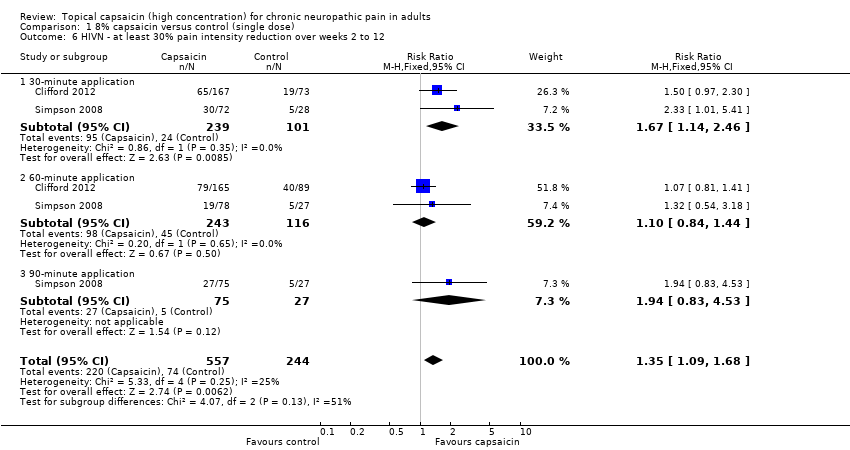
| 6 HIVN ‐ at least 30% pain intensity reduction over weeks 2 to 12 Show forest plot | 2 | 801 | Risk Ratio (M‐H, Fixed, 95% CI) | 1.35 [1.09, 1.68] |
|
| 6.1 30‐minute application | 2 | 340 | Risk Ratio (M‐H, Fixed, 95% CI) | 1.67 [1.14, 2.46] |
| 6.2 60‐minute application | 2 | 359 | Risk Ratio (M‐H, Fixed, 95% CI) | 1.10 [0.84, 1.44] |
| 6.3 90‐minute application | 1 | 102 | Risk Ratio (M‐H, Fixed, 95% CI) | 1.94 [0.83, 4.53] |
| 7 Local skin reactions ‐ group 1 Show forest plot | 3 | | Risk Ratio (M‐H, Fixed, 95% CI) | Subtotals only |
|
| 7.1 Erythema | 3 | 1312 | Risk Ratio (M‐H, Fixed, 95% CI) | 1.40 [1.30, 1.52] |
| 7.2 Pain | 3 | 1312 | Risk Ratio (M‐H, Fixed, 95% CI) | 2.28 [1.99, 2.62] |
| 7.3 Papules | 3 | 1312 | Risk Ratio (M‐H, Fixed, 95% CI) | 3.58 [1.87, 6.85] |
| 7.4 Pruritus | 3 | 1312 | Risk Ratio (M‐H, Fixed, 95% CI) | 1.99 [0.98, 4.03] |
| 7.5 Oedema | 3 | 1312 | Risk Ratio (M‐H, Fixed, 95% CI) | 2.98 [1.44, 6.18] |
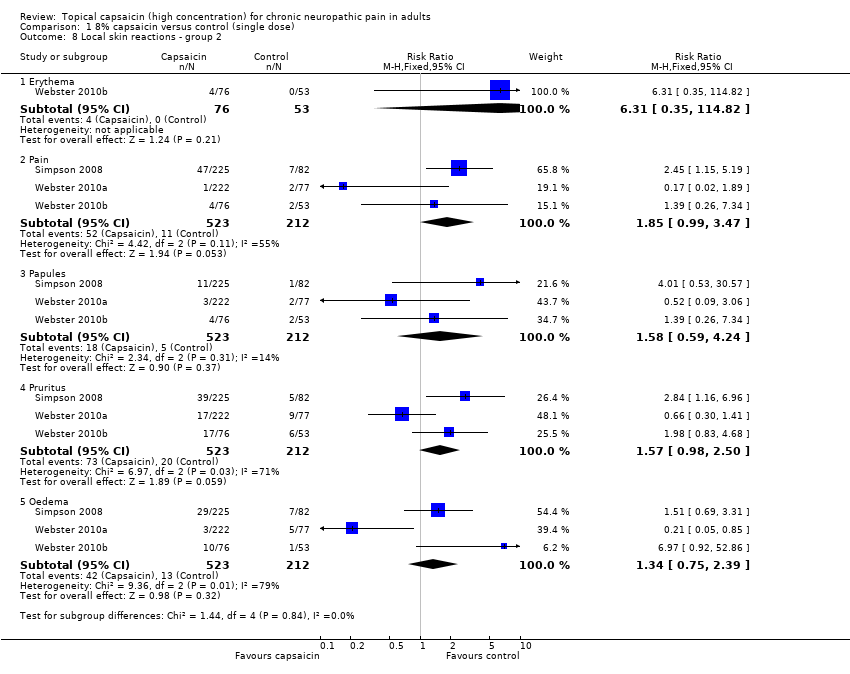
| 8 Local skin reactions ‐ group 2 Show forest plot | 3 | | Risk Ratio (M‐H, Fixed, 95% CI) | Subtotals only |
|
| 8.1 Erythema | 1 | 129 | Risk Ratio (M‐H, Fixed, 95% CI) | 6.31 [0.35, 114.82] |
| 8.2 Pain | 3 | 735 | Risk Ratio (M‐H, Fixed, 95% CI) | 1.85 [0.99, 3.47] |
| 8.3 Papules | 3 | 735 | Risk Ratio (M‐H, Fixed, 95% CI) | 1.58 [0.59, 4.24] |
| 8.4 Pruritus | 3 | 735 | Risk Ratio (M‐H, Fixed, 95% CI) | 1.57 [0.98, 2.50] |
| 8.5 Oedema | 3 | 735 | Risk Ratio (M‐H, Fixed, 95% CI) | 1.34 [0.75, 2.39] |
| 9 Patch tolerability Show forest plot | 6 | | Risk Ratio (M‐H, Fixed, 95% CI) | Subtotals only |
|
| 9.1 < 90% of application time | 6 | 2074 | Risk Ratio (M‐H, Fixed, 95% CI) | 3.27 [1.17, 9.15] |
| 9.2 Dermal irritation score > 2 at 2 h | 3 | 1065 | Risk Ratio (M‐H, Fixed, 95% CI) | 11.80 [4.04, 34.48] |
| 9.3 Dermal irritation score > 0 at 2 h | 2 | 606 | Risk Ratio (M‐H, Fixed, 95% CI) | 2.28 [1.60, 3.26] |
| 9.4 Rescue medication 0 to 5 d | 6 | 2073 | Risk Ratio (M‐H, Fixed, 95% CI) | 2.47 [2.13, 2.87] |
| 10 Serious adverse events Show forest plot | 5 | 1579 | Risk Ratio (M‐H, Fixed, 95% CI) | 1.41 [0.82, 2.41] |
|
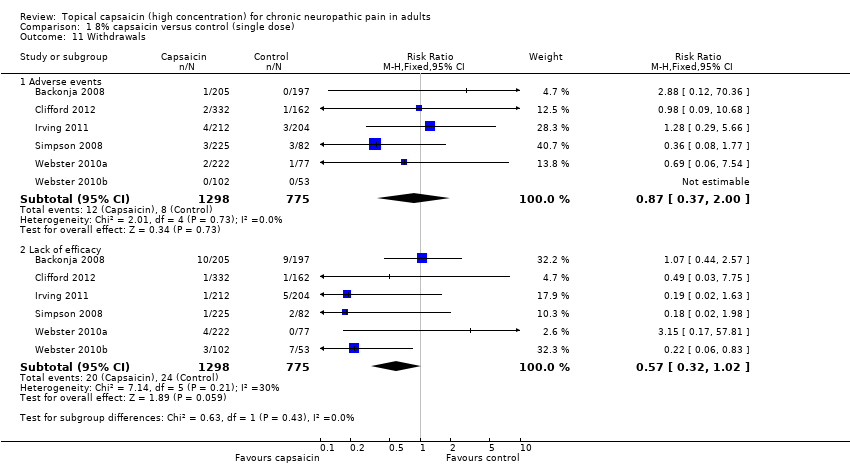
| 11 Withdrawals Show forest plot | 6 | | Risk Ratio (M‐H, Fixed, 95% CI) | Subtotals only |
|
| 11.1 Adverse events | 6 | 2073 | Risk Ratio (M‐H, Fixed, 95% CI) | 0.87 [0.37, 2.00] |
| 11.2 Lack of efficacy | 6 | 2073 | Risk Ratio (M‐H, Fixed, 95% CI) | 0.57 [0.32, 1.02] |