Diferentes duraciones del tratamiento con corticosteroides para las exacerbaciones de la enfermedad pulmonar obstructiva crónica
Información
- DOI:
- https://doi.org/10.1002/14651858.CD006897.pub3Copiar DOI

- Base de datos:
-
- Cochrane Database of Systematic Reviews
- Versión publicada:
-
- 10 diciembre 2014see what's new
- Tipo:
-
- Intervention
- Etapa:
-
- Review
- Grupo Editorial Cochrane:
-
Grupo Cochrane de Vías respiratorias
- Copyright:
-
- Copyright © 2014 The Cochrane Collaboration. Published by John Wiley & Sons, Ltd.
Cifras del artículo
Altmetric:
Citado por:
Autores
Contributions of authors
JAE Walters contributed to searches and study selection, data extraction, data entry and analysis and interpretation of results. D Tan and C White contributed to searches and study selection, data extraction, data entry and analysis and interpretation of results. This review was drafted and revised by JAE Walters, and D Tan, C White and R Wood‐Baker contributed to revisions.
Sources of support
Internal sources
-
Breathe Well Centre of Research Excellence, University of Tasmania, Australia.
Logistical support
External sources
-
NHMRC, Australia.
Funding support for the Australian Satellite of the Cochrane Airways Group
Declarations of interest
R Wood‐Baker was chief investigator in a study contributing data to this review. Data from this study were verified and analysed by JAE Walters.
Acknowledgements
We acknowledge the work of Wendy Wang, Carla Morley and Amir Soltani, as authors of the previous version of this review, published in 2011.
We acknowledge the assistance of the following individuals.
-
Dr Worawan Sirichana, Department of Medicine, Chulalongkorn University, Bangkok, Thailand, who kindly supplied study information and data.
-
Dr C Xie and Dr G Chen, Department of Respiratory Medicine, First Affiliated Hospital of Zhongshan University, Guangzhou, China, who kindly supplied study information and data.
-
Dr Abdullah Sayiner of Ege University, Ismir, Turkey, who kindly supplied study information.
-
Dr W Chou and Dr M Sung, who wrote the first draft of the protocol, and Yi Foong, who provided translation from Mandarin.
Chris Cates was the Editor for this review and commented critically on the review.
TheBackground and Methods sections of this protocol/review are based on a standard template used by the Cochrane Airways Group.
Version history
| Published | Title | Stage | Authors | Version |
| 2018 Mar 19 | Different durations of corticosteroid therapy for exacerbations of chronic obstructive pulmonary disease | Review | Julia AE Walters, Daniel J Tan, Clinton J White, Richard Wood‐Baker | |
| 2014 Dec 10 | Different durations of corticosteroid therapy for exacerbations of chronic obstructive pulmonary disease | Review | Julia AE Walters, Daniel J Tan, Clinton J White, Richard Wood‐Baker | |
| 2011 Oct 05 | Different durations of corticosteroid therapy for exacerbations of chronic obstructive pulmonary disease | Review | Julia AE Walters, Wendy Wang, Carla Morley, Amir Soltani, Richard Wood‐Baker | |
| 2008 Jan 23 | Different durations of corticosteroid therapy for exacerbations of chronic obstructive pulmonary disease | Protocol | Wei Yang Chou, Amir Soltani, Mei‐Jo Sung, Julia AE Walters, Richard Wood‐Baker | |
Differences between protocol and review
Adverse events were included as a primary outcome, and the order of the secondary outcomes was changed. Methods were updated to apply the latest intervention methods, as required for a Cochrane review, and a 'Summary of findings' table was included.
Keywords
MeSH
Medical Subject Headings (MeSH) Keywords
- Administration, Oral;
- Adrenal Cortex Hormones [*administration & dosage, adverse effects];
- Disease Progression;
- Drug Administration Schedule;
- Glucocorticoids [administration & dosage, adverse effects];
- Methylprednisolone [administration & dosage, adverse effects];
- Prednisolone [administration & dosage, adverse effects];
- Pulmonary Disease, Chronic Obstructive [*drug therapy];
- Quality of Life;
- Randomized Controlled Trials as Topic;
- Treatment Failure;
Medical Subject Headings Check Words
Aged; Female; Humans; Male; Middle Aged;
PICO

1 Study flow diagram.

Risk of bias summary: review authors' judgements about each item for each included study.

Risk of bias graph: review authors' judgements about each risk of bias item presented as percentages across all included studies.

Forest plot outcome: treatment failure comparing systemic corticosteroids for ≤ 7 days vs > 7 days.
Forest plot of comparison: 1 Systemic corticosteroids for 7 or fewer days vs longer than seven days, outcome: 1.2 Relapse.

Comparison 1 Systemic corticosteroids for 7 or fewer days vs longer than 7 days, Outcome 1 Treatment failure.

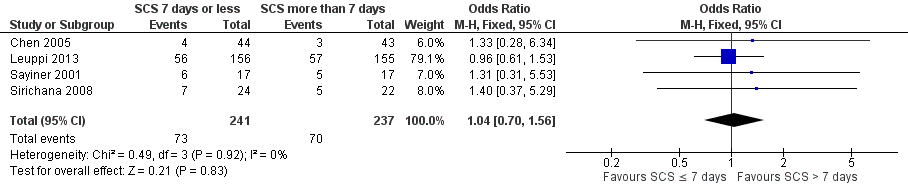
Comparison 1 Systemic corticosteroids for 7 or fewer days vs longer than 7 days, Outcome 2 Relapse.
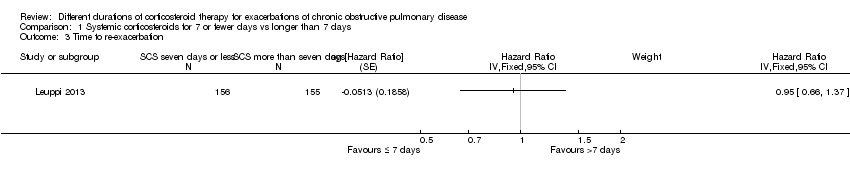
Comparison 1 Systemic corticosteroids for 7 or fewer days vs longer than 7 days, Outcome 3 Time to re‐exacerbation.

Comparison 1 Systemic corticosteroids for 7 or fewer days vs longer than 7 days, Outcome 4 Adverse effect—hyperglycaemia.
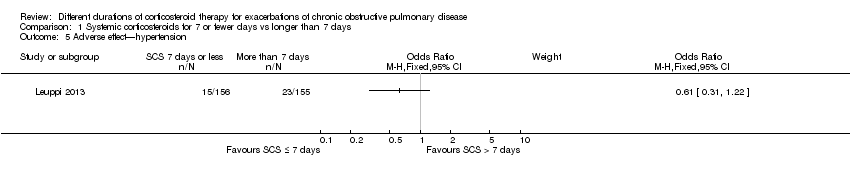
Comparison 1 Systemic corticosteroids for 7 or fewer days vs longer than 7 days, Outcome 5 Adverse effect—hypertension.

Comparison 1 Systemic corticosteroids for 7 or fewer days vs longer than 7 days, Outcome 6 Other adverse effects—gastrointestinal tract bleeding, symptomatic gastrointestinal reflux, symptoms of congestive heart failure or ischaemic heart disease, sleep disturbance, fractures, depression.

Comparison 1 Systemic corticosteroids for 7 or fewer days vs longer than 7 days, Outcome 7 Mortality.
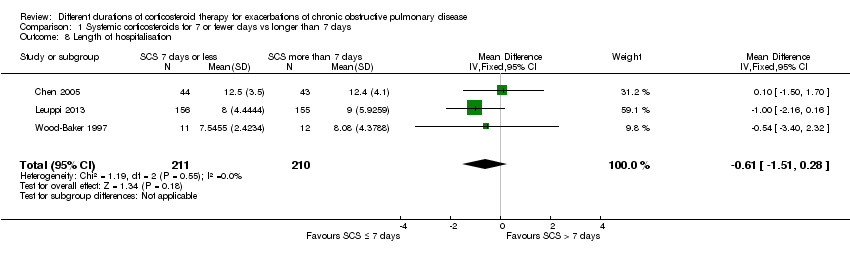
Comparison 1 Systemic corticosteroids for 7 or fewer days vs longer than 7 days, Outcome 8 Length of hospitalisation.

Comparison 1 Systemic corticosteroids for 7 or fewer days vs longer than 7 days, Outcome 9 FEV1 (L) (early).

Comparison 1 Systemic corticosteroids for 7 or fewer days vs longer than 7 days, Outcome 10 FEV1 % predicted (6 days).

Comparison 1 Systemic corticosteroids for 7 or fewer days vs longer than 7 days, Outcome 11 FVC (L) (early).

Comparison 1 Systemic corticosteroids for 7 or fewer days vs longer than 7 days, Outcome 12 FEV1 (L) end of treatment.

Comparison 1 Systemic corticosteroids for 7 or fewer days vs longer than 7 days, Outcome 13 FEV1 % predicted 30 days.

Comparison 1 Systemic corticosteroids for 7 or fewer days vs longer than 7 days, Outcome 14 FVC (L) end of treatment.

Comparison 1 Systemic corticosteroids for 7 or fewer days vs longer than 7 days, Outcome 15 PaO2 (mmHg) (early).

Comparison 1 Systemic corticosteroids for 7 or fewer days vs longer than 7 days, Outcome 16 PaO2 (mmHg) end of treatment.
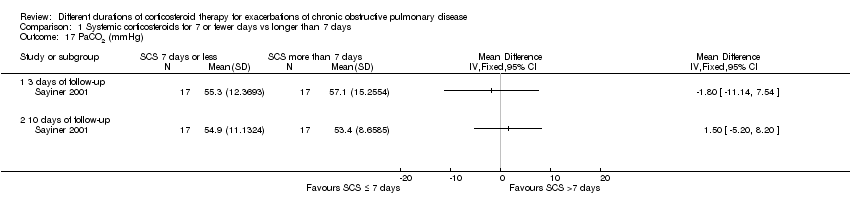
Comparison 1 Systemic corticosteroids for 7 or fewer days vs longer than 7 days, Outcome 17 PaCO2 (mmHg).
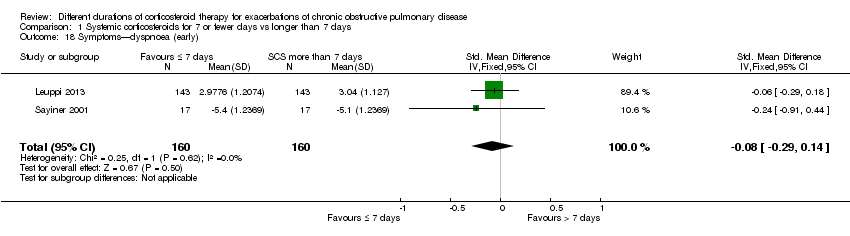
Comparison 1 Systemic corticosteroids for 7 or fewer days vs longer than 7 days, Outcome 18 Symptoms—dyspnoea (early).
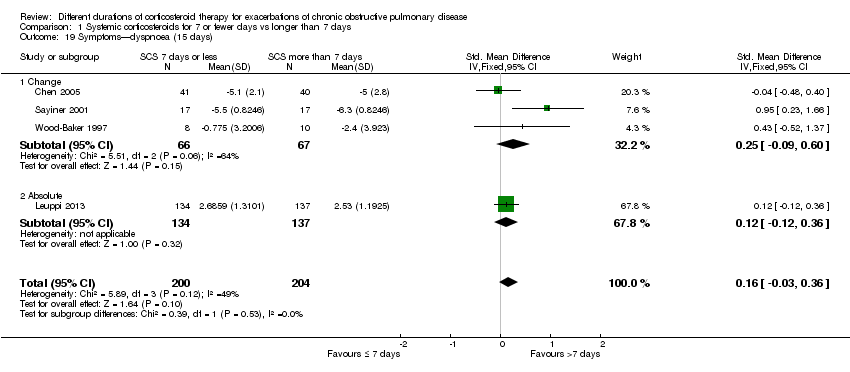
Comparison 1 Systemic corticosteroids for 7 or fewer days vs longer than 7 days, Outcome 19 Symptoms—dyspnoea (15 days).

Comparison 1 Systemic corticosteroids for 7 or fewer days vs longer than 7 days, Outcome 20 Quality of life—overall (6 days).
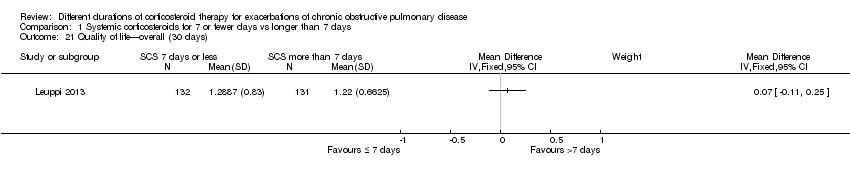
Comparison 1 Systemic corticosteroids for 7 or fewer days vs longer than 7 days, Outcome 21 Quality of life—overall (30 days).
| SCS treatment for 7 or fewer days compared with SCS treatment for longer than 7 days for acute exacerbations of COPD | ||||||
| Patient or population: patients with acute exacerbations of COPD | ||||||
| Outcomes | Illustrative comparative risks* (95% CI) | Relative effect | Number of participants | Quality of the evidence | Comments | |
| Assumed risk | Corresponding risk | |||||
| SCS treatment for longer than 7 days | SCS treatment for 7 or fewer days | |||||
| Treatment failure | 83 per 1000 | 61 per 1000 | OR 0.72 | 457 | ⊕⊕⊕⊝ | Equivalent to 22 fewer (95% CI 51 fewer to 34 more) |
| Relapse | 295 per 1000 | 304 per 1000 | OR 1.04 | 478 | ⊕⊕⊕⊝ | In one study (Leuppi 2013), hazard ratio for time to re‐exacerbation was 0.95 (95% CI 0.66 to 1.37) |
| Adverse drug effect—hyperglycaemia | 442 per 1000 | 439 per 1000 | OR 0.99 | 345 | ⊕⊕⊕⊝ | |
| Adverse drug effects | 84 per 1000 | 75 per 1000 | OR 0.88 | 503 | ⊕⊕⊝⊝ | |
| Mortality | 77 per 1000 | 71 per 1000 | OR 0.91 | 336 | ⊕⊕⊕⊝ | |
| Length of hospitalisation | Mean length of hospitalisation in control groups was | Mean length of hospitalisation in intervention groups was | 421 | ⊕⊕⊕⊝ | ||
| Lung function (end of treatment) | Mean FEV1 in control groups ranged from 0.84 to 1.14 L | Mean lung function (end of treatment) in intervention groups was | 187 | ⊕⊝⊝⊝ | ||
| Health‐related quality of life (QOL) Overall score (includes activity limitations, symptoms, fatigue, emotional functioning); scale 0 best to 6 worst; minimum important difference 0.5 Follow‐up: 30 days | Mean QOL score in control groups was 1.24 | Mean QOL score in intervention groups was 0.06 higher (‐0.16 lower to 0.28 higher) | 271 (1 study) | ⊕⊕⊕⊝ | ||
| *The basis for the assumed risk (e.g. median control group risk across studies) is provided in footnotes. The corresponding risk (and its 95% confidence interval) is based on the assumed risk in the comparison group and the relative effect of the intervention (and its 95% CI). | ||||||
| GRADE Working Group grades of evidence. | ||||||
| aWide confidence intervals include significant benefit or harm (‐1 for imprecision). | ||||||
| Study ID/Setting | Inclusion criteria | AE definition | N participants included/Completing | Mean age, years | % males/ % smokers | Prestudy SCS use, % | SCS ≤ 7 days | SCS > 7 days | Definition of treatment failure |
| Chen 2005 China/ inpatients | 2 years of continuous productive cough, FEV1/FVC post BD < 0.7, FEV1 < 80% predicted. No respiratory failure, diabetes or bronchial asthma | At least 2 of 3 symptoms: increased sputum or dyspnoea or purulent sputum | 86/81 | 71 | 75/44 | Not stated | Prednisolone 30 mg 7 days | Prednisolone 30 mg/d 10 days + 15 mg/d 5 days | Not known |
| Gomaa 2008 (abstract only) | FEV1 < 50% predicted, no respiratory acidosis | Not stated | 42/Not known | Not stated | Not stated | Not stated | Prednisolone 30 mg 7 days | Prednisolone 30 mg 15 days | Outcome not reported |
| Leuppi 2013 Switzerland/5 sites | Age > 40 years, smoking history ≥ 20 pack‐years | At least 2 of the following: change in baseline dyspnoea, cough or sputum quantity/purulence | 314/296 | 69 | 60/45 | 20 | 5 days: days 1 to 4 methylprednisolone 40 mg, days 2 to 5 oral prednisolone 40 mg | 14 days: days 1 to 4 methylprednisolone 40 mg, days 2 to 14 oral 40 mg prednisolone | Received open‐label glucocorticoids during index exacerbation |
| Rahman 2004 (abstract only) Bangladesh/1 site | Not stated | Not stated | Not stated | Not stated | Not stated | Not stated | Prednisolone 30 mg 7 days | Prednisolone 30 mg 14 days | Outcome not reported |
| Salam 1998 (abstract only) USA/Unknown sites | Not stated | Not stated | 21/Not known | Not stated | Not stated | None in previous month | IV CS 3 days | IV CS 3 days + 7 days OCS | Outcome not reported |
| Sayiner 2001 Turkey/1 site | FEV1 < 35% predicted, PYH > 20, no respiratory failure requiring ventilation | Not stated, requiring admission | 36/34 | 65 | 94/Not stated | None in previous month | IV methylprednisone 0.5 mg/kg qds 3 days | IV methylprednisone 0.5 mg/kg qds 3 days, bd 3 days, od 4 days | Required open‐label steroid treatment |
| Sirichana 2008 (abstract and author data) Thailand/1 site | Age > 40 years, symptoms > 24 hours | Increase in at least 2 of 3 symptoms—dyspnoea, sputum volume, sputum purulence; requiring admission | 48/42 | 73 | 88/Not stated | None in previous month | Prednisolone 30 mg 5 days | Prednisolone 30 mg 10 days | Outcome not reported |
| Wood‐Baker 1997 (abstract and author data) Australia & New Zealand/2 sites | Age > 40 years; > 10 pack‐year smoking history; FEV1 < 50% predicted | Not stated, requiring admission | 38/28 | 71 | 63/Not stated | None for current AEs, no long‐term OS > 5 mg/d | Prednisolone 2.5 mg/kg orally daily for 3 days | Prednisolone 0.6 mg/kg orally daily for 7 days followed by prednisolone 0.3 mg/kg orally daily for 7 days | Lack of progress according to attending physician during treatment |
| Excluding Sirichana (not blinded) | All studies | |
| Relapse | 1.01 (0.66 to 1.55) | 1.04 (0.70 to 1.56) |
| FEV1 early | ‐0.09 (‐0.22 to 0.05) | ‐0.07 (‐0.19 to 0.05) |
| FEV1 end | ‐0.06 (‐0.23 to 0.11) | ‐0.04 (‐0.19 to 0.10) |
| FVC early | ‐0.00 (‐0.25 to 0.25) | 0.01 (‐0.20 to 0.22) |
| FVC end | ‐0.14 (‐0.38 to 0.09) | ‐0.12 (‐0.33 to 0.09) |
| Adverse event—other | 0.94 (0.48 to 1.82) | 0.89 (0.46 to 1.69) |
| Excluding Sayiner (IV SCS) | All studies | |
| Treatment failure | 0.66 (0.32 to 1.37) | 0.72 (0.36 to 1.46) |
| Relapse | 1.02 (0.67 to 1.56) | 1.04 (0.70 to 1.56) |
| Adverse event—hyperglycaemia | 0.99 (0.63 to 1.54) | 0.99 (0.64 to 1.53) |
| Adverse event—other | 0.89 (0.46 to 1.69) | 0.89 (0.46 to 1.69) |
| FEV1 early | ‐0.02 (‐0.19 to 0.16) | ‐0.07 (‐0.19 to 0.05) |
| FEV1 end | 0.03 (‐0.06 to 0.12) | ‐0.04 (‐0.19 to 0.10) |
| FVC early | 0.12 (‐0.18 to 0.42) | 0.01 (‐0.20 to 0.22) |
| FVC end | ‐0.06 (‐0.34 to 0.22) | ‐0.12 (‐0.33 to 0.09) |
| Outcome or subgroup title | No. of studies | No. of participants | Statistical method | Effect size |
| 1 Treatment failure Show forest plot | 4 | 457 | Odds Ratio (M‐H, Fixed, 95% CI) | 0.72 [0.36, 1.46] |
| 2 Relapse Show forest plot | 4 | 478 | Odds Ratio (M‐H, Fixed, 95% CI) | 1.04 [0.70, 1.56] |
| 3 Time to re‐exacerbation Show forest plot | 1 | Hazard Ratio (Fixed, 95% CI) | Subtotals only | |
| 4 Adverse effect—hyperglycaemia Show forest plot | 2 | 345 | Odds Ratio (M‐H, Fixed, 95% CI) | 0.99 [0.64, 1.53] |
| 5 Adverse effect—hypertension Show forest plot | 1 | Odds Ratio (M‐H, Fixed, 95% CI) | Subtotals only | |
| 6 Other adverse effects—gastrointestinal tract bleeding, symptomatic gastrointestinal reflux, symptoms of congestive heart failure or ischaemic heart disease, sleep disturbance, fractures, depression Show forest plot | 5 | 503 | Odds Ratio (M‐H, Fixed, 95% CI) | 0.89 [0.46, 1.69] |
| 7 Mortality Show forest plot | 2 | 336 | Odds Ratio (M‐H, Fixed, 95% CI) | 0.91 [0.40, 2.06] |
| 8 Length of hospitalisation Show forest plot | 3 | 421 | Mean Difference (IV, Fixed, 95% CI) | ‐0.61 [‐1.51, 0.28] |
| 9 FEV1 (L) (early) Show forest plot | 3 | 96 | Mean Difference (IV, Fixed, 95% CI) | ‐0.07 [‐0.19, 0.05] |
| 9.1 FEV1 absolute | 2 | 75 | Mean Difference (IV, Fixed, 95% CI) | ‐0.08 [‐0.22, 0.06] |
| 9.2 FEV1 change | 1 | 21 | Mean Difference (IV, Fixed, 95% CI) | ‐0.04 [‐0.27, 0.19] |
| 10 FEV1 % predicted (6 days) Show forest plot | 1 | Mean Difference (IV, Fixed, 95% CI) | Subtotals only | |
| 11 FVC (L) (early) Show forest plot | 3 | 97 | Mean Difference (IV, Fixed, 95% CI) | 0.01 [‐0.20, 0.22] |
| 11.1 FVC measured | 2 | 75 | Mean Difference (IV, Fixed, 95% CI) | ‐0.05 [‐0.29, 0.19] |
| 11.2 FVC change from baseline | 1 | 22 | Mean Difference (IV, Fixed, 95% CI) | 0.23 [‐0.23, 0.69] |
| 12 FEV1 (L) end of treatment Show forest plot | 4 | 187 | Mean Difference (IV, Random, 95% CI) | ‐0.04 [‐0.19, 0.10] |
| 12.1 FEV1 measured | 3 | 164 | Mean Difference (IV, Random, 95% CI) | ‐0.05 [‐0.25, 0.16] |
| 12.2 FEV1 change from baseline | 1 | 23 | Mean Difference (IV, Random, 95% CI) | ‐0.04 [‐0.23, 0.14] |
| 13 FEV1 % predicted 30 days Show forest plot | 1 | Mean Difference (IV, Fixed, 95% CI) | Subtotals only | |
| 14 FVC (L) end of treatment Show forest plot | 3 | 99 | Mean Difference (IV, Fixed, 95% CI) | ‐0.12 [‐0.33, 0.09] |
| 14.1 FVC measured | 2 | 77 | Mean Difference (IV, Fixed, 95% CI) | ‐0.14 [‐0.39, 0.11] |
| 14.2 FVC change from baseline | 1 | 22 | Mean Difference (IV, Fixed, 95% CI) | ‐0.07 [‐0.44, 0.29] |
| 15 PaO2 (mmHg) (early) Show forest plot | 1 | Mean Difference (IV, Fixed, 95% CI) | Totals not selected | |
| 16 PaO2 (mmHg) end of treatment Show forest plot | 2 | 121 | Mean Difference (IV, Fixed, 95% CI) | ‐1.38 [‐4.96, 2.21] |
| 17 PaCO2 (mmHg) Show forest plot | 1 | Mean Difference (IV, Fixed, 95% CI) | Totals not selected | |
| 17.1 3 days of follow‐up | 1 | Mean Difference (IV, Fixed, 95% CI) | 0.0 [0.0, 0.0] | |
| 17.2 10 days of follow‐up | 1 | Mean Difference (IV, Fixed, 95% CI) | 0.0 [0.0, 0.0] | |
| 18 Symptoms—dyspnoea (early) Show forest plot | 2 | 320 | Std. Mean Difference (IV, Fixed, 95% CI) | ‐0.08 [‐0.29, 0.14] |
| 19 Symptoms—dyspnoea (15 days) Show forest plot | 4 | 404 | Std. Mean Difference (IV, Fixed, 95% CI) | 0.16 [‐0.03, 0.36] |
| 19.1 Change | 3 | 133 | Std. Mean Difference (IV, Fixed, 95% CI) | 0.25 [‐0.09, 0.60] |
| 19.2 Absolute | 1 | 271 | Std. Mean Difference (IV, Fixed, 95% CI) | 0.12 [‐0.12, 0.36] |
| 20 Quality of life—overall (6 days) Show forest plot | 1 | Mean Difference (IV, Fixed, 95% CI) | Subtotals only | |
| 21 Quality of life—overall (30 days) Show forest plot | 1 | Mean Difference (IV, Fixed, 95% CI) | Subtotals only | |