Diferentes duraciones del tratamiento con corticosteroides para las exacerbaciones de la enfermedad pulmonar obstructiva crónica
Resumen
Antecedentes
Las guías actuales recomiendan que los pacientes con exacerbaciones agudas de la enfermedad pulmonar obstructiva crónica (EPOC) sean tratados con corticosteroides sistémicos entre siete y 14 días. La administración intermitente de corticosteroides sistémicos se asocia de manera acumulativa con efectos adversos como osteoporosis, hiperglucemia y debilidad muscular. Un tratamiento más corto podría reducir los efectos adversos.
Objetivos
Comparar la eficacia del tratamiento con corticosteroides sistémicos de corta duración (siete días o menos) versus el tratamiento convencional de duración más prolongada (más de siete días) en pacientes adultos con exacerbaciones agudas de la EPOC.
Métodos de búsqueda
Las búsquedas se realizaron con el uso del Registro Especializado de Ensayos del Grupo Cochrane de Vías Respiratorias (Cochrane Airways Group), MEDLINE y CENTRAL (Registro Cochrane Central de Ensayos Controlados) y los registros de ensayos en curso hasta marzo de 2017.
Criterios de selección
Ensayos controlados aleatorizados que compararon diferentes duraciones del tratamiento con corticosteroides sistémicos definidas como corto (es decir, siete días o menos) o más prolongado (es decir, más de siete días). Se estandarizaron otras intervenciones (broncodilatadores y antibióticos). Se excluyeron los estudios con participantes que requerían ventilación asistida.
Obtención y análisis de los datos
Se utilizaron los procedimientos metodológicos estándar recomendados por La Colaboración Cochrane.
Resultados principales
Ocho estudios con 582 participantes cumplieron los criterios de inclusión, de los cuales cinco estudios realizados en hospitales con 519 participantes (rango: 28 a 296) contribuyeron al metanálisis. La media de edad de los participantes de los estudios fue de 65 a 73 años, varió la proporción de participantes masculinos (58% a 84%) y la EPOC se clasificó como grave o muy grave. El tratamiento con corticosteroides se administró en dosis diarias equivalentes entre tres y siete días para el tratamiento de corta duración y entre diez y 15 días para el tratamiento de duración más prolongada. Cinco estudios administraron prednisolona oral (30 mg en cuatro, en dosis ajustadas en uno), y dos estudios proporcionaron tratamiento con corticosteroides intravenosos. Los estudios que aportaron datos al metanálisis tuvieron riesgo bajo de sesgo de selección, realización, detección y desgaste. En cuatro estudios no se encontraron diferencias en el riesgo de fracaso del tratamiento entre el tratamiento con corticosteroides sistémicos de corta duración y el de mayor duración (n = 457; odds ratio [OR] 0,72; intervalo de confianza [IC] del 95%: 0,36 a 1,46), lo que equivale a 22 menos por 1000 para el tratamiento de corta duración (IC del 95%: 51 menos a 34 más). No se observaron diferencias en el riesgo de recurrencia (un nuevo evento) entre el tratamiento con corticosteroides sistémicos de corta duración y el de mayor duración (n = 457; OR 1,04; IC del 95%: 0,70 a 1,56), lo que equivale a nueve menos por 1000 para el tratamiento de corta duración (IC del 95%: 68 menos a 100 más). El tiempo transcurrido hasta la próxima exacerbación de la EPOC no difirió en un estudio grande con poder estadístico suficiente para detectar la "no inferioridad" y que comparó cinco días versus 14 días de tratamiento con corticosteroides sistémicos (n = 311; cociente de riesgos instantáneos 0,95; IC del 95%: 0,66 a 1,37). En cinco estudios no se encontraron diferencias en la probabilidad de un evento adverso entre el tratamiento con corticosteroides sistémicos de corta duración y el de mayor duración (n = 503; OR 0,89; IC del 95%: 0,46 a 1,69, o nueve menos por 1000 [IC del 95%: 44 menos a 51 más]). La duración de la estancia hospitalaria (n = 421; diferencia de medias [DM] ‐0,61 días; IC del 95%: ‐1,51 a 0,28) y la función pulmonar al final del tratamiento (n = 185; DM VEF1 ‐0,04 l; IC del 95%: ‐0,19 a 0,10) no difirió entre el tratamiento de corta duración y el de mayor duración.
Conclusiones de los autores
La información de un nuevo estudio grande ha aumentado la confianza en la probabilidad de que cinco días de corticosteroides orales sean suficientes para el tratamiento de los pacientes adultos con exacerbaciones agudas de la EPOC, y esta revisión indica una probabilidad baja de que los ciclos más cortos de corticosteroides sistémicos (de alrededor de cinco días) den lugar a resultados peores que los observados con los ciclos más prolongados (10 a 14 días). La mayoría de la evidencia disponible se consideró de calidad moderada debido a la imprecisión; la realización de nuevos estudios de investigación puede tener un impacto importante en la confianza en las estimaciones del efecto o puede cambiar las estimaciones. Los estudios en esta revisión no incluyeron pacientes con EPOC leve o moderada; se requieren estudios adicionales que comparen corticosteroides sistémicos de corta duración versus corticosteroides sistémicos convencionales de mayor duración para el tratamiento de los pacientes adultos con exacerbaciones agudas de la EPOC.
PICO
Resumen en términos sencillos
¿Los ciclos más cortos de corticosteroides sistémicos tienen la misma efectividad que los ciclos convencionales más prolongados en el tratamiento de los pacientes con exacerbaciones de la EPOC?
¿Por qué es importante esta pregunta?
La enfermedad pulmonar obstructiva crónica (EPOC), que incluye enfisema y bronquitis crónica, es un trastorno pulmonar a largo plazo que habitualmente se asocia con el hábito de fumar. Los pacientes con EPOC pueden presentar exacerbaciones, a menudo precipitadas por la infección, en las cuales los síntomas como la disnea, la tos y la flema empeoran de forma marcada, y se necesita tratamiento adicional o el ingreso al hospital.
Los corticosteroides sistémicos (es decir no inhalados), como la prednisolona, la prednisona y la cortisona, se utilizan con frecuencia en el tratamiento de los pacientes con estas exacerbaciones. Se deseaba evaluar si un ciclo más corto (siete días o menos) de este tratamiento era igual de efectivo que un ciclo con la duración habitual (más de siete días) y causaba menos efectos secundarios.
¿Cómo se respondió la pregunta?
Se realizaron búsquedas de todos los estudios que compararon el tratamiento con corticosteroides orales o inyectados, administrados durante siete días o menos, versus el tratamiento administrado durante más de siete días en los pacientes con exacerbaciones agudas de la EPOC.
¿Qué se encontró?
Se encontraron ocho estudios que incluyeron a 582 pacientes con EPOC que presentaron una exacerbación que requirió tratamiento adicional en el hospital. Estos estudios compararon el tratamiento con corticosteroides orales o inyectados administrados durante siete días o menos versus el tratamiento durante más de siete días. La mayoría de los pacientes de estos estudios tenían más de sesenta años y presentaban síntomas graves o muy graves de EPOC; participaron más hombres que mujeres. La última búsqueda de estudios para ser incluidos en la revisión se realizó en marzo de 2017.
No se observaron diferencias entre los ciclos de tratamiento más cortos y más prolongados. Los pacientes que recibieron tratamiento durante siete días o menos no tuvieron una tasa más alta de fracaso del tratamiento ni transcurrió más tiempo hasta su próxima exacerbación; el número de pacientes que evitaron el fracaso del tratamiento varió entre 51 menos y 34 más por cada 1000 pacientes tratados (un promedio de 22 pacientes menos por cada 1000). El tiempo en el hospital y la función pulmonar (pruebas que incluyen soplar aire) al final del tratamiento no fueron diferentes. No se observaron diferencias entre los tratamientos en los efectos secundarios ni la muerte. La información sobre la calidad de vida, que es un resultado importante para los pacientes con EPOC, fue limitada, debido a que sólo un estudio midió este resultado.
Los ocho estudios incluidos en esta revisión estuvieron en general bien diseñados, y la calidad de la evidencia se consideró moderada debido a la imprecisión de los resultados; se necesitan más estudios de investigación, especialmente con la participación de pacientes con EPOC menos grave.
Authors' conclusions
Summary of findings
| SCS treatment for 7 or fewer days compared with SCS treatment for longer than 7 days for acute exacerbations of COPD | ||||||
| Patient or population: patients with acute exacerbations of COPD | ||||||
| Outcomes | Illustrative comparative risks* (95% CI) | Relative effect | Number of participants | Quality of the evidence | Comments | |
| Assumed risk | Corresponding risk | |||||
| SCS treatment for longer than 7 days | SCS treatment for 7 or fewer days | |||||
| Treatment failure | 83 per 1000 | 61 per 1000 | OR 0.72 | 457 | ⊕⊕⊕⊝ | Equivalent to 22 fewer (95% CI 51 fewer to 34 more) |
| Relapse | 295 per 1000 | 304 per 1000 | OR 1.04 | 478 | ⊕⊕⊕⊝ | In one study (Leuppi 2013), hazard ratio for time to re‐exacerbation was 0.95 (95% CI 0.66 to 1.37) |
| Adverse drug effect—hyperglycaemia | 442 per 1000 | 439 per 1000 | OR 0.99 | 345 | ⊕⊕⊕⊝ | |
| Adverse drug effects | 84 per 1000 | 75 per 1000 | OR 0.88 | 503 | ⊕⊕⊝⊝ | |
| Mortality | 77 per 1000 | 71 per 1000 | OR 0.91 | 336 | ⊕⊕⊕⊝ | |
| Length of hospitalisation | Mean length of hospitalisation in control groups was | Mean length of hospitalisation in intervention groups was | 421 | ⊕⊕⊕⊝ | ||
| Lung function (end of treatment) | Mean FEV1 in control groups ranged from 0.84 to 1.14 L | Mean lung function (end of treatment) in intervention groups was | 187 | ⊕⊝⊝⊝ | ||
| Health‐related quality of life (QOL) Overall score (includes activity limitations, symptoms, fatigue, emotional functioning); scale 0 best to 6 worst; minimum important difference 0.5 Follow‐up: 30 days | Mean QOL score in control groups was 1.24 | Mean QOL score in intervention groups was 0.06 higher (‐0.16 lower to 0.28 higher) | 271 (1 study) | ⊕⊕⊕⊝ | ||
| *The basis for the assumed risk (e.g. median control group risk across studies) is provided in footnotes. The corresponding risk (and its 95% confidence interval) is based on the assumed risk in the comparison group and the relative effect of the intervention (and its 95% CI). | ||||||
| GRADE Working Group grades of evidence. | ||||||
| aWide confidence intervals include significant benefit or harm (‐1 for imprecision). | ||||||
Background
Description of the condition
Chronic obstructive pulmonary disease (COPD) is characterised by persistent airflow limitation that is usually progressive and is associated with an enhanced chronic inflammatory response to noxious particles or gases in the airways and the lung (GOLD 2014). A diagnosis of COPD is considered on a clinical basis in the presence of symptoms such as dyspnoea, chronic cough or sputum production and exposure to known risk factors. Confirmation of COPD diagnosis is based on demonstration of persistent airflow limitation with spirometry, according to the criterion of postbronchodilator forced expiratory volume in one second (FEV1)/forced vital capacity (FVC) ratio less than 0.7, as specified in guidelines included in GOLD (Global Strategy for Diagnosis, Management, and Prevention of COPD) (GOLD 2014). However, heterogeneity (Agusti 2010) and phenotypical variation in COPD (Weatherall 2009) are increasingly recognised. COPD and asthma overlap syndrome are known to have a higher prevalence in older individuals and are associated with more frequent exacerbations (Hardin 2014).
COPD is an important and increasing cause of mortality; it was estimated to be the fifth leading cause of death in the year 2000 and was responsible for 2.75 million deaths (Lopez 2006). Worldwide mortality due to COPD is projected to rise to 4.5 million deaths in 2020, becoming the third leading cause (Murray 1997). Worldwide COPD resulted in 16.5 million years of life lost in 2000, almost 10 million years lived with disability and 26.5 million disability‐adjusted life‐years (Lopez 2006).
The Burden of Lung Disease (BOLD) study (Buist 2007) reported a worldwide prevalence of stage II or greater severity (FEV1 < 80% predicted) of 10.1% (standard error (SE) 4.8) overall, 11.8% (SE 7.9) for men and 8.5% (SE 5.8) for women. International variation in the prevalence and severity of COPD is partially explained by variation in smoking prevalence and other risk factors (Buist 2007).
Exacerbations and co‐morbidities contribute to the varying natural history of COPD in individual patients (GOLD 2014). Exacerbations contribute to long‐term decline in lung function (Donaldson 2002) and reduced physical activity (Donaldson 2005) and are associated with increased risk of death (Soler‐Cataluna 2005). They also have a profound and long‐lasting effect on quality of life (Groenewegen 2001; Wilkinson 2004); in 10% of exacerbations, pre‐exacerbation quality of life was not recovered after three months (Seemungal 2000).
Exacerbations of COPD are a frequent cause of hospitalisation (Donaldson 2006), although exacerbations with less severe symptoms and signs are often managed on an outpatient basis (NICE 2010). Hospital‐at‐home or early discharge services, if available, may be used as an alternative way of caring for patients with exacerbations of COPD who otherwise would need to be admitted or to remain in hospital (NICE 2010). Treatment of patients with exacerbations is a large contributor to the economic burden of COPD (Schermer 2002; Sullivan 2000), and a high proportion of costs is due to hospitalisation (Oostenbrink 2004).
Studies on the frequency of exacerbations usually use an “event‐based” definition based on healthcare utilization (Effing 2009), and different events may be a proxy for severity, with unscheduled clinic or emergency room visits rated “moderate,” and those requiring hospitalisation labelled “severe” (Rodriguez‐Roisin 2000). However, the clinical onset of an acute exacerbation is defined according to symptoms, although no universally agreed upon definition is known (Rodriguez‐Roisin 2000). Type 1 exacerbations were originally defined by Anthonisen on the basis of three major symptoms: increased dyspnoea, sputum volume and sputum purulence; type 2 exacerbations were associated with only two of the major symptoms, and type 3 exacerbations involved one major symptom plus cough, wheeze or symptoms of an upper respiratory tract infection (Anthonisen 1987). A later definition required an increase in two of the "major symptoms" of dyspnoea—sputum volume or sputum purulence—or in one major symptom and one "minor symptom" (wheeze, sore throat, cough or common cold symptoms) for two days (Seemungal 2000). More recently, a standardised measure for assessing frequency, severity and duration of exacerbations of COPD using patient‐reported outcomes has been developed for use in clinical studies: the EXACT (exacerbations of chronic pulmonary disease tool) diary, which consists of 14 items (Leidy 2010; Leidy 2011).
The inflammatory mechanisms underlying the onset and development of COPD exacerbations are complex (Bathoorn 2008), and exacerbations can be precipitated by several factors, and the most common causes are infective (Papi 2006); bacterial pathogens are identified in just over 50% of cases, and viral causes in around 25% (Sethi 2002; Sherk 2000). Non‐infective causes such as air pollution and other environmental conditions that increase airway inflammation may account for 15% to 20% of exacerbations (Sethi 2008). Exacerbations become more frequent and more severe as the severity of COPD increases (Suissa 2012), although the rate at which they occur may reflect an independent susceptibility phenotype—the “frequent exacerbator” (Hurst 2010).
Description of the intervention
The acute inflammatory response to airway infection is influenced by both pathogenic and host factors, resulting in increased airway and systemic inflammation (Sethi 2008). Airway inflammation is significantly increased during exacerbations of COPD, and evidence of increased numbers of neutrophils, lymphocytes and eosinophils is seen in airways and in sputum (Falk 2008; Papi 2006). Systemic inflammation is also present in COPD; many circulating inflammatory mediators are elevated, both in stable COPD and during exacerbations. C‐reactive protein (CRP) is a known marker of systemic inflammation whose levels are elevated during exacerbations; it is a likely participant in the inflammatory cascade (Falk 2008). Theoretical mechanisms for clinical improvement in lung function among patients treated with corticosteroids during exacerbations may include reduction in airway inflammation or a decrease in airway oedema (Wedzicha 2000).
Why it is important to do this review
Systemic corticosteroid use in COPD is associated with potential adverse drug effects, including fluid retention, hypertension, diabetes mellitus, adrenal suppression and osteoporosis (McEvoy 1996). Fracture risk is increased (De Vries 2007; Vestergaard 2007); this is potentially important, as the rate of existing vertebral compression fractures in the COPD population experiencing acute exacerbations, especially among older people with longer duration of disease, is high (Majumdar 2010). Short‐term use of systemic corticosteroids in the treatment of patients with exacerbations of COPD also has adverse effects on respiratory and peripheral muscle strength (Decramer 1994). The risk of adverse drug effects of systemic corticosteroids in COPD rises with increasing frequency of high‐dose systemic corticosteroid use and with increasing cumulative exposure (more than 1 g) (De Vries 2007).
Systemic corticosteroid treatment of patients with acute exacerbations of COPD decreases treatment failure and is associated with early improvement in lung function, breathlessness and arterial hypoxaemia and reduced length of hospital stay (Walters 2014), although in this Cochrane review, the duration of systemic corticosteroid treatment varied, usually described as between three days and 15 days. Guidelines for the management of COPD specify a duration of treatment ranging from seven days to 10 days (GOLD 2014), from seven days to 14 days (NICE 2010) and from 10 days to 14 days (McKenzie 2003). Thus, it is important to define the optimum duration of corticosteroid treatment and to take into account limiting potential adverse effects.
Objectives
To compare the efficacy of short‐duration (seven or fewer days) and conventional longer‐duration (longer than seven days) systemic corticosteroid treatment of adults with acute exacerbations of COPD.
Methods
Criteria for considering studies for this review
Types of studies
Randomised controlled trials (RCTs) comparing short‐duration systemic corticosteroid treatment (seven or fewer days) versus conventional, longer‐duration treatment (longer than seven days).
Types of participants
Adults with an acute exacerbation of COPD. The definition of an acute exacerbation could include any combination of an increase in breathlessness, sputum volume, sputum purulence, cough or wheeze. We excluded studies that included patients with asthma and other lung diseases (e.g. interstitial lung disease, bronchiectasis), unless separate data on participants with COPD alone were available.
Types of interventions
Systemic corticosteroid (SCS) given for a period of seven or fewer days (SCS ≤ 7) versus systemic corticosteroid given for longer than seven days (SCS > 7). Co‐interventions were required to be standardised across groups. We excluded studies in which participants received assisted ventilation (invasive or non‐invasive).
Types of outcome measures
Primary outcomes
-
Treatment failure (e.g. the need for additional treatment, hospital admission/re‐admission for index episode, return to emergency department, unscheduled physician visit for the index episode).
-
Relapse after treatment (e.g. treatment for new acute exacerbation, re‐admission or hospitalisation for COPD).
-
Adverse drug effects.
Secondary outcomes
-
Mortality.
-
Lung function.
-
Length of hospital stay.
-
Arterial blood gases.
-
Symptom scores.
-
Quality of life.
Time period for assessment of continuous outcomes: Early response was measured on or before day seven of treatment, and end of treatment response measurements were made at the time point equivalent to the end of the longer treatment period.
Search methods for identification of studies
Electronic searches
We identified trials from the Cochrane Airways Trials Register, which is maintained by the Information Specialist for the Group. The Cochrane Airways Trials Register contains studies identified from several sources:
-
Monthly searches of the Cochrane Central Register of Controlled Trials (CENTRAL), through the Cochrane Register of Studies Online (crso.cochrane.org);
-
Weekly searches of MEDLINE Ovid SP 1946 to date;
-
Weekly searches of Embase Ovid SP 1974 to date;
-
Monthly searches of PsycINFO Ovid SP 1967 to date;
-
Monthly searches of CINAHL EBSCO (Cumulative Index to Nursing and Allied Health Literature) 1937 to date;
-
Monthly searches of AMED EBSCO (Allied and Complementary Medicine);
-
Handsearches of the proceedings of major respiratory conferences.
Studies contained in the Trials Register are identified through search strategies based on the scope of Cochrane Airways. Details of these strategies, as well as a list of handsearched conference proceedings are in Appendix 1.
We conducted additional supplementary searches of MEDLINE (PubMed platform, dates covered 1950 to March 2017) and CENTRAL (2017, Issue 3). EMBASE (Embase.com platform, dates covered 1947 to July 2014) searches were conducted in previous versions of this review.. Search strategies used in the Cochrane Airways Register of Trials and other databases are shown in Appendix 2.
For this review update, searches were conducted in the Cochrane Airways Group Register of Trials, and in the other databases in March 2017.
Searching other resources
Bibliographies of RCTs and review articles identified for inclusion were searched for additional papers. Registers of ongoing trials at Clinicaltrials.gov and the WHO trial portal were searched in March 2017.
Data collection and analysis
Selection of studies
All potentially relevant trials were assessed for relevance by at least two review authors (DT, CW), who screened the full text to independently select trials for inclusion and to identify and record reasons for exclusion of ineligible studies. We resolved disagreements through discussion or, if required, we consulted a third person (JW). We identified and excluded duplicates and collated multiple reports of the same study, so that each study (rather than each report) was the unit of interest in the review. We recorded the selection process as a PRISMA flow diagram and in the Characteristics of excluded studies table.
We initially screened all studies using the following criteria.
-
Acute exacerbation of COPD?
-
Systemic corticosteroids as intervention?
-
Comparison of short‐duration (seven or fewer days) versus longer‐duration (longer than seven days) corticosteroid therapy?
-
Randomised controlled trial?
We noted other arms and reasons for study exclusion when appropriate. We determined exclusion using the criteria listed above and categorised the following as applicable.
-
Not different durations of steroids.
-
Not exacerbations of COPD.
-
Not treatment with systemic corticosteroids.
-
Review or other type of article.
We also assessed each study for accuracy of the diagnosis of COPD using the following criteria (GOLD 2014).
-
Did the patient have dyspnoea, chronic cough or sputum production?
-
Was there a history of exposure to risk factors including tobacco smoke; occupational dusts and chemicals; and smoke from home cooking and heating fuel?
-
Was a spirometry measurement of the FEV1/FVC ratio less than 0.7 post bronchodilator?
Data extraction and management
We used a data collection form to document study characteristics and outcome data. Two review authors (DT, CW) extracted the following study characteristics from included studies.
-
Methods: study design, total duration of study, number of study centres and locations, study setting, withdrawals and date of study.
-
Participants: N, mean age, age range, gender, COPD diagnostic criteria, diagnostic criteria for exacerbation, baseline lung function, smoking history, inclusion criteria and exclusion criteria.
-
Interventions: systemic corticosteroid treatment dose/schedule, concomitant medications and excluded medications.
-
Outcomes: primary and secondary outcomes specified and collected and time points reported.
-
Notes: funding for trial and notable conflicts of interest of trial authors.
Two review authors (two of JW, DT, CW) independently extracted outcome data from included studies. Results presented in graphical form were extracted using the software Plot Digitizer. When results were available as means with interquartile ranges, standard deviation was based on the width of the interquartile range—approximately 1.35. standard deviations.
Data were entered into Review Manager (by JW, DT, CW) and were double‐checked by a second review author. We checked that data were entered correctly by comparing data presented in the systematic review against data provided in the study reports.
Assessment of risk of bias in included studies
Two review authors (of JW, CW, DT) independently assessed the risk of bias for each study using the criteria outlined in the Cochrane Handbook for Systematic Reviews of Interventions (Higgins 2011). We resolved disagreements by discussion or by involving another review author. We assessed risk of bias according to the following domains.
-
Random sequence generation.
-
Allocation concealment.
-
Blinding of participants and personnel.
-
Blinding of outcome assessment.
-
Incomplete outcome data.
-
Selective outcome reporting.
-
Presence of other bias(es).
We graded each potential source of bias as high, low or unclear, and provided a quote from the study report, together with a justification for our judgement, in the 'Risk of bias' table. We summarised risk of bias judgements across different studies for each of the domains listed. When information on risk of bias was related to unpublished data or correspondence with a trialist, we noted this in the 'Risk of bias' table.
When considering treatment effects, we took into account the risk of bias for studies that contributed to this outcome.
Measures of treatment effect
For continuous variables, data were analysed as mean differences (MDs) with 95% confidence intervals (CIs). Standardised mean differences (SMDs) with 95% CIs were used when different scales of measurement had been used for an outcome. The SMD is a statistic that expresses the difference in means between treatment groups in units of the pooled standard deviation. Dichotomous outcomes were analysed using Mantel‐Haenszel odds ratios with 95% CIs. When events were rare, we employed the Peto odds ratio. Scale data were entered with a consistent direction of effect.
We undertook meta‐analyses only when these were meaningful—when treatments, participants and the underlying clinical question were similar. When data were skewed, we described them narratively.
For 'time‐to‐event' outcomes such as log hazard ratios, the fixed‐effect generic inverse variance outcome was used to combine results. This method provides a weighted average of the effect estimates of separate studies (Higgins 2011). Number needed to treat for an additional beneficial outcome was calculated from the pooled odds ratio and its confidence interval, using baseline risk in the control group.
Unit of analysis issues
We analysed dichotomous data using participants as the unit of analysis. For continuous data, the MD based on change from baseline was preferred over the MD based on absolute values when both were available.
Dealing with missing data
We contacted investigators to obtain missing numerical outcome data when possible (e.g. when a study was reported as an abstract only). When this was not possible, and when missing data were thought to introduce serious bias, we performed a sensitivity analysis to explore the impact of including such studies in the overall assessment of results.
Assessment of heterogeneity
An assessment of possible heterogeneity, when the null hypothesis is that all studies are evaluating the same effect, was carried out for pooled effects using a Breslow‐Day test of heterogeneity; the Chi2 test measures the deviation of observed effect sizes from an underlying overall effect. This test has low power for detecting true heterogeneity when studies have small sample size or are few in number, hence we used a P value of 0.10 (Deeks 2008). In addition, the I2 statistic, which describes the percentage of total variation across studies that is due to heterogeneity rather than to chance (Higgins 2003), was used. Statistical heterogeneity was interpreted as follows: 0% to 40% might not be important, 30% to 60% may represent moderate heterogeneity and 50% to 90% may represent substantial heterogeneity (Higgins 2011).
We assessed clinical and methodological heterogeneity by recording differences in study design and participant characteristics between individual studies. When we found substantial heterogeneity, we reported this and explored possible causes by performing prespecified subgroup analysis.
Assessment of reporting biases
We tried to minimise reporting bias from non‐publication of studies or selective outcome reporting by using a broad search strategy. We checked references of included studies and relevant systematic reviews, and we contacted study authors to request additional outcome data. To assess the presence of publication bias, we visually inspected funnel plots when 10 or more studies contributed to the analysis for a specified outcome.
Data synthesis
Data were pooled using Review Manager 5.3 (RevMan 2014). We used a fixed‐effect model, and when heterogeneity could not be explained, we performed a sensitivity analysis using a random‐effects model. We presented the findings of our primary outcomes in a 'Summary of findings' table according to recommendations provided in the Cochrane Handbook for Systematic Reviews of Interventions (Higgins 2011) (generated with the use of GradePro software).
Subgroup analysis and investigation of heterogeneity
When we detected statistically significant heterogeneity (P value < 0.10), several options were available. We explored the clinical diversity of studies through prespecified subgroup analyses by comparing the following factors.
-
Definition of COPD.
-
Aspects of study quality (e.g. concealment of allocation).
-
Characteristics of participants.
We considered random‐effects analysis methods (DerSimonian 1986) when heterogeneity was unexplained and study sizes were large, or when study findings were not pooled.
We performed subgroup analyses, stratified by the following variables, when possible.
-
Inpatient versus outpatient.
-
Studies that included participants previously treated with corticosteroids (inhaled and systemic).
Sensitivity analysis
In assessment of heterogeneity, possible causes arising from details of study design were considered. Sensitivity analyses were performed using a random‐effects model versus a fixed‐effect model for risk of bias and other potential confounders.
Results
Description of studies
Results of the search
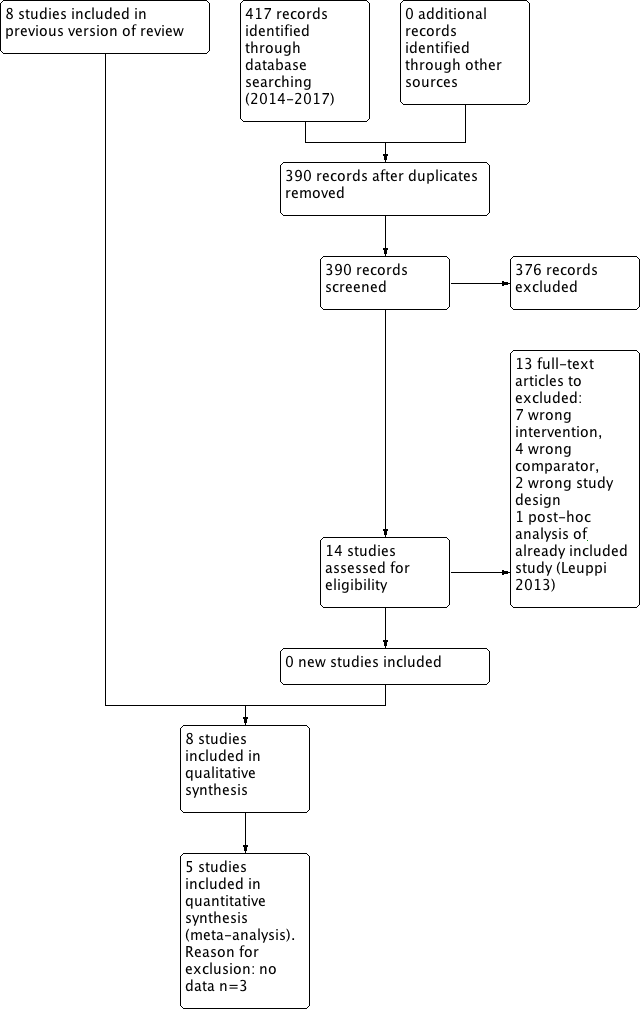
Of 644 unique records obtained in the 2011 searches (Figure 1), seven studies met the inclusion criteria, of which four reported data and contributed to the original meta‐analysis (Walters 2011). One ongoing study (Reid 2010) suspended recruitment in 2010, but no data are available. Searches from 2011 to 2014 yielded 284 results in the Cochrane Airways Group Register of Trials, 39 results in CINAHL, 168 in EMBASE and 102 in CENTRAL. When the inclusion criteria were applied, one new study was identified for inclusion (Leuppi 2013), which was listed as an ongoing trial in 2011.

1 Study flow diagram.
In March 2017, we ran an update search. This returned 417 references of which 13 were duplicate, 390 were judged as irrelevant based on title and abstract alone. 14 full text articles were assessed, 13 excluded (7 Wrong intervention, 4 Wrong comparator, 2 Wrong study design), 1 citation belonged to an already included study (Leuppi 2013).
One on‐going study was identified as of March 2017 (Leuppi 2017).
Included studies
We have provided details of the eight included studies in the Characteristics of included studies table and a comparison of their main inclusion criteria and characteristics in Table 1.
| Study ID/Setting | Inclusion criteria | AE definition | N participants included/Completing | Mean age, years | % males/ % smokers | Prestudy SCS use, % | SCS ≤ 7 days | SCS > 7 days | Definition of treatment failure |
| Chen 2005 China/ inpatients | 2 years of continuous productive cough, FEV1/FVC post BD < 0.7, FEV1 < 80% predicted. No respiratory failure, diabetes or bronchial asthma | At least 2 of 3 symptoms: increased sputum or dyspnoea or purulent sputum | 86/81 | 71 | 75/44 | Not stated | Prednisolone 30 mg 7 days | Prednisolone 30 mg/d 10 days + 15 mg/d 5 days | Not known |
| Gomaa 2008 (abstract only) | FEV1 < 50% predicted, no respiratory acidosis | Not stated | 42/Not known | Not stated | Not stated | Not stated | Prednisolone 30 mg 7 days | Prednisolone 30 mg 15 days | Outcome not reported |
| Leuppi 2013 Switzerland/5 sites | Age > 40 years, smoking history ≥ 20 pack‐years | At least 2 of the following: change in baseline dyspnoea, cough or sputum quantity/purulence | 314/296 | 69 | 60/45 | 20 | 5 days: days 1 to 4 methylprednisolone 40 mg, days 2 to 5 oral prednisolone 40 mg | 14 days: days 1 to 4 methylprednisolone 40 mg, days 2 to 14 oral 40 mg prednisolone | Received open‐label glucocorticoids during index exacerbation |
| Rahman 2004 (abstract only) Bangladesh/1 site | Not stated | Not stated | Not stated | Not stated | Not stated | Not stated | Prednisolone 30 mg 7 days | Prednisolone 30 mg 14 days | Outcome not reported |
| Salam 1998 (abstract only) USA/Unknown sites | Not stated | Not stated | 21/Not known | Not stated | Not stated | None in previous month | IV CS 3 days | IV CS 3 days + 7 days OCS | Outcome not reported |
| Sayiner 2001 Turkey/1 site | FEV1 < 35% predicted, PYH > 20, no respiratory failure requiring ventilation | Not stated, requiring admission | 36/34 | 65 | 94/Not stated | None in previous month | IV methylprednisone 0.5 mg/kg qds 3 days | IV methylprednisone 0.5 mg/kg qds 3 days, bd 3 days, od 4 days | Required open‐label steroid treatment |
| Sirichana 2008 (abstract and author data) Thailand/1 site | Age > 40 years, symptoms > 24 hours | Increase in at least 2 of 3 symptoms—dyspnoea, sputum volume, sputum purulence; requiring admission | 48/42 | 73 | 88/Not stated | None in previous month | Prednisolone 30 mg 5 days | Prednisolone 30 mg 10 days | Outcome not reported |
| Wood‐Baker 1997 (abstract and author data) Australia & New Zealand/2 sites | Age > 40 years; > 10 pack‐year smoking history; FEV1 < 50% predicted | Not stated, requiring admission | 38/28 | 71 | 63/Not stated | None for current AEs, no long‐term OS > 5 mg/d | Prednisolone 2.5 mg/kg orally daily for 3 days | Prednisolone 0.6 mg/kg orally daily for 7 days followed by prednisolone 0.3 mg/kg orally daily for 7 days | Lack of progress according to attending physician during treatment |
All eight studies with a total of 582 participants were parallel‐group RCTs comparing systemic corticosteroid treatment for seven or fewer days versus treatment for longer than seven days in people with an acute exacerbation of COPD; all were conducted in hospital settings. These studies were published between 1997 and 2013. Two studies reported the definition for COPD diagnosis (Chen 2005; Leuppi 2013), and two studies specified the inclusion of participants with an FEV1 below 50% predicted (Gomaa 2008; Wood‐Baker 1997) or below 35% predicted (Sayiner 2001). Two studies (Leuppi 2013; Sirichana 2008) provided a specific symptom‐based definition of an acute exacerbation.
Studies varied in size from 21 to 314 participants; the mean age of participants was between 65 and 73 years, and the proportion of female participants ranged from 6% to 42% (in four studies that reported these data). Participants had severe to very severe COPD; in two studies baseline mean FEV1 ranged from 0.5 to 0.8 litres, and in two other studies baseline mean FEV1 ranged from 25% to 33% predicted.
Five studies used only oral prednisolone (Chen 2005; Gomaa 2008; Rahman 2004; Sirichana 2008; Wood‐Baker 1997) at a dose of 30 mg daily, except Wood‐Baker 1997, which provided oral prednisolone 2.5 mg/kg in the short‐duration arm and a tapered dose (0.6 mg/kg/d for seven days followed by 0.3 mg/kg/d for seven days) in the longer‐duration arm. Three studies used intravenous corticosteroid initially in both arms for 24 or 72 hours: methylprednisolone in Leuppi 2013 and Sayiner 2001, and an unspecified intravenous corticosteroid in Salam 1998. Participants then received systemic corticosteroids intravenously for seven days in Sayiner 2001 and orally for seven days in Salam 1998 in the longer‐duration arm. All participants in Leuppi 2013 received oral prednisone from day 2 onwards for the appropriate treatment duration.
Duration of treatment in the short‐course arm was three days in Salam 1998, Sayiner 2001 and Wood‐Baker 1997; five days in Leuppi 2013 and Sirichana 2008; and seven days in Chen 2005, Gomaa 2008 and Rahman 2004. The duration of longer‐course treatment was 10 days in Salam 1998, Sayiner 2001 and Sirichana 2008; 14 days in Gomaa 2008, Leuppi 2013, Rahman 2004 and Wood‐Baker 1997; and 15 days in Chen 2005.
Three studies were published as full papers (Chen 2005; Leuppi 2013; Sayiner 2001), and additional data were supplied by the study author for Chen 2005. Of five studies published only as abstracts in conference proceedings, data were supplied by authors for Sirichana 2008 and Wood‐Baker 1997. Despite at least two requests, no data were made available for Gomaa 2008, Rahman 2004 and Salam 1998.
Excluded studies
A total of 23 studies with reasons for exclusion are listed in Characteristics of excluded studies.
Risk of bias in included studies
The methodological quality of the published included trials was good; they were determined to have low risk of selection, performance, detection and attrition bias. Risk of bias was unclear in studies available only as abstracts (Figure 2 and Figure 3).

Risk of bias summary: review authors' judgements about each item for each included study.

Risk of bias graph: review authors' judgements about each risk of bias item presented as percentages across all included studies.
Allocation
In four studies (Chen 2005; Leuppi 2013; Sayiner 2001; Wood‐Baker 1997) the randomisation procedure was adequate, but sequence generation was unclear. Allocation concealment was adequate in four studies (Chen 2005; Leuppi 2013; Sayiner 2001; Sirichana 2008) but was not described in four studies.
Blinding
Four studies were double blind (Chen 2005; Leuppi 2013; Sayiner 2001; Wood‐Baker 1997). One study (Sirichana 2008) was not blinded to participants or investigators. Blinding was unclear in the three other studies, although one study (Gomaa 2008) stated that the study was single blinded but provided no further details.
Incomplete outcome data
Incomplete data were adequately addressed in four studies (Chen 2005; Leuppi 2013; Sayiner 2001; Wood‐Baker 1997), but risk of bias was judged high in Sirichana 2008 and was unclear in three studies.
Selective reporting
Three studies were assessed as free of selective reporting (Leuppi 2013; Sayiner 2001; Wood‐Baker 1997), but risk of bias was unclear in five studies.
Effects of interventions
Primary outcomes
1.1 Treatment failure
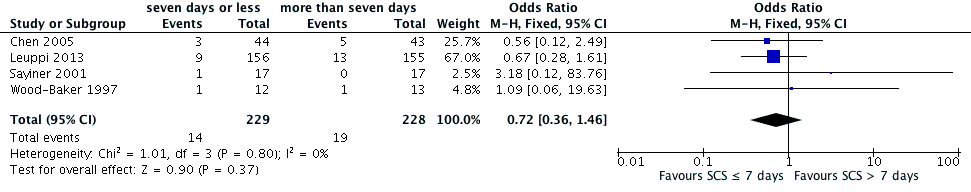
Four studies reported treatment failure that occurred during the index exacerbation, and the definition was provided in three studies (Table 1). No significant difference was noted in the likelihood of treatment failure between systemic corticosteroid for seven or fewer days and longer than seven days (n = 457; odds ratio (OR) 0.72, 95% confidence interval (CI) 0.36 to 1.46; Analysis 1.1; Figure 4), and no statistical heterogeneity was observed. This result is equivalent to 22 fewer treatment failures per 1000 (95% CI 51 fewer to 34 more). The outcome was downgraded for imprecision and was rated as having moderate quality because the confidence intervals for the pooled effect included important benefit and potential harm.

Forest plot outcome: treatment failure comparing systemic corticosteroids for ≤ 7 days vs > 7 days.
1.2 Relapse
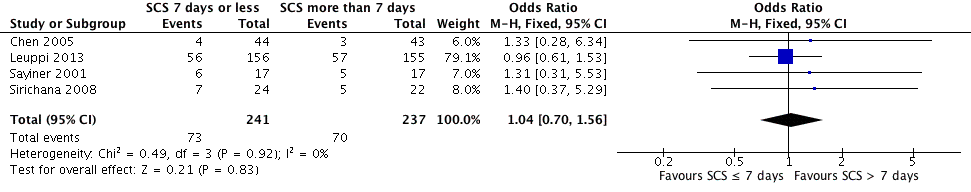
Relapse was measured as a new acute exacerbation or hospital admission for COPD in four studies: Chen 2005 (follow‐up period not stated), Sayiner 2001 and Leuppi 2013 (six‐month follow‐up) and Sirichana 2008 (30‐day follow‐up). No significant difference was reported between systemic corticosteroid use for seven or fewer days and for longer than seven days (n = 478; OR 1.04, 95% CI 0.7 to 1.56; Analysis 1.2; Figure 5), and no statistical heterogeneity was observed. The outcome was downgraded for imprecision and was rated as having moderate quality because the confidence intervals for the pooled effect included important benefit and potential harm.

Forest plot of comparison: 1 Systemic corticosteroids for 7 or fewer days vs longer than seven days, outcome: 1.2 Relapse.
1.3 Time to re‐exacerbation
Time to next COPD exacerbation, defined as "acute‐onset worsening of the patient’s condition beyond day‐to‐day variations requiring interaction with a healthcare provider which could occur during the index exacerbation or during follow‐up," over six months of follow‐up was reported in one study (Leuppi 2013). This study adopted an a priori non‐inferiority definition, by which the proportion of participants with re‐exacerbation during follow‐up should be no more than 65% compared with 50% for standard treatment for an exacerbation, yielding a critical hazard ratio of 1.515. Time to the next exacerbation did not differ in this one large study, which was powered to detect non‐inferiority and compared five days versus 14 days of systemic corticosteroid treatment (n = 311; hazard ratio (HR) 0.95, 95% CI 0.66 to 1.37; Analysis 1.3).
1.4 to 1.6 Adverse effects
1.4 Hyperglycaemia: In two studies (Leuppi 2013; Sayiner 2001) no difference was noted in the likelihood of hyperglycaemia between systemic corticosteroid for seven or fewer days and longer than seven days (n = 345; OR 0.99, 95% CI 0.64 to 1.53; Analysis 1.4), and no heterogeneity was observed. The outcome was downgraded for imprecision and was rated as having moderate quality because the confidence intervals for the pooled effect included important benefit and potential harm.
1.5 Hypertension: In one trial (Leuppi 2013)no difference was noted in the likelihood of hypertension between systemic corticosteroid for seven or fewer days and longer than seven days (n = 311; OR 0.61, 95% CI 0.31 to 1.22; Analysis 1.5).
1.6 Other adverse effects were reported in five studies and included gastrointestinal tract bleeding, symptomatic gastrointestinal reflux, symptoms of congestive heart failure or ischaemic heart disease, sleep disturbance, fractures and depression. No difference was noted in the likelihood of another adverse event between systemic corticosteroids for seven or fewer days and longer than seven days (n = 503; OR 0.89, 95% CI 0.46 to 1.69; Analysis 1.6). The outcome was downgraded for imprecision and was rated as having moderate quality because the confidence intervals for the pooled effect included important benefit and potential harm.
Secondary outcomes
1.7 Mortality
In two studies the likelihood of mortality did not differ between systemic corticosteroid for seven or fewer days and longer than seven days (n = 336; OR 0.91, 95% CI 0.40 to 2.06; Analysis 1.7). The outcome was downgraded for imprecision and was rated as having moderate quality because the confidence intervals for the pooled effect included important benefit and potential harm.
1.8 Length of hospitalisation
In three studies no difference was noted in length of hospital stay between systemic corticosteroid for seven or fewer days and longer than seven days (n = 421; mean difference (MD) ‐0.61 days, 95% CI ‐1.51 to 0.28; Analysis 1.8). The outcome was downgraded for imprecision and was rated as having moderate quality because the confidence intervals for the pooled effect included important benefit and potential harm.
1.9 to 1.14 Lung function
In three studies no difference was noted in absolute FEV1 measured within seven days between systemic corticosteroid for seven or fewer days and longer than seven days (n = 96; MD ‐0.07 litres, 95% CI ‐0.19 to 0.05; Analysis 1.9), and no heterogeneity was observed. Leuppi 2013 reported lung function as FEV1 percentage predicted and noted no difference between systemic corticosteroid for seven or fewer days and longer than seven days (n = 289; MD 0.76%, 95% CI ‐3.15 to 4.66; Analysis 1.10). In three studies no difference was noted in early response of FVC between systemic corticosteroid for seven or fewer days and longer than seven days (n = 97; MD 0.01 L, 95% CI ‐0.20 to 0.22; Analysis 1.11), and no statistical heterogeneity was observed.
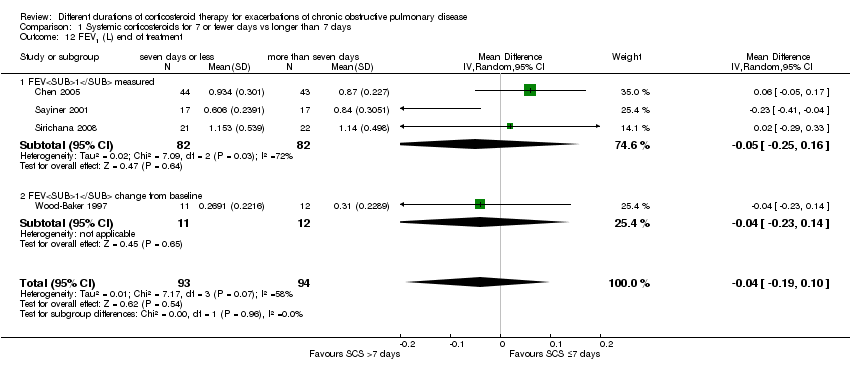
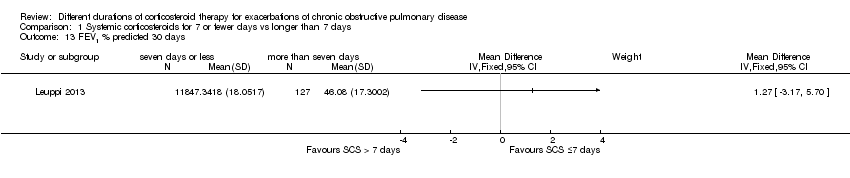
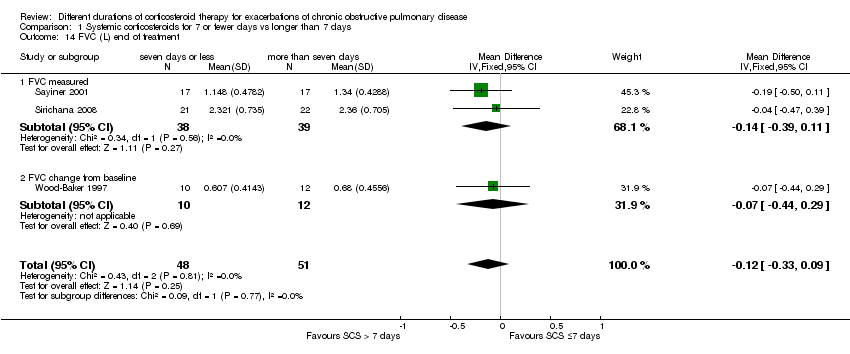
For lung function measured at the end of treatment in four studies, no difference was noted in FEV1 between systemic corticosteroid for seven or fewer days and longer than seven days (n = 187; MD ‐0.04 litres, 95% CI ‐0.19 to 0.10; Analysis 1.12); important heterogeneity was observed (Chi² = 7.17, df = 3 (P value 0.07), I² = 58%). The outcome was rated as having very low quality and was downgraded for imprecision because the confidence intervals for the pooled effect included important benefit and potential harm, and risk of attrition bias and inconsistency were due to unexplained heterogeneity. In Leuppi 2013, no difference was noted in FEV1 percentage predicted at 30 days between systemic corticosteroid for seven or fewer days and more than seven days (n = 289; MD 1.29%, 95% CI ‐3.35 to 5.93; Analysis 1.13). In three studies no difference was noted in FVC at the end of treatment between systemic corticosteroid for seven or fewer days and longer than seven days (n = 99; MD ‐0.12, 95% CI ‐0.33 to 0.09; Analysis 1.14), and no heterogeneity was observed.
1.15 to 1.17 Arterial blood gases
Sayiner 2001 reported partial pressure of oxygen in arterial blood (PaO2) before seven days (n = 34). No difference was noted between treatment with systemic corticosteroid for seven or fewer days and longer than seven days (MD ‐0.20 mmHg; 95% CI ‐9.21 to 8.81; Analysis 1.15).
In two studies (n = 121) at completion of treatment, no difference was noted in PaO2 after 10 to 14 days of follow‐up between systemic corticosteroid for seven or fewer days and longer than seven days (MD ‐1.38 mmHg; 95% CI ‐4.96 to 2.21; Analysis 1.16).
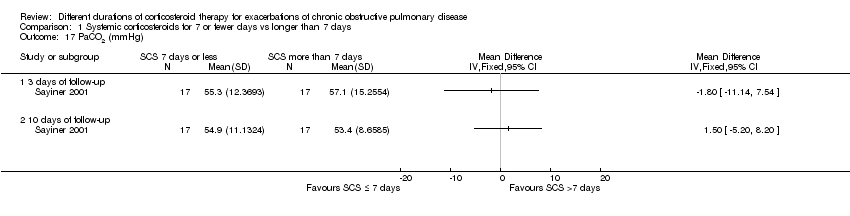
In Sayiner 2001 (n = 34) no difference was noted in partial pressure of carbon dioxide in arterial blood (PaCO2) after three days (MD ‐1.80 mmHg, 95% CI ‐11.14 to 7.54) or after 10 days (MD 1.50 mmHg, 95% CI ‐5.20 to 8.20) between treatment with systemic corticosteroid for seven or fewer days and longer than seven days (Analysis 1.17).
1.18 to 1.19 Symptom scores
In two studies no differences were noted in dyspnoea scores when measured before seven days between systemic corticosteroid for seven or fewer days and longer than seven days (n = 320; standardised mean difference (SMD) ‐0.08, 95% CI ‐0.29 to 0.14; Analysis 1.18), and no statistical heterogeneity was observed. When expressed on the Medical Research Council (MRC) scale (1 to 5), this would equate to 0.1 units better (95% CI 0.4 better to 0.2 worse).
In four studies at the end of treatment, no difference was noted in dyspnoea scores between systemic corticosteroid for seven or fewer days and longer than seven days (n = 404; SMD 0.16, 95% CI ‐0.03 to 0.36; Analysis 1.19),and moderate heterogeneity was observed (Chi² = 5.89, df = 3 (P value 0.12), I² = 49%). When expressed on the MRC scale (1 to 5), this would equate to 0.2 units worse (95% CI 0.04 better to 0.45 worse).
1.20 to 1.21 Quality of life
Health‐related quality of life was assessed in Leuppi 2013 by using the acute bronchitis health‐related quality‐of‐life interview, which measures changes in health‐related quality of life among patients treated for chronic lung disease; it consists of 22 items in four domains: activity‐related limitations (six items); effects of symptoms (eight items); fatigue (four items); and emotional functioning (four items). Each item is rated on a 7‐point scale, and a difference of 0·5 points is taken to be the smallest important difference (Evans 2002). No difference was reported in overall score between systemic corticosteroid for seven or fewer days and longer than seven days when measured before seven days (n = 290; MD 0.03, 95% CI ‐0.15 to 0.21; Analysis 1.20) or after 30 days (n = 263; MD 0.07, 95% CI ‐0.11 to 0.25; Analysis 1.21).
Discussion
Summary of main results
SCS treatment for seven or fewer days compared with SCS treatment for longer than seven days for acute exacerbations of COPD
Please see summary of findings Table for the main comparison.
The likelihood of treatment failure did not differ between treatment with systemic corticosteroids for seven or fewer days and longer than seven days over 10 to 14 days of follow‐up in four studies, although wide confidence intervals around the estimate were reported (457 participants; odds ratio (OR) 0.72, 95% confidence interval (CI) 0.36 to 1.46). This difference equates to 22 fewer people experiencing treatment failure per 1000 (95% CI 51 fewer to 34 more) for short‐duration corticosteroid treatment. Similarly, no difference was noted for re‐exacerbation over 14 to 180 days of follow‐up in four studies (478 participants; OR 1.04, 95% CI 0.7 to 1.56); this equates to nine fewer people with re‐exacerbation per 1000 (95% CI 68 fewer to 100 more) for longer‐duration corticosteroid treatment. Time to the next COPD exacerbation did not differ in one large study, which was powered to detect non‐inferiority and compared five days versus 14 days of systemic corticosteroid treatment (n = 311; hazard ratio 0.95, 95% CI 0.66 to 1.37).
The likelihood of adverse drug effects when systemic corticosteroids given for seven or fewer days were compared with systemic corticosteroids given for longer than seven days did not differ for hyperglycaemia in two studies with data of moderate quality (n = 345; OR 0.99, 95% CI 0.64 to 1.53), nor for a range of other drug effects in five studies with data of low quality (n = 503; OR 0.88, 95% CI 0.46 to 1.69). Mortality during follow‐up of between 14 days and 180 days did not differ in two studies (n = 336; OR 0.91, 95% CI 0.40 to 2.06) with data of moderate quality.
No differences in length of hospitalisation were noted in three studies (n = 421; MD ‐0.61 days, 95% CI ‐1.51 to 0.28) with data of moderate quality, and no differences in lung function at the end of treatment were reported in four studies (n = 187; mean difference (MD) in forced expiratory volume in one second (FEV1) ‐0.04 L, 95% CI ‐0.19 to 0.10) with data of very low quality. No difference in health‐related quality of life was observed in one study with data of moderate quality.
Overall completeness and applicability of evidence
Five of the eight included studies were not published as full articles. Meta‐analyses were limited by the need to omit three studies for which no data could be extracted from abstracts, or for which no data were supplied by study authors (Gomaa 2008; Rahman 2004; Salam 1998). The small number of trials meant that no subgroup analyses were performed.
One study (Wood‐Baker 1997) closed prematurely because of the difficulty of recruiting participants who met the inclusion criterion stating that participants should not have commenced oral steroid treatment before recruitment. This stipulation also caused low recruitment for the ongoing study (Reid 2010). In many countries this is likely to be a barrier to conducting inpatient studies comparing corticosteroid treatment of shorter duration versus conventional duration of up to 14 days, as guidelines and action plans recommend early initiation of therapy.
As this review excluded studies in which participants received assisted ventilation (invasive or non‐invasive), the findings are not generalisable to people on assisted ventilation. Doses of systemic corticosteroid given to patients admitted to an intensive care unit (ICU) who may require assisted ventilation usually are much higher than those given in the studies included in this review (Kiser 2014). An observational study evaluating corticosteroid use in patients admitted to the ICU with an exacerbation of chronic obstructive pulmonary disease (COPD) concluded that fewer deaths and shorter stays in hospital occurred among people treated with systemic corticosteroid at doses equivalent to less than 240 mg per day of methylprednisolone. An observational study involving patients admitted to a non‐intensive care setting with an exacerbation of COPD who received systemic corticosteroids did not assess duration of treatment; this study found that low‐dose corticosteroids (20 to 80 mg/d prednisone equivalent) administered orally were not associated with worse outcomes than were seen with high‐dose intravenous therapy (120 to 800 mg/d prednisone equivalent) during the first two hospital days (Lindenauer 2010).
Quality of the evidence
Studies that contributed to the meta‐analysis were at low risk of selection bias, although one study was at high risk of performance and detection bias from lack of blinding. Some heterogeneity between studies was observed with regard to the inclusion criteria. Many studies did not provide details of their inclusion criteria, including their definition of an acute exacerbation of COPD. Only three studies specified the severity of COPD in participants based on their lung function reading (FEV1) upon admission. Thresholds to define severity included FEV1 less than 50% predicted in Gomaa 2008 and Wood‐Baker 1997, and less than 35% predicted in Sayiner 2001. Variation in the systemic corticosteroid used in the included studies was reported: Five used oral prednisolone, one at high then tapering dose (Wood‐Baker 1997), and two used intravenous corticosteroid. However, oral and intravenous corticosteroids have been shown to have equal efficacy and should not, therefore, contribute to any heterogeneity (Therapeutic Guidelines 2009). Sensitivity analyses according to risks of bias due to lack of blinding or route of corticosteroid administration had no significant effects on pooled results (Table 2). Duration of follow‐up varied between studies and was not stated in four studies. Follow‐up periods may have been too short to allow detection of potential differences in relapse, mortality and readmission. Lack of data for pooling limited the analysis of some outcomes that are important to patients, such as quality of life.
| Excluding Sirichana (not blinded) | All studies | |
| Relapse | 1.01 (0.66 to 1.55) | 1.04 (0.70 to 1.56) |
| FEV1 early | ‐0.09 (‐0.22 to 0.05) | ‐0.07 (‐0.19 to 0.05) |
| FEV1 end | ‐0.06 (‐0.23 to 0.11) | ‐0.04 (‐0.19 to 0.10) |
| FVC early | ‐0.00 (‐0.25 to 0.25) | 0.01 (‐0.20 to 0.22) |
| FVC end | ‐0.14 (‐0.38 to 0.09) | ‐0.12 (‐0.33 to 0.09) |
| Adverse event—other | 0.94 (0.48 to 1.82) | 0.89 (0.46 to 1.69) |
| Excluding Sayiner (IV SCS) | All studies | |
| Treatment failure | 0.66 (0.32 to 1.37) | 0.72 (0.36 to 1.46) |
| Relapse | 1.02 (0.67 to 1.56) | 1.04 (0.70 to 1.56) |
| Adverse event—hyperglycaemia | 0.99 (0.63 to 1.54) | 0.99 (0.64 to 1.53) |
| Adverse event—other | 0.89 (0.46 to 1.69) | 0.89 (0.46 to 1.69) |
| FEV1 early | ‐0.02 (‐0.19 to 0.16) | ‐0.07 (‐0.19 to 0.05) |
| FEV1 end | 0.03 (‐0.06 to 0.12) | ‐0.04 (‐0.19 to 0.10) |
| FVC early | 0.12 (‐0.18 to 0.42) | 0.01 (‐0.20 to 0.22) |
| FVC end | ‐0.06 (‐0.34 to 0.22) | ‐0.12 (‐0.33 to 0.09) |
Potential biases in the review process
The review authors made every effort to identify all relevant published and unpublished studies by using additional methods to identify studies that might not have been found during the main electronic search (e.g. searching drug company databases and clinical trial registration sites, checking reference lists). We did not routinely contact individual trial authors for additional data unless outcomes were clearly selectively reported. All review authors adhered to the most recent best practice guidelines in terms of study selection, resolution of disagreements, data extraction and analysis to reduce bias and error. We included all data obtained from the included studies, even those from studies at higher risk of bias with regard to participant withdrawals, such as Sirichana 2008, but we performed sensitivity analysis to check whether omitting the study changed the results. We obtained data for one study (Wood‐Baker 1997) from an author from this review team; however, data extraction and analysis were performed in the same way as for the other studies.
1 Study flow diagram.

Risk of bias summary: review authors' judgements about each item for each included study.
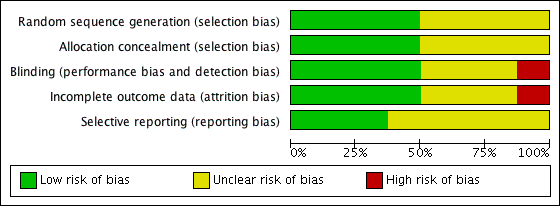
Risk of bias graph: review authors' judgements about each risk of bias item presented as percentages across all included studies.
Forest plot outcome: treatment failure comparing systemic corticosteroids for ≤ 7 days vs > 7 days.
Forest plot of comparison: 1 Systemic corticosteroids for 7 or fewer days vs longer than seven days, outcome: 1.2 Relapse.

Comparison 1 Systemic corticosteroids for 7 or fewer days vs longer than 7 days, Outcome 1 Treatment failure.

Comparison 1 Systemic corticosteroids for 7 or fewer days vs longer than 7 days, Outcome 2 Relapse.

Comparison 1 Systemic corticosteroids for 7 or fewer days vs longer than 7 days, Outcome 3 Time to re‐exacerbation.

Comparison 1 Systemic corticosteroids for 7 or fewer days vs longer than 7 days, Outcome 4 Adverse effect—hyperglycaemia.

Comparison 1 Systemic corticosteroids for 7 or fewer days vs longer than 7 days, Outcome 5 Adverse effect—hypertension.

Comparison 1 Systemic corticosteroids for 7 or fewer days vs longer than 7 days, Outcome 6 Other adverse effects—gastrointestinal tract bleeding, symptomatic gastrointestinal reflux, symptoms of congestive heart failure or ischaemic heart disease, sleep disturbance, fractures, depression.

Comparison 1 Systemic corticosteroids for 7 or fewer days vs longer than 7 days, Outcome 7 Mortality.

Comparison 1 Systemic corticosteroids for 7 or fewer days vs longer than 7 days, Outcome 8 Length of hospitalisation.

Comparison 1 Systemic corticosteroids for 7 or fewer days vs longer than 7 days, Outcome 9 FEV1 (L) (early).

Comparison 1 Systemic corticosteroids for 7 or fewer days vs longer than 7 days, Outcome 10 FEV1 % predicted (6 days).

Comparison 1 Systemic corticosteroids for 7 or fewer days vs longer than 7 days, Outcome 11 FVC (L) (early).
Comparison 1 Systemic corticosteroids for 7 or fewer days vs longer than 7 days, Outcome 12 FEV1 (L) end of treatment.
Comparison 1 Systemic corticosteroids for 7 or fewer days vs longer than 7 days, Outcome 13 FEV1 % predicted 30 days.
Comparison 1 Systemic corticosteroids for 7 or fewer days vs longer than 7 days, Outcome 14 FVC (L) end of treatment.

Comparison 1 Systemic corticosteroids for 7 or fewer days vs longer than 7 days, Outcome 15 PaO2 (mmHg) (early).

Comparison 1 Systemic corticosteroids for 7 or fewer days vs longer than 7 days, Outcome 16 PaO2 (mmHg) end of treatment.
Comparison 1 Systemic corticosteroids for 7 or fewer days vs longer than 7 days, Outcome 17 PaCO2 (mmHg).

Comparison 1 Systemic corticosteroids for 7 or fewer days vs longer than 7 days, Outcome 18 Symptoms—dyspnoea (early).

Comparison 1 Systemic corticosteroids for 7 or fewer days vs longer than 7 days, Outcome 19 Symptoms—dyspnoea (15 days).

Comparison 1 Systemic corticosteroids for 7 or fewer days vs longer than 7 days, Outcome 20 Quality of life—overall (6 days).
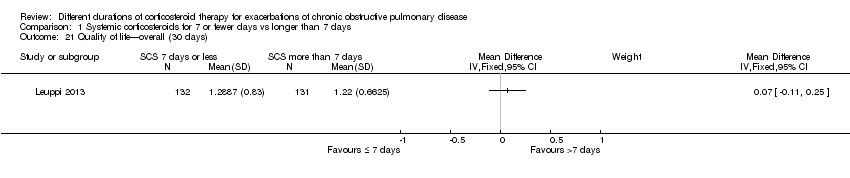
Comparison 1 Systemic corticosteroids for 7 or fewer days vs longer than 7 days, Outcome 21 Quality of life—overall (30 days).
| SCS treatment for 7 or fewer days compared with SCS treatment for longer than 7 days for acute exacerbations of COPD | ||||||
| Patient or population: patients with acute exacerbations of COPD | ||||||
| Outcomes | Illustrative comparative risks* (95% CI) | Relative effect | Number of participants | Quality of the evidence | Comments | |
| Assumed risk | Corresponding risk | |||||
| SCS treatment for longer than 7 days | SCS treatment for 7 or fewer days | |||||
| Treatment failure | 83 per 1000 | 61 per 1000 | OR 0.72 | 457 | ⊕⊕⊕⊝ | Equivalent to 22 fewer (95% CI 51 fewer to 34 more) |
| Relapse | 295 per 1000 | 304 per 1000 | OR 1.04 | 478 | ⊕⊕⊕⊝ | In one study (Leuppi 2013), hazard ratio for time to re‐exacerbation was 0.95 (95% CI 0.66 to 1.37) |
| Adverse drug effect—hyperglycaemia | 442 per 1000 | 439 per 1000 | OR 0.99 | 345 | ⊕⊕⊕⊝ | |
| Adverse drug effects | 84 per 1000 | 75 per 1000 | OR 0.88 | 503 | ⊕⊕⊝⊝ | |
| Mortality | 77 per 1000 | 71 per 1000 | OR 0.91 | 336 | ⊕⊕⊕⊝ | |
| Length of hospitalisation | Mean length of hospitalisation in control groups was | Mean length of hospitalisation in intervention groups was | 421 | ⊕⊕⊕⊝ | ||
| Lung function (end of treatment) | Mean FEV1 in control groups ranged from 0.84 to 1.14 L | Mean lung function (end of treatment) in intervention groups was | 187 | ⊕⊝⊝⊝ | ||
| Health‐related quality of life (QOL) Overall score (includes activity limitations, symptoms, fatigue, emotional functioning); scale 0 best to 6 worst; minimum important difference 0.5 Follow‐up: 30 days | Mean QOL score in control groups was 1.24 | Mean QOL score in intervention groups was 0.06 higher (‐0.16 lower to 0.28 higher) | 271 (1 study) | ⊕⊕⊕⊝ | ||
| *The basis for the assumed risk (e.g. median control group risk across studies) is provided in footnotes. The corresponding risk (and its 95% confidence interval) is based on the assumed risk in the comparison group and the relative effect of the intervention (and its 95% CI). | ||||||
| GRADE Working Group grades of evidence. | ||||||
| aWide confidence intervals include significant benefit or harm (‐1 for imprecision). | ||||||
| Study ID/Setting | Inclusion criteria | AE definition | N participants included/Completing | Mean age, years | % males/ % smokers | Prestudy SCS use, % | SCS ≤ 7 days | SCS > 7 days | Definition of treatment failure |
| Chen 2005 China/ inpatients | 2 years of continuous productive cough, FEV1/FVC post BD < 0.7, FEV1 < 80% predicted. No respiratory failure, diabetes or bronchial asthma | At least 2 of 3 symptoms: increased sputum or dyspnoea or purulent sputum | 86/81 | 71 | 75/44 | Not stated | Prednisolone 30 mg 7 days | Prednisolone 30 mg/d 10 days + 15 mg/d 5 days | Not known |
| Gomaa 2008 (abstract only) | FEV1 < 50% predicted, no respiratory acidosis | Not stated | 42/Not known | Not stated | Not stated | Not stated | Prednisolone 30 mg 7 days | Prednisolone 30 mg 15 days | Outcome not reported |
| Leuppi 2013 Switzerland/5 sites | Age > 40 years, smoking history ≥ 20 pack‐years | At least 2 of the following: change in baseline dyspnoea, cough or sputum quantity/purulence | 314/296 | 69 | 60/45 | 20 | 5 days: days 1 to 4 methylprednisolone 40 mg, days 2 to 5 oral prednisolone 40 mg | 14 days: days 1 to 4 methylprednisolone 40 mg, days 2 to 14 oral 40 mg prednisolone | Received open‐label glucocorticoids during index exacerbation |
| Rahman 2004 (abstract only) Bangladesh/1 site | Not stated | Not stated | Not stated | Not stated | Not stated | Not stated | Prednisolone 30 mg 7 days | Prednisolone 30 mg 14 days | Outcome not reported |
| Salam 1998 (abstract only) USA/Unknown sites | Not stated | Not stated | 21/Not known | Not stated | Not stated | None in previous month | IV CS 3 days | IV CS 3 days + 7 days OCS | Outcome not reported |
| Sayiner 2001 Turkey/1 site | FEV1 < 35% predicted, PYH > 20, no respiratory failure requiring ventilation | Not stated, requiring admission | 36/34 | 65 | 94/Not stated | None in previous month | IV methylprednisone 0.5 mg/kg qds 3 days | IV methylprednisone 0.5 mg/kg qds 3 days, bd 3 days, od 4 days | Required open‐label steroid treatment |
| Sirichana 2008 (abstract and author data) Thailand/1 site | Age > 40 years, symptoms > 24 hours | Increase in at least 2 of 3 symptoms—dyspnoea, sputum volume, sputum purulence; requiring admission | 48/42 | 73 | 88/Not stated | None in previous month | Prednisolone 30 mg 5 days | Prednisolone 30 mg 10 days | Outcome not reported |
| Wood‐Baker 1997 (abstract and author data) Australia & New Zealand/2 sites | Age > 40 years; > 10 pack‐year smoking history; FEV1 < 50% predicted | Not stated, requiring admission | 38/28 | 71 | 63/Not stated | None for current AEs, no long‐term OS > 5 mg/d | Prednisolone 2.5 mg/kg orally daily for 3 days | Prednisolone 0.6 mg/kg orally daily for 7 days followed by prednisolone 0.3 mg/kg orally daily for 7 days | Lack of progress according to attending physician during treatment |
| Excluding Sirichana (not blinded) | All studies | |
| Relapse | 1.01 (0.66 to 1.55) | 1.04 (0.70 to 1.56) |
| FEV1 early | ‐0.09 (‐0.22 to 0.05) | ‐0.07 (‐0.19 to 0.05) |
| FEV1 end | ‐0.06 (‐0.23 to 0.11) | ‐0.04 (‐0.19 to 0.10) |
| FVC early | ‐0.00 (‐0.25 to 0.25) | 0.01 (‐0.20 to 0.22) |
| FVC end | ‐0.14 (‐0.38 to 0.09) | ‐0.12 (‐0.33 to 0.09) |
| Adverse event—other | 0.94 (0.48 to 1.82) | 0.89 (0.46 to 1.69) |
| Excluding Sayiner (IV SCS) | All studies | |
| Treatment failure | 0.66 (0.32 to 1.37) | 0.72 (0.36 to 1.46) |
| Relapse | 1.02 (0.67 to 1.56) | 1.04 (0.70 to 1.56) |
| Adverse event—hyperglycaemia | 0.99 (0.63 to 1.54) | 0.99 (0.64 to 1.53) |
| Adverse event—other | 0.89 (0.46 to 1.69) | 0.89 (0.46 to 1.69) |
| FEV1 early | ‐0.02 (‐0.19 to 0.16) | ‐0.07 (‐0.19 to 0.05) |
| FEV1 end | 0.03 (‐0.06 to 0.12) | ‐0.04 (‐0.19 to 0.10) |
| FVC early | 0.12 (‐0.18 to 0.42) | 0.01 (‐0.20 to 0.22) |
| FVC end | ‐0.06 (‐0.34 to 0.22) | ‐0.12 (‐0.33 to 0.09) |
| Outcome or subgroup title | No. of studies | No. of participants | Statistical method | Effect size |
| 1 Treatment failure Show forest plot | 4 | 457 | Odds Ratio (M‐H, Fixed, 95% CI) | 0.72 [0.36, 1.46] |
| 2 Relapse Show forest plot | 4 | 478 | Odds Ratio (M‐H, Fixed, 95% CI) | 1.04 [0.70, 1.56] |
| 3 Time to re‐exacerbation Show forest plot | 1 | Hazard Ratio (Fixed, 95% CI) | Subtotals only | |
| 4 Adverse effect—hyperglycaemia Show forest plot | 2 | 345 | Odds Ratio (M‐H, Fixed, 95% CI) | 0.99 [0.64, 1.53] |
| 5 Adverse effect—hypertension Show forest plot | 1 | Odds Ratio (M‐H, Fixed, 95% CI) | Subtotals only | |
| 6 Other adverse effects—gastrointestinal tract bleeding, symptomatic gastrointestinal reflux, symptoms of congestive heart failure or ischaemic heart disease, sleep disturbance, fractures, depression Show forest plot | 5 | 503 | Odds Ratio (M‐H, Fixed, 95% CI) | 0.89 [0.46, 1.69] |
| 7 Mortality Show forest plot | 2 | 336 | Odds Ratio (M‐H, Fixed, 95% CI) | 0.91 [0.40, 2.06] |
| 8 Length of hospitalisation Show forest plot | 3 | 421 | Mean Difference (IV, Fixed, 95% CI) | ‐0.61 [‐1.51, 0.28] |
| 9 FEV1 (L) (early) Show forest plot | 3 | 96 | Mean Difference (IV, Fixed, 95% CI) | ‐0.07 [‐0.19, 0.05] |
| 9.1 FEV1 absolute | 2 | 75 | Mean Difference (IV, Fixed, 95% CI) | ‐0.08 [‐0.22, 0.06] |
| 9.2 FEV1 change | 1 | 21 | Mean Difference (IV, Fixed, 95% CI) | ‐0.04 [‐0.27, 0.19] |
| 10 FEV1 % predicted (6 days) Show forest plot | 1 | Mean Difference (IV, Fixed, 95% CI) | Subtotals only | |
| 11 FVC (L) (early) Show forest plot | 3 | 97 | Mean Difference (IV, Fixed, 95% CI) | 0.01 [‐0.20, 0.22] |
| 11.1 FVC measured | 2 | 75 | Mean Difference (IV, Fixed, 95% CI) | ‐0.05 [‐0.29, 0.19] |
| 11.2 FVC change from baseline | 1 | 22 | Mean Difference (IV, Fixed, 95% CI) | 0.23 [‐0.23, 0.69] |
| 12 FEV1 (L) end of treatment Show forest plot | 4 | 187 | Mean Difference (IV, Random, 95% CI) | ‐0.04 [‐0.19, 0.10] |
| 12.1 FEV1 measured | 3 | 164 | Mean Difference (IV, Random, 95% CI) | ‐0.05 [‐0.25, 0.16] |
| 12.2 FEV1 change from baseline | 1 | 23 | Mean Difference (IV, Random, 95% CI) | ‐0.04 [‐0.23, 0.14] |
| 13 FEV1 % predicted 30 days Show forest plot | 1 | Mean Difference (IV, Fixed, 95% CI) | Subtotals only | |
| 14 FVC (L) end of treatment Show forest plot | 3 | 99 | Mean Difference (IV, Fixed, 95% CI) | ‐0.12 [‐0.33, 0.09] |
| 14.1 FVC measured | 2 | 77 | Mean Difference (IV, Fixed, 95% CI) | ‐0.14 [‐0.39, 0.11] |
| 14.2 FVC change from baseline | 1 | 22 | Mean Difference (IV, Fixed, 95% CI) | ‐0.07 [‐0.44, 0.29] |
| 15 PaO2 (mmHg) (early) Show forest plot | 1 | Mean Difference (IV, Fixed, 95% CI) | Totals not selected | |
| 16 PaO2 (mmHg) end of treatment Show forest plot | 2 | 121 | Mean Difference (IV, Fixed, 95% CI) | ‐1.38 [‐4.96, 2.21] |
| 17 PaCO2 (mmHg) Show forest plot | 1 | Mean Difference (IV, Fixed, 95% CI) | Totals not selected | |
| 17.1 3 days of follow‐up | 1 | Mean Difference (IV, Fixed, 95% CI) | 0.0 [0.0, 0.0] | |
| 17.2 10 days of follow‐up | 1 | Mean Difference (IV, Fixed, 95% CI) | 0.0 [0.0, 0.0] | |
| 18 Symptoms—dyspnoea (early) Show forest plot | 2 | 320 | Std. Mean Difference (IV, Fixed, 95% CI) | ‐0.08 [‐0.29, 0.14] |
| 19 Symptoms—dyspnoea (15 days) Show forest plot | 4 | 404 | Std. Mean Difference (IV, Fixed, 95% CI) | 0.16 [‐0.03, 0.36] |
| 19.1 Change | 3 | 133 | Std. Mean Difference (IV, Fixed, 95% CI) | 0.25 [‐0.09, 0.60] |
| 19.2 Absolute | 1 | 271 | Std. Mean Difference (IV, Fixed, 95% CI) | 0.12 [‐0.12, 0.36] |
| 20 Quality of life—overall (6 days) Show forest plot | 1 | Mean Difference (IV, Fixed, 95% CI) | Subtotals only | |
| 21 Quality of life—overall (30 days) Show forest plot | 1 | Mean Difference (IV, Fixed, 95% CI) | Subtotals only | |