| 1 Treatment failure Show forest plot | 4 | 457 | Odds Ratio (M‐H, Fixed, 95% CI) | 0.72 [0.36, 1.46] |
|
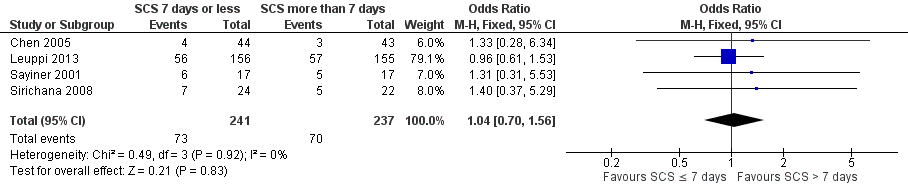
| 2 Relapse Show forest plot | 4 | 478 | Odds Ratio (M‐H, Fixed, 95% CI) | 1.04 [0.70, 1.56] |
|
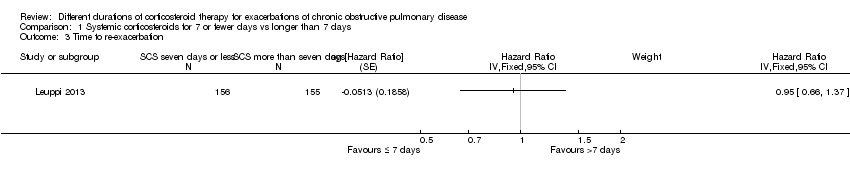
| 3 Time to re‐exacerbation Show forest plot | 1 | | Hazard Ratio (Fixed, 95% CI) | Subtotals only |
|
| 4 Adverse effect—hyperglycaemia Show forest plot | 2 | 345 | Odds Ratio (M‐H, Fixed, 95% CI) | 0.99 [0.64, 1.53] |
|
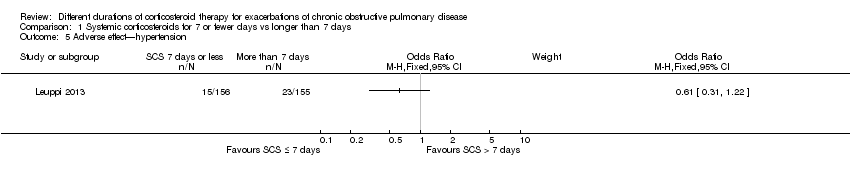
| 5 Adverse effect—hypertension Show forest plot | 1 | | Odds Ratio (M‐H, Fixed, 95% CI) | Subtotals only |
|
| 6 Other adverse effects—gastrointestinal tract bleeding, symptomatic gastrointestinal reflux, symptoms of congestive heart failure or ischaemic heart disease, sleep disturbance, fractures, depression Show forest plot | 5 | 503 | Odds Ratio (M‐H, Fixed, 95% CI) | 0.89 [0.46, 1.69] |
|
| 7 Mortality Show forest plot | 2 | 336 | Odds Ratio (M‐H, Fixed, 95% CI) | 0.91 [0.40, 2.06] |
|
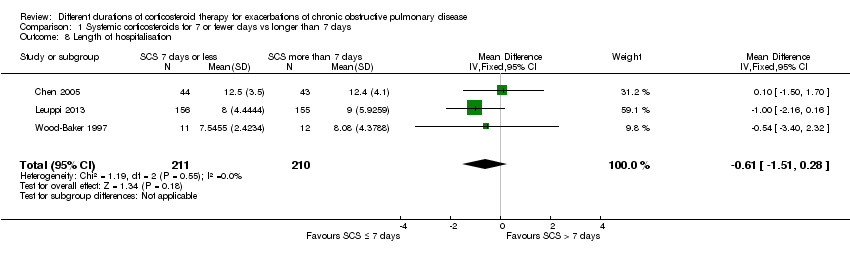
| 8 Length of hospitalisation Show forest plot | 3 | 421 | Mean Difference (IV, Fixed, 95% CI) | ‐0.61 [‐1.51, 0.28] |
|
| 9 FEV1 (L) (early) Show forest plot | 3 | 96 | Mean Difference (IV, Fixed, 95% CI) | ‐0.07 [‐0.19, 0.05] |
|
| 9.1 FEV1 absolute | 2 | 75 | Mean Difference (IV, Fixed, 95% CI) | ‐0.08 [‐0.22, 0.06] |
| 9.2 FEV1 change | 1 | 21 | Mean Difference (IV, Fixed, 95% CI) | ‐0.04 [‐0.27, 0.19] |
| 10 FEV1 % predicted (6 days) Show forest plot | 1 | | Mean Difference (IV, Fixed, 95% CI) | Subtotals only |
|
| 11 FVC (L) (early) Show forest plot | 3 | 97 | Mean Difference (IV, Fixed, 95% CI) | 0.01 [‐0.20, 0.22] |
|
| 11.1 FVC measured | 2 | 75 | Mean Difference (IV, Fixed, 95% CI) | ‐0.05 [‐0.29, 0.19] |
| 11.2 FVC change from baseline | 1 | 22 | Mean Difference (IV, Fixed, 95% CI) | 0.23 [‐0.23, 0.69] |
| 12 FEV1 (L) end of treatment Show forest plot | 4 | 187 | Mean Difference (IV, Random, 95% CI) | ‐0.04 [‐0.19, 0.10] |
|
| 12.1 FEV1 measured | 3 | 164 | Mean Difference (IV, Random, 95% CI) | ‐0.05 [‐0.25, 0.16] |
| 12.2 FEV1 change from baseline | 1 | 23 | Mean Difference (IV, Random, 95% CI) | ‐0.04 [‐0.23, 0.14] |
| 13 FEV1 % predicted 30 days Show forest plot | 1 | | Mean Difference (IV, Fixed, 95% CI) | Subtotals only |
|
| 14 FVC (L) end of treatment Show forest plot | 3 | 99 | Mean Difference (IV, Fixed, 95% CI) | ‐0.12 [‐0.33, 0.09] |
|
| 14.1 FVC measured | 2 | 77 | Mean Difference (IV, Fixed, 95% CI) | ‐0.14 [‐0.39, 0.11] |
| 14.2 FVC change from baseline | 1 | 22 | Mean Difference (IV, Fixed, 95% CI) | ‐0.07 [‐0.44, 0.29] |
| 15 PaO2 (mmHg) (early) Show forest plot | 1 | | Mean Difference (IV, Fixed, 95% CI) | Totals not selected |
|
| 16 PaO2 (mmHg) end of treatment Show forest plot | 2 | 121 | Mean Difference (IV, Fixed, 95% CI) | ‐1.38 [‐4.96, 2.21] |
|
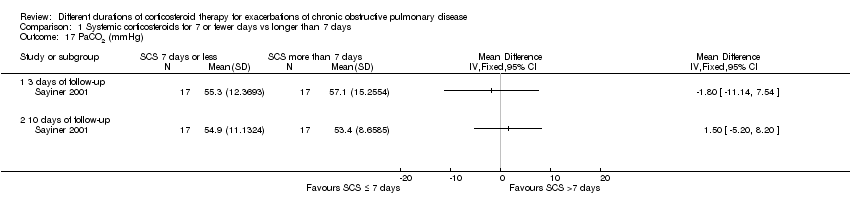
| 17 PaCO2 (mmHg) Show forest plot | 1 | | Mean Difference (IV, Fixed, 95% CI) | Totals not selected |
|
| 17.1 3 days of follow‐up | 1 | | Mean Difference (IV, Fixed, 95% CI) | 0.0 [0.0, 0.0] |
| 17.2 10 days of follow‐up | 1 | | Mean Difference (IV, Fixed, 95% CI) | 0.0 [0.0, 0.0] |
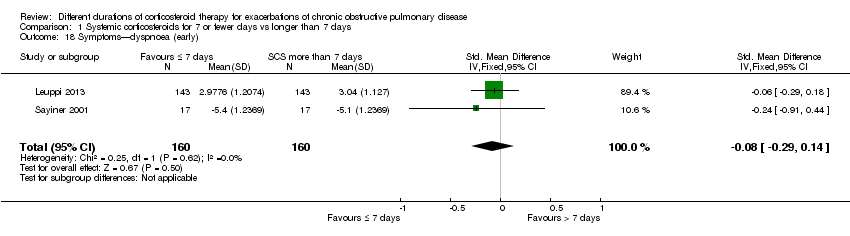
| 18 Symptoms—dyspnoea (early) Show forest plot | 2 | 320 | Std. Mean Difference (IV, Fixed, 95% CI) | ‐0.08 [‐0.29, 0.14] |
|
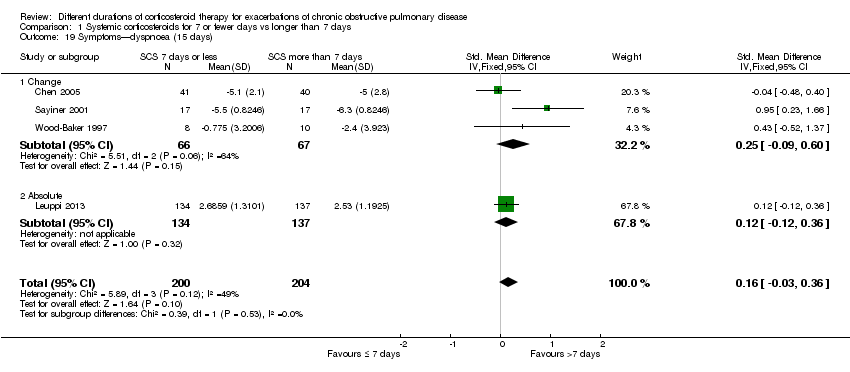
| 19 Symptoms—dyspnoea (15 days) Show forest plot | 4 | 404 | Std. Mean Difference (IV, Fixed, 95% CI) | 0.16 [‐0.03, 0.36] |
|
| 19.1 Change | 3 | 133 | Std. Mean Difference (IV, Fixed, 95% CI) | 0.25 [‐0.09, 0.60] |
| 19.2 Absolute | 1 | 271 | Std. Mean Difference (IV, Fixed, 95% CI) | 0.12 [‐0.12, 0.36] |
| 20 Quality of life—overall (6 days) Show forest plot | 1 | | Mean Difference (IV, Fixed, 95% CI) | Subtotals only |
|
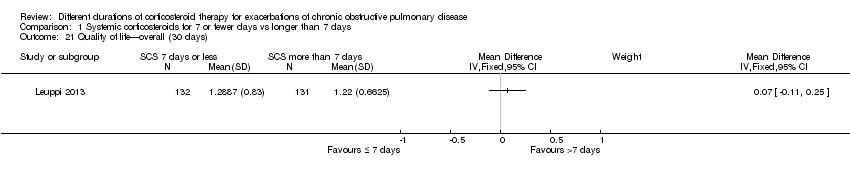
| 21 Quality of life—overall (30 days) Show forest plot | 1 | | Mean Difference (IV, Fixed, 95% CI) | Subtotals only |
|