Entrenamiento asistido por aparatos electromecánicos para caminar después de un accidente cerebrovascular
Información
- DOI:
- https://doi.org/10.1002/14651858.CD006185.pub4Copiar DOI

- Base de datos:
-
- Cochrane Database of Systematic Reviews
- Versión publicada:
-
- 10 mayo 2017see what's new
- Tipo:
-
- Intervention
- Etapa:
-
- Review
- Grupo Editorial Cochrane:
-
Grupo Cochrane de Accidentes cerebrovasculares
- Copyright:
-
- Copyright © 2017 The Cochrane Collaboration. Published by John Wiley & Sons, Ltd.
Cifras del artículo
Altmetric:
Citado por:
Autores
Contributions of authors
Jan Mehrholz (JM) contributed to the conception and the design of the protocol and drafted the protocol. He searched electronic databases and conference proceedings, screened titles and abstracts of references identified by the search, selected and assessed trials, extracted trial and outcome data, guided the analysis and interpretation of data, and contributed to and approved the final manuscript of the review.
Simone Thomas (ST) evaluated and extracted trial data, assessed the methodological quality of selected trials, contributed to the interpretation of data, and contributed to and approved the final manuscript of the review.
Cordula Werner (CW) screened the titles and abstracts of references identified by the search; located, selected, and assessed trials; extracted trial and outcome data; assessed the methodological quality of selected trials; contributed to the interpretation of data; and contributed to and approved the final manuscript of the review.
Joachim Kugler (JK) evaluated and extracted trial and outcome data, assessed the methodological quality of selected trials, contributed to the interpretation of data, and contributed to and approved the final manuscript of the review.
Marcus Pohl (MP) contributed to the conception and design of the review, drafted the protocol, and assessed the methodological quality of selected trials. Together with JM, he contacted trialists about unpublished data and entered the data, carried out statistical analysis, helped with the interpretation of the data, drafted the review, and approved the final manuscript of the review.
Bernhard Elsner (BE) searched electronic databases and conference proceedings, screened titles and abstracts of references identified by the search, selected and assessed trials, guided analysis and the interpretation of the data, and contributed to and approved the final manuscript of the review.
Sources of support
Internal sources
-
Klinik Bavaria Kreischa, Wissenschaftliches Institut, Germany.
-
Technical University Dresden, Lehrstuhl Public Health, Germany.
-
SRH Fachhochschule Gera, Lehrstuhl Therapiewissenschaften, Germany.
External sources
-
No sources of support supplied
Declarations of interest
Bernhard Elsner: none known.
Simone Thomas: none known.
Joachim Kugler: none known.
Marcus Pohl was author of one included trial (Pohl 2007).
Jan Mehrholz was co‐author of one included trial (Pohl 2007).
Cordula Werner was an author of two included trials (Pohl 2007; Werner 2002), and of one excluded trial (Hesse 2001).
These review authors (MP, JM, CW) did not participate in quality assessment and data extraction of these studies.
Acknowledgements
We thank Brenda Thomas for help with developing the search strategy and for providing us with relevant trials and systematic reviews from CINAHL, AMED, SPORTDiscus, and Inspec; Hazel Fraser for providing us with relevant information about trials and systematic reviews from the Cochrane Stroke Group Trials Register; and Gabi Voigt for conducting research and for providing us with many helpful studies. We thank Stanley Fisher, Carmen Krewer, Jorge Lians, Andreas Mayer, Stefan Hesse, Joseph Hidler, George Hornby, Yun‐Hee Kim, Zeev Meiner, Sinnika Peurala, Leopold Saltuari, Isabella Schwartz, Raymond Tong, John Brincks, Michael van Nunen, and Naoki Tanaka for providing additional information or unpublished data for their trials.
Version history
| Published | Title | Stage | Authors | Version |
| 2020 Oct 22 | Electromechanical‐assisted training for walking after stroke | Review | Jan Mehrholz, Simone Thomas, Joachim Kugler, Marcus Pohl, Bernhard Elsner | |
| 2017 May 10 | Electromechanical‐assisted training for walking after stroke | Review | Jan Mehrholz, Simone Thomas, Cordula Werner, Joachim Kugler, Marcus Pohl, Bernhard Elsner | |
| 2013 Jul 25 | Electromechanical‐assisted training for walking after stroke | Review | Jan Mehrholz, Bernhard Elsner, Cordula Werner, Joachim Kugler, Marcus Pohl | |
| 2007 Oct 17 | Electromechanical‐assisted training for walking after stroke | Review | Jan Mehrholz, Cordula Werner, Joachim Kugler, Marcus Pohl | |
| 2006 Oct 18 | Electromechanical‐assisted training for walking after stroke | Protocol | Jan Mehrholz, Cordula Werner, Joachim Kugler, Marcus Pohl | |
Differences between protocol and review
In our protocol we stated that we would use the PEDro Scale to assess the methodological quality of the included trials. However, Chapter 8 of the latest edition of the Cochrane Handbook for Systematic Reviews of Interventions suggests that scales that yield a summary score should be avoided (Higgins 2011a). In accordance with this suggestion, we no longer used the PEDro Scale to assess the methodological quality of the included trials, instead using the Cochrane 'Risk of bias' tool to analyse trial methodology.
In our protocol we planned to quantify heterogeneity with the I² statistic and to use a cutoff of I² = 50% for all comparisons. Additonally, we planned to calculate the overall effects using a random‐effects model instead of a fixed‐effect model when we found substantial heterogeneity. However, in this update we calculated the overall effects using a random‐effects model, irrespective of the level of heterogeneity.
In this review update we expanded our post‐hoc sensitivity analysis: type of device (Analysis 5.1; Analysis 5.2; Analysis 5.3) by introducing a new subgroup of studies using mobile and ankle devices and adding a new comparison in Analysis 5 (Analysis 5.3 Different devices for regaining walking capacity).
Keywords
MeSH
Medical Subject Headings (MeSH) Keywords
Medical Subject Headings Check Words
Aged; Humans; Middle Aged;
PICO

Study flow diagram.
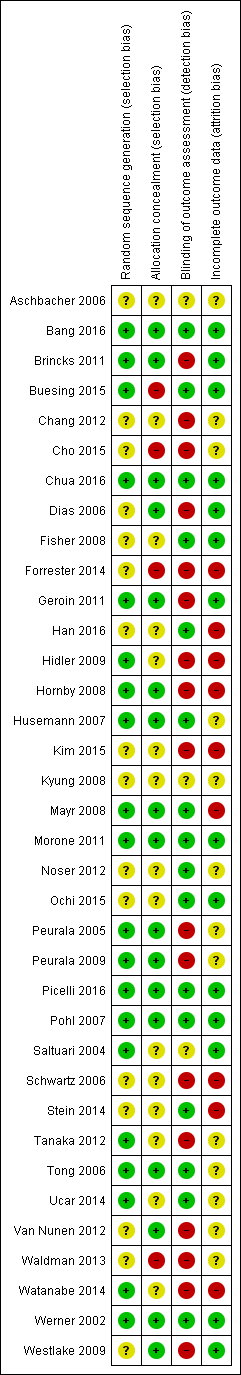
Risk of bias summary: review authors' judgements about each risk of bias item for each included study.
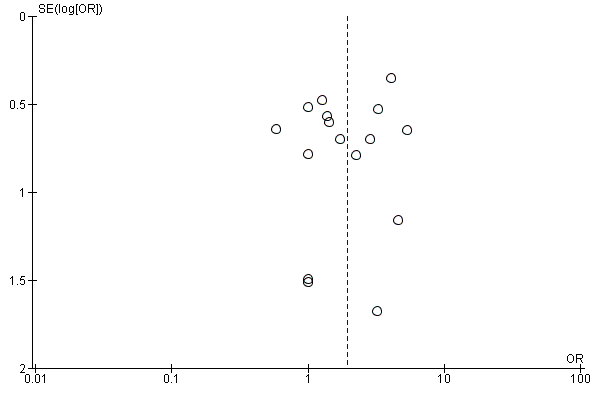
Funnel plot of comparison: 1 Electromechanical‐ and robotic‐assisted gait training plus physiotherapy versus physiotherapy (or usual care), outcome: 1.1 Independent walking at the end of intervention phase, all electromechanical devices used.

Funnel plot of comparison: 1 Electromechanical‐ and robotic‐assisted gait training plus physiotherapy versus physiotherapy (or usual care), outcome: 1.3 Walking velocity (metres per second) at the end of intervention phase.
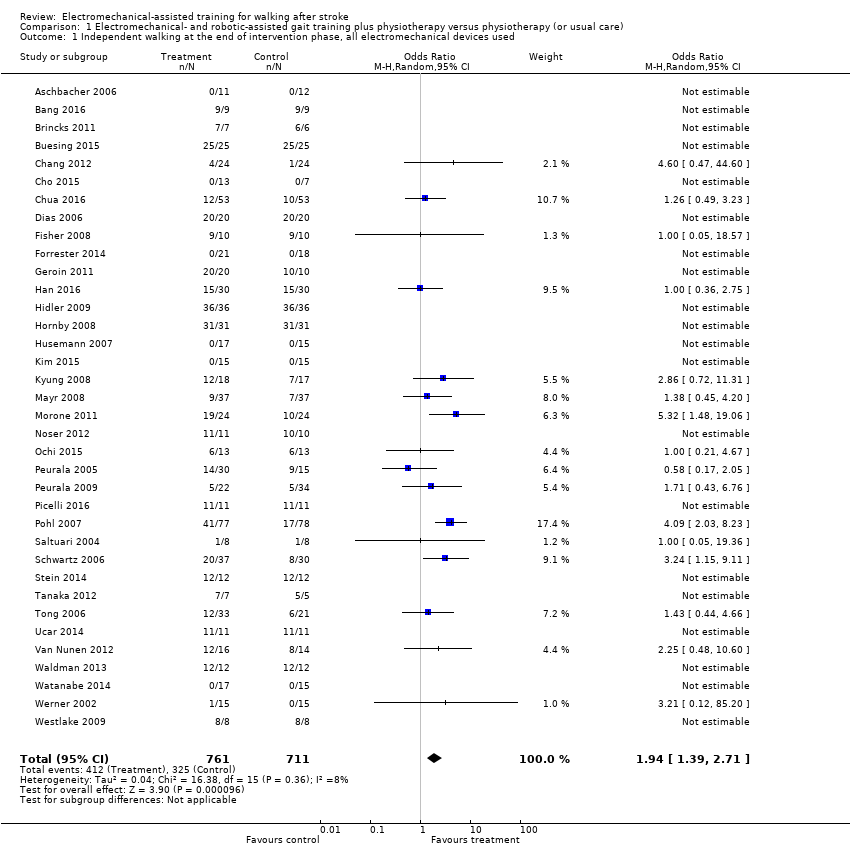
Comparison 1 Electromechanical‐ and robotic‐assisted gait training plus physiotherapy versus physiotherapy (or usual care), Outcome 1 Independent walking at the end of intervention phase, all electromechanical devices used.

Comparison 1 Electromechanical‐ and robotic‐assisted gait training plus physiotherapy versus physiotherapy (or usual care), Outcome 2 Recovery of independent walking at follow‐up after study end.

Comparison 1 Electromechanical‐ and robotic‐assisted gait training plus physiotherapy versus physiotherapy (or usual care), Outcome 3 Walking velocity (metres per second) at the end of intervention phase.
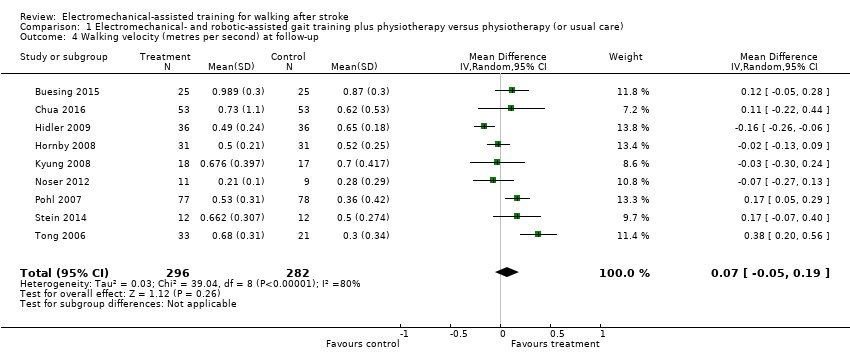
Comparison 1 Electromechanical‐ and robotic‐assisted gait training plus physiotherapy versus physiotherapy (or usual care), Outcome 4 Walking velocity (metres per second) at follow‐up.
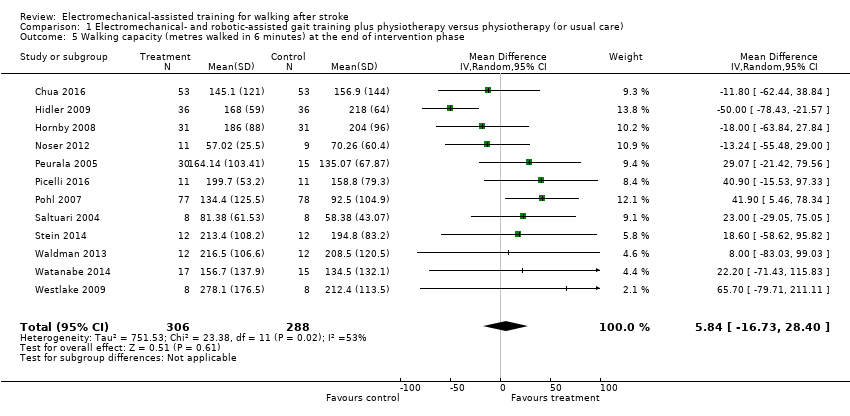
Comparison 1 Electromechanical‐ and robotic‐assisted gait training plus physiotherapy versus physiotherapy (or usual care), Outcome 5 Walking capacity (metres walked in 6 minutes) at the end of intervention phase.
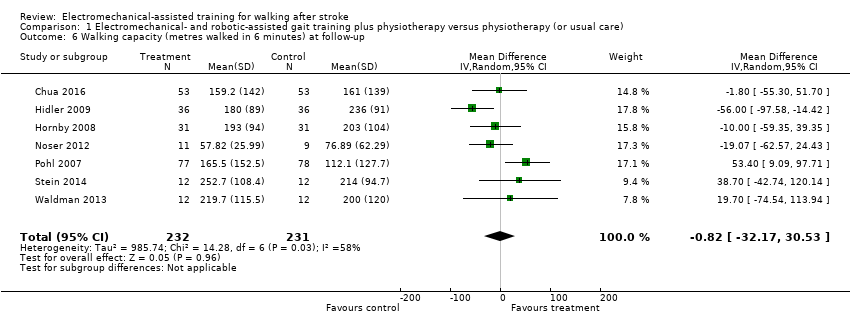
Comparison 1 Electromechanical‐ and robotic‐assisted gait training plus physiotherapy versus physiotherapy (or usual care), Outcome 6 Walking capacity (metres walked in 6 minutes) at follow‐up.

Comparison 1 Electromechanical‐ and robotic‐assisted gait training plus physiotherapy versus physiotherapy (or usual care), Outcome 7 Acceptability of electromechanical‐assisted gait training devices during intervention phase: dropouts.

Comparison 1 Electromechanical‐ and robotic‐assisted gait training plus physiotherapy versus physiotherapy (or usual care), Outcome 8 Death from all causes until the end of intervention phase.

Comparison 2 Planned sensitivity analysis by trial methodology, Outcome 1 Regaining independent walking ability.

Comparison 3 Subgroup analysis comparing participants in acute and chronic phases of stroke, Outcome 1 Independent walking at the end of intervention phase, all electromechanical devices used.

Comparison 4 Post hoc sensitivity analysis: ambulatory status at study onset, Outcome 1 Recovery of independent walking: ambulatory status at study onset.
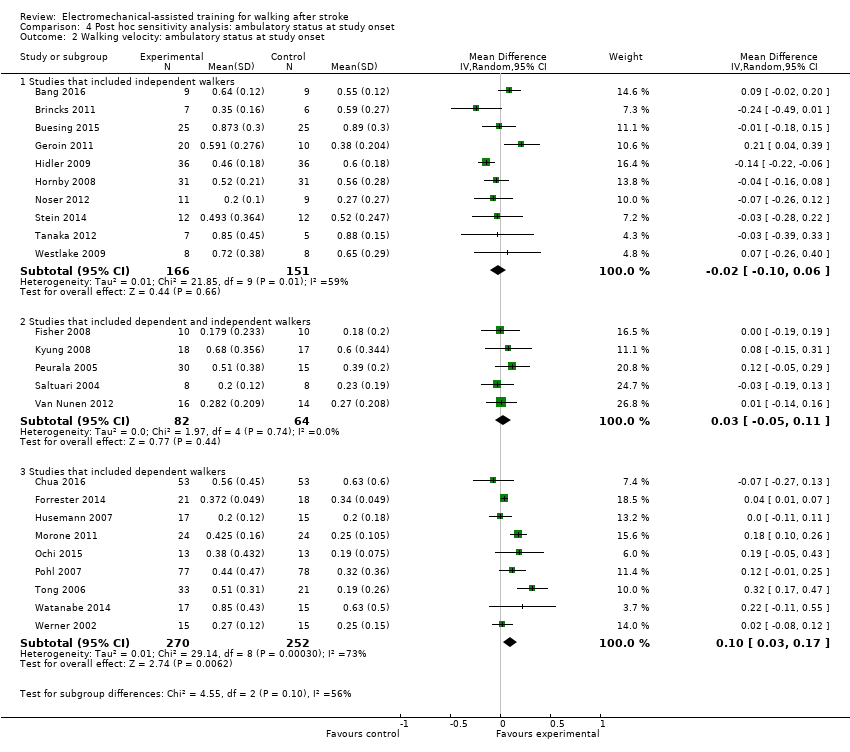
Comparison 4 Post hoc sensitivity analysis: ambulatory status at study onset, Outcome 2 Walking velocity: ambulatory status at study onset.
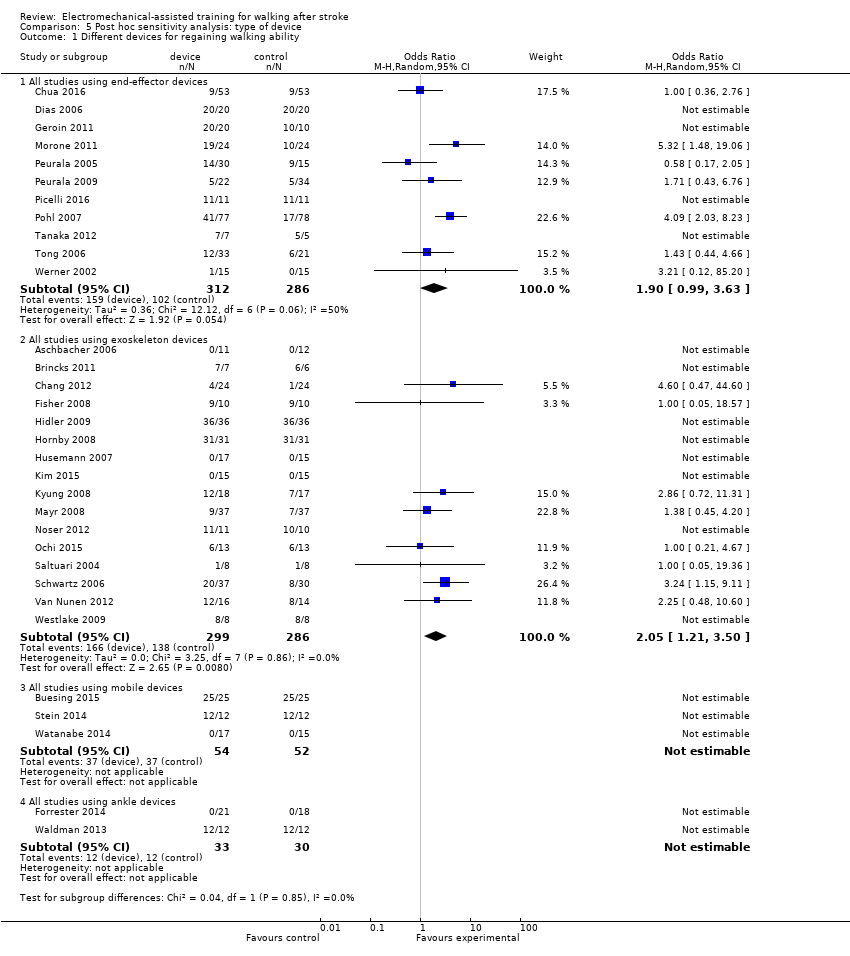
Comparison 5 Post hoc sensitivity analysis: type of device, Outcome 1 Different devices for regaining walking ability.

Comparison 5 Post hoc sensitivity analysis: type of device, Outcome 2 Different devices for regaining walking speed.

Comparison 5 Post hoc sensitivity analysis: type of device, Outcome 3 Different devices for regaining walking capacity.
| Electromechanical‐ and robotic‐assisted gait training plus physiotherapy compared to physiotherapy (or usual care) for walking after stroke | ||||||
| Patient or population: walking after stroke | ||||||
| Outcomes | Anticipated absolute effects* (95% CI) | Relative effect | № of participants | Quality of the evidence | Comments | |
| Risk with physiotherapy (or usual care) | Risk with electromechanical‐ and robotic‐assisted gait training plus physiotherapy | |||||
| Independent walking at the end of intervention phase, all electromechanical devices used | Study population | OR 1.94 | 1472 | ⊕⊕⊕⊝ | ||
| 457 per 1000 | 615 per 1000 | |||||
| Recovery of independent walking at follow‐up after study end | Study population | OR 1.93 | 496 | ⊕⊕⊕⊝ | ||
| 551 per 1000 | 703 per 1000 | |||||
| Walking velocity (metres per second) at the end of intervention phase | The mean walking velocity (metres per second) at the end of intervention phase was 0. | MD 0.04 higher | ‐ | 985 | ⊕⊕⊝⊝ | |
| Walking velocity (metres per second) at follow‐up | The mean walking velocity (metres per second) at follow‐up was 0. | MD 0.07 higher | ‐ | 578 | ⊕⊕⊕⊝ | |
| Walking capacity (metres walked in 6 minutes) at the end of intervention phase | The mean walking capacity (metres walked in 6 minutes) at the end of intervention phase was 0. | MD 5.84 higher | ‐ | 594 | ⊕⊝⊝⊝ | |
| Walking capacity (metres walked in 6 minutes) at follow‐up | The mean walking capacity (metres walked in 6 minutes) at follow‐up was 0. | MD 0.82 lower | ‐ | 463 | ⊕⊝⊝⊝ | |
| Acceptability of electromechanical‐assisted gait‐training devices during intervention phase | Study population | OR 0.67 | 1472 | ⊕⊕⊝⊝ | ||
| 131 per 1000 | 92 per 1000 | |||||
| *The risk in the intervention group (and its 95% confidence interval) is based on the assumed risk in the comparison group and the relative effect of the intervention (and its 95% CI). | ||||||
| GRADE Working Group grades of evidence | ||||||
| 1Downgraded due to several ratings of 'unclear' and 'high' risk of bias. | ||||||
| Study ID | Experimental: age, mean (SD) | Control: age, mean (SD) | Experimental: time poststroke | Control: time poststroke | Experimental: sex | Control: sex | Experimental: side paresis | Control: side paresis |
| 57 years | 65 years | ≤ 3 months | ≤ 3 months | 2 female | 4 female | Not stated | Not stated | |
| 54 years | 54 years | 12 months | 13 months | 5 male, 4 female | 4 male, 5 female | 4 right, 5 left | 4 right, 5 left | |
| 61 (median) years | 59 (median) years | 56 (median) days | 21 (median) days | 5 male, 2 female | 4 male, 2 female | 5 right, 2 left | 1 right, 5 left | |
| 60 years | 62 years | 7 years | 5 years | 17 male, 8 female | 16 male, 9 female | 13 right, 12 left | 12 right, 13 left | |
| 56 (12) years | 60 (12) years | 16 (5) days | 18 (5) days | 13 male, 7 female | 10 male, 7 female | 6 right, 14 left | 6 right, 11 left | |
| 55 (12) years | 55 (15) years | 15 months | 13 months | Not stated | Not stated | 6 right, 4 left (4 both) | 3 right, 1 left (3 both) | |
| 62 (10) years | 61 (11) years | 27 (11) days | 30 (14) days | 35 male, 18 female | 40 male, 13 female | 24 right, 29 left | 21 right, 32 left | |
| 70 (7) years | 68 (11) years | 47 (64) months | 48 (30) months | 16 male, 4 female | 14 male, 6 female | Not stated | Not stated | |
| Not stated | Not stated | Less than 12 months | Less than 12 months | Not stated | Not stated | Not stated | Not stated | |
| 63 years | 60 years | 12 days | 11 days | Not stated | Not stated | 9 right, 9 left | 7 right, 9 left | |
| 63 (7) years | 61 (6) years | 26 (6) months | 27 (6) months | 14 male, 6 female | 9 male, 1 female | Not stated | Not stated | |
| 68 (15) years | 63 (11) years | 22 (8) days | 18 (10) days | Not stated | Not stated | 20 right, 10 left | 14 right, 12 left | |
| 60 (11) years | 55 (9) years | 111 (63) days | 139 (61) days | 21 male, 12 female | 18 male, 12 female | 22 right, 11 left | 13 right, 17 left | |
| 57 (10) years | 57 (11) years | 50 (51) months | 73 (87) months | 15 male, 9 female | 15 male, 9 female | 16 right, 8 left | 16 right, 8 left | |
| 60 (13) years | 57 (11) years | 79 (56) days | 89 (61) days | 11 male, 5 female | 10 male, 4 female | 12 right, 4 left | 11 right, 3 left | |
| 54 (13) years | 50 (16) years | 80 (60) days | 120 (84) days | 9 male, 4 female | 10 male, 3 female | 8 right, 5 left | 10 right, 3 left | |
| 48 (8) years | 55 (16) years | 22 (23) months | 29 (12) months | 9 male, 8 female | 4 male, 4 female | 9 right, 8 left | 4 right, 4 left | |
| Not stated | Not stated | Between 10 days and 6 months | Between 10 days and 6 months | Not stated | Not stated | Not stated | Not stated | |
| 62 (11) years | 62 (14) years | 19 (11) days | 20 (14) days | 15 male, 9 female | 13 male, 11 female | 13 right, 11 left | 15 right, 9 left | |
| 67 (9) years | 64 (11) years | 1354 days | 525 days | 7 male, 4 female | 6 male, 4 female | Not stated | Not stated | |
| 62 (8) years | 66 (12) years | 23 (7) days | 26 (8) days | 11 male, 2 female | 9 male, 4 female | 6 right, 7 left | 5 right, 8 left | |
| 52 (8) years | 52 (7) years | 2.5 (2.5) years | 4.0 (5.8) years | 26 male, 4 female | 11 male, 4 female | 13 right, 17 left | 10 right, 5 left | |
| 67 (9) years | 68 (10) years | 8 (3) days | 8 (3) days | 11 male, 11 female | 18 male, 16 female | 11 right, 11 left | 14 right, 20 left | |
| 62 (10) years | 65 (3) years | 6 (4) years | 6 (4) years | 7 male, 4 female | 9 male, 2 female | Not stated | Not stated | |
| 62 (12) years | 64 (11) years | 4.2 (1.8) weeks | 4.5 (1.9) weeks | 50 male, 27 female | 54 male, 24 female | 36 right, 41 left | 33 right, 45 left | |
| 62 (13) years | 60 (19) years | 3.6 (4.6) months | 1.9 (0.8) months | 4 male, 4 female | 2 male, 6 female | Not stated | Not stated | |
| 62 (9) years | 65 (8) years | 22 (9) days | 24 (10) days | 21 male, 16 female | 20 male, 10 female | 17 right, 20 left | 8 right, 22 left | |
| 58 (11) years | 57 (15) years | 49 (39) months | 89 (153) months | Not stated | Not stated | Not stated | Not stated | |
| 63 (10) years | 60 (9) years | 55 (37) months | 65 (67) months | 10 male, 2 female | 9 right, 3 left | |||
| 71 (14) years | 64 (10) years | 2.5 (1.2) weeks | 2.7 (1.2) weeks | 19 male, 11 female | 12 male, 8 female | 13 right, 17 left | 7 right, 13 left | |
| 56 years | 62 years | Not stated | Not stated | Not stated | Not stated | Not stated | Not stated | |
| 53 (10) years | 2.1 (1.3) months | 16 male, 14 female | Not stated | Not stated | ||||
| 51 (8) years | 53 (7) years | 41 (20) months | 30 (22) months | Not stated | Not stated | Not stated | Not stated | |
| 67 (17) years | 76 (14) years | 59 (47) days | 51 (34) days | 7 male, 4 female | 4 male, 7 female | 6 right, 5 left | 5 right, 6 left | |
| 60 (9) years | 60 (9) years | 7.4 (2.0) weeks | 6.9 (2.1) weeks | 8 male, 7 female | 5 male, 10 female | 8 right, 7 left | 8 right, 7 left | |
| 59 (17) years | 55 (14) years | 44 (27) months | 37 (20) months | 6 male, 2 female | 7 male, 1 female | 4 right, 4 left | 3 right, 5 left | |
| SD: standard deviation | ||||||||
| Criteria | Stroke severity | Electromechanical device used | Duration of study intervention | Aetiology (ischaemic/haemorrhage) | Intensity of treatment per day | Description of the control intervention | Dropouts | Reasons for dropout and adverse events in the experimental group | Reasons for dropout and adverse events in the control group | Source of information |
| Not stated | Lokomat | 3 weeks | Not stated | 30 minutes, 5 times a week | Described as task‐oriented physiotherapy, 5 times a week for 3 weeks (2.5 hours a week) | 4 of 23 | Not stated | Not stated | Unpublished information in the form of a conference presentation | |
| Unclear | Lokomat | 4 weeks | 13/5 | 60 minutes, 5 times a week (20 sessions) | Described as treadmill training without body weight support | 0 of 18 | ‐ | ‐ | Published information | |
| Mean FIM, 92 of 126 points | Lokomat | 3 weeks | Not stated | Not stated | Physiotherapy | 0 of 13 | ‐ | ‐ | Unpublished and published information provided by the authors. | |
| Unclear | Wearable exoskeleton Stride Management Assist system (SMA) | 6 to 8 weeks | Unclear | 3 times per week for a maximum of 18 sessions | Functional task‐specific training (intensive overground training and mobility training) | 0 of 50 | ‐ | ‐ | Published information | |
| Not stated | Lokomat | 10 days | Not stated | 30 minutes daily for 10 days | Conventional gait training by physical therapists (with equal therapy time and same amount of sessions as experimental group) | 3 of 40 | Not described by group (3 participants dropped out: 1 due to aspiration pneumonia, and 2 were unable to co‐operate fully with the experimental procedure) | Unpublished and published information provided by the authors. | ||
| Mean Modified Barthel Index, 36 points | Lokomat | 8 weeks (2 phases, cross‐over after 4 weeks) | 4/14 (2 both) | 30 minutes, 3 times a week for 4 weeks | Bobath (neurophysiological exercises, inhibition of spasticity and synergy pattern) | 0 of 20 | ‐ | ‐ | Published information | |
| Mean Barthel Index, 49 points | Gait Trainer | 8 weeks | Not stated | Not stated | Physiotherapy including 25 minutes of stance/gait, 10 minutes cycling, 10 minutes tilt table standing | 20 of 106 | 2 death, 3 refusal, 1 medical problem, 1 transport problem (1 pain as adverse event) | 1 death, 6 refusal, 3 medical problem, 1 administrative problem (no adverse events) | Published information | |
| Mean Barthel Index, 75 points | Gait Trainer | 4 weeks | Not stated | 40 minutes, 5 times a week | Bobath method, 5 times a week for 5 weeks | 0 of 40 | ‐ | ‐ | Unpublished and published information provided by the authors. | |
| Not stated | AutoAmbulator | 24 sessions | Not stated | Minimum of 3 sessions a week up to 5 sessions; number of minutes in each session unclear | "Standard" physical therapy, 3 to 5 times a week for 24 consecutive sessions | 0 of 20 | 14 adverse events, no details provided | 11 adverse events, no details provided | Unpublished and published information provided by the authors. | |
| Mean FIM walk 1 point | Anklebot | 8 to 10 sessions (with ca. 200 repetitions) | Not stated | 60 minutes, 8 to 10 sessions | Stretching of the paretic ankle | 5 of 34 | Total of 5 dropouts in both groups (1 medical complication, 1 discharge prior study end, 2 time poststroke > 49 days, 1 non‐compliance) | Published information provided by the authors. | ||
| Mean European Stroke Scale, 80 points | Gait Trainer | 2 weeks | Not stated | 50 minutes, 5 times a week | Walking exercises according to the Bobath approach | 0 of 30 | ‐ | ‐ | Unpublished and published information provided by the authors. | |
| Not stated | Lokomat | 4 weeks | 33/23 | 30 minutes, 5 times a week | Neurodevelopmental techniques for balance and mobility | 4 0f 60 | ‐ | 4 unclear reasons | Published information provided by the authors. | |
| Not stated | Lokomat | 8 to 10 weeks (24 sessions) | 47/16 | 45 minutes, 3 days a week | Conventional gait training, 3 times a week for 8 to 10 weeks (24 sessions), each session lasted 1.5 hours | 9 of 72 | Not described by group (9 withdrew or were removed because of poor attendance or a decline in health, including 1 death, which according to the authors was unrelated to study) | Unpublished and published information provided by the authors. | ||
| Not stated | Lokomat | 12 sessions | 22/26 | 30 minutes, 12 sessions | Therapist‐assisted gait training, 12 sessions, each session lasted 30 minutes | 14 of 62 | 4 participants dropped out (2 discontinued secondary to leg pain during training, 1 experienced pitting oedema, and 1 had travel limitations) | 10 participants dropped out (4 discontinued secondary to leg pain, 1 experienced an injury outside therapy, 1 reported fear of falling during training, 1 presented with significant hypertension, 1 had travel limitations, and 2 experienced subjective exercise intolerance) | Published information provided by the authors. | |
| Median Barthel Index, 35 points | Lokomat | 4 weeks | 22/8 | 30 minutes, 5 times a week | Conventional physiotherapy, 30 minutes per day for 4 weeks | 2 of 32 | 1 participant enteritis | 1 participant pulmonary embolism | Information as provided by the authors | |
| Mean Barthel Index, 20 points | Walkbot | 4 weeks | 13/13 | 30 minutes, 5 times a week | Conventional physiotherapy (bed mobility, stretching, balance training, strengthening, symmetry training, treadmill training) | 4 of 30 | 1 rib fracture, 3 decline in health condition | Information as provided by the authors | ||
| Not stated | Lokomat | 4 weeks | 18/7 | 45 minutes, 3 days a week | Conventional physiotherapy, received equal time and sessions of conventional gait training | 10 of 35 | 1 participant dropped out for private reasons (travelling); adverse events not described | 9 participants refused after randomisation (reasons not provided); adverse events not described | Unpublished and published information provided by the authors. | |
| Not stated | Lokomat | 8 weeks | Not stated | Not stated | Add‐on conventional physiotherapy, received equal time and sessions of conventional gait training | 13 of 74 | 4 participants dropped out (reasons not provided); adverse events not described | 9 participants dropped out (reasons not provided) | Unpublished and published information provided by the authors. | |
| Canadian Neurological Scale, 6 points | Gait Trainer | 4 weeks | 41/7 | 40 minutes, 5 times a week | Focused on trunk stabilisation, weight transfer to the paretic leg, and walking between parallel | 21 of 48 | 12 (hypotension, referred weakness, knee pain, urinary infection, uncontrolled blood pressure, fever, absence of physiotherapist) | 9 (hypotension, referred weakness, knee pain, ankle pain, uncontrolled blood pressure, fever, absence of physiotherapist) | Information as provided by the authors | |
| Not stated | Lokomat | Unclear | Not stated | Not stated | Not stated | 1 of 21 | No dropouts; 2 serious adverse events (1 skin breakdown as a result of therapy, 1 second stroke during the post‐treatment phase) | 1 dropout due to protocol violation; 2 serious adverse events (1 sudden drop in blood pressure at participant's home leading to brief hospitalisation, 1 sudden chest pain before therapy leading to brief hospitalisation) | Information as provided by the authors | |
| Not stated | Gait‐assistance robot (consisting of 4 robotic arms for the thighs and legs, thigh cuffs, leg apparatuses, and a treadmill) | 4 weeks | 10/16 | 20 minutes, 5 times a week for 4 weeks, in addition to rehabilitation treatment | Range‐of‐motion exercises, muscle strengthening, rolling over and sit‐to‐stand and activity and gait exercises | 0 of 26 | ‐ | ‐ | Published information | |
| Scandinavian Stroke Scale, 42 points | Gait Trainer | 3 weeks | 25/20 | 20 minutes, 5 times a week for 3 weeks, in addition to rehabilitation treatment | Walking overground; all participants practised gait for 15 sessions over 3 weeks (each session lasting 20 minutes) | 0 of 45 | ‐ | ‐ | Published information | |
| Not stated | Gait Trainer | 3 weeks | 42/14 | 20 minutes, 5 times a week for 3 weeks, in addition to rehabilitation treatment | Overground walking training; in the other control group, 1 or 2 physiotherapy sessions daily but not at the same intensity as in the other groups | 9 of 56 | 5 dropouts (2 situation worsened after 1 to 2 treatment days; 1 had 2 unsuccessful attempts in device; 1 had scheduling problems; 1 felt protocol too demanding) | 4 dropouts (1 felt protocol too demanding; 2 situation worsened after 1 to 2 treatment days; 1 death) | Published information | |
| Not stated | G‐EO System Evolution | Experimental group (G‐EO) 30 minutes a day for 5 consecutive days | Not stated | 5 days in addition to botulinum toxin injection of calf muscles | None | 0 of 22 | ‐ | ‐ | Published information | |
| Mean Barthel Index, 37 points | Gait Trainer | 4 weeks | 124/31 | 20 minutes, 5 times a week | Physiotherapy every weekday for 4 weeks | 11 of 155 | 2 participants refused therapy, 1 increased cranial pressure, 1 relapsing pancreas tumour, 1 cardiovascular unstable | 4 participants refused therapy, 1 participant died, 1 myocardial infarction | Published information | |
| Not stated | Lokomat | 2 weeks | 13/3 | A‐B‐A study: in phase A, 30 minutes, 5 days a week | Physiotherapy every weekday for 3 weeks (phase B) | 0 of 16 | None | None | Unpublished and published information provided by the authors. | |
| Mean NIHSS, 11 points | Lokomat | 6 weeks | 49/67 | 30 minutes, 3 times a week | Physiotherapy with additional gait training 3 times a week for 6 weeks | 6 of 46 | 2 participants with leg wounds, 1 participant with recurrent stroke, 1 refused therapy | 1 participant with recurrent stroke, 1 with pulmonary embolism | Unpublished and published information provided by the authors. | |
| Not stated | Bionic leg device (AlterG) | 6 weeks | Not stated | 1 hour, 3 times a week for 6 weeks | Group exercises | 0 of 24 | ‐ | ‐ | Published information | |
| Mean FIM, 79 points | Gait Master4 | 4 weeks | Not stated | 20 minutes, 2 or 3 times a week (12 sessions) | Non‐intervention (non‐training) | 0 of 12 | ‐ | ‐ | Published information | |
| Mean Barthel Index, 51 points | Gait Trainer | 4 weeks | 39/11 | 20 minutes, 5 times a week | Conventional physiotherapy alone, based on Bobath concept | 4 of 50 | None | 2 participants discharged before study end, 1 participant readmitted to an acute ward, 1 participant deteriorating condition | Published information | |
| Not stated | Lokomat | 2 weeks | Not stated | 30 minutes, 5 times a week | Conventional physiotherapy at home (focused on gait) | 0 of 22 | ‐ | ‐ | Published information | |
| Not stated | Lokomat | 8 weeks | Not stated | 30 minutes, twice a week | Overground therapy | 0 of 30 | ‐ | ‐ | Unpublished and published information provided by the author. | |
| Not stated | Portable rehab robot (ankle device) | 6 weeks | Not stated | 3 times a week, 18 sessions | Stretching the plantar flexors and active exercises for ankle mobility and strength | 0 of 24 | ‐ | ‐ | Published information | |
| Not stated | Single‐leg version of the Hybrid Assistive Limb (HAL) | 4 weeks | 11/11 | 20 minutes, 12 sessions | Aimed to improve walking speed, endurance, balance, postural stability, and symmetry | 10 of 32 | 4 withdrew, 1 epilepsy, 1 technical reasons | 2 pneumonia, 2 discharged | Published information | |
| Mean Barthel Index, 38 points | Gait Trainer | 2 weeks | 13/12 | 20 minutes, 5 times a week | Gait therapy including treadmill training with body weight support | 0 of 30 | None | None | Published information | |
| Not stated | Lokomat | 4 weeks (12 sessions) | 8/8 | 30 minutes, 3 times a week | 12 physiotherapy sessions including manually guided gait training (3 times a week over 4 weeks) | 0 of 16 | None | None | Published information | |
| FIM: Functional Independence Measure | ||||||||||
| Outcome or subgroup title | No. of studies | No. of participants | Statistical method | Effect size |
| 1 Independent walking at the end of intervention phase, all electromechanical devices used Show forest plot | 36 | 1472 | Odds Ratio (M‐H, Random, 95% CI) | 1.94 [1.39, 2.71] |
| 2 Recovery of independent walking at follow‐up after study end Show forest plot | 6 | 496 | Odds Ratio (M‐H, Random, 95% CI) | 1.93 [0.72, 5.13] |
| 3 Walking velocity (metres per second) at the end of intervention phase Show forest plot | 24 | 985 | Mean Difference (IV, Random, 95% CI) | 0.04 [‐0.00, 0.09] |
| 4 Walking velocity (metres per second) at follow‐up Show forest plot | 9 | 578 | Mean Difference (IV, Random, 95% CI) | 0.07 [‐0.05, 0.19] |
| 5 Walking capacity (metres walked in 6 minutes) at the end of intervention phase Show forest plot | 12 | 594 | Mean Difference (IV, Random, 95% CI) | 5.84 [‐16.73, 28.40] |
| 6 Walking capacity (metres walked in 6 minutes) at follow‐up Show forest plot | 7 | 463 | Mean Difference (IV, Random, 95% CI) | ‐0.82 [‐32.17, 30.53] |
| 7 Acceptability of electromechanical‐assisted gait training devices during intervention phase: dropouts Show forest plot | 36 | 1472 | Odds Ratio (M‐H, Random, 95% CI) | 0.67 [0.43, 1.05] |
| 8 Death from all causes until the end of intervention phase Show forest plot | 36 | 1472 | Risk Difference (M‐H, Random, 95% CI) | 0.00 [‐0.01, 0.02] |
| Outcome or subgroup title | No. of studies | No. of participants | Statistical method | Effect size |
| 1 Regaining independent walking ability Show forest plot | 36 | Odds Ratio (M‐H, Random, 95% CI) | Subtotals only | |
| 1.1 All studies with adequate sequence generation process | 20 | 949 | Odds Ratio (M‐H, Random, 95% CI) | 1.80 [1.06, 3.08] |
| 1.2 All studies with adequate concealed allocation | 17 | 831 | Odds Ratio (M‐H, Random, 95% CI) | 1.87 [1.12, 3.12] |
| 1.3 All studies with blinded assessors for primary outcome | 16 | 762 | Odds Ratio (M‐H, Random, 95% CI) | 1.81 [1.10, 2.98] |
| 1.4 All studies without incomplete outcome data | 14 | 590 | Odds Ratio (M‐H, Random, 95% CI) | 2.23 [1.16, 4.29] |
| 1.5 All studies excluding the largest study Pohl 2007 | 35 | 1317 | Odds Ratio (M‐H, Random, 95% CI) | 1.65 [1.17, 2.34] |
| Outcome or subgroup title | No. of studies | No. of participants | Statistical method | Effect size |
| 1 Independent walking at the end of intervention phase, all electromechanical devices used Show forest plot | 36 | Odds Ratio (IV, Random, 95% CI) | Subtotals only | |
| 1.1 Acute phase: less than or equal to 3 months after stroke | 20 | 1143 | Odds Ratio (IV, Random, 95% CI) | 1.90 [1.38, 2.63] |
| 1.2 Chronic phase: more than 3 months after stroke | 16 | 461 | Odds Ratio (IV, Random, 95% CI) | 1.20 [0.40, 3.65] |
| Outcome or subgroup title | No. of studies | No. of participants | Statistical method | Effect size |
| 1 Recovery of independent walking: ambulatory status at study onset Show forest plot | 36 | Odds Ratio (M‐H, Random, 95% CI) | Subtotals only | |
| 1.1 Studies that included independent walkers | 15 | 500 | Odds Ratio (M‐H, Random, 95% CI) | 1.38 [0.45, 4.20] |
| 1.2 Studies that included dependent and independent walkers | 9 | 340 | Odds Ratio (M‐H, Random, 95% CI) | 1.90 [1.11, 3.25] |
| 1.3 Studies that included dependent walkers | 12 | 632 | Odds Ratio (M‐H, Random, 95% CI) | 1.90 [1.04, 3.48] |
| 2 Walking velocity: ambulatory status at study onset Show forest plot | 24 | Mean Difference (IV, Random, 95% CI) | Subtotals only | |
| 2.1 Studies that included independent walkers | 10 | 317 | Mean Difference (IV, Random, 95% CI) | ‐0.02 [‐0.10, 0.06] |
| 2.2 Studies that included dependent and independent walkers | 5 | 146 | Mean Difference (IV, Random, 95% CI) | 0.03 [‐0.05, 0.11] |
| 2.3 Studies that included dependent walkers | 9 | 522 | Mean Difference (IV, Random, 95% CI) | 0.10 [0.03, 0.17] |
| Outcome or subgroup title | No. of studies | No. of participants | Statistical method | Effect size |
| 1 Different devices for regaining walking ability Show forest plot | 32 | Odds Ratio (M‐H, Random, 95% CI) | Subtotals only | |
| 1.1 All studies using end‐effector devices | 11 | 598 | Odds Ratio (M‐H, Random, 95% CI) | 1.90 [0.99, 3.63] |
| 1.2 All studies using exoskeleton devices | 16 | 585 | Odds Ratio (M‐H, Random, 95% CI) | 2.05 [1.21, 3.50] |
| 1.3 All studies using mobile devices | 3 | 106 | Odds Ratio (M‐H, Random, 95% CI) | 0.0 [0.0, 0.0] |
| 1.4 All studies using ankle devices | 2 | 63 | Odds Ratio (M‐H, Random, 95% CI) | 0.0 [0.0, 0.0] |
| 2 Different devices for regaining walking speed Show forest plot | 24 | Mean Difference (IV, Random, 95% CI) | Subtotals only | |
| 2.1 All studies using end‐effector devices | 9 | 519 | Mean Difference (IV, Random, 95% CI) | 0.11 [0.04, 0.18] |
| 2.2 All studies using exoskeleton devices | 12 | 360 | Mean Difference (IV, Random, 95% CI) | ‐0.02 [‐0.08, 0.04] |
| 2.3 All studies using mobile devices | 3 | 106 | Mean Difference (IV, Random, 95% CI) | 0.02 [‐0.11, 0.15] |
| 2.4 All studies using ankle devices | 1 | 39 | Mean Difference (IV, Random, 95% CI) | 0.04 [0.01, 0.07] |
| 3 Different devices for regaining walking capacity Show forest plot | 12 | 594 | Mean Difference (IV, Random, 95% CI) | 5.84 [‐16.73, 28.40] |
| 3.1 All studies using end‐effector devices | 4 | 328 | Mean Difference (IV, Random, 95% CI) | 27.50 [3.64, 51.36] |
| 3.2 All studies using exoskeleton devices | 5 | 186 | Mean Difference (IV, Random, 95% CI) | ‐15.64 [‐46.34, 15.05] |
| 3.3 All studies using mobile devices | 2 | 56 | Mean Difference (IV, Random, 95% CI) | 20.06 [‐39.52, 79.63] |
| 3.4 All studies using ankle devices | 1 | 24 | Mean Difference (IV, Random, 95% CI) | 8.0 [‐83.03, 99.03] |