Entrenamiento asistido por aparatos electromecánicos para caminar después de un accidente cerebrovascular
Resumen
Antecedentes
Los dispositivos de entrenamiento de marcha electromecánicos y robotizados se utilizan en la rehabilitación y podrían ayudar a mejorar la marcha después de un accidente cerebrovascular. Ésta es una actualización de una revisión Cochrane publicada por primera vez en 2007 y actualizada previamente en 2017.
Objetivos
Primario
• Determinar si los dispositivos de entrenamiento de marcha electromecánicos y robotizados versus la atención normal mejoran la marcha después de un accidente cerebrovascular
Secundario
• Determinar si los dispositivos de entrenamiento de marcha electromecánicos y robotizados versus la atención normal después de un accidente cerebrovascular mejoran la velocidad de la marcha, la capacidad de caminar, la aceptabilidad y la mortalidad por todas las causas hasta el final de la fase de intervención.
Métodos de búsqueda
Se realizaron búsquedas en el registro de ensayos del Grupo Cochrane de Accidentes Cerebrovasculares (Cochrane Stroke Group) (última búsqueda el 6 de enero de 2020); en el Registro Cochrane Central de Ensayos Controlados (Cochrane Central Register of Controlled Trials, CENTRAL; número 1, 2020), en la Biblioteca Cochrane; MEDLINE; en Ovid (1950 al 6 de enero de 2020); Embase (1980 al 6 de enero de 2020); el Cumulative Index to Nursing and Allied Health Literature (CINAHL; 1982 al 20 de noviembre de 2019); la Allied and Complementary Medicine Database (AMED; 1985 al 6 de enero de 2020); Web of Science (1899 al 7 de enero de 2020); SPORTDiscus (1949 al 6 de enero de 2020); la Physiotherapy Evidence Database (PEDro el 7 de enero de 2020); y las bases de datos de ingeniería COMPENDEX (1972 al 16 de enero de 2020) e Inspec (1969 al 6 de enero de 2020). Se realizaron búsquedas manuales de las actas de congresos relevantes, se realizó una búsqueda de ensayos y registros de investigación, se comprobaron las listas de referencias y se estableció contacto con los autores de los ensayos con la finalidad de identificar ensayos adicionales publicados, no publicados y en curso.
Criterios de selección
Se incluyeron todos los ensayos controlados aleatorizados y los ensayos controlados aleatorizados cruzados que incluyeron a pacientes de más de 18 años de edad con diagnóstico de accidente cerebrovascular de cualquier gravedad, en cualquier estadio o en cualquier contexto, que evaluaron los dispositivos de entrenamiento de marcha electromecánicos y robóticos versus la atención habitual.
Obtención y análisis de los datos
Dos autores de la revisión, de forma independiente, seleccionaron los ensayos para la inclusión, evaluaron la calidad metodológica y el riesgo de sesgo, y extrajeron los datos. La calidad de la evidencia se evaluó mediante el enfoque GRADE. El desenlace principal fue la proporción de participantes que caminaron de forma autónoma durante el seguimiento.
Resultados principales
En esta revisión se incluyeron 62 ensayos con 2440 participantes. El entrenamiento dela marcha asistido por aparatos electromecánicos en combinación con fisioterapia aumentó las probabilidades de que los participantes fueran autónomos al caminar (odds ratio [efectos aleatorios] 2,01; intervalo de confianza [IC] del 95%: 1,51 a 2,69; 38 estudios, 1567 participantes; p < 0,00001; I² = 0%; evidencia de alta calidad) y aumentó la velocidad media al caminar (diferencia de medias [DM] 0,06 m/s, IC del 95%: 0,02 a 0,10; 42 estudios, 1600 participantes; P = 0,004; I² = 60%; evidencia de calidad baja) pero no mejoró la capacidad media de caminar (DM 10,9 metros caminados en 6 minutos, IC del 95%: ‐5,7 a 27,4; 24 estudios, 983 participantes; P = 0,2; I² = 42%; evidencia de calidad moderada). El entrenamiento de la marcha asistida por dispositivos electromecánicos no aumentó el riesgo de abandono del estudio durante la intervención, ni el riesgo de muerte por todas las causas. Los resultados se deben interpretar con cautela porque: 1) algunos ensayos investigaron a pacientes que eran independientes en cuanto a caminar al inicio de estudio; 2) se encontraron variaciones entre los ensayos con respecto a los dispositivos utilizados y a la duración y la frecuencia del tratamiento, y 3) algunos ensayos incluyeron dispositivos con estimulación eléctrica funcional. El análisis post hoc mostró que las personas que no deambulaban al comienzo de la intervención podrían beneficiarse con este tipo de entrenamiento, pero las que deambulaban podrían no obtener beneficio alguno. El análisis post hoc no mostró diferencias entre los tipos de dispositivos utilizados en los estudios con respecto a la capacidad para caminar, pero reveló diferencias entre los dispositivos en cuanto a la velocidad y la capacidad para caminar.
Conclusiones de los autores
Los pacientes que reciben entrenamiento de marcha asistido por aparatos electromecánicos en combinación con fisioterapia después de un accidente cerebrovascular tienen mayores probabilidades de caminar de forma autónoma que los pacientes que reciben entrenamiento de marcha sin estos dispositivos. Se concluyó que ocho pacientes deben ser tratados para prevenir una dependencia para caminar. En concreto, este tipo de intervención parece beneficiar más a las personas que se encuentran en los tres primeros meses después del accidente cerebrovascular y las que no son capaces de caminar. La función del tipo de dispositivo aún no está clara. Los estudios de investigación adicionales deben consistir en ensayos de fase III pragmáticos definitivos y grandes para abordar preguntas específicas acerca de la frecuencia y la duración más efectiva del entrenamiento de la marcha electromecánico, así como cuánto tiempo puede durar el efecto beneficioso. Los ensayos futuros deberán considerar el tiempo desde el accidente cerebrovascular en el diseño del estudio.
PICO
Resumen en términos sencillos
¿Ayudan los dispositivos electrónicos o robóticos de entrenamiento de la marcha a caminar mejor a las personas que han sufrido un ictus?
Mensajes clave
Los dispositivos electrónicos o robóticos de entrenamiento de la marcha más la fisioterapia ayudan volver a caminar de manera autónoma a las personas tras un ictus. Podrían beneficiar específicamente a las personas en los tres primeros meses después de un ictus, así como a las personas que no pueden caminar.
Se necesitan más estudios para averiguar con qué frecuencia y durante cuánto tiempo deben utilizarse estos dispositivos.
¿Qué es un ictus?
Un ictus ocurre cuando se interrumpe el flujo de sangre a una parte del cerebro, lo cual bloquea el suministro de oxígeno y nutrientes a las células cerebrales. Esto causa un ataque repentino de debilidad que suele afectar a un lado del cuerpo. Si se detiene el suministro de sangre al cerebro, las células cerebrales comienzan a morir. Este hecho puede dar lugar a lesión cerebral, discapacidad y posiblemente a la muerte.
Las personas que sobreviven a un ictus a menudo mantienen problemas a largo plazo causados por una lesión en el cerebro. Pueden sentir que las actividades físicas, como caminar, son difíciles debido al debilitamiento de los músculos de las piernas de un lado del cuerpo, la rigidez de las articulaciones o la falta de coordinación. Es posible que las personas necesiten una larga rehabilitación, que incluya fisioterapia, antes de poder recuperar su autonomía anterior. La fisioterapia incluye ejercicios, masajes, entrenamiento de habilidades y tratamiento eléctrico para ayudar a las personas a recuperar el movimiento.
Caminar después de un ictus
Mejorar la marcha es una de las metas principales de la rehabilitación tras un ictus. Se han desarrollado dispositivos robóticos (programados para moverse y realizar ciertas tareas de manera automática) y dispositivos mecánicos accionados eléctricamente (electromecánicos) para ayudar a las personas a mejorar su marcha (forma de andar). Las personas que tienen dificultades para caminar necesitan mucha práctica para caminar.
¿Por qué se ha realizado esta revisión Cochrane?
Los dispositivos de entrenamiento de la marcha permiten que las personas que no pueden caminar tengan una práctica intensiva de la marcha, sin necesidad de mucho apoyo físico de su terapeuta mientras practican la marcha.
Se deseaba conocer si los dispositivos de entrenamiento de la marcha podrían ayudar a caminar mejor a las personas que han sufrido un ictus.
¿Qué se hizo?
Se buscaron estudios que analizaran el uso de dispositivos de entrenamiento de la marcha para ayudar a las personas a aprender a caminar de nuevo tras un ictus. El interés se centró en averiguar:
• cuántas personas podrían caminar de manera autónoma;
• a qué velocidad podrían caminar las personas;
• qué distancia podrían recorrer en seis minutos;
• cuántas personas abandonaron el estudio; y
• cuántas personas murieron.
Se buscaron los estudios en los que los tratamientos que recibieron las personas se decidieron al azar. Este tipo de estudios suele proporcionar la evidencia más fiable sobre los efectos de un tratamiento.
Fecha de búsqueda: se incluyó evidencia publicada hasta enero de 2020.
Qué se encontró
Se encontraron 62 estudios en 2440 adultos (edad media de 47 a 76 años) que sufrieron un ictus y estaban aprendiendo a caminar de nuevo. Se compararon los efectos de la fisioterapia más los dispositivos electromecánicos y robóticos para el entrenamiento de la marcha con los efectos de la fisioterapia sola o con la atención habitual. En la mayoría de estudios el período de entrenamiento duró entre tres y cuatro semanas; la duración más corta fue de diez días y la más larga de ocho semanas.
¿Cuáles son los resultados de la revisión?
Al final del entrenamiento, en comparación con la fisioterapia o la atención habitual, el uso de un dispositivo de entrenamiento de la marcha junto con fisioterapia:
• ayudó a más personas a caminar de manera autónoma (38 estudios; 1567 personas);
• podría haber aumentado la velocidad media de marcha de las personas (42 estudios; 1600 personas);
• probablemente no aumentó la distancia que podían recorrer las personas en seis minutos (24 estudios; 983 personas); y
• probablemente no aumentó el número de personas que abandonaron el estudio, ni cuántas murieron (62 estudios; 2440 personas).
Por cada ocho personas tratadas con un dispositivo junto con fisioterapia, una persona más pudo caminar de forma autónoma al final del tratamiento.
¿Qué fiabilidad tienen los resultados?
Existe confianza en que los dispositivos de entrenamiento de la marcha junto con la fisioterapia ayudan a más personas a caminar de manera autónoma que la fisioterapia o la atención habitual solas. Es poco probable que la evidencia futura modifique este resultado.
Existe una seguridad moderada en los efectos de estos dispositivos junto con la fisioterapia sobre la distancia caminada en seis minutos, cuántas personas abandonaron el estudio y cuántas murieron. No obstante, estos resultados podrían cambiar cuando se disponga de más evidencia.
Existe menos confianza en los efectos de estos dispositivos sobre la velocidad de la marcha; es probable que este resultado cambie con la evidencia futura.
Authors' conclusions
Summary of findings
| Electromechanical‐ and robot‐assisted gait training plus physiotherapy compared to physiotherapy (or usual care) for walking after stroke | ||||||||
| Patient or population: patients walking after stroke | ||||||||
| Outcomes | Illustrative comparative risks* (95% CI) | Relative effect | No. of participants | Quality of the evidence | Comments | |||
|---|---|---|---|---|---|---|---|---|
| Assumed risk | Corresponding risk | |||||||
| Control | Electromechanical‐ and robot‐assisted gait training plus physiotherapy vs physiotherapy (or usual care) | |||||||
| Independent walking (primary outcome) | At end of intervention phase, all electromechanical devices used | Study population | OR 2.01 | 1572 | ⊕⊕⊕⊕ | |||
| 451 per 1000 | 623 per 1000 | |||||||
| At follow‐up after study end Follow‐up: mean 22.3 weeks | Study population | OR 1.93 | 496 | ⊕⊕⊝⊝ | ||||
| 551 per 1000 | 703 per 1000 | |||||||
| Mean walking velocity (secondary outcome; metres per second) | At end of intervention phase | 0.5 m/s | 0.06 higher | 1600 | ⊕⊕⊝⊝ | |||
| At follow‐up Scale from 0 to infinity | 0.57 m/s | 0.07 higher | 727 | ⊕⊕⊝⊝ | ||||
| Mean walking capacity (secondary outcome; metres walked in 6 minutes) | At end of intervention phase | 172 m | 10.86 higher | 983 | ⊕⊕⊕⊝ | |||
| At follow‐up | 199 m | 7.76 higher | 612 | ⊕⊕⊕⊝ | ||||
| Loss to study during intervention phase, dropouts (secondary outcome) | Study population | RR ‐0.02 (‐0.04 to 0.00) See comment | 2440 | ⊕⊕⊕⊝ | Risks were calculated from pooled risk differences | |||
| 111 per 1000 | 94 per 1000 | |||||||
| Death from all causes until end of intervention phase (secondary outcome) | Study population | RR 0.00 (‐0.01 to 0.01) See comment | 2440 | ⊕⊕⊕⊝ | Risks were calculated from pooled risk differences | |||
| 2 per 1000 | 3 per 1000 (‐8 to 12) | |||||||
| *The basis for the assumed risk (e.g. the median control group risk across studies) is provided in footnotes. The corresponding risk (and its 95% confidence interval) is based on the assumed risk in the comparison group and the relative effect of the intervention (and its 95% CI). | ||||||||
| GRADE Working Group grades of evidence. | ||||||||
| aDowngraded due to several ratings with 'high risk of bias'. | ||||||||
Background
Description of the condition
A stroke is a sudden, non‐convulsive loss of neurological function due to an ischaemic or haemorrhagic intracranial vascular event (WHO 2006). In general, cerebrovascular accidents are classified by anatomic location in the brain, vascular distribution, aetiology, age of the affected individual, and haemorrhagic versus non‐haemorrhagic nature (Adams 1993). Stroke is a leading cause of death and serious long‐term disability in adults (GBD 2019). Three months after stroke, 20% of people remain wheelchair bound and approximately 70% walk at a reduced velocity and capacity (Jorgensen 1995). Restoration of walking ability and gait rehabilitation are therefore highly relevant for people who are unable to walk independently after stroke (Bohannon 1991), as well as for their relatives. To restore gait, modern concepts of rehabilitation favour a repetitive task‐specific approach (Hornby 2020; Winstein 2016). In recent years it has also been shown that higher intensities of walking practice (resulting in more repetitions trained) resulted in better outcomes for people after stroke (Hornby 2020; Winstein 2016).
Description of the intervention
As an adjunct to over‐ground gait training (States 2009), in recent years treadmill training has been introduced for the rehabilitation of people after stroke (Mehrholz 2017). Treadmill training with and without partial body weight support enables the repetitive practice of complex gait cycles for these people. However, one disadvantage of treadmill training might be the effort required by therapists to set the paretic limbs and to control weight shift, thereby possibly limiting the intensity of therapy, especially in more severely disabled people. Automated electromechanical gait machines were developed to reduce dependence on therapists. They consist of either a robot‐driven exoskeleton orthosis ‐ Colombo 2000; Nam 2019 ‐ or an electromechanical solution with two driven foot plates simulating the phases of gait (Aprile 2019; Hesse 1999).
One example of automated electromechanical gait rehabilitation is the Lokomat (Colombo 2000). A robot gait orthosis combined with a harness‐supported body weight system is used together with a treadmill. The main difference from treadmill training is that the patient's legs are guided by the robotic device according to a preprogrammed gait pattern. A computer‐controlled robotic gait orthosis guides the patient, and the process of gait training is automated.
A second example is the Gait Trainer GT I, which is based on a double crank and rocker gear system (Hesse 1999). In contrast to a treadmill, the electromechanical Gait Trainer GT I consists of two foot plates positioned on two bars, two rockers, and two cranks, which provide the propulsion. The harness‐secured patient is positioned on the foot plates, which symmetrically simulate the stance and swing phases of walking (Hesse 1999). A servo‐controlled motor guides the patient during walking exercise. Vertical and horizontal movements of the trunk are controlled in a phase‐dependent manner. Again, the main difference from treadmill training is that the process of gait training is automated and is supported by an electromechanical solution.
Other similar electromechanical devices that have been developed in recent years include the Exowalk (Nam 2019), the Haptic Walker (Schmidt 2005), the Anklebot (MIT 2005), and the LOPES (Lower Extremity Powered Exoskeleton) (Veneman 2005). More recently, new so‐called powered mobile solutions ‐ Buesing 2015; Calabrò 2018; Stein 2014; Watanabe 2014 ‐ and ankle robots ‐ Forrester 2014; Waldman 2013 ‐ to improve walking have been described in the literature.
How the intervention might work
Electromechanical devices (such as those previously described) can be used to give non‐ambulatory patients intensive practice (in terms of high repetitions) of complex gait cycles. The advantage of these electromechanical devices compared with treadmill training with partial body weight support may be the reduced effort required of therapists, as they no longer need to set the paretic limbs or assist trunk movements (Hesse 2003).
Why it is important to do this review
Scientific evidence for the benefits of the above‐mentioned technologies may have changed since our Cochrane Review was first published in 2007 ‐ Mehrholz 2007 ‐ and was last updated in 2017 ‐ Mehrholz 2017 ‐ so an update of the review was required to justify the large equipment and human resource costs needed to implement electromechanical‐assisted gait devices, as well as to confirm the safety and acceptance of this method of training. The aim of this review was therefore to provide an update of the best available evidence about the above‐mentioned approach.
Objectives
Primary
-
To determine whether electromechanical‐ and robot‐assisted gait training versus normal care improves walking after stroke
Secondary
-
To determine whether electromechanical‐ and robot‐assisted gait training versus normal care after stroke improves walking velocity, walking capacity, acceptability, and death from all causes until the end of the intervention phase
Methods
Criteria for considering studies for this review
Types of studies
We searched for all randomised controlled trials and randomised controlled cross‐over trials for inclusion in this review. If we included randomised controlled cross‐over trials, we planned to analyse only the first period as a parallel‐group trial.
Types of participants
We included studies with participants of any gender over 18 years of age after stroke, using the World Health Organization (WHO) definition of stroke or a clinical definition of stroke if the WHO definition was not specifically stated (WHO 2006).
Types of interventions
We included all trials that evaluated electromechanical‐ and robot‐assisted gait training plus physiotherapy versus physiotherapy (or usual care) for regaining and improving walking after stroke. We also included automated electromechanical devices that were used in combination with therapies such as functional electrical stimulation applied to the legs during gait training (compared with therapies not using electromechanical devices). We defined an automated electromechanical device as any device with an electromechanical solution designed to assist stepping cycles by supporting body weight and automating the walking therapy process in people after stroke. This category included any mechanical or computerised device designed to improve walking function. We also searched for electromechanical devices such as robots for gait training after stroke (MIT 2005; Schmidt 2005; Veneman 2005).
Electromechanical devices can principally be differentiated into end‐effector and exoskeleton devices. Examples of end‐effector devices are the LokoHelp (Freivogel 2009), the Haptic Walker (Schmidt 2005), and the Gait Trainer GT I (Hesse 1999). The definition of an end‐effector principle is that a patient's feet are placed on foot plates, whose trajectories simulate the stance and swing phases during gait training (Hesse 2010). An example of exoskeleton devices is the Lokomat (Colombo 2000). Such exoskeletons are outfitted with programmable drives or passive elements, which move the knees and hips during the phases of gait (Hesse 2010).
We did not include non‐weight‐bearing interventions such as non‐interactive devices that deliver continuous passive motion only (Nuyens 2002). To prevent duplication with other Cochrane Reviews and protocols (e.g. Mehrholz 2017b), we excluded trials testing the effectiveness of treadmill training or other approaches such as repetitive task training in physiotherapy or electrical stimulation alone (French 2016; Pollock 2014).
Types of outcome measures
We used the following outcome measures.
Primary outcomes
Regaining the ability to walk is a very important goal for people after stroke (Bohannon 1988; Hornby 2020; Mehrholz 2018). We therefore defined the primary outcome as the ability to walk independently. We measured the ability to walk with the Functional Ambulation Category (FAC) (Holden 1984). An FAC score of 4 or 5 indicated independent walking over a 15‐metre surface, irrespective of aids used such as a cane. An FAC score less than 4 indicates dependency in walking (supervision or assistance, or both must be given in performing walking).
If the included studies did not report FAC scores, we used alternative indicators of independent walking, such as:
-
a score of 3 on the ambulation item of the Barthel Index (Wade 1988); or
-
a score of 6 or 7 for the walking item of the Functional Independence Measure (Hamilton 1994); or
-
a 'yes' response to the item 'walking inside, with an aid if necessary (but with no standby help)' or 'yes' to 'walking on uneven ground' in the Rivermead Mobility Index (Collen 1991).
Secondary outcomes
We defined secondary outcomes as measures of activity limitations. We used walking speed (in metres per second; Hornby 2020), walking capacity (metres walked in 6 minutes; Hornby 2020), and the Rivermead Mobility Index score as relevant measures of activity limitations, if stated by the trialists. Additionally, we used death from all causes as a secondary outcome.
Adverse outcomes
We investigated the safety of electromechanical‐assisted gait‐training devices by examining the incidence of adverse outcomes such as thrombosis, major cardiovascular events, injury, pain, and any other reported adverse event. To measure the acceptance of electromechanical‐assisted gait‐training devices in walking therapies, we used visual analogue scales or withdrawal from the study for any reason (loss to study during intervention phase, dropout rates), or both, during the study period, depending on data provided by the study authors.
Depending on the above‐stated categories and the availability of variables used in the included trials, we discussed and reached consensus on which outcome measures should be included in the analysis.
Search methods for identification of studies
See the methods for the Cochrane Stroke Group's Specialized Register. We searched for trials in all languages and arranged for translation of relevant papers where necessary.
Electronic searches
We searched the Cochrane Stroke Group Trials Register (last searched 6 January 2020) and the following electronic bibliographic databases.
-
Cochrane Central Register of Controlled Trials (CENTRAL; 2020 Issue 1), in the Cochrane Library (Appendix 1).
-
MEDLINE in Ovid (1950 to 03 January 2020) (Appendix 2).
-
Embase in Ovid (1980 to 06 January 2020) (Appendix 3).
-
Cumulative Index to Nursing and Allied Health Literature (CINAHL) in EBSCO (1982 to 20 November 2019) (Appendix 4).
-
Allied and Complementary Medicine Database (AMED) in Ovid (1985 to 06 January 2020) (Appendix 5).
-
Web of Science (Science Citation Index Expanded, Social Sciences Citation Index, Arts and Humanities Citation Index) (1899 to 07 January 2020) (Appendix 6).
-
Physiotherapy Evidence Database (PEDro) (searched 07 January 2020) (Appendix 7).
-
COMPENDEX (1972 to 06 January 2020) (Appendix 8).
-
SPORTDiscus EBSCO (1949 to 06 January 2020) (Appendix 9).
-
Inspec (1969 to 06 January 2020) (Appendix 8).
We developed the search strategies with the help of the Cochrane Stroke Group Information Specialist and adapted the MEDLINE search strategy for use with the other databases.
We identified and searched the following ongoing trials and research registers.
-
World Health Organization International Clinical Trials Registry Platform (WHO ICTRP), at apps.who.int/trialsearch/ (searched 07 January 2020) (Appendix 10).
-
ClinicalTrials.gov, at www.clinicaltrials.gov (searched 07 January 2020) (Appendix 11).
Searching other resources
We also:
-
handsearched the following relevant conference proceedings.
-
World Congress of NeuroRehabilitation (2002 to 2018);
-
World Congress of Physical Medicine and Rehabilitation (2001 to 2019);
-
World Congress of Physical Therapy (2003, 2007, 2011, 2015, and 2019);
-
Deutsche Gesellschaft für Neurotraumatologie und Klinische Neurorehabilitation (2001 to 2019);
-
Deutsche Gesellschaft für Neurologie (2000 to 2019);
-
Deutsche Gesellschaft für Neurorehabilitation (1999 to 2019); and
-
Asia‐Oceanian Conference of Physical & Rehabilitation Medicine (2008 to 2018).
-
-
screened reference lists of all relevant articles; and
-
contacted trialists, experts, and researchers in our field of study.
Data collection and analysis
Selection of studies
Two review authors (JM, BE) independently read the titles and abstracts of identified references and eliminated obviously irrelevant studies. We obtained the full text for the remaining studies. Based on our inclusion criteria (types of studies, types of participants, aims of interventions, outcome measures), the same two review authors independently ranked these studies as relevant, irrelevant, or possibly relevant. We excluded all trials ranked initially as irrelevant but included all other trials at this stage. We excluded all trials of specific treatment components, such as electrical stimulation as stand‐alone treatment, treadmill training, and continuous passive motion treatment, because these have been the subject of other Cochrane Reviews (e.g. Mehrholz 2017b). We resolved any disagreements through discussion between all four review authors. If we required further information to reach consensus, we contacted trialists in an attempt to obtain the missing information. We recorded the selection process in sufficient detail to complete a PRISMA flow diagram, and we listed in the Characteristics of excluded studies table all studies that did not match our inclusion criteria regarding types of studies, types of participants, and aims of interventions.
Data extraction and management
Two review authors (JM, BE) independently extracted trial and outcome data from the selected trials. We established the characteristics of unpublished trials through correspondence with the trial co‐ordinator or principal investigator. If any review author was involved in any of the selected studies, another review author not involved in the study extracted the study information. If there was any doubt as to whether a study should be excluded, we retrieved the full text of the article. In cases of disagreement between the two review authors, a third review author (JK) reviewed the information to decide on inclusion or exclusion of a study. We used checklists to independently record the following details.
-
Methods of generating the randomisation schedule.
-
Method of concealment of allocation.
-
Blinding of assessors.
-
Use of an intention‐to‐treat analysis (all participants initially randomly assigned were included in analyses as allocated to groups).
-
Adverse events and dropouts for all reasons.
-
Important imbalance in prognostic factors.
-
Participants (country, number of participants, age, gender, type of stroke, time from stroke onset to entry to the study, inclusion and exclusion criteria).
-
Comparison (details of the intervention in treatment and control groups, details of co‐intervention(s) in both groups, duration of treatment, stroke severity, electromechanical device used, duration of study intervention, aetiology (ischaemic/haemorrhage, intensity of treatment per day, description of the control intervention, dropouts).
-
Outcomes and time points of measures (number of participants in each group and outcome, regardless of compliance).
The two review authors checked all of the extracted data for agreement, with a third review author (JK) arbitrating any items for which consensus could not be reached. If necessary, we contacted trialists to request more information, clarification, and missing data.
Assessment of risk of bias in included studies
Two review authors (JM, MP) independently evaluated the methodological quality of the included trials using the Cochrane 'Risk of bias' tool, as described in Chapter 8 of the Cochrane Handbook for Systematic Reviews of Interventions (Higgins 2011).
We checked all methodological quality assessments for agreement between review authors. We resolved disagreements by discussion. If one of the review authors was a co‐author of an included trial, another review author (BE or JK) conducted the methodological quality assessment for this trial in this case.
Measures of treatment effect
We used a random‐effects model for all statistical analyses. For dichotomous variables, we calculated and reported for the primary outcome Peto odds ratios (ORs), and for secondary outcomes, risk differences (RDs), with 95% confidence intervals (CIs). For continuous data, we calculated the treatment effect using standardised mean differences (SMDs) and 95% CIs when studies used different scales for assessment of the same outcome, and using mean differences (MDs) and 95% CIs when all studies used the same method of measuring an outcome. We used Cochrane Review Manager 5 and RevMan Web software for all statistical comparisons (RevMan 2014).
Based on the event rate and on control and event rates, we calculated the number needed to treat for an additional beneficial outcome (NNTB) with 95% CI for the primary outcome of independently walking at the end of the intervention phase (Sackett 1996).
Unit of analysis issues
We anticipated that a majority of trials would have a parallel‐group design. When studies had two or more active intervention groups eligible for inclusion within the same comparison (against a control, placebo, or no treatment group), we intended to 'share' control group data between the multiple pair‐wise comparisons to avoid double counting of participants within an analysis. If studies used a randomised controlled cross‐over design, we planned to analyse data from the first phase only (up to the point of cross‐over). We did not anticipate that any studies would use a cluster‐randomised design.
Dealing with missing data
In the case of missing outcome data, we attempted to analyse data according to the intention‐to‐treat approach. We contacted the trial co‐ordinator or principal investigator if data were missing.
Assessment of heterogeneity
We used the I² statistic to assess heterogeneity. We considered I² > 50% as showing substantial heterogeneity. If I² > 50%, we explored individual trial characteristics to identify potential sources of heterogeneity. We used a random‐effects model, regardless of the level of heterogeneity.
Assessment of reporting biases
We inspected funnel plots to assess the risk of publication bias.
Data synthesis
We pooled the results of all eligible studies to present an overall estimate of the effect of electromechanical‐assisted gait training (meta‐analysis). Clinical diversity and heterogeneity did not contribute to the decision about when to pool trials, but we described clinical diversity and variability in participants, interventions, and outcomes studied in Table 1 and Table 2. If studies had three or more intervention groups, for example, two treatment groups and one control group, and the results of these intervention groups did not differ, we combined the results of all intervention groups into one collapsed group and compared this information with results of the control group.
| Study ID | Experimental: mean age (SD) | Control: mean age (SD) | Experimental: mean time post stroke | Control: mean time post stroke | Experimental: sex | Control: sex | Experimental: side paresis | Control: side paresis |
|---|---|---|---|---|---|---|---|---|
| 57 years | 65 years | ≤ 3 months | ≤ 3 months | 2 women | 4 women | Not stated | Not stated | |
| 58 (20) years | 69 (11) years | > 6 months | > 6 months | 4 men, 2 women | 5 men, 3 women | 0 right, 6 left | 5 right, 3 left | |
| 61 (12) years | 56 (9) years | 86 days | 44 days | 9 men, 3 women | 10 men, 4 women | 3 right, 9 left | 9 right, 5 left | |
| 54 years | 54 years | 12 months | 13 months | 5 men, 4 women | 4 men, 5 women | 4 right, 5 left | 4 right, 5 left | |
| 44 (12) years | 56 (11) years | 5 years | 11 years | 6 men, 2 women | 5 men, 2 women | 2 right, 2 left, 3 both | 2 right, 2 left, 4 both | |
| 72 (9) years | 71 (10) years | 7.5 weeks | 8 weeks | 10 men, 5 women | 7 men, 8 women | 11 right, 4 left | 12 right, 3 left | |
| 61 years | 59 years | 56 (median) days | 21 (median) days | 5 men, 2 women | 4 men, 2 women | 5 right, 2 left | 1 right, 5 left | |
| 60 years | 62 years | 7 years | 5 years | 17 men, 8 women | 16 men, 9 women | 13 right, 12 left | 12 right, 13 left | |
| 69 (4) years | 67 (6) years | 10 months | 11 months | 12 men, 8 women | 11 men, 9 women | 12 right, 8 left | 11 right, 9 left | |
| 56 (12) years | 60 (12) years | 16 (5) days | 18 (5) days | 13 men, 7 women | 10 men, 7 women | 6 right, 14 left | 6 right, 11 left | |
| 55 (12) years | 55 (15) years | 15 months | 13 months | Not stated | Not stated | 6 right, 4 left, 4 both | 3 right, 1 left, 3 both | |
| 62 (10) years | 61 (11) years | 27 (11) days | 30 (14) days | 35 men, 18 women | 40 men, 13 women | 24 right, 29 left | 21 right, 32 left | |
| 70 (7) years | 68 (11) years | 47 (64) months | 48 (30) months | 16 men, 4 women | 14 men, 6 women | Not stated | Not stated | |
| 50 (11) years | 48 (10) years | 39 months | 25 months | 16 men, 13 women | 3 men, 11 women | 11 right, 18 left | 6 right, 8 left | |
| Not stated | Not stated | < 12 months | < 12 months | Not stated | Not stated | Not stated | Not stated | |
| 63 years | 60 years | 12 days | 11 days | Not stated | Not stated | 9 right, 9 left | 7 right, 9 left | |
| 63 (11) years | 64 (10) years | 54 (36) months | 53 (41) months | 10 men, 6 women | 13 men, 3 women | 10 right, 6 left | 12 right, 4 left | |
| 63 (7) years | 61 (6) years | 26 (6) months | 27 (6) months | 14 men, 6 women | 9 men, 1 woman | Not stated | Not stated | |
| 68 (15) years | 63 (11) years | 22 (8) days | 18 (10) days | Not stated | Not stated | 20 right, 10 left | 14 right, 12 left | |
| 60 (11) years | 55 (9) years | 111 (63) days | 139 (61) days | 21 men, 12 women | 18 men, 12 women | 22 right, 11 left | 13 right, 17 left | |
| 57 (10) years | 57 (11) years | 50 (51) months | 73 (87) months | 15 men, 9 women | 15 men, 9 women | 16 right, 8 left | 16 right, 8 left | |
| 60 (13) years | 57 (11) years | 79 (56) days | 89 (61) days | 11 men, 5 women | 10 men, 4 women | 12 right, 4 left | 11 right, 3 left | |
| 59 (9) years | 61 (12) years | 7 (6) years | 5 (3) years | 17 men, 8 women | 16 men, 9 women | 13 right, 12 left | 12 right, 13 left | |
| 55 (13) years | 63 (10) years | 29 (20) months | 34 (38) months | 20 men, 12 women | 21 men, 11 women | 31 right, 1 left | 29 right, 3 left | |
| 67 (9) years | 64 (11) years | 4 years | 1 year | 64% men | 67% men | Not described | Not described | |
| 54 (13) years | 50 (16) years | 80 (60) days | 120 (84) days | 9 men, 4 women | 10 men, 3 women | 8 right, 5 left | 10 right, 3 left | |
| 48 (6) years | 46 (14) years | 21 (33) months | 10 (8) months | 9 men, 1 woman | 7 men, 2 women | Not stated | Not stated | |
| 57 (12) years | 60 (13) years | 2 (2) months | 2 (3) months | 20 men, 5 women | 13 men, 10 women | 14 right, 11 left | 14 left, 9 right | |
| 48 (8) years | 55 (16) years | 22 (23) months | 29 (12) months | 9 men, 8 women | 4 men, 4 women | 9 right, 8 left | 4 right, 4 left | |
| Not stated | Not stated | Stroke at least for 3 months | Stroke at least for 3 months | Not stated | Not stated | Not stated | Not stated | |
| 61 (7) years | 62 (6) years | 1486 (264) days | 1536 (312) days | 7 men, 7 women | 7 men, 5 women | 5 right, 9 left | 7 right, 5 left | |
| 50 (13) years | 58 (13) years | 59 months | 28.5 months | 23 men, 7 women | 21 men, 9 women | 13 right, 17 left | 15 right, 15 left | |
| Not stated | Not stated | Between 10 days and 6 months | Between 10 days and 6 months | Not stated | Not stated | Not stated | Not stated | |
| 68 (12) years | 68 (12) years | 5 (1 to 8) weeks | 4 (2) weeks | 22 men, 15 women | 19 men, 18 women | 20 right, 17 left | 16 right, 21 left | |
| 62 (11) years | 62 (14) years | 19 (11) days | 20 (14) days | 15 men, 9 women | 13 men, 11 women | 13 right, 11 left | 15 right, 9 left | |
| 48 (15) years | 68 (17) years | 530.11 (389) days | 284.81 (309) days | 11 men, 7 women | 6 men, 10 women | Not stated | Not stated | |
| 60 (11) years | 57 (9) years | 546 (296) days | 600 (506) days | 8 men, 10 women | 14 men, 6 women | Not stated | Not stated | |
| 67 (9) years | 64 (11) years | 1354 days | 525 days | 7 men, 4 women | 6 men, 4 women | Not stated | Not stated | |
| 62 (8) years | 66 (12) years | 23 (7) days | 26 (8) days | 11 men, 2 women | 9 men, 4 women | 6 right, 7 left | 5 right, 8 left | |
| 56 (7) years | 57 (9) years | 7 months | 8 months | 16 men, 8 women | 9 men, 7 women | 14 right, 10 left | 8 right, 8 left | |
| 52 (8) years | 52 (7) years | 2 (2) years | 4 (5) years | 26 men, 4 women | 11 men, 4 women | 13 right, 17 left | 10 right, 5 left | |
| 67 (9) years | 68 (10) years | 8 (3) days | 8 (3) days | 11 men, 11 women | 18 men, 16 women | 11 right, 11 left | 14 right, 20 left | |
| 62 (10) years | 65 (3) years | 6 (4) years | 6 (4) years | 7 men, 4 women | 9 men, 2 women | Not stated | Not stated | |
| 62 (12) years | 64 (11) years | 4 (2) weeks | 5 (2) weeks | 50 men, 27 women | 54 men, 24 women | 36 right, 41 left | 33 right, 45 left | |
| 62 (13) years | 60 (19) years | 3 (4) months | 2 (1) months | 4 men, 4 women | 2 men, 6 women | Not stated | Not stated | |
| 62 (9) years | 65 (8) years | 22 (9) days | 24 (10) days | 21 men, 16 women | 20 men, 10 women | 17 right, 20 left | 8 right, 22 left | |
| 63 years | 66 years | 62 months | 102 months | 3 men, 6 women | 2 men, 7 women | 4 right, 5 left | 4 right, 5 left | |
| 58 (11) years | 57 (15) years | 49 (39) months | 89 (153) months | Not stated | Not stated | Not stated | Not stated | |
| 68 (12) years | 63 (16) years | 15 (9) days | 26 (22) days | 8 men, 8 women | 14 men, 6 women | 7 right, 9 left | 11 right, 9 left | |
| 63 (10) years | 60 (9) years | 55 (37) months | 65 (67) months | 10 men, 2 women | 9 right, 3 left | |||
| 64 (12) years | 62 (9) years | 103 (28) days | 92 (38) days | 13 men, 18 women | 14 men, 6 women | 8 right, 13 left | 10 right, 10 left | |
| 71 (5) years | 73 (7) years | 60 (49) days | 39 (31) days | 7 men, 6 women | 10 men, 5 women | Not stated | Not stated | |
| 55 (9) years | 61 (12) | 25 (6) days | 31 (10) days | 11 men, 2 women | 5 men, 8 women | 6 right, 7 left | 5 right, 7 left | |
| 71 (14) years | 64 (10) years | 2 (1) weeks | 2 (1) weeks | 19 men, 11 women | 12 men, 8 women | 13 right, 17 left | 7 right, 13 left | |
| 56 years | 62 years | Not stated | Not stated | Not stated | Not stated | Not stated | Not stated | |
| 53 (10) years | 2 (1) months | 16 men, 14 women | Not stated | Not stated | ||||
| 51 (8) years | 53 (7) years | 41 (20) months | 30 (22) months | Not stated | Not stated | Not stated | Not stated | |
| 67 (17) years | 76 (14) years | 59 (47) days | 51 (34) days | 7 men, 4 women | 4 men, 7 women | 6 right, 5 left | 5 right, 6 left | |
| 60 (9) years | 60 (9) years | 7 (2) weeks | 6 (2) weeks | 8 men, 7 women | 5 men, 10 women | 8 right, 7 left | 8 right, 7 left | |
| 59 (17) years | 55 (14) years | 44 (27) months | 37 (20) months | 6 men, 2 women | 7 men, 1 woman | 4 right, 4 left | 3 right, 5 left | |
| 54 (13) years | 61 (10) years | 4 (3) years | 6 (4) years | 6 men, 3 women | 7 men, 3 women | 4 right, 5 left | 5 right, 5 left | |
| 63 (6) years | 64 (3) years | 31 (3) years | 28 (8) years | 10 men, 8 women | 9 men, 9 women | 3 right, 15 left | 4 right, 14 left | |
SD: standard deviation.
| Criteria | Stroke severity | Electromechanical device used | Duration of study intervention | Aetiology (ischaemic/haemorrhagic) | Intensity of treatment per day | Description of control intervention | Dropouts | Reasons for dropout and adverse events in experimental group | Reasons for dropout and adverse events in control group | Source of information |
| Not stated | G‐EO system | 45 days, 20 sessions | Not stated | 45 minutes, 3 times a week | Traditional gait rehabilitation, 1 hour, 3 times a week | 0 of 14 | None | None | Published information | |
| Not stated | G‐EO system | 20 sessions | 8/4 | 45 minutes, 3 times a week | Traditional gait rehabilitation, 3 times a week, 20 sessions | 0 of 26 | None | None | Published information | |
| Not stated | Lokomat | 3 weeks | Not stated | 30 minutes, 5 times a week | Task‐oriented physiotherapy, 5 times a week for 3 weeks (2.5 hours a week) | 4 of 23 | Not stated | Not stated | Unpublished information in the form of a conference presentation | |
| Unclear | Lokomat | 4 weeks | 13/5 | 60 minutes, 5 times a week (20 sessions) | Treadmill training without body weight support | 0 of 18 | None | None | Published information | |
| SARA, | Lokomat | 5 months | 4/11 | 60 minutes, 3 times a week | Therapist‐assisted gait training, once a week, 60 minutes, for 5 months | 4 of 19 | Participants not complying with protocol treatment criteria in intervention group | Not stated | Published information | |
| Not stated | Lokomat | 2 weeks | 8/7 | 60 minutes, 8 to 10 sessions in 2 weeks | Non‐robotic physiotherapy described as training of postural control including sensory feedback components in sitting, sit‐to‐stand, standing, and walking, if possible, 60 minutes or 30 minutes with 2 therapists, 8 to 10 sessions in 2 weeks | 12 of 38 | No pusher behaviour at start of treatment (n = 3), | No pusher behaviour at start of treatment | Published information | |
| Not stated | Ekso | 8 weeks | Not stated | 45 minutes, 5 days a week | Conventional over‐ground gait training | 0 of 40 | None | None | Published information | |
| Mean FIM, | Lokomat | 3 weeks | Not stated | Not stated | Physiotherapy | 0 of 13 | None | None | Unpublished and published information provided by study authors | |
| Unclear | Wearable exoskeleton Stride Management Assist system (SMA) | 6 to 8 weeks | Unclear | 3 times per week for maximum of 18 sessions | Functional task‐specific training (intensive over‐ground training and mobility training) | 0 of 50 | None | None | Published information | |
| Not stated | Lokomat | 10 days | Not stated | 30 minutes daily for 10 days | Conventional gait training by physical therapists (with equal therapy time and same number of sessions as experimental group) | 3 of 40 | Not described by group | Unpublished and published information provided by study authors | ||
| Mean modified Barthel Index, 36 points | Lokomat | 8 weeks (2 phases, cross‐over after 4 weeks) | 4/14 (2 both) | 30 minutes, 3 times a week for 4 weeks | Bobath (neurophysiological exercises, inhibition of spasticity and synergy pattern) | 0 of 20 | None | None | Published information | |
| Mean Barthel Index, 49 points | Gait Trainer | 8 weeks | Not stated | Not stated | Physiotherapy including 25 minutes of stance/gait, 10 minutes cycling, 10 minutes tilt table standing | 20 of 106 | 2 deaths, 3 refusals, 1 medical problem, 1 transport problem | 1 death, 6 refusals, 3 medical problems, 1 administrative problem, 2 inability to contact | Published information | |
| Mean Barthel Index, 75 points | Gait Trainer | 4 weeks | Not stated | 40 minutes, 5 times a week | Bobath method, 5 times a week for 5 weeks | 0 of 40 | None | None | Unpublished and published information provided by study authors | |
| Not stated | RoboGait | 3 weeks | 28/15 | 90 minutes, 5 days/week | Physical therapy including stretching, strengthening exercises, proprioception, weight bearing, balance, co‐ordination, and ambulatory training 90 minutes, 5 days/week | 5 of 48 | Not stated | Not stated | Published information | |
| Not stated | AutoAmbulator | 24 sessions | Not stated | Minimum 3 sessions a week up to 5 sessions; number of minutes in each session unclear | Standard physical therapy, 3 to 5 times a week for 24 consecutive sessions | 0 of 20 | 14 adverse events No details provided | 11 adverse events No details provided | Unpublished and published information provided by study authors | |
| Mean FIM | Anklebot | 8 to 10 sessions (with ca. 200 repetitions) | Not stated | 60 minutes, 8 to 10 sessions | Stretching of the paretic ankle | 5 of 34 | Total of 5 dropouts across both groups (1 medical complication, 1 discharge before study end, 2 times post stroke > 49 days, 1 non‐compliance) | Published information provided by study authors | ||
| Mean European Stroke Scale, 72 points; Barthel Index 90 points | G‐EO system | 5 weeks, 10 individual rehabilitation sessions | 13/3 | 45 minutes/2 days per week | Sensory Integration Balance Training including over‐ground gait training, stairs up and down, passive lower limb joint mobilisation and stretching exercises same duration as experimental group | 4 of 32 | Not stated for both groups | Published information | ||
| Mean European Stroke Scale, 80 points | Gait Trainer | 2 weeks | Not stated | 50 minutes, 5 times a week | Walking exercises according to the Bobath approach | 0 of 30 | None | None | Unpublished and published information provided by study authors | |
| Not stated | Lokomat | 4 weeks | 33/23 | 30 minutes, 5 times a week | Neurodevelopmental techniques for balance and mobility | 4 of 60 | None | 4 unclear reasons | Published information provided by study authors | |
| Not stated | Lokomat | 8 to 10 weeks (24 sessions) | 47/16 | 45 minutes, 3 days a week | Conventional gait training, 3 times a week for 8 to 10 weeks (24 sessions), each session lasted 1.5 hours | 9 of 72 | Not described by group | Unpublished and published information provided by study authors | ||
| Not stated | Lokomat | 12 sessions | 22/26 | 30 minutes, | Therapist‐assisted gait training, 12 sessions, each session lasted 30 minutes | 14 of 62 | 4 participants dropped out (2 discontinued secondary to leg pain during training, 1 experienced pitting oedema, and 1 had travel limitations) | 10 participants dropped out | Published information provided by study authors | |
| Median Barthel Index, 35 points | Lokomat | 4 weeks | 22/8 | 30 minutes, 5 times a week | Conventional physiotherapy, 30 minutes per day for 4 weeks. Information as provided by study authors | 2 of 32 | 1 participant enteritis | 1 participant pulmonary embolism | Published information | |
| Not stated | Honda Stride Management Assist | 6 to 8 weeks | 33/17 | 45 minutes per session, 3 times per week | Over‐ground gait training, functional task‐specific training | 4 of 54 | 2 transportation problems
| 2 transportation problems
| Information as provided by study authors | |
| Not stated | Robot‐assisted device | 5 weeks | Not stated | 40 minutes, | Conventional gait training 40 minutes, 3 days per week | 2 of 66 | 1 early discharge | 1 early discharge | Information as provided by study authors | |
| Not stated | Lokomat | 8 weeks | Not stated | 60 minutes, 5 times a week | Over‐ground gait training by physiotherapy on level and uneven surfaces | 1 of 21 | None | 1 withdrew | Information as provided by study authors | |
| Mean Barthel Index, 20 points | Walkbot | 4 weeks | 13/13 | 30 minutes, 5 times a week | Conventional physiotherapy (bed mobility, stretching, balance training, strengthening, symmetry training, treadmill training) | 4 of 30 | 1 rib fracture, 3 decline in health condition | Information as provided by study authors | ||
| Not stated | Lokomat | 4 weeks | Not stated | 60 minutes, | Conventional physical therapy (CPT) | 2 of 19 | 1 withdrew | 1 withdrew | Published information | |
| Mean Barthel Index, 55 points | Morning Walk | 3 weeks | 16/32 | 1.5 hours per session, 5 times per week | Conventional physiotherapy | 10 of 58 | 1 medical complication 1 unstable mood 1 isolation | 7 early discharge | Published information | |
| Not stated | Exowalk | 4 weeks | Not stated | 30 minutes a day, 5 days a week | Physical therapist‐assisted gait training | 0 of 41 | None | None | Published information | |
| Not stated | Lokomat | 4 weeks | 18/7 | 45 minutes, 3 days a week | Conventional physiotherapy, received equal time and sessions of conventional gait training | 10 of 35 | 1 participant dropped out for private reasons (travelling); adverse events not described | 9 participants refused after randomisation (reasons not provided); adverse events not described | Unpublished and published information provided by study authors | |
| Not stated | Gait Enhancing and Motivating System | 4 weeks | 18/8 | 45 minutes, 3 times per week, 10 sessions | Gait training without Gait Enhancing and Motivating System | 2 of 28 | None | 2 withdrew | Published information | |
| Not stated | Lokomat | 8 weeks | Not stated | Not stated | Add‐on conventional physiotherapy, received equal time and sessions of conventional gait training | 13 of 74 | 4 participants dropped out (reasons not provided); adverse events not described | 9 participants dropped out (reasons not provided) | Unpublished and published information provided by study authors | |
| Not stated | Lokomat | 8 weeks | Not stated | 2 hours, 5 times a week | Conventional over‐ground physical therapy | 8 of 74 | 7 change in clinical condition | 5 change in clinical condition, 2 lack of compliance | Published information | |
| Canadian Neurological Scale, 6 points | Gait Trainer | 4 weeks | 41/7 | 40 minutes, 5 times a week | Focused on trunk stabilisation, weight transfer to paretic leg, and walking between parallel | 21 of 48 | 12 (hypotension, referred weakness, knee pain, urinary infection, uncontrolled blood pressure, fever, absence of physiotherapist) | 9 (hypotension, referred weakness, knee pain, ankle pain, uncontrolled blood pressure, fever, absence of physiotherapist) | Information as provided by study authors | |
| Mean Barthel Index, 16 points | Exowalk | 4 weeks | 20/14 | 30 minutes, 5 days a week | Physical therapist‐assisted gait training by conventional method | 6 of 40 | 6 did not complete gait training | Published information | ||
| Not stated | Exowalk | 2 weeks | 25/13 | 60 minutes, 5 days a week | Physical therapist‐assisted gait training | 2 of 40 | 2 personal reasons | None | Published information | |
| Not stated | Lokomat | Unclear | Not stated | Not stated | Not stated | 1 of 21 | No dropouts; 2 serious adverse events (1 skin breakdown as a result of therapy, 1 second stroke during post‐treatment phase) | 1 dropout due to protocol violation; | Information as provided by study authors | |
| Not stated | Gait‐assistance robot (consisting of 4 robotic arms for thighs and legs, thigh cuffs, leg apparatuses, and a treadmill) | 4 weeks | 10/16 | 20 minutes, 5 times a week for 4 weeks, in addition to rehabilitation treatment | Range‐of‐motion exercises, muscle strengthening, rolling over and sit‐to‐stand and activity and gait exercises | 0 of 26 | None | None | Published information | |
| Mean modified Barthel Index, 55 points | Lokomat Pro | 6 weeks | 20/20 | 45 minutes, 3 times a week | General gait training using a treadmill | 0 of 40 | None | None | Published information | |
| Scandinavian Stroke Scale, 42 points | Gait Trainer | 3 weeks | 25/20 | 20 minutes, 5 times a week for 3 weeks, in addition to rehabilitation treatment | Walking over‐ground; all participants practised gait for 15 sessions over 3 weeks (each session lasted 20 minutes) | 0 of 45 | None | None | Published information | |
| Not stated | Gait Trainer | 3 weeks | 42/14 | 20 minutes, 5 times a week for 3 weeks, in addition to rehabilitation treatment | Over‐ground walking training; in the other control group, 1 or 2 physiotherapy sessions daily but not at the same intensity as in the other groups
| 9 of 56 | 5 dropouts | 4 dropouts | Published information | |
| Not stated | G‐EO system evolution | 30 minutes a day for 5 consecutive days | Not stated | 5 days in addition to botulinum toxin injection of calf muscles | None | 0 of 22 | None | None | Published information | |
| Mean Barthel Index, 37 points | Gait Trainer | 4 weeks | 124/31 | 20 minutes, 5 times a week | Physiotherapy every weekday for 4 weeks | 11 of 155 | 2 participants refused therapy, 1 increased cranial pressure, 1 relapsing pancreas tumour, 1 cardiovascular unstable | 4 participants refused therapy, 1 participant died,1 myocardial infarction | Published information | |
| Not stated | Lokomat | 2 weeks | 13/3 | A‐B‐A study: in phase A, 30 minutes, 5 days a week | Physiotherapy every weekday for 3 weeks (phase B) | 0 of 16 | None | None | Unpublished and published information provided by study authors. | |
| Mean NIHSS, 11 points | Lokomat | 6 weeks | 49/67 | 30 minutes, 3 times a week | Physiotherapy with additional gait training 3 times a week for 6 weeks | 6 of 46 | 2 participants with leg wounds, 1 with recurrent stroke, 1 refused therapy | 1 participant with recurrent stroke, 1 with pulmonary embolism | Unpublished and published information provided by study authors. | |
| Mean Barthel Index, 91 points | Hybrid assistive limb | 6 weeks | 14/4 | 30 minutes, 5 times a week, 30 sessions | Conventional physiotherapy | 0 of 18 | None | None | Published Information | |
| Not stated | Bionic leg device | 6 weeks | Not stated | 1 hour, 3 times a week for 6 weeks | Group exercises | 0 of 24 | None | None | Published information | |
| Mean FIM, 51 points | Robowalk | 3 months | 29/7 | 30 minutes, 5 days a week | Conventional physiotherapy | 4/40 | None | 2 medically unstable 2 withdrew | Published information | |
| Mean FIM, 79 points | Gait Master4 | 4 weeks | Not stated | 20 minutes, 2 or 3 times a week (12 sessions) | Non‐intervention (non‐training) | 0 of 12 | None | None | Published information | |
| Not stated | Stride Management Assist | 10 consecutive days | 29/12 | 1 to 2 hours with 10 minutes or longer including RAGT | Conventional gait training | 5/41 | 1 participant had trouble with leg brace; | 2 participants for personal reasons | Published information | |
| Mean NIHSS 7 points | Lokomat | 5 weeks | Not stated | 30 minutes, 5 sessions a week | Conventional gait training | 0 of 28 | None | None | Published information | |
| Not stated | GEAR system | 4 weeks | 6/20 | 40 minutes, 7 times a week | Conventional gait training | None | None | None | Published information | |
| Mean Barthel Index, 51 points | Gait Trainer | 4 weeks | 39/11 | 20 minutes, 5 times a week | Conventional physiotherapy alone, based on Bobath concept | 4 of 50 | None | 2 participants discharged before study end, 1 participant readmitted to an acute ward, 1 participant deteriorating condition | Published information | |
| Not stated | Lokomat | 2 weeks | Not stated | 30 minutes, 5 times a week | Conventional physiotherapy at home (focused on gait) | 0 of 22 | None | None | Published information | |
| Not stated | Lokomat | 8 weeks | Not stated | 30 minutes, twice a week | Over‐ground walking therapy | 0 of 30 | None | None | Unpublished and published information provided by study authors | |
| Not stated | Portable rehab robot (ankle device) | 6 weeks | Not stated | 3 times a week, 18 sessions | Stretching plantar flexors and active exercises for ankle mobility and strength | 0 of 24 | None | None | Published information | |
| Not stated | Single‐leg version of Hybrid Assistive Limb (HAL) | 4 weeks | 11/11 | 20 minutes, | Aimed to improve walking speed, endurance, balance, postural stability, and symmetry | 10 of 32 | 4 withdrew, 1 epilepsy, 1 technical reasons | 2 pneumonia, 2 discharged | Published information | |
| Not stated | Robot Suit Hybrid Assistive Limb (HAL) | 4 weeks | 7/5 only intervention group, control group not stated | 3 times a week, minutes not stated | Conventional gait training | 10 of 33 | 4 withdrew 1 medical problem 1 technical reasons | 2 medical reasons 2 early discharged | Published information | |
| Mean Barthel Index, 38 points | Gait Trainer | 2 weeks | 13/12 | 20 minutes, 5 times a week | Gait therapy including treadmill training with body weight support | 0 of 30 | None | None | Published information | |
| Not stated | Lokomat | 4 weeks (12 sessions) | 8/8 | 30 minutes, 3 times a week | 12 physiotherapy sessions including manually guided gait training (3 times a week over 4 weeks) | 0 of 16 | None | None | Published information | |
| Not stated | Exoskeleton ankle robot | 5 weeks | 14/5 | 30 minutes, | Gait training with passive ankle foot orthosis | 0 of 19 | None | None | Published information | |
| Mean NIHSS, 12 points | Lokomat | 3 weeks | 11/25 | 30 minutes per day, 5 days a week | Conventional physical therapy based on neurodevelopmental techniques developed by Bobath and the physiotherapy proposed by Karnath | 2 of 19 | 1 recurrent stroke | 1 pneumonia | Published information | |
FIM: Functional Independence Measure.
NIHSS: National Institutes of Health Stroke Scale.
SARA: Scale for Assessment and Rating of Ataxia.
Subgroup analysis and investigation of heterogeneity
As planned in our protocol (Mehrholz 2006), we performed for our primary outcome a formal subgroup analysis following the guidance in the Cochrane Handbook for Systematic Reviews of Interventions (Deeks 2019), comparing participants treated in the acute and subacute phases of their stroke (within three months) with participants treated in the chronic phase (longer than three months).
Sensitivity analysis
As planned in our protocol, we performed a sensitivity analysis of methodological quality for each included study.
We carried out the following sensitivity analyses by including only those studies:
-
with an adequate sequence generation process;
-
with adequate concealed allocation;
-
with blinded assessors for the primary outcome; and
-
without incomplete outcome data.
We considered it necessary to do a further sensitivity analysis by removing the largest study, Pohl 2007, because some of the review authors (JM and MP) were investigators in this large trial. We carried out this sensitivity analysis by including all studies without the largest study (Pohl 2007).
We performed two further (post hoc) sensitivity analyses.
-
Ambulatory status at start of study (including only studies that included an independent walker; including only studies that included dependent and independent walkers; and including only studies that included a dependent walker).
-
Types of devices used in trials (including only studies that used end‐effector devices and including only studies that used exoskeleton devices).
Summary of findings and assessment of the certainty of evidence
We created one 'Summary of findings' table using the following outcomes.
-
Primary outcome measure: independent walking:
-
at the end of the intervention phase, all electromechanical devices used (scale from 0 to infinity); and
-
at follow‐up after study end (scale from 0 to infinity).
-
-
Secondary outcome measure: mean walking velocity (metres per second):
-
at the end of the intervention phase (scale from 0 to infinity); and
-
at follow‐up (scale from 0 to infinity).
-
-
Secondary outcome measure: mean walking capacity (metres walked in six minutes):
-
at the end of intervention phase (scale from 0 to infinity); and
-
at follow‐up (scale from 0 to infinity).
-
-
Secondary outcome measure: loss to study during intervention phase: number of dropouts.
-
Death from all causes until the end of the intervention phase.
We used the five GRADE considerations (study limitations, consistency of effect, imprecision, indirectness, and publication bias) to assess the quality of a body of evidence as it relates to the studies that contributed data to the meta‐analyses for prespecified outcomes (Atkins 2004). We used methods and recommendations described in Section 8.5 and Chapter 12 of the Cochrane Handbook for Systematic Reviews of Interventions (Schünemann 2019), employing GRADEpro GDT software (GRADEpro GDT). We justified all decisions to downgrade the quality of studies using footnotes, and we made comments to aid the reader's understanding of the review where necessary.
Summary of findings and assessment of the certainty of the evidence
We created one 'Summary of findings' table using the following outcomes.
-
Primary outcome measure: Independent walking
-
at the end of intervention phase, all electromechanical devices used. Scale from 0 to infinity.
-
at follow‐up after study end. Scale from 0 to infinity.
-
-
Secondary outcome measure: Mean walking velocity (metres per second)
-
at the end of intervention phase. Scale from 0 to infinity.
-
at follow‐up. Scale from 0 to infinity.
-
-
Secondary outcome measure: Mean walking capacity (metres walked in 6 minutes)
-
at the end of intervention phase. Scale from 0 to infinity.
-
at follow‐up. Scale from 0 to infinity.
-
-
Secondary outcome measure: Lost to study during intervention phase: number of dropouts.
-
Death from all causes until the end of the intervention phase
We used the five GRADE considerations (study limitations, consistency of effect, imprecision, indirectness, and publication bias) to assess the quality of a body of evidence as it relates to the studies that contribute data to the meta‐analyses for the prespecified outcomes (Atkins 2004). We used methods and recommendations described in Section 8.5 and Chapter 12 of the Cochrane Handbook for Systematic Reviews of Interventions (Schünemann 2019), employing GRADEpro GDT software (GRADEpro GDT). We justified all decisions to downgrade the quality of studies using footnotes, and made comments to aid the reader's understanding of the review where necessary.
Results
Description of studies
See the Characteristics of included studies, Characteristics of excluded studies, and Characteristics of ongoing studies tables.
Results of the search
Figure 1 shows the flow diagram of the selection of studies for this update.

Study flow diagram.
Searches of electronic databases and trials registers generated 8384 new unique references for screening. After excluding non‐relevant citations, we obtained the full text of 110 new papers, and from these, we identified and included 26 new trials in the review.
Included studies
We included 62 trials involving a total of 2440 participants (see the Characteristics of included studies table, Figure 1, Table 1, and Table 2). All included studies investigated the effects of electromechanical‐ or robot‐assisted gait‐training devices in improving walking after stroke.
For one of the included studies published only as an abstract, we obtained at least some results through correspondence with the trial co‐ordinator or principal investigator (Mayr 2008). Another study was not yet published, but the results of this trial were presented orally, and we were able to obtain a handout with information about the study from the principal investigator (Aschbacher 2006).
A detailed description of all participant characteristics can be found in Table 1 and Table 2 (see also Characteristics of included studies). Mean age in the included studies ranged from 47 years in Kim 2019a to 76 years in Watanabe 2014 (Table 1). More men than women were included in the studies (approximately 65% men). More participants with ischaemic stroke than haemorrhagic stroke lesions (approximately 70% ischaemic stroke) were included, and almost as many participants with left‐sided hemiparesis compared with participants with right‐sided hemiparesis (approximately 50% left‐sided) were included in the studies (see Table 1 and Table 2).
Thirty‐nine per cent of studies provided information about baseline stroke severity (Table 2), most of which used the Barthel Index score, ranging from 16 Barthel Index points in Nam 2019 to 91 of 100 Barthel Index points in Sczesny‐Kaiser 2019 (Table 2). Details of all inclusion and exclusion criteria used in the studies can be found in the Characteristics of included studies table.
The duration of study intervention (time frame during which experimental interventions were applied) was heterogeneous, ranging from 10 days in Chang 2012 and Tanaka 2019 to eight weeks in Mayr 2008 and Van Nunen 2012. The study intervention period for most studies was three or four weeks (Table 2). Forty of the 62 studies included participants who could walk independently at the start of the study; a further four studies included participants who were dependent and independent walkers; and 18 studies included only non‐ambulatory participants. The experimental intervention in 25 studies was the robot‐assisted device Lokomat, and the experimental intervention in nine studies was the electromechanical‐assisted device Gait Trainer; a detailed description of devices used in studies can be found in Table 2.
Frequency (in terms of therapy provided per week) of treatment ranged from two or three times a week in Tanaka 2012 to seven times a week in Tomida 2019 (Table 2). Intensity (in terms of duration of experimental therapy provided) of treatment ranged from 20 minutes per day in Werner 2002 to 60 minutes per day in Forrester 2014. In many studies, details of the interventions were unclear or incomplete, for example, details about the intensity of the experimental treatment were unclear in some studies (Table 2). Except for Tanaka 2012 and Picelli 2016, gait training time did not differ between control and experimental groups in the included studies. Fifteen included studies used a follow‐up assessment after the study ended (Buesing 2015; Chua 2016; Dias 2006; Gandolfi 2019; Hidler 2009; Hornby 2008; Jayaraman 2019; Peurala 2005; Peurala 2009; Pohl 2007; Schwartz 2006; Stein 2014; Taveggia 2016; Waldman 2013; Yeung 2018). Most studies investigated improvement in walking function as a primary outcome for analysis and used the Functional Ambulation Category (FAC) or comparable scales to assess independent walking. Furthermore, frequently investigated outcomes included assessment of walking function using gait velocity in metres per second. A more detailed description of the primary and secondary outcomes for each trial can be found in the Characteristics of included studies table.
We found the highest dropout rates for all reasons at the end of the treatment phase to be 23% in Hornby 2008, 29% in Kyung 2008, and 32% in Bergmann 2018. Twenty‐six studies did not report dropouts during the intervention period (Analysis 1.7; Table 2).
Excluded studies
We excluded 239 studies at the full text stage: seven with irrelevant participant characteristics, 36 with irrelevant interventions, 68 with irrelevant study types, and 32 with multiple publications (Figure 1). We have provided in the Characteristics of excluded studies table our reasons for exclusion of 16 studies, among which 14 studies used irrelevant comparisons, one used an irrelevant intervention, and one described duplication of an already included trial.
We identified 81 ongoing studies, and we have provided our reasons for exclusion of studies under Characteristics of ongoing studies. Fifteen studies for which we were unable to make contact with the trialists are still awaiting assessment (see Characteristics of studies awaiting classification).
Risk of bias in included studies
The risk of bias in included studies is described in greater detail in Characteristics of included studies and in Figure 2.

Risk of bias summary: review authors' judgements about each risk of bias item for each included study.
We wrote to the trialists of all included studies and studies awaiting assessment to request clarification of design features or to ask for missing information to complete the quality ratings. We sent the correspondence via email or letter, followed by reminders every month if we received no response. Most trialists provided at least some of the requested data, but we were not able to obtain all of the required data.
Two review authors (JM, MP) used the 'Risk of bias' assessment tool to independently assess the methodological quality of the studies for the domains random sequence generation, allocation concealment, blinding of outcome assessment, and incomplete outcome data for all of the included trials except two (Pohl 2007; Werner 2002), which two other review authors (BE, JK) rated in an interview with the trialists. The review authors discussed all disagreements and sought arbitration by another review author (JK or BE) if necessary.
Allocation
Of the 62 included studies, 36 described low risk of bias for sequence generation (Bang 2016; Bergmann 2018; Brincks 2011; Buesing 2015; Calabrò 2018; Chua 2016; Gandolfi 2019; Geroin 2011; Hidler 2009; Hornby 2008; Husemann 2007; Jayaraman 2019; Kim 2019a; Kim 2019b; Lee 2019; Lu 2017; Mayr 2008; Mayr 2018; Morone 2011; Nam 2019; Peurala 2005; Peurala 2009; Picelli 2016; Pohl 2007; Saltuari 2004; Sczesny‐Kaiser 2019; Stolz 2019; Tanaka 2012; Taveggia 2016; Tomida 2019; Tong 2006; Ucar 2014; Watanabe 2014; Werner 2002; Yeung 2018; Yun 2018); 24 studies had unclear risk of bias for sequence generation (Aprile 2017; Aprile 2019; Aschbacher 2006; Chang 2012; Cho 2015; Dias 2006; Erbil 2018; Fisher 2008; Forrester 2014; Han 2016; Kayabinar 2019; Kelley 2013; Kim 2015; Kwon 2018; Kyung 2008; Nam 2020; Noser 2012; Ochi 2015; Park 2018; Schwartz 2006; Stein 2014; Van Nunen 2012; Waldman 2013; Westlake 2009); and two studies had high risk of bias for sequence generation (Belas dos Santos 2018; Tanaka 2019).
Of the 62 included studies, 32 described low risk of bias for concealment of allocation (Bang 2016; Bergmann 2018; Brincks 2011; Calabrò 2018; Chua 2016; Dias 2006; Gandolfi 2019; Geroin 2011; Hornby 2008; Husemann 2007; Jayaraman 2019; Kim 2019a; Kim 2019b; Lee 2019; Lu 2017; Mayr 2008; Mayr 2018; Morone 2011; Nam 2019; Peurala 2005; Peurala 2009; Picelli 2016; Pohl 2007; Sczesny‐Kaiser 2019; Stolz 2019; Taveggia 2016; Tong 2006; Van Nunen 2012; Werner 2002; Westlake 2009; Yeung 2018; Yun 2018); 24 had unclear risk of bias for sequence generation (Aprile 2017; Aprile 2019; Aschbacher 2006; Chang 2012; Erbil 2018; Fisher 2008; Han 2016; Hidler 2009; Kayabinar 2019; Kelley 2013; Kim 2015; Kwon 2018; Kyung 2008; Nam 2020; Noser 2012; Ochi 2015; Park 2018; Saltuari 2004; Schwartz 2006; Stein 2014; Tanaka 2012; Tomida 2019; Ucar 2014; Watanabe 2014); and five had high risk of bias for sequence generation (Belas dos Santos 2018; Buesing 2015; Cho 2015; Forrester 2014; Tanaka 2019).
Blinding
Of the 62 included studies, 28 studies described low risk of bias for blinding of the primary outcome assessment (Bang 2016; Belas dos Santos 2018; Bergmann 2018; Buesing 2015; Calabrò 2018; Chua 2016; Fisher 2008; Gandolfi 2019; Han 2016; Husemann 2007; Jayaraman 2019; Kelley 2013; Kim 2019a; Lu 2017; Mayr 2008; Mayr 2018; Morone 2011; Noser 2012; Ochi 2015; Picelli 2016; Pohl 2007; Stein 2014; Stolz 2019; Taveggia 2016; Tong 2006; Ucar 2014; Werner 2002; Yeung 2018); no studies described low risk of bias for blinding of participants and personnel.
The risk of bias for each domain allocation ‐ high, low, or unclear risk of bias for each study ‐ is described in detail in Characteristics of included studies and in Figure 2.
Incomplete outcome data
Of the 62 included studies, 26 were at low risk of bias for incomplete outcome data (Aprile 2017; Aprile 2019; Bang 2016; Bergmann 2018; Brincks 2011; Buesing 2015; Calabrò 2018; Chua 2016; Dias 2006; Fisher 2008; Gandolfi 2019; Geroin 2011; Lee 2019; Lu 2017; Morone 2011; Ochi 2015; Park 2018; Picelli 2016; Pohl 2007; Saltuari 2004; Sczesny‐Kaiser 2019; Tanaka 2019; Taveggia 2016; Werner 2002; Westlake 2009; Yeung 2018).
Selective reporting
Two included studies were at low risk of bias for selective outcome reporting (Mayr 2018; Nam 2020); no studies were at high risk.
Other potential sources of bias
None of the 62 included studies were at high risk for other biases, five studies had unclear risk of bias (Aschbacher 2006; Belas dos Santos 2018; Buesing 2015; Gandolfi 2019; Ochi 2015), and the remaining 57 studies had low risk of bias.
Six out of 62 included trials used a cross‐over design with random allocation to the order of treatment sequences (Brincks 2011; Cho 2015; Kim 2019a; Saltuari 2004; Tanaka 2012; Werner 2002). We analysed only the first intervention period as a parallel‐group trial in this review. All other included studies used a parallel‐group design with true randomisation to group allocation.
Four studies used two experimental groups and one control group (Geroin 2011; Park 2018; Peurala 2005; Tong 2006), and one study used one experimental group and two control groups (Peurala 2009). In the former four studies (Geroin 2011; Park 2018; Peurala 2005; Tong 2006), additional functional electrical stimulation of leg muscles (transcranial stimulation of the brain in Geroin 2011, or additional virtual reality in Park 2018) during gait training was applied in one of the treatment groups. Because, for instance, functional electrical stimulation or transcranial stimulation of the brain was done as an adjunct during electromechanical‐assisted gait training, and because the results in these experimental groups did not differ, we combined the results of both experimental groups into one (collapsed) group and compared this information with results from the control group. In one study, an electromechanical‐assisted device was used in the experimental group and was compared with two control groups that did not use a device (Peurala 2009). Because we were interested in the effects of electromechanical‐ and robot‐assisted gait‐training devices for improving walking after stroke, we combined the results of both control groups without devices into one (collapsed control) group and compared this information with results of the one experimental group.
Effects of interventions
1. Electromechanical‐ and robot‐assisted gait training plus physiotherapy versus physiotherapy (or usual care)
Independent walking (primary outcome)
1.1. Independent walking at the end of the intervention phase, with all electromechanical devices used
Thirty‐eight trials with a total of 1572 participants measured our primary outcome independent walking at study end. However, for 20 of those included trials, no effect estimate (odds ratio (OR)) was feasible because no events (e.g. no participant reached the ability to walk) or only events (e.g. all participants regained walking) were reported (Analysis 1.1) (Deeks 2019).
The use of electromechanical devices in gait rehabilitation for people after stroke increased the chance of walking independently (OR 2.01, 95% confidence interval (CI) 1.51 to 2.69; P < 0.00001; level of heterogeneity I² = 0%; high‐quality evidence; summary of findings Table 1). However, only 18 out of 38 studies contributed to this estimate. Some studies investigated at least some participants who were already independent in walking at the start of the study and some studies included only non‐ambulatory participants (Analysis 4.1). Of the total population of 2440 participants, 49% were independent and approximately 46% were dependent walkers (or were non‐ambulatory) at the start of the study.
1.2. Independent walking at follow‐up after study end
Six trials with a total of 496 participants measured our primary outcome independent walking at follow‐up after study end (Chua 2016; Hidler 2009; Hornby 2008; Peurala 2009; Pohl 2007; Tong 2006). However, for two of those included trials (with 125 participants), no effect estimate (OR) was feasible because no events (e.g. no participant reached ability to walk) or only events (e.g. all participants regained walking) were reported (Analysis 1.2). The use of electromechanical devices for gait rehabilitation of people after stroke did not increase the chance of walking independently at follow‐up after study end (OR 1.93, 95% CI 0.72 to 5.13; P = 0.19; level of heterogeneity I² = 79%; low‐quality evidence). However, some included trials investigated participants who were already independent in walking at the start of the study. We could draw no definitive conclusion regarding a longer‐lasting effect of the use of electromechanical devices.
Mean walking velocity (secondary outcome)
1.3. Walking velocity (metres per second) at the end of the intervention phase
Forty‐two trials with a total of 1600 participants provided data for walking velocity (m/s) at study end (Analysis 1.3). The use of electromechanical devices for gait rehabilitation did increase walking velocity. The pooled mean difference (MD) (random‐effects model) for walking velocity was 0.06 m/s (95% CI 0.02 to 0.10; P = 0.004; level of heterogeneity I² = 60%; low‐quality evidence). Participants who were unable to walk were regarded as having a walking velocity of zero metres per second.
1.4. Walking velocity (metres per second) at follow‐up
Thirteen trials with a total of 727 participants provided data for walking velocity (m/s) at follow‐up after study end (Analysis 1.4). The use of electromechanical devices for gait rehabilitation did not increase the walking velocity at follow‐up after study end. The pooled MD (random‐effects model) for walking velocity was 0.07 m/s (95% CI ‐0.03 to 0.17; P = 0.18; level of heterogeneity I² = 74%; moderate‐quality evidence; Analysis 1.4). Participants who were unable to walk were regarded as having a walking velocity of zero metres per second. We could draw no definitive conclusion regarding a longer‐lasting effect of the use of electromechanical devices for walking velocity.
Mean walking capacity (secondary outcome)
1.5. Walking capacity (metres walked in six minutes) at the end of the intervention phase
Twenty‐four trials with a total of 983 participants provided data for walking capacity (metres walked in six minutes) at study end (Analysis 1.5). The use of electromechanical devices in gait rehabilitation did not increase the walking capacity of people after stroke. The pooled MD (random‐effects model) for walking capacity was 10.86 metres walked in six minutes (95% CI ‐5.72 to 27.44; P = 0.20; level of heterogeneity I² = 42%; very low‐quality evidence; Analysis 1.5).
1.6. Walking capacity (metres walked in six minutes) at follow‐up
Eleven trials with a total of 612 participants provided data for walking capacity (metres walked in six minutes) at follow‐up after study end (Analysis 1.6). The use of electromechanical devices for gait rehabilitation did not increase walking capacity at follow‐up after study end. The pooled MD (random‐effects model) for walking capacity was 7.76 metres walked in six minutes (95% CI ‐21.47 to 36.99; P = 0.60; level of heterogeneity I² = 60%; very low‐quality evidence; Analysis 1.6).
Loss to study during intervention phase, dropouts (secondary outcome)
1.7. Adverse outcomes: acceptability of electromechanical‐assisted gait‐training devices during the intervention phase in terms of dropouts
All trialists provided information about participants who dropped out from all causes during the trial period, but for 17 of the 62 included trials, no events/dropouts were reported (Analysis 1.7). Data were not available to focus specifically on dropouts due to acceptability. We have therefore analysed data related to 'loss to study', which include reasons that are unlikely to have anything to do with acceptability.
The use of electromechanical devices for gait rehabilitation of people after stroke did not increase the risk of participants dropping out from the study (risk difference (RD) (random‐effects model) ‐0.02, 95% CI ‐0.04 to 0.00; P = 0.08; level of heterogeneity I² = 3%; low‐quality evidence). The reasons for dropouts and all adverse events are described in detail for each trial in Table 2.
Death from all causes until the end of the intervention phase (secondary outcome)
1.8. Death from all causes until the end of the intervention phase
Only three larger trials reported any deaths during the intervention period (Chua 2016; Hidler 2009; Pohl 2007). In Pohl 2007, one participant in the control group died as the result of aspiration pneumonia and one participant in the treatment group died due to recurrent stroke. In Hidler 2009, the group in which the death occurred was not stated. We therefore used a worst‐case (conservative) scenario and counted the one death for the experimental group. In Chua 2016, the deaths occurred after the treatment period. The use of electromechanical devices for gait rehabilitation of people after stroke did not increase the risk of participants dying during the intervention period (RD (random‐effects model) 0.00, 95% CI ‐0.01 to 0.01; P = 0.82; level of heterogeneity I² = 0%; moderate‐quality evidence; Analysis 1.8).
2. Planned sensitivity analysis by trial methods
2.1. Regaining independent walking ability: planned sensitivity analysis by trial methods
To examine the robustness of the results, we specified variables in a sensitivity analysis that we believed could influence the size of the observed effect (adequate sequence generation process, adequate concealed allocation, blinded assessors for the primary outcome, incomplete outcome data, excluding the largest study). As stated above, for some of the included trials, no effect estimate (OR) was feasible (Analysis 2.1).
2.1.1. Studies with adequate sequence generation process
We included 22 trials with a total of 1049 participants with an adequate sequence generation process (Figure 2). The use of electromechanical devices for gait rehabilitation of people after stroke increased the chance of walking independently (OR (random‐effects model) 1.93, 95% CI 1.26 to 2.96; P = 0.003; level of heterogeneity I² = 25%).
2.1.2. Studies with adequate concealed allocation
We included 18 trials with a total of 905 participants with adequate concealed allocation (Figure 2). The use of electromechanical devices for gait rehabilitation of people after stroke increased the chance of walking independently (OR (random‐effects model) 1.90, 95% CI 1.23 to 2.95; P = 0.004; level of heterogeneity I² = 29%).
2.1.3. Studies with blinded assessors for the primary outcome
Seventeen trials with a total of 836 participants had blinded assessors for the primary outcome (Figure 2). The use of electromechanical devices for gait rehabilitation of people after stroke increased the chance of walking independently (OR (random‐effects model) 1.86, 95% CI 1.22 to 2.84; P = 0.004; level of heterogeneity I² = 23%).
2.1.4. Studies with complete outcome data
Fourteen trials with a total of 590 participants adequately described complete outcome data (Figure 2). The use of electromechanical devices for gait rehabilitation of people after stroke increased the chance of walking independently (OR (random‐effects model) 2.23, 95% CI 1.16 to 4.29; P = 0.02; level of heterogeneity I² = 29%).
2.1.5. With exclusion of the largest study (Pohl 2007)
After the largest study was excluded (Pohl 2007), 37 trials with a total of 1417 participants remained in this analysis. The use of electromechanical devices for gait rehabilitation of people after stroke increased the chance of walking independently (OR (random‐effects model) 1.74, 95% CI 1.26 to 2.39; P = 0.0007; level of heterogeneity I² = 0%).
3. Subgroup analysis comparing participants in acute and chronic phases of stroke
3.1. Independent walking at the end of the intervention phase, with all electromechanical devices used
In our planned subgroup analysis comparing independent walking at the end of the intervention phase for people in acute and chronic phases of stroke, we attempted to assign all included studies to one of two subgroups (acute phase within three months and chronic phases longer than three months).
3.1.1 Acute phase: less than or equal to 3 months after stroke
Twenty‐four trials with a total of 1243 participants investigated people in the acute or subacute phase, defined as less than or equal to three months after stroke (Analysis 3.1). The use of electromechanical devices for gait rehabilitation of people after stroke increased the chance of walking independently (OR (random‐effects model) 1.96, 95% CI 1.47 to 2.62; P < 0.00001; level of heterogeneity I² = 0%). As stated above, for some of the included trials no effect estimate (OR) was feasible (Analysis 3.1). Therefore, only 18 out of 24 studies contributed to this estimate.
3.1.2 Chronic phase: more than 3 months after stroke
Sixteen trials with a total of 461 participants investigated people in the chronic phase, defined as longer than three months after stroke (Analysis 3.1). The use of electromechanical devices for gait rehabilitation of people after stroke did not increase the chance of walking independently (OR (random‐effects model) 1.20, 95% CI 0.40 to 3.65; P = 0.74; level of heterogeneity I² = 29%). As for some of the trials, no effect estimate (OR) was feasible as only 3 out of 16 studies contributed to this estimate.
In a formal subgroup analysis, we did not find differences in regaining independent walking between participants treated in the acute/subacute phase and participants treated in the chronic phase after stroke (P = 0.40).
4. Post hoc sensitivity analysis by ambulatory status at start of the study
4.1. Independent walking at the end of the intervention phase
To examine the robustness of the results and to explore the relationship between the main effect and walking status at the start of the study, we compared independent walking rates at the end of the intervention phase by ambulatory status at the start of the study.
4.1.1. Ambulatory participants at the start of the study
Fifteen trials with a total of 500 participants investigated independent walkers (Analysis 4.1). As stated in the comparisons above, for some of the included trials, no effect estimate (OR) was feasible; the conclusions are therefore based on one trial. The use of electromechanical devices for gait rehabilitation of people after stroke did not increase the chance of walking independently (OR (random‐effects model) 1.38, 95% CI 0.45 to 4.20; P = 0.18; level of heterogeneity I² = not applicable).
4.1.2. Ambulatory and non‐ambulatory participants at the start of the study
Nine trials with a total of 340 participants investigated a mixed population of dependent and independent walkers (Analysis 4.1). The use of electromechanical devices for gait rehabilitation of people after stroke increased the chance of walking independently (OR (random‐effects model) 1.90, 95% CI 1.11 to 3.25; P = 0.02; level of heterogeneity I² = 0%). However, only eight out of nine studies contributed to this estimate.
4.1.3. Non‐ambulatory participants at the start of the study
Fourteen trials with a total of 732 participants investigated dependent walkers (Analysis 4.1). The use of electromechanical devices for gait rehabilitation of people after stroke increased the chance of walking independently (OR (random‐effects model) 2.02, 95% CI 1.27 to 3.22; P = 0.003; level of heterogeneity I² = 30%). However, only nine out of 14 studies contributed to this estimate.
We did not find differences in regaining independent walking (P = 0.82) between people who were dependent or independent walkers at the start of the study.
4.2. Walking speed at the end of the intervention phase
To examine the robustness of the results and to explore the relationship between walking velocity and ambulatory status at the start of the study, we compared achieved walking velocity at the end of the intervention phase by ambulatory status at the start of the study.
4.2.1. Ambulatory participants at the start of the study
Twenty‐two trials with a total of 715 participants investigated independent walkers at the start of the study and provided data for walking velocity (m/s) at study end (Analysis 4.2). The use of electromechanical devices for gait rehabilitation did not increase walking velocity. The pooled MD (random‐effects model) for walking velocity was 0.02 m/s (95% CI ‐0.04 to 0.09; P = 0.49; level of heterogeneity I² = 56%).
4.2.2. Ambulatory and non‐ambulatory participants at the start of the study
Seven trials with a total of 226 participants investigated dependent and independent walkers at the start of the study and provided data for walking velocity (m/s) at study end (Analysis 4.2). The use of electromechanical devices for gait rehabilitation did not increase walking velocity. The pooled MD (random‐effects model) for walking velocity was 0.04 m/s (95% CI ‐0.04 to 0.11; P = 0.34; level of heterogeneity I² = 0%).
4.2.3. Non‐ambulatory participants at the start of the study
Nine trials with a total of 522 participants investigated dependent walkers at the start of the study and provided data for walking velocity (m/s) at study end (Analysis 4.2). The use of electromechanical devices for gait rehabilitation increased walking velocity. The pooled MD (random‐effects model) for walking velocity was 0.09 m/s (95% CI 0.02 to 0.15; P = 0.008; level of heterogeneity I² = 67%).
We did not find differences in regaining independent walking between participants who were dependent or independent walkers at the start of the study (P = 0.38).
5. Post hoc sensitivity analysis by type of electromechanical device
5.1. Independent walking at the end of the intervention phase
To examine the robustness of the results and to explore the relationship between independent walking and type of electromechanical device, we compared achieved independent walking rates at the end of the intervention phase by type of electromechanical device.
5.1.1. End‐effector devices
Eleven trials with a total of 598 participants used an end‐effector device as the experimental intervention (Table 2). The use of electromechanical devices for gait rehabilitation of people after stroke did not increase the chance of walking independently (OR (random‐effects model) 1.90, 95% CI 0.99 to 3.63; P = 0.05; level of heterogeneity I² = 50%). As stated in the comparisons above, for some of the included trials, no effect estimate (OR) was feasible (Analysis 5.1). Therefore only seven out of 11 studies contributed to this estimate.
5.1.2. Exoskeleton devices
Eighteen trials with a total of 685 participants used an exoskeleton device as the experimental intervention (Table 2). The use of electromechanical devices for gait rehabilitation of people after stroke increased the chance of walking independently (OR (random‐effects model) 2.11, 95% CI 1.36 to 3.29; P = 0.001; level of heterogeneity I² = 0%). As stated in the comparisons above, for some of the included trials, no effect estimate (OR) was feasible (Analysis 5.1). Therefore only 10 out of 18 studies contributed to this estimate.
5.1.3. Mobile devices
Three trials with a total of 106 participants used powered mobile devices as the experimental intervention (Table 2), but the effects on walking ability were not estimable.
5.1.4. Ankle devices
Two trials with a total of 63 participants used ankle devices while sitting as the experimental intervention (Table 2), but the effects on walking ability were not estimable.
We did not find differences in regaining independent walking between participants treated with end‐effector or exoskeleton devices (P = 0.79).
5.2. Walking speed at the end of the intervention phase
To examine the robustness of the results and to explore the relationship between independent walking and type of electromechanical device, we compared walking speed at the end of the intervention phase by type of electromechanical device.
5.2.1. End‐effector devices
Thirteen trials with a total of 665 participants used an end‐effector device as the experimental intervention and provided data for walking velocity (m/s) at study end (Analysis 5.2). The use of electromechanical devices for gait rehabilitation increased walking velocity. The pooled MD (random‐effects model) for walking velocity was 0.12 m/s (95% CI 0.05 to 0.19; P = 0.001; level of heterogeneity I² = 69%).
5.2.2. Exoskeleton devices
Twenty‐three trials with a total of 742 participants used an exoskeleton device as the experimental intervention and provided data for walking velocity (m/s) at study end (Analysis 5.2). The use of electromechanical devices for gait rehabilitation did not increase walking velocity. The pooled MD (random‐effects model) for walking velocity was ‐0.00 m/s (95% CI ‐0.05 to 0.04; P = 0.78; level of heterogeneity I² = 33%).
In a subgroup analysis, we found differences in improvement in walking velocity between participants treated with an end‐effector device or an exoskeleton device (P = 0.006).
5.2.3. Mobile devices
Four trials with a total of 146 participants used powered mobile devices as the experimental intervention and provided data for walking velocity (m/s) at study end (Analysis 5.2). The use of electromechanical devices for gait rehabilitation did not increase walking velocity. The pooled MD (random‐effects model) for walking velocity was 0.12 m/s (95% CI ‐0.07 to 0.30; P = 0.21; level of heterogeneity I² = 67%).
5.2.4. Ankle devices
Two trials with 58 participants used an ankle mobile device as the experimental intervention and provided data for walking velocity (m/s) at study end (Analysis 5.2). The use of electromechanical devices for gait rehabilitation increased walking velocity. The MD (random‐effects model) for walking velocity was 0.11 m/s (95% CI ‐0.10 to 0.31; P = 0.30; level of heterogeneity I² = 62%).
We found differences in improvement in walking velocity by type of electromechanical device (end‐effector, exoskeleton, mobile or ankle device) (P = 0.03).
5.3. Walking capacity at the end of the intervention phase
To examine the robustness of the results and to explore the relationship between independent walking and type of electromechanical device, we compared walking capacity at the end of the intervention phase by type of electromechanical device.
5.3.1. End‐effector devices
Seven trials with a total of 416 participants used an end‐effector device as the experimental intervention and provided data for walking capacity (metres) at study end (Analysis 5.3). The use of electromechanical devices for gait rehabilitation increased walking capacity. The pooled MD (random‐effects model) for walking capacity was 31.2 m (95% CI 10.4 to 52.1; P = 0.003; level of heterogeneity I² = 0%).
5.3.2. Exoskeleton devices
Thirteen trials with a total of 468 participants used an exoskeleton device as the experimental intervention and provided data for walking capacity (metres) at study end (Analysis 5.3). The use of electromechanical devices for gait rehabilitation did not increase walking capacity. The pooled MD (random‐effects model) for walking capacity was ‐8.3 m (95% CI ‐27.7 to 11.1; P = 0.40; level of heterogeneity I² = 30%).
We found differences in improvement in walking capacity between participants treated with an end‐effector device or an exoskeleton device (P = 0.007).
5.3.3. Mobile devices
Two trials with a total of 56 participants used powered mobile devices as the experimental intervention and provided data for walking capacity (metres) at study end (Analysis 5.3). The use of electromechanical devices for gait rehabilitation did not increase walking capacity. The pooled MD (random‐effects model) for walking capacity was 20.06 m (95% CI ‐39.52 to 79.63; P = 0.51; level of heterogeneity I² = 0%).
5.3.4. Ankle devices
Two trials with 43 participants used an ankle mobile device as the experimental intervention and provided data for walking capacity (metres) at study end (Analysis 5.3). The use of electromechanical devices for gait rehabilitation did not increase walking capacity. The MD (random‐effects model) for walking capacity was 49.2 m (95% CI ‐17.1 to 115.6; P = 0.15; I² = 29%).
We found differences in improvement in walking capacity between participants treated by type of electromechanical device (end‐effector, exoskeleton, mobile or ankle device) (P = 0.003).
Discussion
Summary of main results
The aim of this review was to evaluate the effects of electromechanical‐ and robot‐assisted gait‐training devices for improving walking after stroke. We sought to estimate the likelihood or chance of becoming independent in walking as a result of these interventions, which is a main rehabilitation goal for people who have had a stroke (Bohannon 1988; Bohannon 1991; Hornby 2008; Mehrholz 2018).
We included 62 trials with a total of 2440 participants and found evidence that the use of electromechanical‐assisted devices in combination with physiotherapy in rehabilitation settings may improve walking function after stroke.
Furthermore, adverse events, dropouts, and deaths do not appear to be more frequent in participants who received electromechanical‐ or robot‐assisted gait training, which indicates that the use of electromechanical‐assisted gait‐training devices was safe and acceptable to most participants included in the trials analysed by this review. The exclusion of certain patient groups, such as people over 80 years of age, people with unstable cardiovascular conditions, people with cognitive and communication deficits, and people with a limited range of motion in the lower limb joints at the start of the intervention, may limit the general applicability of the findings. However, using the results from the primary outcomes, it is possible to explore the apparent effectiveness of electromechanical‐assisted devices for regaining walking ability. Of 489 initially non‐ambulatory participants in the treatment group, 220 (45%) were walking independently at the end of the intervention phase. We used the primary outcome of independently walking at the end of the intervention phase for all included participants (OR 2.01) to calculate the number needed to treat for an additional beneficial outcome (NNTB). Together with our control event rate of 29% (137 out of 473 initially non‐ambulatory control participants were independently walking at the end of treatment), we calculated an NNTB of 8 (95% confidence interval (CI) 7 to 11) (Sackett 1996). This means that every eighth dependency in walking ability after stroke could be avoided with the use of electromechanical‐assisted devices. However, the optimal amount of electromechanical‐assisted gait training (optimal frequency, optimal duration in the use of assistive technologies, and optimal timing of application) remains unclear.
The evidence is uncertain about whether results from this type of therapy relate to length of time after stroke, but some limited evidence suggests that people in the acute and subacute phases after stroke may profit more than people treated longer than three months post stroke (Analysis 3.1). Further investigation is required to increase our confidence in this finding.
We argue that 582 (39%) of the 2440 included participants were independently walking at baseline (see Description of studies and the Characteristics of included studies table). Because people who were already ambulatory could not regain or recover independent walking, our effect estimate could have been influenced by performance bias. We therefore performed two further sensitivity analyses by ambulatory status at the start of the study (Analysis 4.1; Analysis 4.2). We found that studies that included dependent walkers had the greatest effect in improving walking velocity of 0.9 m/s; however, compared with independent walkers, there was no difference.
We found that walking velocity (Analysis 1.3) but not walking capacity (Analysis 1.5) might be improved slightly by the use of electromechanical‐assisted devices in combination with physiotherapy. The mean effect of the intervention was, however, just 0.06 m/s and therefore could not be seen as clinically important or relevant.
We found that studies that included mainly dependent walkers (i.e. participants who were non‐ambulatory at the start of the study) were more likely to report that these participants were able to walk at study end and to reach greater walking velocities at the end of the intervention phase compared with participants who were already ambulatory at the start of the study (Analysis 4.1; Analysis 4.2). However, there were no statistical subgroup differences between ambulatory and non‐ambulatory participants; therefore further investigation of this point is needed.
We found that the ability to walk at study end was not dependent on the type of device used in the studies (Analysis 5.1). However, walking velocities and walking capacity at the end of the intervention phase were higher when specific device subtypes were used (such as end‐effector devices) compared with training (e.g. by an exoskeleton device) (Analysis 5.2; Analysis 5.3). This could be interpreted to mean that the type of device used could play a role in improving walking function after stroke. This is in line with former versions of this review from 2013 ‐ Mehrholz 2013 ‐ and from 2017 ‐ Mehrholz 2017 ‐ and is consistent with other reviews that compared the effects of different types of devices on walking ability after stroke (Mehrholz 2012a; Mehrholz 2018). However, in the absence of a direct empirical comparison between electromechanical‐assisted gait‐training devices, this point warrants further investigation.
Overall completeness and applicability of evidence
In all systematic reviews, the risk of publication bias is present. However, we performed an extensive search of electronic databases for relevant literature; we also handsearched conference abstracts and searched for trials in all languages and arranged for translation of relevant papers where necessary. Additionally, we asked study authors, trialists, and experts in the field for information on other unpublished and ongoing trials.
Upon visual inspection, we did not detect graphical evidence of publication bias (see Figure 3 and Figure 4).

Funnel plot of comparison: 1 Electromechanical‐ and robot‐assisted gait training plus physiotherapy versus physiotherapy (or usual care), outcome: 1.1 Independent walking at end of intervention phase, all electromechanical devices used.

Funnel plot of comparison: 1 Electromechanical‐ and robot‐assisted gait training plus physiotherapy versus physiotherapy (or usual care), outcome: 1.3 Walking velocity (metres per second) at end of intervention phase.
Given that we found several ongoing studies of substantial size, it is possible that these ongoing studies could potentially impact our overall conclusion when they are included in the review (see Characteristics of ongoing studies).
It is not clear whether observed differences between experimental and control groups depend on the intensity of therapy, in terms of repetition of gait practice. Time devoted to therapy is a crude measure of intensity. A 30‐minute therapy session could include no walking practice or high‐intensity walking practice with many steps taken. Reviews of the effectiveness of arm robotic therapy suggest that the positive benefit of robotic therapy may be lost when the intensity of practice is matched between experimental and control groups (Mehrholz 2012b). However, the numbers of repetitions in experimental and control groups were not exactly counted in any of the included studies. Further studies should therefore ascertain whether the benefits described here are still apparent when the intensity of gait practice (e.g. step repetitions) is exactly matched between groups.
It should be mentioned that we do not know yet whether these devices provide any cost benefit. Further studies should investigate, under the premise that gait practice is matched in terms of objective measures of intensity, the long‐term costs of regaining walking ability and the cost‐effectiveness of these devices.
Quality of the evidence
There was heterogeneity between the trials in terms of trial design (two arms, three arms, parallel‐group or cross‐over trial, duration of follow‐up, selection criteria for participants), characteristics of therapy interventions (especially duration of the intervention), and participant characteristics (length of time since stroke onset, stroke severity at baseline). We noted methodological differences in the mechanisms of randomisation and in the allocation concealment methods used, as well as in the blinding of primary outcomes and the presence or use of intention‐to‐treat analysis.
After examining the effects of methodological quality on the odds of independence in walking, we found that the benefits were relatively robust when we removed trials with an inadequate sequence generation process, inadequate concealed allocation, no blinded assessors for the primary outcome, and incomplete outcome data (Analysis 2.1). However, we found that the odds of independence in walking were slightly lower after the largest included study (Pohl 2007, N = 155) was removed, but a clinically relevant benefit for participants was still observed (Analysis 2.1).
Although the methodological quality of the included trials seemed generally good to moderate (Figure 2), trials investigating electromechanical‐ and robot‐assisted gait‐training devices are subject to potential methodological limitations. These include inability to blind the therapist and participants, so‐called contamination (provision of the intervention to the control group), and co‐intervention (when the same therapist unintentionally provides additional care to either treatment or comparison group). All these potential methodological limitations introduce the possibility of performance bias. However, as discussed previously, this was not supported in our sensitivity analyses by methodological quality.
The quality of evidence for automated electromechanical‐ and robot‐assisted gait‐training devices for improving walking after stroke was high. The quality of evidence was low for walking speed, moderate for walking capacity, and moderate for adverse events and people discontinuing treatment.
Potential biases in the review process
In all systematic reviews, the risk of publication bias is present. However, we performed an extensive search for relevant literature in electronic databases and we handsearched conference abstracts. Additionally, we contacted and asked study authors, trialists, and experts in the field for information on other unpublished and ongoing trials.
Upon visual inspection, we did not detect graphical evidence of publication bias (see Figure 3 and Figure 4).
Given that we found several ongoing studies of substantial size, it is possible that these ongoing studies could potentially impact our overall conclusions (see Characteristics of ongoing studies).
Agreements and disagreements with other studies or reviews
A recent and relevant review describes the effects of new so‐called powered mobile solutions (Louie 2016). We included four studies of mobile devices in this update. When pooling these results, we did not find improvements in walking speed and walking capacity; this result is in agreement with the recent review of Louie 2016. Additionally, we included three studies describing the effects of ankle robots in improving walking (Forrester 2014; Waldman 2013; Yeung 2018). When pooling these studies, we did not find improvements in walking speed and walking capacity.
However, currently not many clinical comparisons of two or more interventions to improve walking ability have been reported, although in practice, it is crucial to know which device performs more effectively than others in a given situation. The rehabilitation team also encounters difficulties in deciding which specific form of treatment to prescribe for a stroke patient. A methodological approach to solve this problem might be the network meta‐analysis. Such a network meta‐analysis recently investigated conventional gait training, training on a treadmill (with or without body weight support and/or in combination with or without a speed paradigm), and electromechanical‐assisted gait training with end‐effectors or exoskeletons (Mehrholz 2018). Overall, 95 randomised controlled trials involving a total of 4458 post‐stroke patients were included in the analysis. The review authors found that gait velocity (the primary endpoint) and gait training assisted by end‐effectors led to mean improvement of 0.16 m/s (Mehrholz 2018). This result of the network meta‐analysis is in accordance with the results of the update of our review, especially for our sensitivity analysis about the type of device used for regaining walking speed (Analysis 5.2).
It is possible that some devices might be better for very severely affected patients who are not able to walk. However, currently no clear evidence about this is available. A recent large cohort study with broad inclusion criteria and not many exclusion criteria showed that in patients who are not able to walk (those with Functional Ambulation Category (FAC) equal to 0 and FAC equal to 1), gait training with end‐effector devices improved walking ability (Reichl 2020). Our main finding is that for improving walking ability, the type of device is not important (Analysis 5.1).
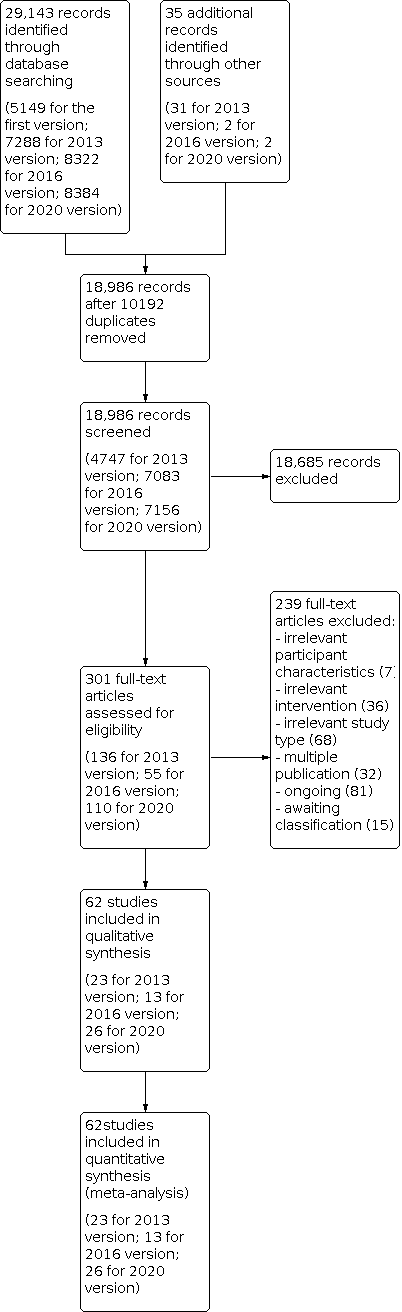
Study flow diagram.

Risk of bias summary: review authors' judgements about each risk of bias item for each included study.

Funnel plot of comparison: 1 Electromechanical‐ and robot‐assisted gait training plus physiotherapy versus physiotherapy (or usual care), outcome: 1.1 Independent walking at end of intervention phase, all electromechanical devices used.

Funnel plot of comparison: 1 Electromechanical‐ and robot‐assisted gait training plus physiotherapy versus physiotherapy (or usual care), outcome: 1.3 Walking velocity (metres per second) at end of intervention phase.

Comparison 1: Electromechanical‐ and robot‐assisted gait training plus physiotherapy versus physiotherapy (or usual care), Outcome 1: Independent walking at end of intervention phase, all electromechanical devices used (primary outcome)

Comparison 1: Electromechanical‐ and robot‐assisted gait training plus physiotherapy versus physiotherapy (or usual care), Outcome 2: Independent walking at follow‐up after study end (primary outcome)

Comparison 1: Electromechanical‐ and robot‐assisted gait training plus physiotherapy versus physiotherapy (or usual care), Outcome 3: Walking velocity (metres per second) at end of intervention phase

Comparison 1: Electromechanical‐ and robot‐assisted gait training plus physiotherapy versus physiotherapy (or usual care), Outcome 4: Walking velocity (metres per second) at follow‐up

Comparison 1: Electromechanical‐ and robot‐assisted gait training plus physiotherapy versus physiotherapy (or usual care), Outcome 5: Walking capacity (metres walked in 6 minutes) at end of intervention phase

Comparison 1: Electromechanical‐ and robot‐assisted gait training plus physiotherapy versus physiotherapy (or usual care), Outcome 6: Walking capacity (metres walked in 6 minutes) at follow‐up

Comparison 1: Electromechanical‐ and robot‐assisted gait training plus physiotherapy versus physiotherapy (or usual care), Outcome 7: Lost to study during intervention phase, dropouts

Comparison 1: Electromechanical‐ and robot‐assisted gait training plus physiotherapy versus physiotherapy (or usual care), Outcome 8: Death from all causes until end of intervention phase

Comparison 2: Planned sensitivity analysis by trial methods, Outcome 1: Regaining independent walking ability

Comparison 3: Subgroup analysis comparing participants in acute and chronic phases of stroke, Outcome 1: Independent walking at end of intervention phase, all electromechanical devices used

Comparison 4: Post hoc sensitivity analysis: ambulatory status at start of study, Outcome 1: Recovery of independent walking: ambulatory status at start of study

Comparison 4: Post hoc sensitivity analysis: ambulatory status at start of study, Outcome 2: Walking velocity: ambulatory status at start of study

Comparison 5: Post hoc sensitivity analysis: type of device, Outcome 1: Different devices for regaining walking ability

Comparison 5: Post hoc sensitivity analysis: type of device, Outcome 2: Different devices for regaining walking speed

Comparison 5: Post hoc sensitivity analysis: type of device, Outcome 3: Different devices for regaining walking capacity
| Electromechanical‐ and robot‐assisted gait training plus physiotherapy compared to physiotherapy (or usual care) for walking after stroke | ||||||||
| Patient or population: patients walking after stroke | ||||||||
| Outcomes | Illustrative comparative risks* (95% CI) | Relative effect | No. of participants | Quality of the evidence | Comments | |||
|---|---|---|---|---|---|---|---|---|
| Assumed risk | Corresponding risk | |||||||
| Control | Electromechanical‐ and robot‐assisted gait training plus physiotherapy vs physiotherapy (or usual care) | |||||||
| Independent walking (primary outcome) | At end of intervention phase, all electromechanical devices used | Study population | OR 2.01 | 1572 | ⊕⊕⊕⊕ | |||
| 451 per 1000 | 623 per 1000 | |||||||
| At follow‐up after study end Follow‐up: mean 22.3 weeks | Study population | OR 1.93 | 496 | ⊕⊕⊝⊝ | ||||
| 551 per 1000 | 703 per 1000 | |||||||
| Mean walking velocity (secondary outcome; metres per second) | At end of intervention phase | 0.5 m/s | 0.06 higher | 1600 | ⊕⊕⊝⊝ | |||
| At follow‐up Scale from 0 to infinity | 0.57 m/s | 0.07 higher | 727 | ⊕⊕⊝⊝ | ||||
| Mean walking capacity (secondary outcome; metres walked in 6 minutes) | At end of intervention phase | 172 m | 10.86 higher | 983 | ⊕⊕⊕⊝ | |||
| At follow‐up | 199 m | 7.76 higher | 612 | ⊕⊕⊕⊝ | ||||
| Loss to study during intervention phase, dropouts (secondary outcome) | Study population | RR ‐0.02 (‐0.04 to 0.00) See comment | 2440 | ⊕⊕⊕⊝ | Risks were calculated from pooled risk differences | |||
| 111 per 1000 | 94 per 1000 | |||||||
| Death from all causes until end of intervention phase (secondary outcome) | Study population | RR 0.00 (‐0.01 to 0.01) See comment | 2440 | ⊕⊕⊕⊝ | Risks were calculated from pooled risk differences | |||
| 2 per 1000 | 3 per 1000 (‐8 to 12) | |||||||
| *The basis for the assumed risk (e.g. the median control group risk across studies) is provided in footnotes. The corresponding risk (and its 95% confidence interval) is based on the assumed risk in the comparison group and the relative effect of the intervention (and its 95% CI). | ||||||||
| GRADE Working Group grades of evidence. | ||||||||
| aDowngraded due to several ratings with 'high risk of bias'. | ||||||||
| Study ID | Experimental: mean age (SD) | Control: mean age (SD) | Experimental: mean time post stroke | Control: mean time post stroke | Experimental: sex | Control: sex | Experimental: side paresis | Control: side paresis |
|---|---|---|---|---|---|---|---|---|
| 57 years | 65 years | ≤ 3 months | ≤ 3 months | 2 women | 4 women | Not stated | Not stated | |
| 58 (20) years | 69 (11) years | > 6 months | > 6 months | 4 men, 2 women | 5 men, 3 women | 0 right, 6 left | 5 right, 3 left | |
| 61 (12) years | 56 (9) years | 86 days | 44 days | 9 men, 3 women | 10 men, 4 women | 3 right, 9 left | 9 right, 5 left | |
| 54 years | 54 years | 12 months | 13 months | 5 men, 4 women | 4 men, 5 women | 4 right, 5 left | 4 right, 5 left | |
| 44 (12) years | 56 (11) years | 5 years | 11 years | 6 men, 2 women | 5 men, 2 women | 2 right, 2 left, 3 both | 2 right, 2 left, 4 both | |
| 72 (9) years | 71 (10) years | 7.5 weeks | 8 weeks | 10 men, 5 women | 7 men, 8 women | 11 right, 4 left | 12 right, 3 left | |
| 61 years | 59 years | 56 (median) days | 21 (median) days | 5 men, 2 women | 4 men, 2 women | 5 right, 2 left | 1 right, 5 left | |
| 60 years | 62 years | 7 years | 5 years | 17 men, 8 women | 16 men, 9 women | 13 right, 12 left | 12 right, 13 left | |
| 69 (4) years | 67 (6) years | 10 months | 11 months | 12 men, 8 women | 11 men, 9 women | 12 right, 8 left | 11 right, 9 left | |
| 56 (12) years | 60 (12) years | 16 (5) days | 18 (5) days | 13 men, 7 women | 10 men, 7 women | 6 right, 14 left | 6 right, 11 left | |
| 55 (12) years | 55 (15) years | 15 months | 13 months | Not stated | Not stated | 6 right, 4 left, 4 both | 3 right, 1 left, 3 both | |
| 62 (10) years | 61 (11) years | 27 (11) days | 30 (14) days | 35 men, 18 women | 40 men, 13 women | 24 right, 29 left | 21 right, 32 left | |
| 70 (7) years | 68 (11) years | 47 (64) months | 48 (30) months | 16 men, 4 women | 14 men, 6 women | Not stated | Not stated | |
| 50 (11) years | 48 (10) years | 39 months | 25 months | 16 men, 13 women | 3 men, 11 women | 11 right, 18 left | 6 right, 8 left | |
| Not stated | Not stated | < 12 months | < 12 months | Not stated | Not stated | Not stated | Not stated | |
| 63 years | 60 years | 12 days | 11 days | Not stated | Not stated | 9 right, 9 left | 7 right, 9 left | |
| 63 (11) years | 64 (10) years | 54 (36) months | 53 (41) months | 10 men, 6 women | 13 men, 3 women | 10 right, 6 left | 12 right, 4 left | |
| 63 (7) years | 61 (6) years | 26 (6) months | 27 (6) months | 14 men, 6 women | 9 men, 1 woman | Not stated | Not stated | |
| 68 (15) years | 63 (11) years | 22 (8) days | 18 (10) days | Not stated | Not stated | 20 right, 10 left | 14 right, 12 left | |
| 60 (11) years | 55 (9) years | 111 (63) days | 139 (61) days | 21 men, 12 women | 18 men, 12 women | 22 right, 11 left | 13 right, 17 left | |
| 57 (10) years | 57 (11) years | 50 (51) months | 73 (87) months | 15 men, 9 women | 15 men, 9 women | 16 right, 8 left | 16 right, 8 left | |
| 60 (13) years | 57 (11) years | 79 (56) days | 89 (61) days | 11 men, 5 women | 10 men, 4 women | 12 right, 4 left | 11 right, 3 left | |
| 59 (9) years | 61 (12) years | 7 (6) years | 5 (3) years | 17 men, 8 women | 16 men, 9 women | 13 right, 12 left | 12 right, 13 left | |
| 55 (13) years | 63 (10) years | 29 (20) months | 34 (38) months | 20 men, 12 women | 21 men, 11 women | 31 right, 1 left | 29 right, 3 left | |
| 67 (9) years | 64 (11) years | 4 years | 1 year | 64% men | 67% men | Not described | Not described | |
| 54 (13) years | 50 (16) years | 80 (60) days | 120 (84) days | 9 men, 4 women | 10 men, 3 women | 8 right, 5 left | 10 right, 3 left | |
| 48 (6) years | 46 (14) years | 21 (33) months | 10 (8) months | 9 men, 1 woman | 7 men, 2 women | Not stated | Not stated | |
| 57 (12) years | 60 (13) years | 2 (2) months | 2 (3) months | 20 men, 5 women | 13 men, 10 women | 14 right, 11 left | 14 left, 9 right | |
| 48 (8) years | 55 (16) years | 22 (23) months | 29 (12) months | 9 men, 8 women | 4 men, 4 women | 9 right, 8 left | 4 right, 4 left | |
| Not stated | Not stated | Stroke at least for 3 months | Stroke at least for 3 months | Not stated | Not stated | Not stated | Not stated | |
| 61 (7) years | 62 (6) years | 1486 (264) days | 1536 (312) days | 7 men, 7 women | 7 men, 5 women | 5 right, 9 left | 7 right, 5 left | |
| 50 (13) years | 58 (13) years | 59 months | 28.5 months | 23 men, 7 women | 21 men, 9 women | 13 right, 17 left | 15 right, 15 left | |
| Not stated | Not stated | Between 10 days and 6 months | Between 10 days and 6 months | Not stated | Not stated | Not stated | Not stated | |
| 68 (12) years | 68 (12) years | 5 (1 to 8) weeks | 4 (2) weeks | 22 men, 15 women | 19 men, 18 women | 20 right, 17 left | 16 right, 21 left | |
| 62 (11) years | 62 (14) years | 19 (11) days | 20 (14) days | 15 men, 9 women | 13 men, 11 women | 13 right, 11 left | 15 right, 9 left | |
| 48 (15) years | 68 (17) years | 530.11 (389) days | 284.81 (309) days | 11 men, 7 women | 6 men, 10 women | Not stated | Not stated | |
| 60 (11) years | 57 (9) years | 546 (296) days | 600 (506) days | 8 men, 10 women | 14 men, 6 women | Not stated | Not stated | |
| 67 (9) years | 64 (11) years | 1354 days | 525 days | 7 men, 4 women | 6 men, 4 women | Not stated | Not stated | |
| 62 (8) years | 66 (12) years | 23 (7) days | 26 (8) days | 11 men, 2 women | 9 men, 4 women | 6 right, 7 left | 5 right, 8 left | |
| 56 (7) years | 57 (9) years | 7 months | 8 months | 16 men, 8 women | 9 men, 7 women | 14 right, 10 left | 8 right, 8 left | |
| 52 (8) years | 52 (7) years | 2 (2) years | 4 (5) years | 26 men, 4 women | 11 men, 4 women | 13 right, 17 left | 10 right, 5 left | |
| 67 (9) years | 68 (10) years | 8 (3) days | 8 (3) days | 11 men, 11 women | 18 men, 16 women | 11 right, 11 left | 14 right, 20 left | |
| 62 (10) years | 65 (3) years | 6 (4) years | 6 (4) years | 7 men, 4 women | 9 men, 2 women | Not stated | Not stated | |
| 62 (12) years | 64 (11) years | 4 (2) weeks | 5 (2) weeks | 50 men, 27 women | 54 men, 24 women | 36 right, 41 left | 33 right, 45 left | |
| 62 (13) years | 60 (19) years | 3 (4) months | 2 (1) months | 4 men, 4 women | 2 men, 6 women | Not stated | Not stated | |
| 62 (9) years | 65 (8) years | 22 (9) days | 24 (10) days | 21 men, 16 women | 20 men, 10 women | 17 right, 20 left | 8 right, 22 left | |
| 63 years | 66 years | 62 months | 102 months | 3 men, 6 women | 2 men, 7 women | 4 right, 5 left | 4 right, 5 left | |
| 58 (11) years | 57 (15) years | 49 (39) months | 89 (153) months | Not stated | Not stated | Not stated | Not stated | |
| 68 (12) years | 63 (16) years | 15 (9) days | 26 (22) days | 8 men, 8 women | 14 men, 6 women | 7 right, 9 left | 11 right, 9 left | |
| 63 (10) years | 60 (9) years | 55 (37) months | 65 (67) months | 10 men, 2 women | 9 right, 3 left | |||
| 64 (12) years | 62 (9) years | 103 (28) days | 92 (38) days | 13 men, 18 women | 14 men, 6 women | 8 right, 13 left | 10 right, 10 left | |
| 71 (5) years | 73 (7) years | 60 (49) days | 39 (31) days | 7 men, 6 women | 10 men, 5 women | Not stated | Not stated | |
| 55 (9) years | 61 (12) | 25 (6) days | 31 (10) days | 11 men, 2 women | 5 men, 8 women | 6 right, 7 left | 5 right, 7 left | |
| 71 (14) years | 64 (10) years | 2 (1) weeks | 2 (1) weeks | 19 men, 11 women | 12 men, 8 women | 13 right, 17 left | 7 right, 13 left | |
| 56 years | 62 years | Not stated | Not stated | Not stated | Not stated | Not stated | Not stated | |
| 53 (10) years | 2 (1) months | 16 men, 14 women | Not stated | Not stated | ||||
| 51 (8) years | 53 (7) years | 41 (20) months | 30 (22) months | Not stated | Not stated | Not stated | Not stated | |
| 67 (17) years | 76 (14) years | 59 (47) days | 51 (34) days | 7 men, 4 women | 4 men, 7 women | 6 right, 5 left | 5 right, 6 left | |
| 60 (9) years | 60 (9) years | 7 (2) weeks | 6 (2) weeks | 8 men, 7 women | 5 men, 10 women | 8 right, 7 left | 8 right, 7 left | |
| 59 (17) years | 55 (14) years | 44 (27) months | 37 (20) months | 6 men, 2 women | 7 men, 1 woman | 4 right, 4 left | 3 right, 5 left | |
| 54 (13) years | 61 (10) years | 4 (3) years | 6 (4) years | 6 men, 3 women | 7 men, 3 women | 4 right, 5 left | 5 right, 5 left | |
| 63 (6) years | 64 (3) years | 31 (3) years | 28 (8) years | 10 men, 8 women | 9 men, 9 women | 3 right, 15 left | 4 right, 14 left | |
| SD: standard deviation. | ||||||||
| Criteria | Stroke severity | Electromechanical device used | Duration of study intervention | Aetiology (ischaemic/haemorrhagic) | Intensity of treatment per day | Description of control intervention | Dropouts | Reasons for dropout and adverse events in experimental group | Reasons for dropout and adverse events in control group | Source of information |
| Not stated | G‐EO system | 45 days, 20 sessions | Not stated | 45 minutes, 3 times a week | Traditional gait rehabilitation, 1 hour, 3 times a week | 0 of 14 | None | None | Published information | |
| Not stated | G‐EO system | 20 sessions | 8/4 | 45 minutes, 3 times a week | Traditional gait rehabilitation, 3 times a week, 20 sessions | 0 of 26 | None | None | Published information | |
| Not stated | Lokomat | 3 weeks | Not stated | 30 minutes, 5 times a week | Task‐oriented physiotherapy, 5 times a week for 3 weeks (2.5 hours a week) | 4 of 23 | Not stated | Not stated | Unpublished information in the form of a conference presentation | |
| Unclear | Lokomat | 4 weeks | 13/5 | 60 minutes, 5 times a week (20 sessions) | Treadmill training without body weight support | 0 of 18 | None | None | Published information | |
| SARA, | Lokomat | 5 months | 4/11 | 60 minutes, 3 times a week | Therapist‐assisted gait training, once a week, 60 minutes, for 5 months | 4 of 19 | Participants not complying with protocol treatment criteria in intervention group | Not stated | Published information | |
| Not stated | Lokomat | 2 weeks | 8/7 | 60 minutes, 8 to 10 sessions in 2 weeks | Non‐robotic physiotherapy described as training of postural control including sensory feedback components in sitting, sit‐to‐stand, standing, and walking, if possible, 60 minutes or 30 minutes with 2 therapists, 8 to 10 sessions in 2 weeks | 12 of 38 | No pusher behaviour at start of treatment (n = 3), | No pusher behaviour at start of treatment | Published information | |
| Not stated | Ekso | 8 weeks | Not stated | 45 minutes, 5 days a week | Conventional over‐ground gait training | 0 of 40 | None | None | Published information | |
| Mean FIM, | Lokomat | 3 weeks | Not stated | Not stated | Physiotherapy | 0 of 13 | None | None | Unpublished and published information provided by study authors | |
| Unclear | Wearable exoskeleton Stride Management Assist system (SMA) | 6 to 8 weeks | Unclear | 3 times per week for maximum of 18 sessions | Functional task‐specific training (intensive over‐ground training and mobility training) | 0 of 50 | None | None | Published information | |
| Not stated | Lokomat | 10 days | Not stated | 30 minutes daily for 10 days | Conventional gait training by physical therapists (with equal therapy time and same number of sessions as experimental group) | 3 of 40 | Not described by group | Unpublished and published information provided by study authors | ||
| Mean modified Barthel Index, 36 points | Lokomat | 8 weeks (2 phases, cross‐over after 4 weeks) | 4/14 (2 both) | 30 minutes, 3 times a week for 4 weeks | Bobath (neurophysiological exercises, inhibition of spasticity and synergy pattern) | 0 of 20 | None | None | Published information | |
| Mean Barthel Index, 49 points | Gait Trainer | 8 weeks | Not stated | Not stated | Physiotherapy including 25 minutes of stance/gait, 10 minutes cycling, 10 minutes tilt table standing | 20 of 106 | 2 deaths, 3 refusals, 1 medical problem, 1 transport problem | 1 death, 6 refusals, 3 medical problems, 1 administrative problem, 2 inability to contact | Published information | |
| Mean Barthel Index, 75 points | Gait Trainer | 4 weeks | Not stated | 40 minutes, 5 times a week | Bobath method, 5 times a week for 5 weeks | 0 of 40 | None | None | Unpublished and published information provided by study authors | |
| Not stated | RoboGait | 3 weeks | 28/15 | 90 minutes, 5 days/week | Physical therapy including stretching, strengthening exercises, proprioception, weight bearing, balance, co‐ordination, and ambulatory training 90 minutes, 5 days/week | 5 of 48 | Not stated | Not stated | Published information | |
| Not stated | AutoAmbulator | 24 sessions | Not stated | Minimum 3 sessions a week up to 5 sessions; number of minutes in each session unclear | Standard physical therapy, 3 to 5 times a week for 24 consecutive sessions | 0 of 20 | 14 adverse events No details provided | 11 adverse events No details provided | Unpublished and published information provided by study authors | |
| Mean FIM | Anklebot | 8 to 10 sessions (with ca. 200 repetitions) | Not stated | 60 minutes, 8 to 10 sessions | Stretching of the paretic ankle | 5 of 34 | Total of 5 dropouts across both groups (1 medical complication, 1 discharge before study end, 2 times post stroke > 49 days, 1 non‐compliance) | Published information provided by study authors | ||
| Mean European Stroke Scale, 72 points; Barthel Index 90 points | G‐EO system | 5 weeks, 10 individual rehabilitation sessions | 13/3 | 45 minutes/2 days per week | Sensory Integration Balance Training including over‐ground gait training, stairs up and down, passive lower limb joint mobilisation and stretching exercises same duration as experimental group | 4 of 32 | Not stated for both groups | Published information | ||
| Mean European Stroke Scale, 80 points | Gait Trainer | 2 weeks | Not stated | 50 minutes, 5 times a week | Walking exercises according to the Bobath approach | 0 of 30 | None | None | Unpublished and published information provided by study authors | |
| Not stated | Lokomat | 4 weeks | 33/23 | 30 minutes, 5 times a week | Neurodevelopmental techniques for balance and mobility | 4 of 60 | None | 4 unclear reasons | Published information provided by study authors | |
| Not stated | Lokomat | 8 to 10 weeks (24 sessions) | 47/16 | 45 minutes, 3 days a week | Conventional gait training, 3 times a week for 8 to 10 weeks (24 sessions), each session lasted 1.5 hours | 9 of 72 | Not described by group | Unpublished and published information provided by study authors | ||
| Not stated | Lokomat | 12 sessions | 22/26 | 30 minutes, | Therapist‐assisted gait training, 12 sessions, each session lasted 30 minutes | 14 of 62 | 4 participants dropped out (2 discontinued secondary to leg pain during training, 1 experienced pitting oedema, and 1 had travel limitations) | 10 participants dropped out | Published information provided by study authors | |
| Median Barthel Index, 35 points | Lokomat | 4 weeks | 22/8 | 30 minutes, 5 times a week | Conventional physiotherapy, 30 minutes per day for 4 weeks. Information as provided by study authors | 2 of 32 | 1 participant enteritis | 1 participant pulmonary embolism | Published information | |
| Not stated | Honda Stride Management Assist | 6 to 8 weeks | 33/17 | 45 minutes per session, 3 times per week | Over‐ground gait training, functional task‐specific training | 4 of 54 | 2 transportation problems
| 2 transportation problems
| Information as provided by study authors | |
| Not stated | Robot‐assisted device | 5 weeks | Not stated | 40 minutes, | Conventional gait training 40 minutes, 3 days per week | 2 of 66 | 1 early discharge | 1 early discharge | Information as provided by study authors | |
| Not stated | Lokomat | 8 weeks | Not stated | 60 minutes, 5 times a week | Over‐ground gait training by physiotherapy on level and uneven surfaces | 1 of 21 | None | 1 withdrew | Information as provided by study authors | |
| Mean Barthel Index, 20 points | Walkbot | 4 weeks | 13/13 | 30 minutes, 5 times a week | Conventional physiotherapy (bed mobility, stretching, balance training, strengthening, symmetry training, treadmill training) | 4 of 30 | 1 rib fracture, 3 decline in health condition | Information as provided by study authors | ||
| Not stated | Lokomat | 4 weeks | Not stated | 60 minutes, | Conventional physical therapy (CPT) | 2 of 19 | 1 withdrew | 1 withdrew | Published information | |
| Mean Barthel Index, 55 points | Morning Walk | 3 weeks | 16/32 | 1.5 hours per session, 5 times per week | Conventional physiotherapy | 10 of 58 | 1 medical complication 1 unstable mood 1 isolation | 7 early discharge | Published information | |
| Not stated | Exowalk | 4 weeks | Not stated | 30 minutes a day, 5 days a week | Physical therapist‐assisted gait training | 0 of 41 | None | None | Published information | |
| Not stated | Lokomat | 4 weeks | 18/7 | 45 minutes, 3 days a week | Conventional physiotherapy, received equal time and sessions of conventional gait training | 10 of 35 | 1 participant dropped out for private reasons (travelling); adverse events not described | 9 participants refused after randomisation (reasons not provided); adverse events not described | Unpublished and published information provided by study authors | |
| Not stated | Gait Enhancing and Motivating System | 4 weeks | 18/8 | 45 minutes, 3 times per week, 10 sessions | Gait training without Gait Enhancing and Motivating System | 2 of 28 | None | 2 withdrew | Published information | |
| Not stated | Lokomat | 8 weeks | Not stated | Not stated | Add‐on conventional physiotherapy, received equal time and sessions of conventional gait training | 13 of 74 | 4 participants dropped out (reasons not provided); adverse events not described | 9 participants dropped out (reasons not provided) | Unpublished and published information provided by study authors | |
| Not stated | Lokomat | 8 weeks | Not stated | 2 hours, 5 times a week | Conventional over‐ground physical therapy | 8 of 74 | 7 change in clinical condition | 5 change in clinical condition, 2 lack of compliance | Published information | |
| Canadian Neurological Scale, 6 points | Gait Trainer | 4 weeks | 41/7 | 40 minutes, 5 times a week | Focused on trunk stabilisation, weight transfer to paretic leg, and walking between parallel | 21 of 48 | 12 (hypotension, referred weakness, knee pain, urinary infection, uncontrolled blood pressure, fever, absence of physiotherapist) | 9 (hypotension, referred weakness, knee pain, ankle pain, uncontrolled blood pressure, fever, absence of physiotherapist) | Information as provided by study authors | |
| Mean Barthel Index, 16 points | Exowalk | 4 weeks | 20/14 | 30 minutes, 5 days a week | Physical therapist‐assisted gait training by conventional method | 6 of 40 | 6 did not complete gait training | Published information | ||
| Not stated | Exowalk | 2 weeks | 25/13 | 60 minutes, 5 days a week | Physical therapist‐assisted gait training | 2 of 40 | 2 personal reasons | None | Published information | |
| Not stated | Lokomat | Unclear | Not stated | Not stated | Not stated | 1 of 21 | No dropouts; 2 serious adverse events (1 skin breakdown as a result of therapy, 1 second stroke during post‐treatment phase) | 1 dropout due to protocol violation; | Information as provided by study authors | |
| Not stated | Gait‐assistance robot (consisting of 4 robotic arms for thighs and legs, thigh cuffs, leg apparatuses, and a treadmill) | 4 weeks | 10/16 | 20 minutes, 5 times a week for 4 weeks, in addition to rehabilitation treatment | Range‐of‐motion exercises, muscle strengthening, rolling over and sit‐to‐stand and activity and gait exercises | 0 of 26 | None | None | Published information | |
| Mean modified Barthel Index, 55 points | Lokomat Pro | 6 weeks | 20/20 | 45 minutes, 3 times a week | General gait training using a treadmill | 0 of 40 | None | None | Published information | |
| Scandinavian Stroke Scale, 42 points | Gait Trainer | 3 weeks | 25/20 | 20 minutes, 5 times a week for 3 weeks, in addition to rehabilitation treatment | Walking over‐ground; all participants practised gait for 15 sessions over 3 weeks (each session lasted 20 minutes) | 0 of 45 | None | None | Published information | |
| Not stated | Gait Trainer | 3 weeks | 42/14 | 20 minutes, 5 times a week for 3 weeks, in addition to rehabilitation treatment | Over‐ground walking training; in the other control group, 1 or 2 physiotherapy sessions daily but not at the same intensity as in the other groups
| 9 of 56 | 5 dropouts | 4 dropouts | Published information | |
| Not stated | G‐EO system evolution | 30 minutes a day for 5 consecutive days | Not stated | 5 days in addition to botulinum toxin injection of calf muscles | None | 0 of 22 | None | None | Published information | |
| Mean Barthel Index, 37 points | Gait Trainer | 4 weeks | 124/31 | 20 minutes, 5 times a week | Physiotherapy every weekday for 4 weeks | 11 of 155 | 2 participants refused therapy, 1 increased cranial pressure, 1 relapsing pancreas tumour, 1 cardiovascular unstable | 4 participants refused therapy, 1 participant died,1 myocardial infarction | Published information | |
| Not stated | Lokomat | 2 weeks | 13/3 | A‐B‐A study: in phase A, 30 minutes, 5 days a week | Physiotherapy every weekday for 3 weeks (phase B) | 0 of 16 | None | None | Unpublished and published information provided by study authors. | |
| Mean NIHSS, 11 points | Lokomat | 6 weeks | 49/67 | 30 minutes, 3 times a week | Physiotherapy with additional gait training 3 times a week for 6 weeks | 6 of 46 | 2 participants with leg wounds, 1 with recurrent stroke, 1 refused therapy | 1 participant with recurrent stroke, 1 with pulmonary embolism | Unpublished and published information provided by study authors. | |
| Mean Barthel Index, 91 points | Hybrid assistive limb | 6 weeks | 14/4 | 30 minutes, 5 times a week, 30 sessions | Conventional physiotherapy | 0 of 18 | None | None | Published Information | |
| Not stated | Bionic leg device | 6 weeks | Not stated | 1 hour, 3 times a week for 6 weeks | Group exercises | 0 of 24 | None | None | Published information | |
| Mean FIM, 51 points | Robowalk | 3 months | 29/7 | 30 minutes, 5 days a week | Conventional physiotherapy | 4/40 | None | 2 medically unstable 2 withdrew | Published information | |
| Mean FIM, 79 points | Gait Master4 | 4 weeks | Not stated | 20 minutes, 2 or 3 times a week (12 sessions) | Non‐intervention (non‐training) | 0 of 12 | None | None | Published information | |
| Not stated | Stride Management Assist | 10 consecutive days | 29/12 | 1 to 2 hours with 10 minutes or longer including RAGT | Conventional gait training | 5/41 | 1 participant had trouble with leg brace; | 2 participants for personal reasons | Published information | |
| Mean NIHSS 7 points | Lokomat | 5 weeks | Not stated | 30 minutes, 5 sessions a week | Conventional gait training | 0 of 28 | None | None | Published information | |
| Not stated | GEAR system | 4 weeks | 6/20 | 40 minutes, 7 times a week | Conventional gait training | None | None | None | Published information | |
| Mean Barthel Index, 51 points | Gait Trainer | 4 weeks | 39/11 | 20 minutes, 5 times a week | Conventional physiotherapy alone, based on Bobath concept | 4 of 50 | None | 2 participants discharged before study end, 1 participant readmitted to an acute ward, 1 participant deteriorating condition | Published information | |
| Not stated | Lokomat | 2 weeks | Not stated | 30 minutes, 5 times a week | Conventional physiotherapy at home (focused on gait) | 0 of 22 | None | None | Published information | |
| Not stated | Lokomat | 8 weeks | Not stated | 30 minutes, twice a week | Over‐ground walking therapy | 0 of 30 | None | None | Unpublished and published information provided by study authors | |
| Not stated | Portable rehab robot (ankle device) | 6 weeks | Not stated | 3 times a week, 18 sessions | Stretching plantar flexors and active exercises for ankle mobility and strength | 0 of 24 | None | None | Published information | |
| Not stated | Single‐leg version of Hybrid Assistive Limb (HAL) | 4 weeks | 11/11 | 20 minutes, | Aimed to improve walking speed, endurance, balance, postural stability, and symmetry | 10 of 32 | 4 withdrew, 1 epilepsy, 1 technical reasons | 2 pneumonia, 2 discharged | Published information | |
| Not stated | Robot Suit Hybrid Assistive Limb (HAL) | 4 weeks | 7/5 only intervention group, control group not stated | 3 times a week, minutes not stated | Conventional gait training | 10 of 33 | 4 withdrew 1 medical problem 1 technical reasons | 2 medical reasons 2 early discharged | Published information | |
| Mean Barthel Index, 38 points | Gait Trainer | 2 weeks | 13/12 | 20 minutes, 5 times a week | Gait therapy including treadmill training with body weight support | 0 of 30 | None | None | Published information | |
| Not stated | Lokomat | 4 weeks (12 sessions) | 8/8 | 30 minutes, 3 times a week | 12 physiotherapy sessions including manually guided gait training (3 times a week over 4 weeks) | 0 of 16 | None | None | Published information | |
| Not stated | Exoskeleton ankle robot | 5 weeks | 14/5 | 30 minutes, | Gait training with passive ankle foot orthosis | 0 of 19 | None | None | Published information | |
| Mean NIHSS, 12 points | Lokomat | 3 weeks | 11/25 | 30 minutes per day, 5 days a week | Conventional physical therapy based on neurodevelopmental techniques developed by Bobath and the physiotherapy proposed by Karnath | 2 of 19 | 1 recurrent stroke | 1 pneumonia | Published information | |
| FIM: Functional Independence Measure. | ||||||||||
| Outcome or subgroup title | No. of studies | No. of participants | Statistical method | Effect size |
| 1.1 Independent walking at end of intervention phase, all electromechanical devices used (primary outcome) Show forest plot | 38 | 1567 | Odds Ratio (M‐H, Random, 95% CI) | 2.14 [1.57, 2.92] |
| 1.2 Independent walking at follow‐up after study end (primary outcome) Show forest plot | 6 | 496 | Odds Ratio (M‐H, Random, 95% CI) | 1.93 [0.72, 5.13] |
| 1.3 Walking velocity (metres per second) at end of intervention phase Show forest plot | 42 | 1600 | Mean Difference (IV, Random, 95% CI) | 0.06 [0.02, 0.10] |
| 1.4 Walking velocity (metres per second) at follow‐up Show forest plot | 13 | 727 | Mean Difference (IV, Random, 95% CI) | 0.07 [‐0.03, 0.17] |
| 1.5 Walking capacity (metres walked in 6 minutes) at end of intervention phase Show forest plot | 24 | 983 | Mean Difference (IV, Random, 95% CI) | 10.86 [‐5.72, 27.44] |
| 1.6 Walking capacity (metres walked in 6 minutes) at follow‐up Show forest plot | 11 | 612 | Mean Difference (IV, Random, 95% CI) | 7.76 [‐21.47, 36.99] |
| 1.7 Lost to study during intervention phase, dropouts Show forest plot | 62 | 2440 | Risk Difference (M‐H, Random, 95% CI) | ‐0.02 [‐0.04, 0.00] |
| 1.7.1 All studies using end‐effector devices | 14 | 716 | Risk Difference (M‐H, Random, 95% CI) | ‐0.02 [‐0.05, 0.02] |
| 1.7.2 All studies using exoskeleton devices | 41 | 1496 | Risk Difference (M‐H, Random, 95% CI) | ‐0.03 [‐0.05, 0.00] |
| 1.7.3 All studies using mobile devices | 4 | 146 | Risk Difference (M‐H, Random, 95% CI) | 0.00 [‐0.05, 0.06] |
| 1.7.4 All studies using ankle devices | 3 | 82 | Risk Difference (M‐H, Random, 95% CI) | 0.01 [‐0.09, 0.11] |
| 1.8 Death from all causes until end of intervention phase Show forest plot | 62 | 2440 | Risk Difference (M‐H, Random, 95% CI) | 0.00 [‐0.01, 0.01] |
| Outcome or subgroup title | No. of studies | No. of participants | Statistical method | Effect size |
| 2.1 Regaining independent walking ability Show forest plot | 38 | Odds Ratio (M‐H, Random, 95% CI) | Subtotals only | |
| 2.1.1 All studies with adequate sequence generation process | 22 | 1049 | Odds Ratio (M‐H, Random, 95% CI) | 1.93 [1.26, 2.96] |
| 2.1.2 All studies with adequate concealed allocation | 18 | 905 | Odds Ratio (M‐H, Random, 95% CI) | 1.90 [1.23, 2.95] |
| 2.1.3 All studies with blinded assessors for primary outcome | 17 | 836 | Odds Ratio (M‐H, Random, 95% CI) | 1.86 [1.22, 2.84] |
| 2.1.4 All studies without incomplete outcome data | 14 | 590 | Odds Ratio (M‐H, Random, 95% CI) | 2.23 [1.16, 4.29] |
| 2.1.5 All studies excluding the largest study ‐ Pohl 2007 | 37 | 1417 | Odds Ratio (M‐H, Random, 95% CI) | 1.74 [1.26, 2.39] |
| Outcome or subgroup title | No. of studies | No. of participants | Statistical method | Effect size |
| 3.1 Independent walking at end of intervention phase, all electromechanical devices used Show forest plot | 38 | Odds Ratio (IV, Random, 95% CI) | Subtotals only | |
| 3.1.1 Acute phase: less than or equal to 3 months after stroke | 22 | 1243 | Odds Ratio (IV, Random, 95% CI) | 1.96 [1.47, 2.62] |
| 3.1.2 Chronic phase: more than 3 months after stroke | 16 | 461 | Odds Ratio (IV, Random, 95% CI) | 1.20 [0.40, 3.65] |
| Outcome or subgroup title | No. of studies | No. of participants | Statistical method | Effect size |
| 4.1 Recovery of independent walking: ambulatory status at start of study Show forest plot | 38 | Odds Ratio (M‐H, Random, 95% CI) | Subtotals only | |
| 4.1.1 Studies that included independent walkers | 15 | 500 | Odds Ratio (M‐H, Random, 95% CI) | 1.38 [0.45, 4.20] |
| 4.1.2 Studies that included dependent and independent walkers | 9 | 340 | Odds Ratio (M‐H, Random, 95% CI) | 1.90 [1.11, 3.25] |
| 4.1.3 Studies that included dependent walkers | 14 | 732 | Odds Ratio (M‐H, Random, 95% CI) | 2.02 [1.27, 3.22] |
| 4.2 Walking velocity: ambulatory status at start of study Show forest plot | 40 | Mean Difference (IV, Random, 95% CI) | Subtotals only | |
| 4.2.1 Studies that included independent walkers | 22 | 715 | Mean Difference (IV, Random, 95% CI) | 0.02 [‐0.04, 0.09] |
| 4.2.2 Studies that included dependent and independent walkers | 7 | 226 | Mean Difference (IV, Random, 95% CI) | 0.04 [‐0.04, 0.11] |
| 4.2.3 Studies that included dependent walkers | 11 | 591 | Mean Difference (IV, Random, 95% CI) | 0.09 [0.02, 0.15] |
| Outcome or subgroup title | No. of studies | No. of participants | Statistical method | Effect size |
| 5.1 Different devices for regaining walking ability Show forest plot | 34 | Odds Ratio (M‐H, Random, 95% CI) | Subtotals only | |
| 5.1.1 All studies using end‐effector devices | 11 | 598 | Odds Ratio (M‐H, Random, 95% CI) | 1.90 [0.99, 3.63] |
| 5.1.2 All studies using exoskeleton devices | 18 | 685 | Odds Ratio (M‐H, Random, 95% CI) | 2.11 [1.36, 3.29] |
| 5.1.3 All studies using mobile devices | 3 | 106 | Odds Ratio (M‐H, Random, 95% CI) | Not estimable |
| 5.1.4 All studies using ankle devices | 2 | 63 | Odds Ratio (M‐H, Random, 95% CI) | Not estimable |
| 5.2 Different devices for regaining walking speed Show forest plot | 41 | Mean Difference (IV, Random, 95% CI) | Subtotals only | |
| 5.2.1 All studies using end‐effector devices | 13 | 665 | Mean Difference (IV, Random, 95% CI) | 0.12 [0.05, 0.19] |
| 5.2.2 All studies using exoskeleton devices | 23 | 742 | Mean Difference (IV, Random, 95% CI) | ‐0.00 [‐0.05, 0.04] |
| 5.2.3 All studies using mobile devices | 4 | 146 | Mean Difference (IV, Random, 95% CI) | 0.12 [‐0.07, 0.30] |
| 5.2.4 All studies using ankle devices | 2 | 58 | Mean Difference (IV, Random, 95% CI) | 0.11 [‐0.10, 0.31] |
| 5.3 Different devices for regaining walking capacity Show forest plot | 24 | 983 | Mean Difference (IV, Random, 95% CI) | 10.86 [‐5.72, 27.44] |
| 5.3.1 All studies using end‐effector devices | 7 | 416 | Mean Difference (IV, Random, 95% CI) | 31.22 [10.35, 52.08] |
| 5.3.2 All studies using exoskeleton devices | 13 | 468 | Mean Difference (IV, Random, 95% CI) | ‐8.32 [‐27.73, 11.08] |
| 5.3.3 All studies using mobile devices | 2 | 56 | Mean Difference (IV, Random, 95% CI) | 20.06 [‐39.52, 79.63] |
| 5.3.4 All studies using ankle devices | 2 | 43 | Mean Difference (IV, Random, 95% CI) | 49.23 [‐17.09, 115.55] |