Intervenciones psicosociales para mujeres embarazadas en programas ambulatorios de tratamiento de drogas ilegales en comparación con otras intervenciones
Información
- DOI:
- https://doi.org/10.1002/14651858.CD006037.pub3Copiar DOI

- Base de datos:
-
- Cochrane Database of Systematic Reviews
- Versión publicada:
-
- 02 abril 2015see what's new
- Tipo:
-
- Intervention
- Etapa:
-
- Review
- Grupo Editorial Cochrane:
-
Grupo Cochrane de Alcohol y drogas
- Copyright:
-
- Copyright © 2015 The Cochrane Collaboration. Published by John Wiley & Sons, Ltd.
Cifras del artículo
Altmetric:
Citado por:
Autores
Contributions of authors
All review authors screened the abstracts of all identified articles. Review authors independently assessed all relevant studies for inclusion. We resolved any conflicts by consensus.
Declarations of interest
Mishka Terplan declares no known conflicts of interest. Shaalini Ramanadhan declares no known conflicts of interest. Abigail Locke declares no known conflicts of interest. Nyaradzo Longinaker declares no known conflicts of interest. Steve Lui declares no known conflicts of interest.
Version history
| Published | Title | Stage | Authors | Version |
| 2015 Apr 02 | Psychosocial interventions for pregnant women in outpatient illicit drug treatment programs compared to other interventions | Review | Mishka Terplan, Shaalini Ramanadhan, Abigail Locke, Nyaradzo Longinaker, Steve Lui | |
| 2007 Oct 17 | Psychosocial interventions for pregnant women in outpatient illicit drug treatment programs compared to other interventions | Review | Mishka Terplan, Steve Lui | |
| 2006 Apr 19 | Psychosocial interventions for pregnant women in outpatient illicit drug treatment programs | Protocol | Mishka Terplan, David A Grimes, Steve Lui | |
Differences between protocol and review
None
Keywords
MeSH
Medical Subject Headings (MeSH) Keywords
- *Psychotherapy;
- Length of Stay;
- Patient Dropouts [statistics & numerical data];
- Pregnancy Complications [psychology, *therapy];
- Pregnancy Outcome;
- Pregnant Women [*psychology];
- Premature Birth [epidemiology];
- Randomized Controlled Trials as Topic;
- Reinforcement, Psychology;
- Substance‐Related Disorders [psychology, *therapy];
Medical Subject Headings Check Words
Female; Humans; Infant, Newborn; Pregnancy;
PICO
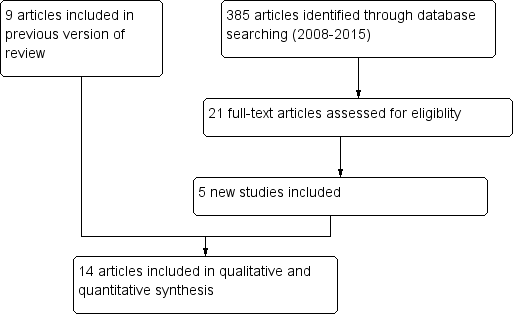
Study flow diagram.
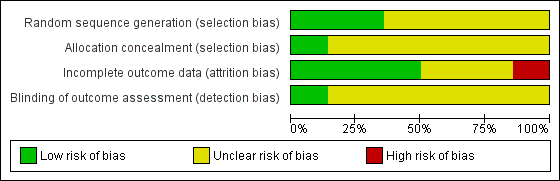
Risk of bias graph: review authors' judgements about each risk of bias item presented as percentages across all included studies.
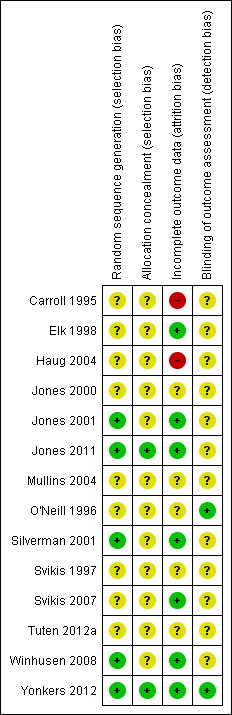
Risk of bias summary: review authors' judgements about each risk of bias item for each included study.
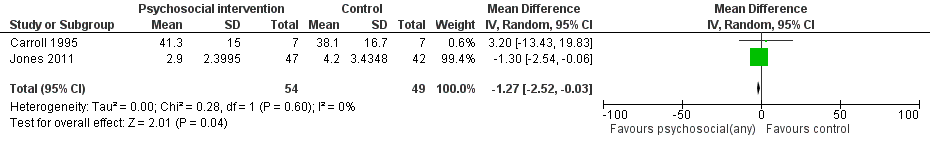
Forest plot of comparison: 1 Neonatal outcomes any psychosocial intervention vs. control, outcome: 1.5 Mean days hospitalized after delivery.
Forest plot of comparison: 2 CM vs. control, outcome: 3.1 Retention in treatment at the end of study.

Comparison 1 Any psychosocial intervention vs. control: neonatal outcomes, Outcome 1 Preterm birth (< 37 weeks gestation).

Comparison 1 Any psychosocial intervention vs. control: neonatal outcomes, Outcome 2 Positive neonatal toxicology at delivery (any drug).
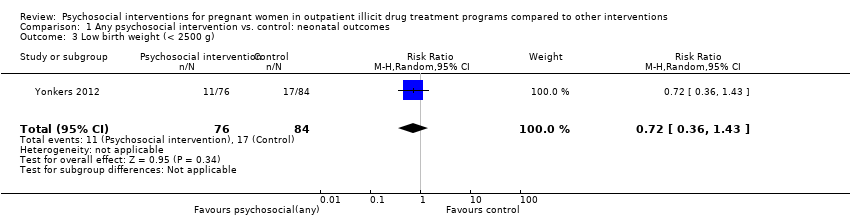
Comparison 1 Any psychosocial intervention vs. control: neonatal outcomes, Outcome 3 Low birth weight (< 2500 g).

Comparison 1 Any psychosocial intervention vs. control: neonatal outcomes, Outcome 4 Days hospitalized after delivery.

Comparison 2 Any psychosocial intervention vs. control: maternal outcomes, Outcome 1 Positive urine drug test (end of treatment).
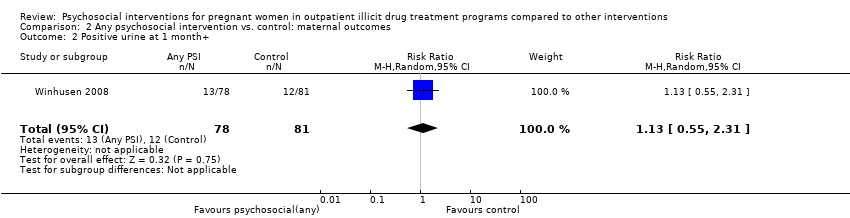
Comparison 2 Any psychosocial intervention vs. control: maternal outcomes, Outcome 2 Positive urine at 1 month+.

Comparison 2 Any psychosocial intervention vs. control: maternal outcomes, Outcome 3 Positive urine at delivery.

Comparison 2 Any psychosocial intervention vs. control: maternal outcomes, Outcome 4 Retention at treatment completion.

Comparison 2 Any psychosocial intervention vs. control: maternal outcomes, Outcome 5 Short term treatment retention.

Comparison 2 Any psychosocial intervention vs. control: maternal outcomes, Outcome 6 Retention in treatment at delivery.
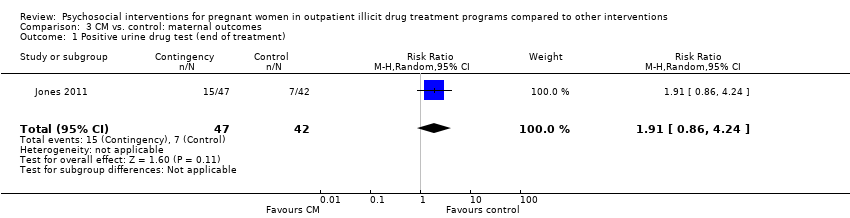
Comparison 3 CM vs. control: maternal outcomes, Outcome 1 Positive urine drug test (end of treatment).

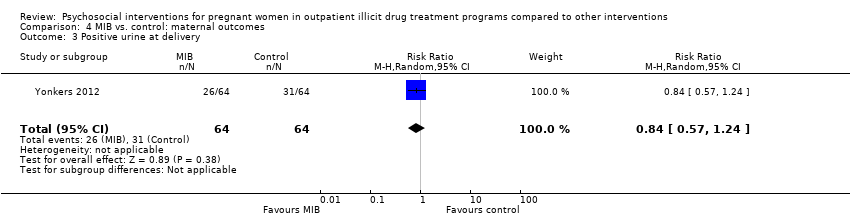
Comparison 3 CM vs. control: maternal outcomes, Outcome 2 Positive urine at delivery.
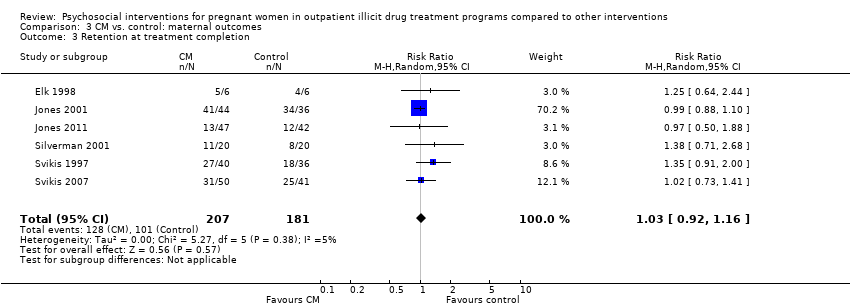
Comparison 3 CM vs. control: maternal outcomes, Outcome 3 Retention at treatment completion.

Comparison 3 CM vs. control: maternal outcomes, Outcome 4 Short term treatment retention.

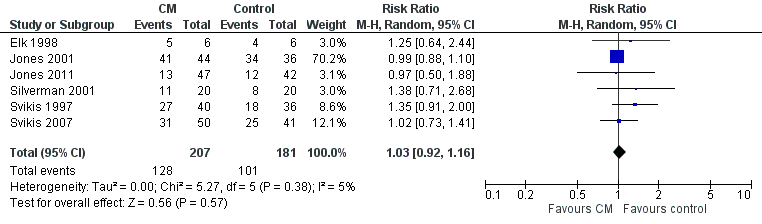
Comparison 3 CM vs. control: maternal outcomes, Outcome 5 Retention at delivery.

Comparison 4 MIB vs. control: maternal outcomes, Outcome 1 Positive urine drug test (end of treatment).

Comparison 4 MIB vs. control: maternal outcomes, Outcome 2 Positive urine drug test at three months (follow‐up).
Comparison 4 MIB vs. control: maternal outcomes, Outcome 3 Positive urine at delivery.
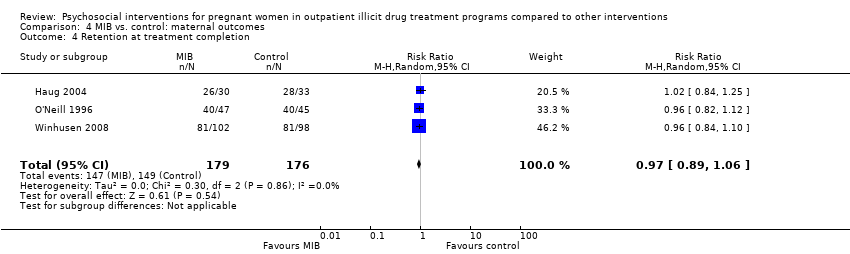
Comparison 4 MIB vs. control: maternal outcomes, Outcome 4 Retention at treatment completion.
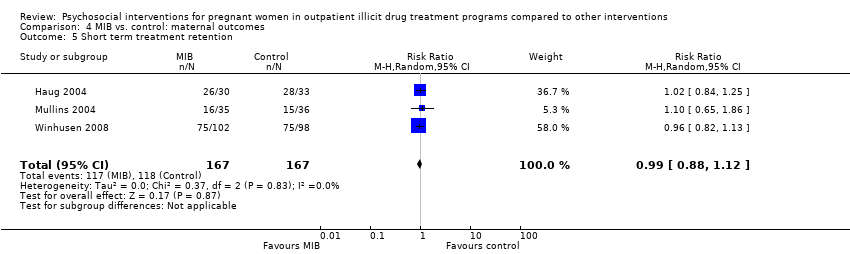
Comparison 4 MIB vs. control: maternal outcomes, Outcome 5 Short term treatment retention.
| Outcomes | Relative effect | No of participants | Quality of the evidence |
| Patients: Pregnant women enrolled in illicit drug treatment programs for any treatment of substance abuse or dependence of any drug Settings: Outpatient treatment facilities Intervention: Psychosocial interventions of any kind (including Contingency Management methods and Motivational Interviewing based techniques) alone or given in addition to usual care Comparison: Comprehensive usual care such as methadone maintenance, counselling, prenatal care (PNC), STD counselling and testing, transportation, and/or childcare | |||
| Preterm birth (< 37 weeks gestation) (Any psychosocial intervention vs. control) | RR 0.71 (95% CI 0.34 to 1.51) | 264 (3 studies) | ⊕⊕⊕⊝ |
| Low birth weight (< 2500 g) (Any psychosocial intervention vs. control) | RR 0.72 (95% CI 0.36 to 1.43) | 160 (1 study) | ⊕⊕⊕⊕ |
| Days hospitalized after delivery (Any psychosocial intervention vs. control) | MD ‐1.27 (95% CI ‐2.52 to ‐0.03) | 103 (2 studies) | ⊕⊕⊕⊝ |
| Retention at treatment completion (Any psychosocial intervention vs. control) | RR 0.99 (95% CI 0.93 to 1.06) | 743 (9 studies) | ⊕⊕⊝⊝ |
| Short term treatment retention (Any psychosocial intervention vs. control) | RR 1.00 (95% CI 0.90 to 1.10) | 514 (6 studies) | ⊕⊕⊝⊝ |
| Positive urine at delivery (Any psychosocial intervention vs. control) | RR 1.18 (95% CI 0.52 to 2.65) | 217 (2 studies) | ⊕⊕⊕⊕ high |
| Positive urine drug test (end of treatment) (Any psychosocial intervention vs. control) | RR 1.14 (95% CI 0.75 to 1.73) | 367 (3 studies) | ⊕⊕⊕⊝ |
| Retention at treatment completion (CM vs. control) | RR 1.03 (95% CI 0.92 to 1.16) | 388 (6 studies) | ⊕⊕⊝⊝ |
| Retention at treatment completion (MIB interventions vs. control) | RR 0.97 (95% CI 0.89 to 1.06) | 355 (3 studies) | ⊕⊕⊝⊝ |
| CI: Confidence interval; RR: Risk ratio; MD: Mean difference; CM: contingency management; MIB: motivational interviewing based. | |||
| GRADE Working Group grades of evidence | |||
| 1 Downgraded by one due to possible selection bias in one of the three included studies. 2 Downgraded by one due to possible attrition bias associated with one of the two studies. 3 Downgraded by two due to possible selection bias, attrition bias, and detection bias in majority of the included studies (all but two). 4 Downgraded by two due to possible selection bias, attrition bias, and detection bias in majority of the included studies (all but two). 5 Downgraded by one due to possible selection bias associated with one of the three studies. 6 Downgraded by two due to possible selection bias associated with four of the included studies. 7 Downgraded by two due to possible selection bias associated with two of the included studies. | |||
| Outcome or subgroup title | No. of studies | No. of participants | Statistical method | Effect size |
| 1 Preterm birth (< 37 weeks gestation) Show forest plot | 3 | 264 | Risk Ratio (M‐H, Random, 95% CI) | 0.71 [0.34, 1.51] |
| 2 Positive neonatal toxicology at delivery (any drug) Show forest plot | 1 | 89 | Risk Ratio (M‐H, Random, 95% CI) | 1.91 [0.86, 4.24] |
| 3 Low birth weight (< 2500 g) Show forest plot | 1 | 160 | Risk Ratio (M‐H, Random, 95% CI) | 0.72 [0.36, 1.43] |
| 4 Days hospitalized after delivery Show forest plot | 2 | 103 | Mean Difference (IV, Random, 95% CI) | ‐1.27 [‐2.52, ‐0.03] |
| Outcome or subgroup title | No. of studies | No. of participants | Statistical method | Effect size |
| 1 Positive urine drug test (end of treatment) Show forest plot | 3 | 367 | Risk Ratio (M‐H, Random, 95% CI) | 1.14 [0.75, 1.73] |
| 2 Positive urine at 1 month+ Show forest plot | 1 | 159 | Risk Ratio (M‐H, Random, 95% CI) | 1.13 [0.55, 2.31] |
| 3 Positive urine at delivery Show forest plot | 2 | 217 | Risk Ratio (M‐H, Random, 95% CI) | 1.18 [0.52, 2.65] |
| 4 Retention at treatment completion Show forest plot | 9 | 743 | Risk Ratio (M‐H, Random, 95% CI) | 0.99 [0.93, 1.06] |
| 5 Short term treatment retention Show forest plot | 6 | 514 | Risk Ratio (M‐H, Random, 95% CI) | 1.00 [0.90, 1.10] |
| 6 Retention in treatment at delivery Show forest plot | 1 | 89 | Risk Ratio (M‐H, Random, 95% CI) | 0.97 [0.50, 1.88] |
| Outcome or subgroup title | No. of studies | No. of participants | Statistical method | Effect size |
| 1 Positive urine drug test (end of treatment) Show forest plot | 1 | 89 | Risk Ratio (M‐H, Random, 95% CI) | 1.91 [0.86, 4.24] |
| 2 Positive urine at delivery Show forest plot | 1 | 89 | Risk Ratio (M‐H, Random, 95% CI) | 1.91 [0.86, 4.24] |
| 3 Retention at treatment completion Show forest plot | 6 | 388 | Risk Ratio (M‐H, Random, 95% CI) | 1.03 [0.92, 1.16] |
| 4 Short term treatment retention Show forest plot | 2 | 88 | Risk Ratio (M‐H, Random, 95% CI) | 1.10 [0.70, 1.73] |
| 5 Retention at delivery Show forest plot | 1 | 89 | Risk Ratio (M‐H, Random, 95% CI) | 0.97 [0.50, 1.88] |
| Outcome or subgroup title | No. of studies | No. of participants | Statistical method | Effect size |
| 1 Positive urine drug test (end of treatment) Show forest plot | 2 | 278 | Risk Ratio (M‐H, Random, 95% CI) | 0.96 [0.63, 1.48] |
| 2 Positive urine drug test at three months (follow‐up) Show forest plot | 1 | 159 | Risk Ratio (M‐H, Random, 95% CI) | 1.13 [0.55, 2.31] |
| 3 Positive urine at delivery Show forest plot | 1 | 128 | Risk Ratio (M‐H, Random, 95% CI) | 0.84 [0.57, 1.24] |
| 4 Retention at treatment completion Show forest plot | 3 | 355 | Risk Ratio (M‐H, Random, 95% CI) | 0.97 [0.89, 1.06] |
| 5 Short term treatment retention Show forest plot | 3 | 334 | Risk Ratio (M‐H, Random, 95% CI) | 0.99 [0.88, 1.12] |