Scolaris Content Display Scolaris Content Display

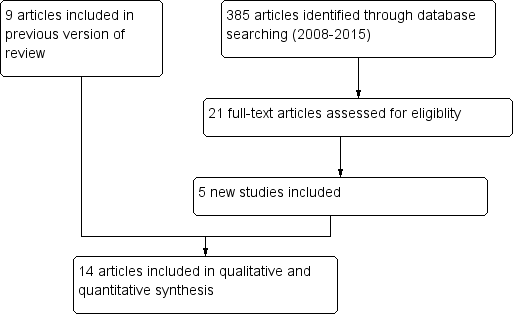
Study flow diagram.
Figuras y tablas -
Figure 1

Study flow diagram.

Risk of bias graph: review authors' judgements about each risk of bias item presented as percentages across all included studies.
Figuras y tablas -
Figure 2

Risk of bias graph: review authors' judgements about each risk of bias item presented as percentages across all included studies.

Risk of bias summary: review authors' judgements about each risk of bias item for each included study.
Figuras y tablas -
Figure 3

Risk of bias summary: review authors' judgements about each risk of bias item for each included study.

Forest plot of comparison: 1 Neonatal outcomes any psychosocial intervention vs. control, outcome: 1.5 Mean days hospitalized after delivery.
Figuras y tablas -
Figure 4

Forest plot of comparison: 1 Neonatal outcomes any psychosocial intervention vs. control, outcome: 1.5 Mean days hospitalized after delivery.

Forest plot of comparison: 2 CM vs. control, outcome: 3.1 Retention in treatment at the end of study.
Figuras y tablas -
Figure 5

Forest plot of comparison: 2 CM vs. control, outcome: 3.1 Retention in treatment at the end of study.

Comparison 1 Any psychosocial intervention vs. control: neonatal outcomes, Outcome 1 Preterm birth (< 37 weeks gestation).
Figuras y tablas -
Analysis 1.1

Comparison 1 Any psychosocial intervention vs. control: neonatal outcomes, Outcome 1 Preterm birth (< 37 weeks gestation).

Comparison 1 Any psychosocial intervention vs. control: neonatal outcomes, Outcome 2 Positive neonatal toxicology at delivery (any drug).
Figuras y tablas -
Analysis 1.2

Comparison 1 Any psychosocial intervention vs. control: neonatal outcomes, Outcome 2 Positive neonatal toxicology at delivery (any drug).

Comparison 1 Any psychosocial intervention vs. control: neonatal outcomes, Outcome 3 Low birth weight (< 2500 g).
Figuras y tablas -
Analysis 1.3

Comparison 1 Any psychosocial intervention vs. control: neonatal outcomes, Outcome 3 Low birth weight (< 2500 g).

Comparison 1 Any psychosocial intervention vs. control: neonatal outcomes, Outcome 4 Days hospitalized after delivery.
Figuras y tablas -
Analysis 1.4

Comparison 1 Any psychosocial intervention vs. control: neonatal outcomes, Outcome 4 Days hospitalized after delivery.

Comparison 2 Any psychosocial intervention vs. control: maternal outcomes, Outcome 1 Positive urine drug test (end of treatment).
Figuras y tablas -
Analysis 2.1

Comparison 2 Any psychosocial intervention vs. control: maternal outcomes, Outcome 1 Positive urine drug test (end of treatment).

Comparison 2 Any psychosocial intervention vs. control: maternal outcomes, Outcome 2 Positive urine at 1 month+.
Figuras y tablas -
Analysis 2.2

Comparison 2 Any psychosocial intervention vs. control: maternal outcomes, Outcome 2 Positive urine at 1 month+.

Comparison 2 Any psychosocial intervention vs. control: maternal outcomes, Outcome 3 Positive urine at delivery.
Figuras y tablas -
Analysis 2.3

Comparison 2 Any psychosocial intervention vs. control: maternal outcomes, Outcome 3 Positive urine at delivery.

Comparison 2 Any psychosocial intervention vs. control: maternal outcomes, Outcome 4 Retention at treatment completion.
Figuras y tablas -
Analysis 2.4

Comparison 2 Any psychosocial intervention vs. control: maternal outcomes, Outcome 4 Retention at treatment completion.

Comparison 2 Any psychosocial intervention vs. control: maternal outcomes, Outcome 5 Short term treatment retention.
Figuras y tablas -
Analysis 2.5

Comparison 2 Any psychosocial intervention vs. control: maternal outcomes, Outcome 5 Short term treatment retention.

Comparison 2 Any psychosocial intervention vs. control: maternal outcomes, Outcome 6 Retention in treatment at delivery.
Figuras y tablas -
Analysis 2.6

Comparison 2 Any psychosocial intervention vs. control: maternal outcomes, Outcome 6 Retention in treatment at delivery.

Comparison 3 CM vs. control: maternal outcomes, Outcome 1 Positive urine drug test (end of treatment).
Figuras y tablas -
Analysis 3.1

Comparison 3 CM vs. control: maternal outcomes, Outcome 1 Positive urine drug test (end of treatment).

Comparison 3 CM vs. control: maternal outcomes, Outcome 2 Positive urine at delivery.
Figuras y tablas -
Analysis 3.2

Comparison 3 CM vs. control: maternal outcomes, Outcome 2 Positive urine at delivery.

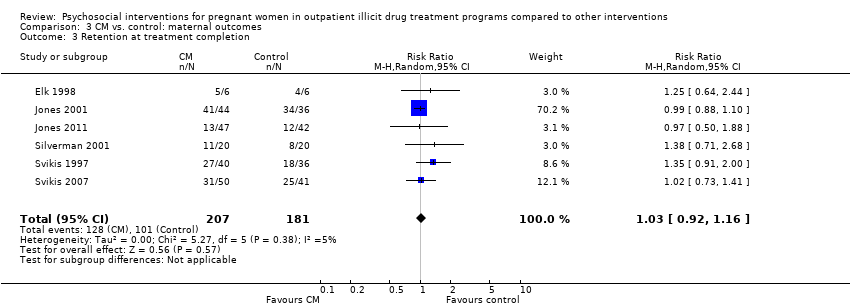
Comparison 3 CM vs. control: maternal outcomes, Outcome 3 Retention at treatment completion.
Figuras y tablas -
Analysis 3.3

Comparison 3 CM vs. control: maternal outcomes, Outcome 3 Retention at treatment completion.

Comparison 3 CM vs. control: maternal outcomes, Outcome 4 Short term treatment retention.
Figuras y tablas -
Analysis 3.4

Comparison 3 CM vs. control: maternal outcomes, Outcome 4 Short term treatment retention.

Comparison 3 CM vs. control: maternal outcomes, Outcome 5 Retention at delivery.
Figuras y tablas -
Analysis 3.5

Comparison 3 CM vs. control: maternal outcomes, Outcome 5 Retention at delivery.

Comparison 4 MIB vs. control: maternal outcomes, Outcome 1 Positive urine drug test (end of treatment).
Figuras y tablas -
Analysis 4.1

Comparison 4 MIB vs. control: maternal outcomes, Outcome 1 Positive urine drug test (end of treatment).

Comparison 4 MIB vs. control: maternal outcomes, Outcome 2 Positive urine drug test at three months (follow‐up).
Figuras y tablas -
Analysis 4.2

Comparison 4 MIB vs. control: maternal outcomes, Outcome 2 Positive urine drug test at three months (follow‐up).

Comparison 4 MIB vs. control: maternal outcomes, Outcome 3 Positive urine at delivery.
Figuras y tablas -
Analysis 4.3

Comparison 4 MIB vs. control: maternal outcomes, Outcome 3 Positive urine at delivery.

Comparison 4 MIB vs. control: maternal outcomes, Outcome 4 Retention at treatment completion.
Figuras y tablas -
Analysis 4.4

Comparison 4 MIB vs. control: maternal outcomes, Outcome 4 Retention at treatment completion.

Comparison 4 MIB vs. control: maternal outcomes, Outcome 5 Short term treatment retention.
Figuras y tablas -
Analysis 4.5

Comparison 4 MIB vs. control: maternal outcomes, Outcome 5 Short term treatment retention.

Summary of findings for the main comparison. Summary of findings table 1

Outcomes

Relative effect
(95% CI)

No of participants
(studies)

Quality of the evidence
(GRADE)

Patients: Pregnant women enrolled in illicit drug treatment programs for any treatment of substance abuse or dependence of any drug

Settings: Outpatient treatment facilities

Intervention: Psychosocial interventions of any kind (including Contingency Management methods and Motivational Interviewing based techniques) alone or given in addition to usual care

Comparison: Comprehensive usual care such as methadone maintenance, counselling, prenatal care (PNC), STD counselling and testing, transportation, and/or childcare

Preterm birth (< 37 weeks gestation)

(Any psychosocial intervention vs. control)

RR 0.71 (95% CI 0.34 to 1.51)

264 (3 studies)

⊕⊕⊕⊝
moderate 1

Low birth weight (< 2500 g)

(Any psychosocial intervention vs. control)

RR 0.72 (95% CI 0.36 to 1.43)

160 (1 study)

⊕⊕⊕⊕
high

Days hospitalized after delivery

(Any psychosocial intervention vs. control)

MD ‐1.27 (95% CI ‐2.52 to ‐0.03)

103 (2 studies)

⊕⊕⊕⊝
moderate 2

Retention at treatment completion

(Any psychosocial intervention vs. control)

RR 0.99 (95% CI 0.93 to 1.06)

743 (9 studies)

⊕⊕⊝⊝
low 3

Short term treatment retention

(Any psychosocial intervention vs. control)

RR 1.00 (95% CI 0.90 to 1.10)

514 (6 studies)

⊕⊕⊝⊝
low 4

Positive urine at delivery

(Any psychosocial intervention vs. control)

RR 1.18 (95% CI 0.52 to 2.65)

217 (2 studies)

⊕⊕⊕⊕

high

Positive urine drug test (end of treatment)

(Any psychosocial intervention vs. control)

RR 1.14 (95% CI 0.75 to 1.73)

367 (3 studies)

⊕⊕⊕⊝
moderate 5

Retention at treatment completion

(CM vs. control)

RR 1.03 (95% CI 0.92 to 1.16)

388 (6 studies)

⊕⊕⊝⊝
low 6

Retention at treatment completion

(MIB interventions vs. control)

RR 0.97 (95% CI 0.89 to 1.06)

355 (3 studies)

⊕⊕⊝⊝
low 7

CI: Confidence interval; RR: Risk ratio; MD: Mean difference; CM: contingency management; MIB: motivational interviewing based.

GRADE Working Group grades of evidence
High quality: Further research is very unlikely to change our confidence in the estimate of effect.
Moderate quality: Further research is likely to have an important impact on our confidence in the estimate of effect and may change the estimate.
Low quality: Further research is very likely to have an important impact on our confidence in the estimate of effect and is likely to change the estimate.
Very low quality: We are very uncertain about the estimate.

1 Downgraded by one due to possible selection bias in one of the three included studies.

2 Downgraded by one due to possible attrition bias associated with one of the two studies.

3 Downgraded by two due to possible selection bias, attrition bias, and detection bias in majority of the included studies (all but two).

4 Downgraded by two due to possible selection bias, attrition bias, and detection bias in majority of the included studies (all but two).

5 Downgraded by one due to possible selection bias associated with one of the three studies.

6 Downgraded by two due to possible selection bias associated with four of the included studies.

7 Downgraded by two due to possible selection bias associated with two of the included studies.

Figuras y tablas -
Summary of findings for the main comparison. Summary of findings table 1
Comparison 1. Any psychosocial intervention vs. control: neonatal outcomes

Outcome or subgroup title

No. of studies

No. of participants

Statistical method

Effect size

1 Preterm birth (< 37 weeks gestation) Show forest plot

3

264

Risk Ratio (M‐H, Random, 95% CI)

0.71 [0.34, 1.51]

2 Positive neonatal toxicology at delivery (any drug) Show forest plot

1

89

Risk Ratio (M‐H, Random, 95% CI)

1.91 [0.86, 4.24]

3 Low birth weight (< 2500 g) Show forest plot

1

160

Risk Ratio (M‐H, Random, 95% CI)

0.72 [0.36, 1.43]

4 Days hospitalized after delivery Show forest plot

2

103

Mean Difference (IV, Random, 95% CI)

‐1.27 [‐2.52, ‐0.03]

Figuras y tablas -
Comparison 1. Any psychosocial intervention vs. control: neonatal outcomes
Comparison 2. Any psychosocial intervention vs. control: maternal outcomes

Outcome or subgroup title

No. of studies

No. of participants

Statistical method

Effect size

1 Positive urine drug test (end of treatment) Show forest plot

3

367

Risk Ratio (M‐H, Random, 95% CI)

1.14 [0.75, 1.73]

2 Positive urine at 1 month+ Show forest plot

1

159

Risk Ratio (M‐H, Random, 95% CI)

1.13 [0.55, 2.31]

3 Positive urine at delivery Show forest plot

2

217

Risk Ratio (M‐H, Random, 95% CI)

1.18 [0.52, 2.65]

4 Retention at treatment completion Show forest plot

9

743

Risk Ratio (M‐H, Random, 95% CI)

0.99 [0.93, 1.06]

5 Short term treatment retention Show forest plot

6

514

Risk Ratio (M‐H, Random, 95% CI)

1.00 [0.90, 1.10]

6 Retention in treatment at delivery Show forest plot

1

89

Risk Ratio (M‐H, Random, 95% CI)

0.97 [0.50, 1.88]

Figuras y tablas -
Comparison 2. Any psychosocial intervention vs. control: maternal outcomes
Comparison 3. CM vs. control: maternal outcomes

Outcome or subgroup title

No. of studies

No. of participants

Statistical method

Effect size

1 Positive urine drug test (end of treatment) Show forest plot

1

89

Risk Ratio (M‐H, Random, 95% CI)

1.91 [0.86, 4.24]

2 Positive urine at delivery Show forest plot

1

89

Risk Ratio (M‐H, Random, 95% CI)

1.91 [0.86, 4.24]

3 Retention at treatment completion Show forest plot

6

388

Risk Ratio (M‐H, Random, 95% CI)

1.03 [0.92, 1.16]

4 Short term treatment retention Show forest plot

2

88

Risk Ratio (M‐H, Random, 95% CI)

1.10 [0.70, 1.73]

5 Retention at delivery Show forest plot

1

89

Risk Ratio (M‐H, Random, 95% CI)

0.97 [0.50, 1.88]

Figuras y tablas -
Comparison 3. CM vs. control: maternal outcomes
Comparison 4. MIB vs. control: maternal outcomes

Outcome or subgroup title

No. of studies

No. of participants

Statistical method

Effect size

1 Positive urine drug test (end of treatment) Show forest plot

2

278

Risk Ratio (M‐H, Random, 95% CI)

0.96 [0.63, 1.48]

2 Positive urine drug test at three months (follow‐up) Show forest plot

1

159

Risk Ratio (M‐H, Random, 95% CI)

1.13 [0.55, 2.31]

3 Positive urine at delivery Show forest plot

1

128

Risk Ratio (M‐H, Random, 95% CI)

0.84 [0.57, 1.24]

4 Retention at treatment completion Show forest plot

3

355

Risk Ratio (M‐H, Random, 95% CI)

0.97 [0.89, 1.06]

5 Short term treatment retention Show forest plot

3

334

Risk Ratio (M‐H, Random, 95% CI)

0.99 [0.88, 1.12]

Figuras y tablas -
Comparison 4. MIB vs. control: maternal outcomes