Intervenciones psicosociales para mujeres embarazadas en programas ambulatorios de tratamiento de drogas ilegales en comparación con otras intervenciones
Resumen
Antecedentes
El consumo de drogas ilegales durante el embarazo es un problema social y de salud pública complejo. Las consecuencias del consumo de drogas durante el embarazo son graves tanto para la mujer como para su bebé. Por lo tanto, es importante desarrollar y evaluar tratamientos efectivos. Existe evidencia de la efectividad de las intervenciones psicosociales en el tratamiento farmacológico, pero no está claro si son efectivas en mujeres embarazadas. Esta es una actualización de una revisión Cochrane publicada originalmente en 2007.
Objetivos
Evaluar la efectividad de las intervenciones psicosociales en mujeres embarazadas inscritas en programas de tratamiento por consumo de drogas ilegales sobre los resultados neonatales y del parto, sobre la asistencia y la permanencia en el tratamiento, así como sobre la abstinencia materna y neonatal de la drogas. En resumen, ¿se traducen las intervenciones psicosociales en un menor consumo de drogas ilegales, una mayor abstinencia, mejores resultados del parto o una mayor asistencia clínica?
Métodos de búsqueda
Se realizó la búsqueda bibliográfica original en mayo 2006 y se realizó la actualización de la búsqueda hasta enero 2015. Se realizaron búsquedas en el registro de ensayos del Grupo Cochrane de Drogas y Alcohol (Cochrane Drugs and Alcohol Group) (mayo de 2006 y enero de 2015), en el Registro Cochrane Central de Ensayos Controlados (Cochrane Central Register of Controlled Trials) (CENTRAL; en la Cochrane Library 2015, número 1), PubMed (1996 hasta enero de 2015), EMBASE (1996 hasta enero de 2015) y en CINAHL (1982 hasta enero de 2015).
Criterios de selección
Se incluyeron ensayos controlados aleatorizados que comparaban cualquier intervención psicosocial versus una intervención de control que podría incluir tratamiento farmacológico, como el mantenimiento con metadona, una intervención psicosocial diferente, asesoramiento, atención prenatal, asesoramiento y pruebas de ETS, transporte o puericultura.
Obtención y análisis de los datos
Se utilizaron los procedimientos metodológicos estándar previstos por la Colaboración Cochrane. Se realizaron análisis basados en tres comparaciones: cualquier intervención psicosocial versus control, intervenciones de técnicas tratamiento de contingencias (TC) versus control, e intervenciones basadas en entrevistas motivacionales (EM) versus control.
Resultados principales
En total, se incluyeron 14 estudios con 1298 participantes: nueve estudios (704 participantes) compararon TC versus control, y cinco estudios (594 participantes) compararon intervenciones EM versus control. No se encontraron estudios que evaluaran otros tipos de intervenciones psicosociales. En su mayor parte, no estaba claro si los estudios incluidos estaban adecuadamente controlados en cuanto a sesgos dentro de sus estudios, ya que dicha información, a menudo, no se informó. Se evaluó el riesgo de sesgo en los estudios incluidos en relación con la selección de participantes, la ocultación de la asignación, el cegamiento del personal y del evaluador de resultados, y el abandono.
Los ensayos incluidos rara vez captaron los resultados maternos y neonatales. Para los estudios que sí midieron tales resultados, no se observaron diferencias en las tasas de nacimientos prematuros (RR 0,71; intervalo de confianza [IC] del 95%: 0,34 a 1,51; tres ensayos, 264 participantes; evidencia de calidad moderada), la toxicidad materna al momento del parto (RR 1,18; IC del 95%: 0,52 a 2,65; dos ensayos, 217 participantes; evidencia de calidad moderada) o el bajo peso al nacer (RR 0,72; IC del 95%: 0,36 a 1,43; un ensayo, 160 participantes; evidencia de calidad moderada). Sin embargo, los resultados mostraron que los recién nacidos permanecieron en el hospital durante menos días después del parto en los grupos de intervención de TC (RR ‐1,27; IC del 95%: ‐2,52 a ‐0,03; dos ensayos, 103 participantes, evidencia de calidad moderada). No se observaron diferencias al final de los estudios en cuanto a la permanencia al tratamiento o la abstinencia al consumo (según lo evaluado por la prueba de detección de drogas al final del tratamiento) en ningún grupo de intervención psicosocial en comparación con el control (Permanencia al tratamiento: RR 0,99; IC del 95%: 0,93 a 1,06; nueve ensayos, 743 participantes; evidencia de calidad baja; y Abstinencia al consumo: RR 1,14; IC del 95%: 0,75 a 1,73; tres ensayos, 367 participantes; evidencia de calidad baja). Estos resultados se mantienen tanto para TC como para EM combinados. En general la calidad de la evidencia fue de baja a moderada.
Conclusiones de los autores
La presente evidencia indica que no hay diferencias en los resultados del tratamiento para abordar el consumo de drogas en mujeres embarazadas con intervenciones psicosociales, cuando se toman en presencia de otras opciones de atención integral. Sin embargo, pocos estudios evaluaron los resultados obstétricos o neonatales y rara vez lo hicieron de manera sistemática, lo que dificulta la evaluación del efecto de las intervenciones psicosociales sobre estos resultados clínicamente importantes. Es importante desarrollar una mejor base de evidencia para evaluar las modalidades psicosociales de tratamiento en esta importante población.
PICO
Resumen en términos sencillos
Intervenciones psicosociales para mujeres embarazadas en programas ambulatorios de tratamiento de drogas ilegales en comparación con otras intervenciones
Pregunta de la revisión
Se revisó la evidencia acerca del efecto de las intervenciones psicosociales, como las técnicas de tratamiento de contingencias (TC) y las técnicas basadas en entrevistas motivacionales (EM) versus la atención habitual para las mujeres embarazadas en programas de tratamiento ambulatorio de drogas ilegales.
Antecedentes
Las mujeres que consumen drogas ilegales durante el embarazo tienen más probabilidades de dar a luz de forma prematura y de tener hijos de bajo peso al nacer. Una mujer embarazada puede reducir el riesgo de estas complicaciones si recibe un tratamiento durante el embarazo por consumo de drogas.
Las intervenciones psicosociales, como las técnicas de TC y las EM, pueden ayudarles a superar las numerosas barreras para permanecer en un programa de tratamiento y reducir el consumo de drogas ilegales. El TC utiliza un refuerzo positivo y de apoyo con unos objetivos predeterminados como pueden ser la abstinencia del consumo de drogas o la asistencia al tratamiento y, si se cumplen, se dan incentivos como, por ejemplo, los vales monetarios. La EM es una forma de asesoramiento centrado en el paciente que se utiliza para resolver la inseguridades sobre el uso de drogas, el tratamiento o la interrupción de su uso.
Características de los estudios
Los investigadores de la Colaboración Cochrane examinaron la evidencia publicada hasta enero de 2015 e incluyeron 14 estudios con 1298 mujeres embarazadas en esta revisión Cochrane. Las 1298 mujeres embarazadas recibieron técnicas de TC o EM como complemento de otras opciones de atención integral; las mujeres del grupo de control recibieron atención habitual que incluía tratamiento farmacológico como mantenimiento con metadona, asesoramiento, atención prenatal, asesoramiento y pruebas de ETS, transporte y puericultura. Nueve estudios utilizaron técnicas de TC versus atención habitual, mientras que cinco estudios incluyeron técnicas de EM versus atención habitual.
Todos los estudios se hicieron en los Estados Unidos de América y la mayoría de las participantes eran afroamericanas. La mayoría de los estudios utilizaron los criterios del Diagnostic and Statistical Manual of Mental Disorders (DSM‐IV‐R) para determinar la farmacodependencia.
Resultados clave
No hubo diferencias en la permanencia al tratamiento o la abstinencia al consumo de drogas entre las técnicas de TC o EM y la atención habitual. Tampoco hubo diferencias en los resultados del parto entre los grupos.
En general, hay evidencia de calidad baja a moderada de los estudios incluidos. Los métodos de asignación a menudo se han descrito de manera muy limitada. Además, muchos estudios carecían de información sobre el desgaste, lo que podría haber tenido un impacto en los resultados. Aunque la información adicional relacionada con estos métodos podría ser útil, es poco probable que los ensayos aleatorizados futuros que utilicen intervenciones psicosociales muestren un beneficio. Además, hubo heterogeneidad significativa en cuanto a los métodos para medir los resultados.
Authors' conclusions
Summary of findings
| Outcomes | Relative effect | No of participants | Quality of the evidence |
| Patients: Pregnant women enrolled in illicit drug treatment programs for any treatment of substance abuse or dependence of any drug Settings: Outpatient treatment facilities Intervention: Psychosocial interventions of any kind (including Contingency Management methods and Motivational Interviewing based techniques) alone or given in addition to usual care Comparison: Comprehensive usual care such as methadone maintenance, counselling, prenatal care (PNC), STD counselling and testing, transportation, and/or childcare | |||
| Preterm birth (< 37 weeks gestation) (Any psychosocial intervention vs. control) | RR 0.71 (95% CI 0.34 to 1.51) | 264 (3 studies) | ⊕⊕⊕⊝ |
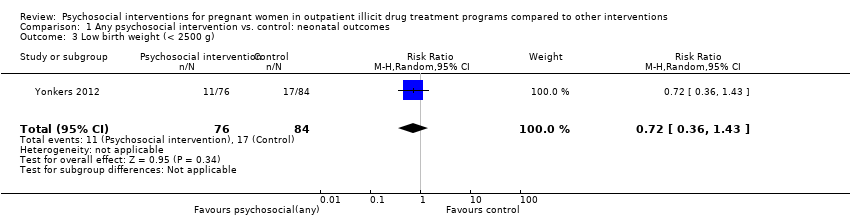
| Low birth weight (< 2500 g) (Any psychosocial intervention vs. control) | RR 0.72 (95% CI 0.36 to 1.43) | 160 (1 study) | ⊕⊕⊕⊕ |
| Days hospitalized after delivery (Any psychosocial intervention vs. control) | MD ‐1.27 (95% CI ‐2.52 to ‐0.03) | 103 (2 studies) | ⊕⊕⊕⊝ |
| Retention at treatment completion (Any psychosocial intervention vs. control) | RR 0.99 (95% CI 0.93 to 1.06) | 743 (9 studies) | ⊕⊕⊝⊝ |
| Short term treatment retention (Any psychosocial intervention vs. control) | RR 1.00 (95% CI 0.90 to 1.10) | 514 (6 studies) | ⊕⊕⊝⊝ |
| Positive urine at delivery (Any psychosocial intervention vs. control) | RR 1.18 (95% CI 0.52 to 2.65) | 217 (2 studies) | ⊕⊕⊕⊕ high |
| Positive urine drug test (end of treatment) (Any psychosocial intervention vs. control) | RR 1.14 (95% CI 0.75 to 1.73) | 367 (3 studies) | ⊕⊕⊕⊝ |
| Retention at treatment completion (CM vs. control) | RR 1.03 (95% CI 0.92 to 1.16) | 388 (6 studies) | ⊕⊕⊝⊝ |
| Retention at treatment completion (MIB interventions vs. control) | RR 0.97 (95% CI 0.89 to 1.06) | 355 (3 studies) | ⊕⊕⊝⊝ |
| CI: Confidence interval; RR: Risk ratio; MD: Mean difference; CM: contingency management; MIB: motivational interviewing based. | |||
| GRADE Working Group grades of evidence | |||
| 1 Downgraded by one due to possible selection bias in one of the three included studies. 2 Downgraded by one due to possible attrition bias associated with one of the two studies. 3 Downgraded by two due to possible selection bias, attrition bias, and detection bias in majority of the included studies (all but two). 4 Downgraded by two due to possible selection bias, attrition bias, and detection bias in majority of the included studies (all but two). 5 Downgraded by one due to possible selection bias associated with one of the three studies. 6 Downgraded by two due to possible selection bias associated with four of the included studies. 7 Downgraded by two due to possible selection bias associated with two of the included studies. | |||
Background
Description of the condition
Illicit drug use among pregnant women is an important and complex public health concern. Since the early 1990s, there has been a gradual increase in the incidence of illicit drug use in the United States of America (USA), especially among women of reproductive age (http://oas.samhsa.gov/women.htm). The most current data in the USA is from the 2012 National Survey on Drug Use and Health (http://oas.samhsa.gov/nhsda), in which 5.9% of pregnant women reported current illicit drug use. Furthermore, the data showed that 18.3% of pregnant women aged 15 to 17, 9.0% of women aged 18 to 25, and 3.4% of women aged 26 to 44 were current users of illicit drugs. A 2010 Australian survey also found that 4.2% of women who were pregnant, breastfeeding, or both in the past 12 months had used an illicit drug while pregnant (AIHW 2011).
Women who use illicit drugs are more likely to experience adverse obstetrical and perinatal outcomes than women in the general population (Ludlow 2004). Illicit drug use in pregnancy has been associated with preterm delivery, low birth weight infants, placental abruption, neonatal abstinence syndrome (NAS), and Neonatal Intensive Care Unit (NICU) admission (Sherwood 1999; Ludlow 2004). Cocaine, amphetamines, opioids, and marijuana use has been linked to premature labour, placental abruption, uterine rupture, fetal distress, neonatal addiction syndrome, and delay in cognitive development (Kuczkowski 2007). There is also conflicting evidence on long term adverse outcomes, especially among cocaine exposed infants. Although some studies have shown cognitive deficits at two years of life (Singer 2004), the bulk of the research points to minimal or absent effects in early childhood, as summarized well in a systematic review (Frank 2001).
Description of the intervention
Drug treatment interventions can be grouped into either pharmacological or psychosocial methods. This Cochrane review focuses only on psychosocial interventions, which involve the use of contingency management (CM) methods, including vouchers and other incentives, as well as manual‐based techniques such as motivational interviewing based (MIB) techniques. There are additional psychosocial interventions including cognitive behavioural therapy (CBT) and individual psychotherapy. We focused on CM and MIB techniques because they are the most common.
Contingency management
CM treatments are based on the principle of positive reinforcement as a means of operant conditioning that influences behaviour change. It is grounded in the work of Thorndike, especially in his "Law of Effect", which states that behavioural responses which produce a "satisfying" effect are "stamped in" by the experience and likely to occur more frequently than responses which produce an "annoying" effect (Thorndike 1898). This theory was elaborated by B.F. Skinner who examined the relationship between positive vs. negative reinforcement and positive vs. negative punishment in relation to behavioural outcome. Like Thorndike, his research (initially) involved the use of animals (a pigeon in a box rather than a cat in a maze). He demonstrated that punishment, regardless of whether positive or negative, decreases behaviour whereas reinforcement increases behaviour, and he attempted to describe the psycho‐dynamic mechanism by which this behaviour change was affected (Skinner 1947). The premise behind CM is to systematically use reinforcement techniques to modify behaviour in a positive and supportive manner. It has been used in the treatment of substance abuse since the 1970s (for a good review see Sitzer 2006). The most common form of CM has been the use of monetary vouchers, although prize reinforcers have also been used. CM was first demonstrated to be efficacious in both treatment retention and substance abstinence in cocaine‐dependent individuals (Higgins 1991), but has subsequently been studied in opioids, marijuana, cigarettes, alcohol, benzodiazepines, and multiple drugs. Recently it has been used in populations of pregnant illicit drug‐dependent women.
Motivational interviewing based
MIB techniques are cognitive‐behavioural interventions that are standardized and reproducible. They are based on motivational interviewing, a concept initially developed for the treatment of problem drinkers (Miller 2003). It is a directive, client‐centred counselling style for eliciting behaviour change by helping clients explore and resolve the ambivalence surrounding their substance use (Rollnick 1995). It draws from the trans‐theoretical model of change (DiClemente 1998) in order to improve treatment readiness and retention. The four included trials each employed a relatively brief MIB intervention. In Mullins 2004, participants in the intervention group received three one‐hour MIB sessions. In O'Neill 1996, the participants received a total of six sessions lasting 60 to 90 minutes each. The first session was MIB, whereas the subsequent sessions addressed strategies for avoiding high risk behaviours, including relaxation techniques and problem‐solving techniques. In Haug 2004, the most standardized form of MIB was employed: motivational enhancement therapy (MET). This involved four sessions each tailored to the person's stage of change. Winhusen 2008 employed three sessions, the first of which emphasized rapport building, reflective listening, and affirmation. The second session focused on providing feedback to the patient and a discussion of the benefits and consequences of substance use and pregnancy. The final session centred on either planning for behaviour change or strengthening commitment to behaviour change.
How the intervention might work
Drug treatment in pregnancy has been shown to reduce the maternal and fetal complications associated with illicit drug use (Kukko 1999; Armstrong 2003). Pregnancy can be considered as a "window of opportunity" for drug treatment intervention (Daley 1998). Maternal concern for the pregnancy has been thought of as a motivator to seek drug treatment. Although qualitative studies have documented maternal motivation (Murphy 1999; Dakof 2003), they have also described the many structural and social barriers to both receiving and remaining in treatment (Boyd 1999; Murphy 1999). To date, empirical research has failed to demonstrate better adherence rates to treatment among pregnant women compared with other people in drug treatment (Hser 1998). In fact, pregnant women may have higher dropout rates (Howell 2000). Since length of time in treatment is related to positive outcomes (Grella 2000; Howell 2000), it is important to identify modalities of treatment retention that are successful in this specific population. Psychosocial interventions can increase individual motivation to remain in treatment and decrease drug use through the use of incentives, or therapeutic techniques, or both (Amato 2011a; Amato 2011b)
Why it is important to do this review
The consequences of drug use in pregnancy are great for both the woman and her child (Ludlow 2004). Psychosocial interventions are widely used in drug treatment but it is unclear whether or not they work in pregnant women. As no other systematic reviews have been done on this subject since the first version of this Cochrane review (Terplan 2007), this update provides a valuable re‐evaluation of the effect of such interventions in this important population.
Objectives
To assess the effectiveness of psychosocial interventions for women enrolled in outpatient illicit drug treatment and to evaluate the effect of such interventions on increasing maternal and neonatal abstinence, and/or improving attendance and retention.
Methods
Criteria for considering studies for this review
Types of studies
Randomized controlled trials (RCTs).
Types of participants
Pregnant women enrolled in illicit drug treatment programmes for any treatment of substance abuse or dependence of any drug. Illicit drugs include illegal substances such as cannabis, heroin, cocaine, amphetamines, etc. We also included women on methadone treatment.
Types of interventions
Experimental
Psychosocial interventions of any kind alone or given in addition to usual care.
Control
-
Comprehensive usual care that included pharmacological treatment such as methadone maintenance, counselling, prenatal care (PNC), STD counselling and testing, transportation, and/or childcare;
-
A different psychosocial intervention;
-
No intervention.
Types of outcome measures
Primary outcomes
1. Neonatal outcomes:
-
Preterm birth (gestational age at birth < 37 weeks);
-
‐Neonatal toxicology at delivery;
-
Low birth weight (birth weight < 2500 g);
-
Length of time spent in hospital post delivery.
2. Maternal drug use measured by:
-
Maternal toxicology;
-
Maternal self‐reported drug use.
3. Adverse events for the mother of the child.
Secondary outcomes
4. Retention in treatment measured as number of subjects retained at the end of the study; or
5. Short term retention in treatment measured as number of subjects retained at the end of one month after enrolment in the study or greater but before study completion.
Search methods for identification of studies
Electronic searches
We have listed the search methods we used in the original version of this Cochrane review (Terplan 2007) in Appendix 1.
For the update performed up to 28 January 2015, we searched the following databases:
-
Cochrane Drugs and Alcohol Group Specialized Register (searched January 2015);
-
Cochrane Central Register of Controlled Trials (CENTRAL) (Cochrane Library 2015, Issue 1) (Appendix 2);
-
PubMed (August 2006 to January 2015) (Appendix 3);
-
EMBASE (August 2006 to January 2015) (Appendix 4);
-
CINAHL (August 2006 to January 2015) (Appendix 5).
We combined the PubMed search with the Cochrane highly sensitive search strategy for identifying randomized trials in MEDLINE: sensitivity‐maximizing version; PubMed format (2008 revision) (Lefebvre 2011).
In addition, we searched for ongoing clinical trials and unpublished studies via internet searches on the following sites:
-
ClinicalTrials.gov: www.clinicaltrials.gov (search date: 28 January 2015);
-
World Health Organization (WHO) International Clinical Trials Registry Platform (ICTRP) www.who.int/ictrp/en/ (search date: 10 January 2015).
Searching other resources
We reviewed the reference lists of all articles obtained as full reports to identify any further studies not retrieved by our electronic searches. We sought personal communication, conference abstracts, and unpublished trials from books chapters on treatment of opioid dependence. In addition, we checked the database of Selective Dissemination (SDI) and the National Institute on Health (NIH), Bethesda, USA to identify additional studies. We scanned internet websites, including the National Institute on Drug Abuse (USA), National Institute on Alcohol Abuse and Alcoholism (USA) and National Treatment Agency for Substance Misuse (UK).
We identified trials by handsearching a wide range of healthcare/addiction journals, including those not indexed in the main electronic databases and those published in non‐English languages. We did not apply any language restrictions to this Cochrane review.
Data collection and analysis
Selection of studies
All review authors independently assessed studies for inclusion. We resolved any conflicts by consensus.
Data extraction and management
All review authors independently extracted data. We discussed any disagreements and resolved them by consensus. We sought information from studies including: participant demographics, what and when interventions were performed, how and when drug screening was performed, screening results, measures of retention and abstinence, and prenatal and maternal outcomes (gestation length, birth weight, maternal and neonatal toxicity, and neonatal hospital stay length).
Assessment of risk of bias in included studies
We performed the 'Risk of bias' assessment for included RCTs and CCTs using the criteria recommended by the Cochrane Handbook for Systematic Reviews of Interventions (Higgins 2011). The 'Risk of bias' tool for assessing risk of bias in included studies is a two‐part tool, addressing seven specific domains, namely: sequence generation and allocation concealment (selection bias), blinding of participants and providers (performance bias), blinding of outcome assessor (detection bias), incomplete outcome data (attrition bias), selective outcome reporting (reporting bias), and other sources of bias. The first part of the tool involves describing what was reported to have happened in the study. The second part of the tool involves assigning a judgement relating to the risk of bias for that entry, in terms of either low, high, or unclear risk. We used the criteria indicated by the Cochrane Handbook for Systematic Reviews of Interventions adapted to the addiction field.
We assessed the domains of sequence generation and allocation concealment (avoidance of selection bias) using the 'Risk of bias' tool by a single entry for each study.
We considered blinding of participants, personnel and outcome assessor (avoidance of performance bias and detection bias) separately for objective outcomes (e.g. drop out, use of substance of abuse measured by urine‐analysis, subjects relapsed at the end of follow‐up, subjects engaged in further treatments) and subjective outcomes (e.g. duration and severity of signs and symptoms of withdrawal, patient self‐reported use of substance, side effects, social functioning as integration at school or at work, family relationship). Blinding of participants and personnel was generally not feasible given the type of intervention, so we did not consider this item. In addition, we assessed detection bias based on blinding of outcome assessors.
Incomplete outcome data (avoidance of attrition bias) was considered for all outcomes except for drop out from the treatment, which is very often the primary outcome measure in trials on addiction. We also considered whether exclusion criteria could be a source of bias and if intention‐to‐treat analysis was used.
Measures of treatment effect
For most of the included studies, retention and abstinence outcomes were reported in terms of proportion (given as a percent) of participants in each intervention arm to have specific outcomes. When possible, we analysed the results as dichotomous outcomes (e.g. retention vs. non‐retention in treatment) and reported them as a risk ratio (RR) with a 95% confidence intervals (CIs).
Dealing with missing data
When questions regarding data arose, we contacted the primary study author. We attempted to contact six study authors and four responded. However, none had data that would have allowed additional analyses.
Assessment of heterogeneity
We analysed heterogeneity by means of the I2 statistic and Chi2 test for heterogeneity. The cut‐off points were: I2 statistic value > 50% and the Chi2 test P < 0.1. Also, we evaluated the occurrence of heterogeneity and reported it qualitatively for included studies because of variability between chosen control populations in different studies. For the outcomes measured, different studies used many types of control groups including pharmacological, placebo, and other psychosocial interventions.
Data synthesis
We combined the RR value from each trial through meta‐analysis using a random‐effects model. Otherwise, we reported the mean difference for outcomes that measured average measures (birth weight and days hospitalized after delivery).
Sensitivity analysis
We did not use methodological quality as a criterion for trial inclusion. However, in order to assess the effect of the low quality studies we planned to do a sensitivity analysis, either including or excluding the studies at high risk of bias from meta‐analysis.
Results
Description of studies
Results of the search
The original Cochrane review yielded 263 records of which 44 were considered eligible and were reviewed as full texts (Terplan 2007). We included a total of nine articles. Updated searches done in January 2015 identified a further 385 papers. We screened these articles by title/abstract and of these we retrieved and assessed 21 full text articles. We included five of these trials. In total we included 14 trials in this review update (Figure 1).

Study flow diagram.
Included studies
Fourteen RCTs (1298 participants) met the inclusion criteria. All included studies were in the English language. For substantive descriptions of each of the included trials see the Characteristics of included studies section.
Trial duration
The duration of the included trials ranged from 14 days to 24 weeks.
Participants
We included a total of 1298 participants. Thirteen trials reported age and the mean age for those was 28.8 years. Two trials did not report the ethnicity of participants (O'Neill 1996; Yonkers 2012). All but three RCTs had a majority of African American participants. Carroll 1995 did not report ethnicity specifics, but most participants were non‐minority (11/14, 78.6%). Mullins 2004 reported 50% of participants were Caucasian and only 33% were African American. Winhusen 2008 reported 34.7% participants were African American women and 39.7% were Caucasian. Of the trials that reported ethnicity, on average 63.12% of participants were African American. All trials but O'Neill 1996 and Yonkers 2012 reported marital status. Overall, 79.8% of participants were single, never married, or divorced. All trials except O'Neill 1996 reported employment status for all participants. Overall, 88.6% of the trial participants were unemployed. Three studies did not report the educational level of participants (Carroll 1995; Jones 2001; Mullins 2004). Of the remaining studies, most participants had at least some high school education, either measured as a proportion (> 50%) or > 10 mean years of education. In Haug 2004, most participants had less than high school education (94%). Most trials did not mention gestational age at enrolment. Of the remaining trials, on average participants were enrolled during the second trimester, with the exception of Carroll 1995 in which the average gestational age was eight (± 6) weeks.
All but four studies (Carroll 1995; Winhusen 2008; Jones 2011; Tuten 2012a) used the Diagnostic and Statistical Manual of Mental Disorders (DSM‐III‐R or DSM‐IV‐R) criteria in the assessment of substance use among participants. With Carroll 1995, all participants can be assumed to be opioid dependent as they were receiving methadone maintenance. Many were also using cocaine (mean days of cocaine = 2.7 in 30 days prior to enrolment). Jones 2011 included participants if they had self‐reported heroin or cocaine use in the past 30 days. Participants reported an average of 14.9 days of opiate use over the past 30 days and an average of 13.4 days of cocaine use over the past 30 days. For Winhusen 2008, participants were identified by the participating treatment programmes as requiring substance abuse treatment, and no mention of DSM‐III‐R criteria was made. In Tuten 2012a, participants had an average of 13.4 days of use in the past 30 days for cocaine and 14.9 days of use in the past 30 days for opiates. In the remaining nine RCTs, 70% of participants were cocaine dependent, and 66.9% were opiate dependent. Only Mullins 2004 had no heroin‐using participants. Seven studies recorded both marijuana and alcohol use (O'Neill 1996; Svikis 1997; Jones 2001; Silverman 2001; Haug 2004;Mullins 2004; Svikis 2007). Within these studies, 23.7% of participants were marijuana dependent, and 17.9% were alcohol dependent. Only two trials recorded nicotine dependence (O'Neill 1996; Haug 2004), which was 99%. All included RCTs had high compliance with reporting.
Setting and country of origin
All included RCTs took place in the USA except for O'Neill 1996, which took place in Australia. All trials took place in drug treatment facilities that were either academic‐based, or hospital‐based, or both. All included trials were predominately in the outpatient setting. Five studies began in an inpatient setting (Jones 2000; Jones 2001; Svikis 2007; Jones 2011; Tuten 2012a) during which time randomization took place. All participants in these trials transitioned to outpatient management after seven days where they received the study intervention. Several trial sites provided free transportation and childcare to their participants. Jones 2000, Jones 2011, and Tuten 2012a also included on‐site PNC and psychiatric consultation. Mullins 2004 described their centre as providing "gender‐specific" treatment.
Study size
Study sizes ranged from 12 to 168 participants.
Types of interventions
Trials fell into two types of experimental interventions: nine with 704 participants used CM (Carroll 1995; Svikis 1997; Elk 1998; Jones 2000; Jones 2001; Silverman 2001; Svikis 2007; Jones 2011; Tuten 2012a), and five with 594 participants used MIB methods that involved motivational approaches (O'Neill 1996; Haug 2004; Mullins 2004; Winhusen 2008; Yonkers 2012).
With the exception of Silverman 2001 and Jones 2011, all RCTs applied CM in the form of monetary vouchers. In Silverman 2001, the concept of abstinent reinforcement contingencies were integrated into an employment setting referred to as the Therapeutic Workplace. The participants received work and salary only when they remained abstinent. For Jones 2011, CM methods were applied to housing. A key piece of the treatment plan in this study involved abstinence‐contingent housing.
Among the included trials, vouchers were tied to negative urine toxicology (Carroll 1995; Silverman 2001; Jones 2011; Tuten 2012a), treatment attendance (Svikis 1997; Svikis 2007), or both (Elk 1998; Jones 2000; Jones 2001). Although the original applications of CM to substance treatment involved a schedule of escalating reinforcement for sustained behaviours (e.g. Higgins 1991), only Jones 2000, Jones 2001, Svikis 2007, and Tuten 2012a used an escalating schedule.
Ten trials provided psychosocial interventions in addition to comprehensive usual care that included pharmacological treatment such as methadone maintenance, counselling, PNC, STD counselling and testing, transportation, and/or childcare (Carroll 1995; O'Neill 1996; Svikis 1997; Elk 1998; Jones 2000; Silverman 2001; Haug 2004; Mullins 2004; Jones 2011; Tuten 2012a). Eight RCTss (Carroll 1995; O'Neill 1996; Svikis 1997; Jones 2000; Silverman 2001; Haug 2004; Jones 2011; Tuten 2012a) also had patients in both the intervention and control groups receive methadone maintenance treatment (MMT).
For the control interventions, eight studies utilized usual care or comprehensive usual care (O'Neill 1996; Elk 1998; Jones 2000; Jones 2001; Silverman 2001; Haug 2004; Winhusen 2008; Jones 2011). Five of the fourteen studies used other psychosocial interventions for the control group (Carroll 1995; Svikis 1997; Mullins 2004; Tuten 2012a; Yonkers 2012). O'Neill 1996 used only MMT with the control group and no other interventions.
Excluded studies
We excluded 52 studies in total from this review. The reasons for exclusion were: study design did not meet inclusion criteria (i.e. it was not a RCT) (37 studies); study participants did not meet inclusion criteria, either not pregnant or not in treatment (seven studies); paper was a re‐analysis of already published data, in this case the primary paper that matched the inclusion criteria best was included (four studies); or intervention was not within the scope of the review (three studies). For further details, see the Characteristics of excluded studies section.
Risk of bias in included studies
Allocation
Only five studies reported an adequate method of randomization and were judged as having low risk of selection bias (Jones 2001; Silverman 2001; Winhusen 2008; Jones 2011; Yonkers 2012). In Jones 2001, randomization was performed via coloured chip selection from a hat (with replacement of the chip following each selection). Jones 2011 and Yonkers 2012 used a computer programme to generate randomized assignments. In Silverman 2001, a modified dynamic balanced randomization (Signorini 1993) was used to randomize patients sequentially to the treatment conditions. Winhusen 2008 used an urn randomization protocol, the details of which are limited, but which was likely sufficient to limit risk of bias. All other included trials simply reported that the groups were randomized, so were judged as having unclear risk of bias.
Only two trials adequately described an adequate method of allocation concealment (Jones 2011; Yonkers 2012). The remainder did not describe a method for allocation concealment and were judged as having an unclear risk of bias.
Blinding
Blinding of participants and providers was not considered because, given the type of interventions reviewed, blinding of the study participants and providers was impossible. There was only one mention in the included RCTs as to whether the outcomes were assessed in a blinded fashion. O'Neill 1996 stated that follow‐up assessments were conducted by an interviewer who was blind to the participants' assignments. Yonkers 2012 used an objective measure (urine toxicology) unlikely to be biased by lack of blinding. All other RCTs were judged as having an unclear risk of detection bias.
Incomplete outcome data
Seven studies were judged to have low risk of bias (Elk 1998; Jones 2001; Silverman 2001; Svikis 2007; Winhusen 2008; Jones 2011; Yonkers 2012). Carroll 1995 and Haug 2004 were judged as high risk of attrition bias. The other trials did not provide information about attrition from the study and were judged as having an unclear risk of bias
Other potential sources of bias
All included trials collected and reported baseline characteristics, such as demographic data. This allowed for the comparison of the study sample between intervention and control groups in all but two trials. Svikis 1997 reported information stratified by methadone maintenance status. Therefore, it was impossible to evaluate differences between intervention and control groups. Svikis 2007 only provided summary statistics for the entire study group, and we were unable to separate them by intervention vs. control group assignment. In the remaining studies, the groups were judged to be similar in terms of baseline drug use. With the exception of Haug 2004, demographic data between the groups were similar. In Haug 2004, the groups differed with respect to race; there was a higher proportion of Caucasians in the intervention group (23% vs. 6%).
We have provided summary figures related to the risk of bias of included studies (Figure 2; Figure 3).
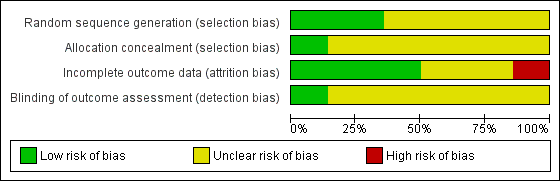
Risk of bias graph: review authors' judgements about each risk of bias item presented as percentages across all included studies.
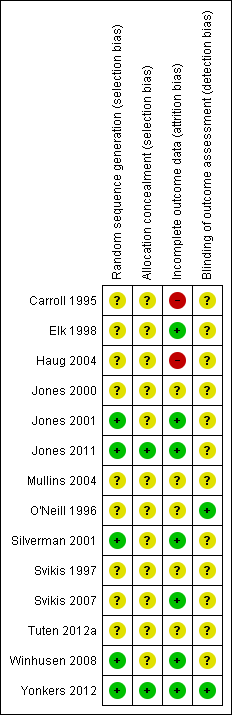
Risk of bias summary: review authors' judgements about each risk of bias item for each included study.
Effects of interventions
See: Summary of findings for the main comparison Summary of findings table 1
We considered the following types of comparisons:
-
Comparison 1: Any psychosocial vs. control, 14 RCTs, 1298 participants (Carroll 1995; O'Neill 1996; Svikis 1997; Elk 1998; Jones 2000; Jones 2001; Silverman 2001; Haug 2004; Mullins 2004; Svikis 2007: Winhusen 2008; Jones 2011; Tuten 2012a; Yonkers 2012);
-
Comparison 2: CM vs. control, nine RCTs, 704 participants (Carroll 1995; Svikis 1997; Elk 1998; Jones 2000; Jones 2001; Silverman 2001; Svikis 2007; Jones 2011; Tuten 2012a);
-
Comparison 3: MIB vs. control, five RCTs, 594 participants (O'Neill 1996; Haug 2004; Mullins 2004; Winhusen 2008; Yonkers 2012).
We summarized the results and compared them quantitatively when possible.
Comparison 1: Any psychosocial Intervention vs. control neonatal outcomes
See summary of findings Table for the main comparison.
Neonatal outcomes
Neonatal outcomes were rarely captured. Four RCTs reported neonatal outcomes (Carroll 1995; Elk 1998; Jones 2011; Yonkers 2012).
Preterm birth
Three trials (Elk 1998; Jones 2011; Yonkers 2012) with 264 participants (RR 0.71, 95% CI 0.34 to 1.51; three trials, 264 participants; Analysis 1.1) showed no difference in preterm birth. Carroll 1995 measured median gestational age at delivery. Women in the intervention group (both contingency management and motivational interviewing methods) had slightly longer gestations (40 vs. 38 weeks) than the control groups. Null hypothesis testing was not provided and our attempts to obtain further data from trial authors were not fruitful.
Positive neonatal toxicology at delivery
One trial (Jones 2011) with 89 participants (RR 1.91, 95% CI 0.86 to 4.24; one trial, 89 participants; Analysis 1.2).
Low birth weight
One trial (Yonkers 2012) (RR = 0.72, 95% CI 0.36 to 1.43; one trial, 160 participants; Analysis 1.3) showed no difference in low birth weight. Carroll 1995 measured median birth weight. Women in the intervention group had heavier infants (3.348 gm vs. 2.951 gm). Null hypothesis testing was not provided and our attempts to obtain data from the trial authors were not fruitful.
Days hospitalized after delivery
Two studies (Carroll 1995, Jones 2011) (RR = ‐1.27, 95% CI ‐2.52 to ‐0.03; two trials, 103 participants; Analysis 1.4; Figure 4) showed a decrease in days hospitalized after surgery. Elk 1998 stated that there was no difference in length of hospital detoxification for newborns between the intervention and control groups, although mean days or other summary statistics were not reported.

Forest plot of comparison: 1 Neonatal outcomes any psychosocial intervention vs. control, outcome: 1.5 Mean days hospitalized after delivery.
Adverse events
Elk 1998 reported adverse perinatal events between the groups (although "adverse perinatal events" were not clearly defined). Nobody in the intervention group had an adverse event, whereas 80% of the control group did: two had preterm labour and two delivered pre‐term (prior to 37 weeks). However, this difference was not statistically significant (P = 0.22).
Comparison 2: Any psychosocial Intervention vs. control neonatal outcomes maternal outcomes
Maternal drug use measured by maternal toxicology
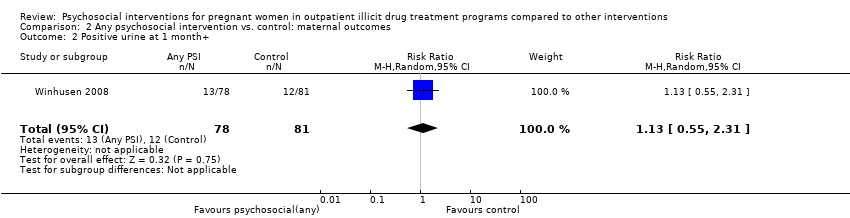
All but two included trials reported that urine toxicology was measured (Svikis 1997; Svikis 2007). However, only three RCTs included these data. We received raw data from the authors of Haug 2004 but were unable to incorporate these data into the meta‐analysis. The authors of Winhusen 2008 measured positive urine toxicology at one month of treatment (25.4% ‐ intervention group vs. 27.8% ‐ control group) and at treatment completion (16.7% intervention and 14.3% control). Jones 2011 and Yonkers 2012 also captured urine toxicology at the end of treatment. We performed a meta‐analysis from the available data for these three studies (Winhusen 2008; Jones 2011; Yonkers 2012): RR 1.14, 95% CI 0.75 to 1.73; three trials, 367 participants; Analysis 2.1). Pooling urine toxicology results at delivery only (Jones 2011; Yonkers 2012) (RR 1.18, 95% CI 0.52 to 2.65; two trials, 217 participants; Analysis 2.3).Overall for the four trials that employed MIB, there were no differences related to substance use. Among the trials employing CM, two trials showed a reduction in drug use measured by urine toxicology although the magnitude of this reduction was minimal and transient (Jones 2001) or difficult to assess (Silverman 2001).
Retention at treatment completion
Ten trials measured retention at the end of study treatment (O'Neill 1996; Svikis 1997; Elk 1998; Jones 2000; Jones 2001; Haug 2004; Mullins 2004; Svikis 2007; Winhusen 2008; Jones 2011): RR 0.99 (95% CI 0.93 to 1.06; 10 trials, 819 participants; Analysis 2.4).
Short term treatment retention
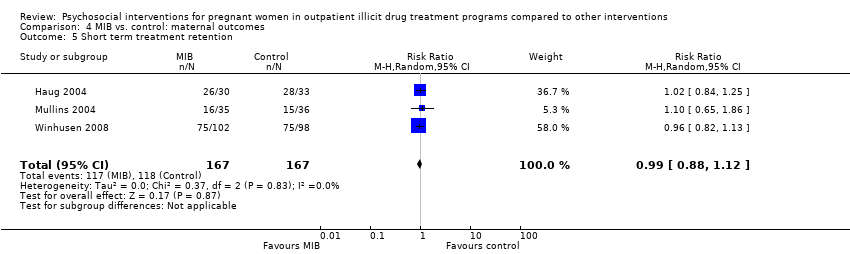
Early treatment retention was assessed by looking at retention at longer than one month but less than the time of treatment completion. Six RCTs including 514 participants had data beyond one month but less than the end of treatment date (O'Neill 1996; Svikis 1997; Elk 1998, Haug 2004; Mullins 2004; Winhusen 2008). The pooled estimates across these studies yielded: RR 1.00, 95% CI 0.90 to 1.10; six trials, 514 participants; Analysis 2.5. We performed sensitivity analysis by excluding Mullins 2004, but this did not alter the results.
Comparison 3 : CM interventions vs. control
For this comparison, only single studies addressed primary outcomes and therefore meta‐analysis was not possible.
Retention at treatment completion
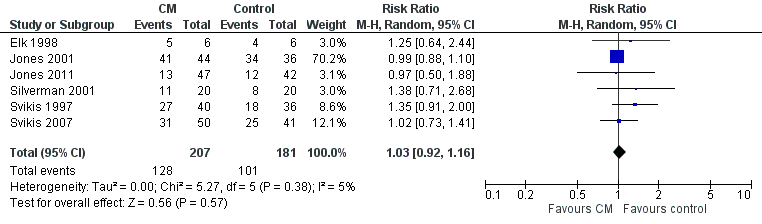
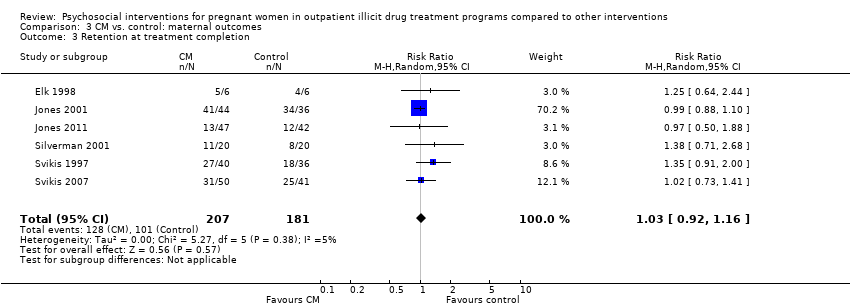
As previously described in the aggregate retention at treatment completion (Analysis 2.4), six studies utilizing CM interventions reported information related to retention in treatment (Svikis 1997; Elk 1998; Jones 2001; Silverman 2001; Svikis 2007; Jones 2011). RR 1.03, 95% CI 0.92 to 1.16; six trials, 388 participants; Analysis 3.3; Figure 5. Short term retention was described in two different studies (Elk 1998 and Svikis 1997). RR 1.10 (95% CI 0.70, 1.73; 2 trials, 88 participants; Analysis 3.4).

Forest plot of comparison: 2 CM vs. control, outcome: 3.1 Retention in treatment at the end of study.
Comparison 4 : MIB interventions vs. control
Maternal drug use measured by maternal toxicology
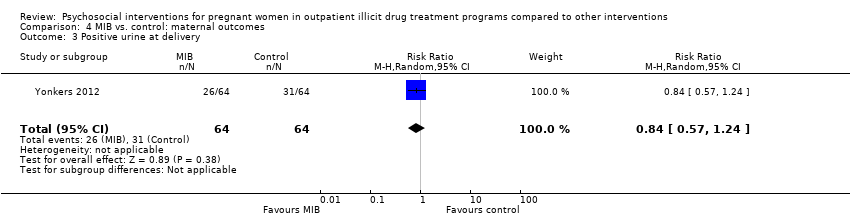
Related to the primary outcome of positive urine drug tests at the end of treatment only two MIB method trials (Winhusen 2008 and Yonkers 2012) had data, demonstrating no substantial difference in urine toxicology between the MIB intervention groups and the control groups. RR 0.96 (95% CI 0.63, 1.48; 2 trials 278 participants; Analysis 4.1)
Retention at treatment completion
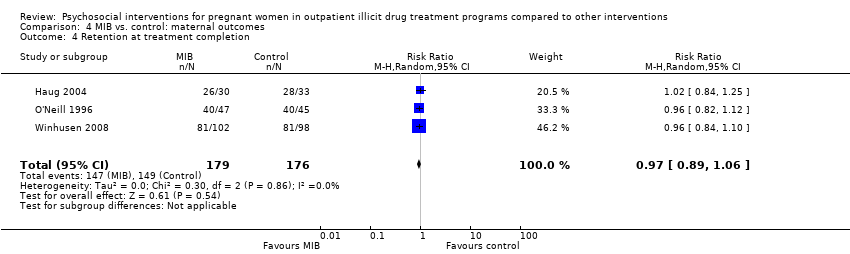
Three trials provided data on retention in treatment using MIB techniques (O'Neill 1996; Haug 2004; Winhusen 2008). Pooling these data via meta‐analysis resulted in: RR 0.97, 95% CI 0.89 to 1.06; three trials, 355 participants; Analysis 4.4).
Discussion
Summary of main results
We included 14 RCTs, nine that employed a form of CM and five that used a manual‐based intervention, namely MIB techniques. We did not identify any trials that assessed other types of psychosocial interventions. All interventions were compared with varied comprehensive usual care control.
Our main interest was in both obstetrical and neonatal outcomes of treatment. Illicit drug use is associated with a myriad of complications for both the pregnant woman and her newborn. These complications are costly and identifying a means of reducing their prevalence would be beneficial. Unfortunately, the included RCTs rarely reported on obstetrical or neonatal outcomes. Furthermore, four trials listed obstetrical events, such as early delivery and miscarriage, as exclusion criteria. Only four trials reported birth outcomes (Carroll 1995; Elk 1998; Jones 2011; Yonkers 2012). The three CM trials showed a benefit with intervention. There was also inconsistency between the studies with regards to the obstetrical outcomes measured. Carroll 1995 and Jones 2011 measured both mean gestational age and mean birth weight. However, Elk 1998 counted "adverse perinatal events", a category that included both preterm delivery, a serious obstetrical event, as well as preterm labour, a clinical event of far less significance.
Eleven included trials reported continued illicit drug use, as measured primarily by urine toxicology. All trials had abstinence as a goal of treatment except O'Neill 1996 which employed a harm reduction model. This was also the only study which relied exclusively on client self‐report to assess continued drug use. The frequency of urine sampling varied between studies, as did the methods of reporting the results. It was often unclear how the summary proportions had been generated and, with the exception of Elk 1998, none mentioned statistical adjustment for multiple testing. Overall, there appears to be little evidence that psychosocial interventions reduce continued illicit drug use in pregnant women enrolled in drug treatment. None of the trials that employed MIB techniques reported an effect of the intervention on drug abstinence. Of the two RCTs that reported an effect, both employed CM. However, the magnitude of the reduction was difficult to assess (Silverman 2001), and its effect was small and temporary (Jones 2001).
A primary goal of CM is to alter, if not to eliminate, drug use behaviours. Over the last decade, the clinical evidence demonstrating CM efficacy in reinforcing drug abstinence has been established (for a good summary see Sitzer 2006). This Cochrane review is the first to specifically address drug treatment in pregnancy. It appears that the benefits of CM on drug abstinence are not as profound in pregnant women as in the general population of people in drug treatment. MIB methods in contradistinction have not been shown to have consistent effects on subsequent abstinence (Miller 2003) in drug treatment. Similarly, our results show no benefit of MI in pregnancy, with a trend towards a negative effect.
Included trials reported retention in treatment most consistently of all outcomes. As with any surrogate outcome, its clinical utility is dependent upon the evidence of it as an intermediary to the important clinical outcome (Grimes 2005). In pregnancy, attendance in drug treatment has been shown to lead to increase birth weight, increase in one minute Apgars, and overall lower costs (Hubbard 1989; McCaul 1996; Svikis 1998). We found no difference in treatment retention either by CM or MIB techniques. Psychosocial interventions, either CM or MIB, did not improve treatment retention.
Overall, our Cochrane review identified few experimental studies of psychosocial interventions in pregnancy for illicit drug use. This is surprising given the wide use of such interventions in clinical treatment. Furthermore, it is unlikely that manual based interventions, such as MI, are used in isolation in clinical practice. Counsellors most likely use different parts of multiple modalities simultaneously. Even if a particular psychosocial intervention is found to be beneficial, its application may be limited by the realities of drug treatment.
It is important to note that sites where these psychosocial treatments were delivered also included supplementary services for both the experimental and control groups, including child care services, transportation, and housing. These additional services are likely to have contributed an overall effect to drug treatment outcomes, hence the differential contribution of the psychosocial intervention might have been difficult to observe. The drug treatment locations from where this review's data were obtained are likely more comprehensive than standard drug treatment centres that enrol pregnant women. We cannot assess whether psychosocial interventions in the absence of these additional services are beneficial to pregnant women.
Overall completeness and applicability of evidence
There were several limitations of the included RCTs. Overall trials were heterogeneous, differing in the details of both the intervention and the control, and employing different lengths of treatment. Some studies were quite small and likely underpowered, especially for obstetrical outcomes. The study settings were all similar (academic specialist drug dependence units primarily in the USA), as were the included participants. Although this decreases heterogeneity between trials, the results of this review may not be generalizable to other settings.
One of the limitations to CM is the cost. On average, CM participants in the included trials cost up to $1364 per client (Tuten 2012a). Clearly this limits the applicability of CM on a large scale. For this reason non‐cash incentives, such as vouchers, have been used. Silverman 2001 extended this concept to include job training.
It is important to acknowledge that many pregnant women are referred to drug treatment from the criminal justice system (Terplan 2010). Unfortunately, no included trials discussed the referral pattern of their respective patient populations. Manual based interventions, such as MI, are likely less effective among coerced people. In fact, they may be counterproductive. Actively engaging a pregnant woman before she is ready to change may be detrimental, especially when the intervention involves MIB techniques (Hettema 2005).
It is also important to note the characteristics of the included participants. The patients were overwhelmingly unemployed, poor, African American, and with low education levels. This limits the generalizability of the study results. The population of women who use illicit drugs in pregnancy is different from those enrolled in drug treatment, which differs from the population of women in treatment who participate in experimental trials. In general, the efficacy of psychosocial interventions may vary between these different patient subsets.
Quality of the evidence
The quality of reporting in the included studies was very poor so that for most items and studies a judgment of unclear risk of bias was given. A recurring issue was an observed heterogeneity between the included trials in terms of outcomes measurements. For example, trials measured urine toxicology differently (and at different time points). Similarly, retention in treatment definitions varied and were assessed at different time points between studies. See also summary of findings Table for the main comparison.
Potential biases in the review process
The data extraction and input process were consensus driven and several review authors verified this independently. We believe that we identified all relevant studies as we searched the grey literature, and contacted trial authors and field experts. However, we were unable to obtain additional data from some trial authors which would have enriched analysis of neonatal and urine toxicology outcomes. Given the absence of any effect of the interventions on retention or urine toxicology, it is unlikely that these additional data would have changed our summary meta‐analysis.
Agreements and disagreements with other studies or reviews
Since our first version of this Cochrane review (Terplan 2007), no other systematic reviews have been performed on this topic.
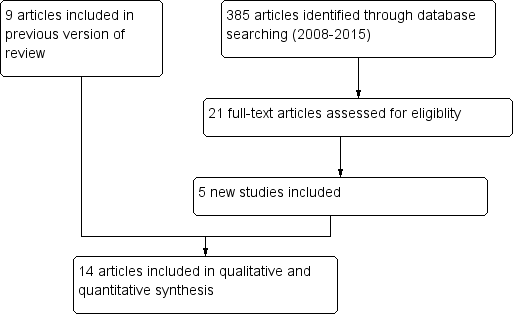
Study flow diagram.

Risk of bias graph: review authors' judgements about each risk of bias item presented as percentages across all included studies.

Risk of bias summary: review authors' judgements about each risk of bias item for each included study.
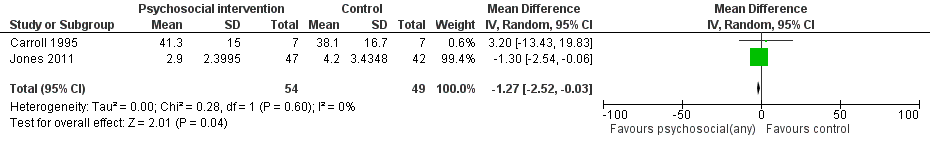
Forest plot of comparison: 1 Neonatal outcomes any psychosocial intervention vs. control, outcome: 1.5 Mean days hospitalized after delivery.
Forest plot of comparison: 2 CM vs. control, outcome: 3.1 Retention in treatment at the end of study.

Comparison 1 Any psychosocial intervention vs. control: neonatal outcomes, Outcome 1 Preterm birth (< 37 weeks gestation).

Comparison 1 Any psychosocial intervention vs. control: neonatal outcomes, Outcome 2 Positive neonatal toxicology at delivery (any drug).
Comparison 1 Any psychosocial intervention vs. control: neonatal outcomes, Outcome 3 Low birth weight (< 2500 g).

Comparison 1 Any psychosocial intervention vs. control: neonatal outcomes, Outcome 4 Days hospitalized after delivery.

Comparison 2 Any psychosocial intervention vs. control: maternal outcomes, Outcome 1 Positive urine drug test (end of treatment).
Comparison 2 Any psychosocial intervention vs. control: maternal outcomes, Outcome 2 Positive urine at 1 month+.

Comparison 2 Any psychosocial intervention vs. control: maternal outcomes, Outcome 3 Positive urine at delivery.

Comparison 2 Any psychosocial intervention vs. control: maternal outcomes, Outcome 4 Retention at treatment completion.

Comparison 2 Any psychosocial intervention vs. control: maternal outcomes, Outcome 5 Short term treatment retention.

Comparison 2 Any psychosocial intervention vs. control: maternal outcomes, Outcome 6 Retention in treatment at delivery.
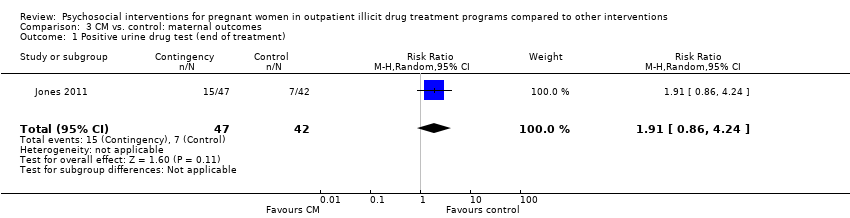
Comparison 3 CM vs. control: maternal outcomes, Outcome 1 Positive urine drug test (end of treatment).

Comparison 3 CM vs. control: maternal outcomes, Outcome 2 Positive urine at delivery.
Comparison 3 CM vs. control: maternal outcomes, Outcome 3 Retention at treatment completion.

Comparison 3 CM vs. control: maternal outcomes, Outcome 4 Short term treatment retention.

Comparison 3 CM vs. control: maternal outcomes, Outcome 5 Retention at delivery.

Comparison 4 MIB vs. control: maternal outcomes, Outcome 1 Positive urine drug test (end of treatment).

Comparison 4 MIB vs. control: maternal outcomes, Outcome 2 Positive urine drug test at three months (follow‐up).
Comparison 4 MIB vs. control: maternal outcomes, Outcome 3 Positive urine at delivery.
Comparison 4 MIB vs. control: maternal outcomes, Outcome 4 Retention at treatment completion.
Comparison 4 MIB vs. control: maternal outcomes, Outcome 5 Short term treatment retention.
| Outcomes | Relative effect | No of participants | Quality of the evidence |
| Patients: Pregnant women enrolled in illicit drug treatment programs for any treatment of substance abuse or dependence of any drug Settings: Outpatient treatment facilities Intervention: Psychosocial interventions of any kind (including Contingency Management methods and Motivational Interviewing based techniques) alone or given in addition to usual care Comparison: Comprehensive usual care such as methadone maintenance, counselling, prenatal care (PNC), STD counselling and testing, transportation, and/or childcare | |||
| Preterm birth (< 37 weeks gestation) (Any psychosocial intervention vs. control) | RR 0.71 (95% CI 0.34 to 1.51) | 264 (3 studies) | ⊕⊕⊕⊝ |
| Low birth weight (< 2500 g) (Any psychosocial intervention vs. control) | RR 0.72 (95% CI 0.36 to 1.43) | 160 (1 study) | ⊕⊕⊕⊕ |
| Days hospitalized after delivery (Any psychosocial intervention vs. control) | MD ‐1.27 (95% CI ‐2.52 to ‐0.03) | 103 (2 studies) | ⊕⊕⊕⊝ |
| Retention at treatment completion (Any psychosocial intervention vs. control) | RR 0.99 (95% CI 0.93 to 1.06) | 743 (9 studies) | ⊕⊕⊝⊝ |
| Short term treatment retention (Any psychosocial intervention vs. control) | RR 1.00 (95% CI 0.90 to 1.10) | 514 (6 studies) | ⊕⊕⊝⊝ |
| Positive urine at delivery (Any psychosocial intervention vs. control) | RR 1.18 (95% CI 0.52 to 2.65) | 217 (2 studies) | ⊕⊕⊕⊕ high |
| Positive urine drug test (end of treatment) (Any psychosocial intervention vs. control) | RR 1.14 (95% CI 0.75 to 1.73) | 367 (3 studies) | ⊕⊕⊕⊝ |
| Retention at treatment completion (CM vs. control) | RR 1.03 (95% CI 0.92 to 1.16) | 388 (6 studies) | ⊕⊕⊝⊝ |
| Retention at treatment completion (MIB interventions vs. control) | RR 0.97 (95% CI 0.89 to 1.06) | 355 (3 studies) | ⊕⊕⊝⊝ |
| CI: Confidence interval; RR: Risk ratio; MD: Mean difference; CM: contingency management; MIB: motivational interviewing based. | |||
| GRADE Working Group grades of evidence | |||
| 1 Downgraded by one due to possible selection bias in one of the three included studies. 2 Downgraded by one due to possible attrition bias associated with one of the two studies. 3 Downgraded by two due to possible selection bias, attrition bias, and detection bias in majority of the included studies (all but two). 4 Downgraded by two due to possible selection bias, attrition bias, and detection bias in majority of the included studies (all but two). 5 Downgraded by one due to possible selection bias associated with one of the three studies. 6 Downgraded by two due to possible selection bias associated with four of the included studies. 7 Downgraded by two due to possible selection bias associated with two of the included studies. | |||
| Outcome or subgroup title | No. of studies | No. of participants | Statistical method | Effect size |
| 1 Preterm birth (< 37 weeks gestation) Show forest plot | 3 | 264 | Risk Ratio (M‐H, Random, 95% CI) | 0.71 [0.34, 1.51] |
| 2 Positive neonatal toxicology at delivery (any drug) Show forest plot | 1 | 89 | Risk Ratio (M‐H, Random, 95% CI) | 1.91 [0.86, 4.24] |
| 3 Low birth weight (< 2500 g) Show forest plot | 1 | 160 | Risk Ratio (M‐H, Random, 95% CI) | 0.72 [0.36, 1.43] |
| 4 Days hospitalized after delivery Show forest plot | 2 | 103 | Mean Difference (IV, Random, 95% CI) | ‐1.27 [‐2.52, ‐0.03] |
| Outcome or subgroup title | No. of studies | No. of participants | Statistical method | Effect size |
| 1 Positive urine drug test (end of treatment) Show forest plot | 3 | 367 | Risk Ratio (M‐H, Random, 95% CI) | 1.14 [0.75, 1.73] |
| 2 Positive urine at 1 month+ Show forest plot | 1 | 159 | Risk Ratio (M‐H, Random, 95% CI) | 1.13 [0.55, 2.31] |
| 3 Positive urine at delivery Show forest plot | 2 | 217 | Risk Ratio (M‐H, Random, 95% CI) | 1.18 [0.52, 2.65] |
| 4 Retention at treatment completion Show forest plot | 9 | 743 | Risk Ratio (M‐H, Random, 95% CI) | 0.99 [0.93, 1.06] |
| 5 Short term treatment retention Show forest plot | 6 | 514 | Risk Ratio (M‐H, Random, 95% CI) | 1.00 [0.90, 1.10] |
| 6 Retention in treatment at delivery Show forest plot | 1 | 89 | Risk Ratio (M‐H, Random, 95% CI) | 0.97 [0.50, 1.88] |
| Outcome or subgroup title | No. of studies | No. of participants | Statistical method | Effect size |
| 1 Positive urine drug test (end of treatment) Show forest plot | 1 | 89 | Risk Ratio (M‐H, Random, 95% CI) | 1.91 [0.86, 4.24] |
| 2 Positive urine at delivery Show forest plot | 1 | 89 | Risk Ratio (M‐H, Random, 95% CI) | 1.91 [0.86, 4.24] |
| 3 Retention at treatment completion Show forest plot | 6 | 388 | Risk Ratio (M‐H, Random, 95% CI) | 1.03 [0.92, 1.16] |
| 4 Short term treatment retention Show forest plot | 2 | 88 | Risk Ratio (M‐H, Random, 95% CI) | 1.10 [0.70, 1.73] |
| 5 Retention at delivery Show forest plot | 1 | 89 | Risk Ratio (M‐H, Random, 95% CI) | 0.97 [0.50, 1.88] |
| Outcome or subgroup title | No. of studies | No. of participants | Statistical method | Effect size |
| 1 Positive urine drug test (end of treatment) Show forest plot | 2 | 278 | Risk Ratio (M‐H, Random, 95% CI) | 0.96 [0.63, 1.48] |
| 2 Positive urine drug test at three months (follow‐up) Show forest plot | 1 | 159 | Risk Ratio (M‐H, Random, 95% CI) | 1.13 [0.55, 2.31] |
| 3 Positive urine at delivery Show forest plot | 1 | 128 | Risk Ratio (M‐H, Random, 95% CI) | 0.84 [0.57, 1.24] |
| 4 Retention at treatment completion Show forest plot | 3 | 355 | Risk Ratio (M‐H, Random, 95% CI) | 0.97 [0.89, 1.06] |
| 5 Short term treatment retention Show forest plot | 3 | 334 | Risk Ratio (M‐H, Random, 95% CI) | 0.99 [0.88, 1.12] |