Insuflaciones sostenidas versus estándar durante la reanimación neonatal para prevenir la mortalidad y mejorar los resultados respiratorios
Resumen
Antecedentes
Al nacer, los pulmones de los recién nacidos están llenos de líquido. Para que los recién nacidos tengan una transición exitosa, este líquido debe ser reemplazado por aire para permitir una respiración efectiva. Cuando se considera que algunos recién nacidos presentan una respiración inadecuada al nacer, se les reanima con ventilación con presión positiva (VPP). Proporcionar insuflaciones prolongadas (sostenidas) al comienzo de la VPP puede ayudar a eliminar el líquido pulmonar y establecer el volumen de gas en los pulmones.
Objetivos
Evaluar la eficacia de la insuflación pulmonar sostenida (> 1 segundo de duración) inicial en comparación con las insuflaciones estándar (≤ 1 segundo) en los recién nacidos que reciben reanimación con VPP intermitente.
Métodos de búsqueda
Se utilizó la estrategia de búsqueda estándar del Grupo Cochrane de Neonatología (Cochrane Neonatal Review Group) para buscar en el Registro Cochrane Central de Ensayos Controlados (Cochrane Central Register of Controlled Trials) (CENTRAL; 2017, Número 1), MEDLINE vía PubMed (1966 hasta el 17 de febrero de 2017), Embase (1980 hasta el 17 de febrero de 2017) y en Cumulative Index to Nursing and Allied Health Literature (CINAHL; 1982 al 17 de febrero de 2017). También se buscaron ensayos controlados aleatorizados y cuasialeatorizados en las bases de datos de ensayos clínicos, las actas de congresos y las listas de referencias de los artículos recuperados..
Criterios de selección
Ensayos controlados aleatorizados (ECA) y cuasialeatorizados que compararon proporcionar insuflaciones pulmonares sostenidas (IPS) iniciales versus insuflaciones estándar a los recién nacidos que recibieron reanimación con VPP al nacer.
Obtención y análisis de los datos
La calidad metodológica de los ensayos incluidos se evaluó mediante los criterios del Grupo Cochrane para una Práctica y Organización Sanitaria Efectivas (Cochrane Effective Practice and Organisation of Care Group) (EPOC) (que evalúan la asignación al azar, el cegamiento, la pérdida durante el seguimiento y el procesamiento de los datos de resultado). El efecto del tratamiento se evaluó mediante el modelo de efectos fijos con el riesgo relativo (RR) para los datos categóricos y la media, la desviación estándar (DE) y la diferencia de medias ponderada (DMP) para los datos continuos. La calidad de la evidencia se evaluó mediante los criterios Grading of Recommendations Assessment, Development and Evaluation (GRADE).
Resultados principales
Ocho estudios con 941 recién nacidos cumplieron los criterios de inclusión. Los investigadores de siete ensayos (932 recién nacidos) administraron insuflación sostenida sin compresiones torácicas. El uso de insuflación sostenida no tuvo repercusión sobre los resultados primarios de esta revisión: mortalidad en la sala de partos (RR típico 2,66; intervalo de confianza [IC] del 95%: 0,11 a 63,40; 479 participantes; cinco estudios; I² no aplicable) y mortalidad durante la hospitalización (RR típico 1,01; IC del 95%: 0,67 a 1,51; 932 participantes; siete estudios; I² = 19%); la calidad de la evidencia fue baja para la muerte en la sala de partos (limitaciones en el diseño de los estudios e imprecisión de las estimaciones) y moderada para la muerte antes del alta (limitaciones en el diseño de la mayoría de los ensayos incluidos). Entre los resultados secundarios, la duración de la asistencia respiratoria mecánica fue más corta en el grupo con insuflación sostenida (diferencia de medias [DM] ‐5,37 días; IC del 95%: ‐6,31 a ‐4,43; 524 participantes; cinco estudios; I² = 95%; evidencia de calidad baja). La heterogeneidad, la significación estadística y la magnitud de los efectos de este resultado están en gran medida influenciados por un único estudio: Cuando este estudio se eliminó del análisis, el efecto se redujo en gran medida (DM ‐1,71 días; IC del 95%: ‐3,04 a ‐0,39; I² = 0%). Los resultados no mostraron diferencias en los otros resultados secundarios (p.ej. tasa de intubación endotraqueal fuera de la sala de partos a las 72 horas de edad [RR típico 0,93; IC del 95%: 0,79 a 1,09; 811 participantes; cinco estudios; I² = 0%]; necesidad de administración de surfactante durante el ingreso hospitalario [RR típico 0,97; IC del 95%: 0,86 a 1,10; 932 participantes; siete estudios; I² = 0%]; tasa de enfermedad pulmonar crónica [RR típico 0,95; IC del 95%: 0,74 a 1,22; 683 participantes; cinco estudios; I² = 47%]; neumotórax [RR típico 1,44; IC del 95%: 0,76 a 2,72; seis estudios; 851 recién nacidos; I² = 26%]; o la tasa de conducto arterioso persistente que requiere tratamiento farmacológico [RR típico 1,08; IC del 95%: 0,90 a 1,30; seis estudios; 745 recién nacidos; I² = 36%]). La calidad de la evidencia para estos resultados secundarios fue moderada (limitaciones en el diseño de la mayoría de los ensayos incluidos ‐ GRADE) excepto para el neumotórax (calidad baja: limitaciones en el diseño de los estudios e imprecisión de las estimaciones ‐ GRADE).
Conclusiones de los autores
La insuflación sostenida no fue mejor que la ventilación intermitente para reducir la mortalidad en la sala de partos y durante la hospitalización. El número de eventos en los ensayos fue limitado, por lo que no es posible excluir las diferencias. Cuando se consideraron los resultados secundarios, como la necesidad de intubación, la necesidad o duración de la asistencia respiratoria o la displasia broncopulmonar, no se encontró evidencia de efectos beneficiosos relevantes para la insuflación sostenida sobre la ventilación intermitente. La duración de la ventilación mecánica se redujo en el grupo de insuflación sostenida. Este resultado se debe interpretar con precaución porque puede estar influenciado por características del estudio diferentes de la intervención. Los ECA futuros deben tener como objetivo reclutar recién nacidos con mayor riesgo de morbilidad y mortalidad, estratificar a los participantes por edad gestacional y proporcionar una monitorización más detallada del procedimiento, incluidas las mediciones del volumen pulmonar y la presencia de apnea antes o durante la insuflación sostenida.
PICO
Resumen en términos sencillos
Insuflación pulmonar prolongada para la reanimación neonatal
Pregunta de la revisión
¿El uso de insuflaciones pulmonares sostenidas (> 1 segundo de duración) en comparación con las insuflaciones estándar (≤ 1 segundo) mejora la supervivencia y otros resultados importantes en los recién nacidos que reciben reanimación al nacer?
Antecedentes
Al nacer, los pulmones humanos están llenos de líquido que se debe reemplazar con aire para que los recién nacidos respiren adecuadamente. Algunos recién nacidos tienen dificultad para establecer una respiración efectiva al nacer y uno de cada 20 a 30 recién nacidos debe recibir ayuda para hacerlo. Se utilizan diversos dispositivos para ayudar a los recién nacidos a comenzar con lactantes a que comiencen la respiración normal. Algunos de estos dispositivos les permiten a los cuidadores proporcionar insuflaciones prolongadas (o sostenidas). Estas insuflaciones sostenidas pueden ayudar mejor a inflar los pulmones y mantenerlos inflados mejor, en comparación con no utilizarlas.
Características de los estudios
Se recopilaron y analizaron todos los estudios relevantes para responder a esta pregunta y se encontraron ocho estudios con 941 recién nacidos. En todos los estudios, los neonatos nacieron antes de la fecha prevista de parto (de 23 a 36 semanas de edad gestacional). La insuflación sostenida duró entre 15 y 20 segundos a una presión entre 20 y 30 cmH2O. La mayoría de los estudios proporcionaron una o más insuflaciones sostenidas adicionales en los casos de respuesta clínica deficiente, por ejemplo, frecuencia cardíaca baja persistente. Se analizó un estudio (que solo incluyó nueve recién nacidos) por separado porque los investigadores combinaron el uso de insuflación sostenida o estándar con compresiones torácicas.
Resultados clave
Los estudios incluidos no mostraron diferencias importantes entre los recién nacidos que recibieron insuflaciones sostenidas versus estándar en cuanto a mortalidad, necesidad de intubación durante los primeros tres días de vida o enfermedad pulmonar crónica. Los recién nacidos que reciben insuflación sostenida al nacer pueden pasar menos días con ventilación mecánica. Varios estudios en curso podrían ayudar a aclarar si puede haber diferencias entre las dos técnicas, ya que actualmente no es posible excluir que existan diferencias pequeñas o moderadas.
Calidad de la evidencia
La calidad de la evidencia es muy baja a moderada debido a que, en general, solo un número pequeño de estudios ha examinado esta intervención, el número total de recién nacidos incluidos en estos estudios fue bajo y algunos estudios podrían haber tenido un mejor diseño.
¿Cuál es el grado de actualización de esta revisión?
Se hicieron búsquedas de estudios que se habían publicado hasta febrero 2017.
Authors' conclusions
Summary of findings
| Use of initial sustained inflation compared with standard inflations in newborns receiving resuscitation with no chest compressions during resuscitation | ||||||
| Patient or population: preterm infants resuscitated using PPV at birth Settings: delivery room in Europe (Austria, Germany, Italy), Canada, Egypt, Thailand | ||||||
| Outcomes | Illustrative comparative risks* (95% CI) | Relative effect | No. of participants | Quality of the evidence | Comments | |
| Assumed risk | Corresponding risk | |||||
| Standard inflations in newborns receiving resuscitation with no chest compressions | Use of initial sustained inflation | |||||
| Death ‐ death in the delivery room | Study population | RR 2.66 | 479 | ⊕⊕⊝⊝ | ||
| 0 per 1000 | 0 per 1000 | |||||
| Death ‐ death before discharge | Study population | RR 1.01 | 932 | ⊕⊕⊕⊝ | ||
| 82 per 1000 | 83 per 1000 | |||||
| Need for mechanical ventilation | Study population | RR 0.87 | 484 | ⊕⊕⊕⊝ | ||
| 487 per 1000 | 424 per 1000 | |||||
| Chronic lung disease ‐ BPD any grade | Study population | RR 0.9 | 220 | ⊕⊕⊕⊝ | ||
| 483 per 1000 | 435 per 1000 | |||||
| Chronic lung disease ‐ moderate to severe BPD | Study population | RR 0.95 | 683 | ⊕⊕⊕⊝ | ||
| 257 per 1000 | 244 per 1000 | |||||
| Pneumothorax ‐ any time | Study population | RR 1.44 | 851 | ⊕⊕⊝⊝ | ||
| 33 per 1000 | 48 per 1000 | |||||
| Cranial ultrasound abnormalities ‐ intraventricular haemorrhage grade 3 to 4 | Study population | RR 0.89 | 635 | ⊕⊕⊕⊝ | ||
| 120 per 1000 | 107 per 1000 | |||||
| *The basis for the assumed risk (e.g. median control group risk across studies) is provided in footnotes. The corresponding risk (and its 95% confidence interval) is based on the assumed risk in the comparison group and the relative effect of the intervention (and its 95% CI) | ||||||
| GRADE Working Group grades of evidence | ||||||
| Assumed risk is the risk of the control arm. aLimitations in study design: all studies at high or unclear risk of bias in at least one domain | ||||||
| Use of initial sustained inflation compared with standard inflations in newborns receiving resuscitation with chest compressions during resuscitation | ||||||
| Patient or population: preterm infants resuscitated by PPV at birth Settings: delivery room in Europe (Austria, Germany, Italy), Canada, Egypt, Thailand | ||||||
| Outcomes | Illustrative comparative risks* (95% CI) | Relative effect | No. of participants | Quality of the evidence | Comments | |
| Assumed risk | Corresponding risk | |||||
| Standard inflations in newborns receiving resuscitation with chest compressions | Use of initial sustained inflation | |||||
| Death ‐ death before discharge | See comment | See comment | Not estimable | 9 | ⊕⊝⊝⊝ | Only 1 trial included |
| Chronic lung disease ‐ moderate to severe BPD | See comment | See comment | Not estimable | 7 | ⊕⊝⊝⊝ | Only 1 trial included |
| Pneumothorax ‐ any time | See comment | See comment | Not estimable | 9 | ⊕⊝⊝⊝ | Only 1 trial included |
| Cranial ultrasound abnormalities ‐ intraventricular haemorrhage grade 3 to 4 | See comment | See comment | Not estimable | 9 | ⊕⊝⊝⊝ | Only 1 trial included |
| *The basis for the assumed risk (e.g. median control group risk across studies) is provided in footnotes. The corresponding risk (and its 95% confidence interval) is based on the assumed risk in the comparison group and the relative effect of the intervention (and its 95% CI) | ||||||
| GRADE Working Group grades of evidence | ||||||
| Assumed risk is the risk of the control arm. aLimitations in study design: included study at high or unclear risk of bias in four domains | ||||||
Background
Description of the condition
At birth, infants' lungs are filled with fluid, which must be cleared for effective respiration to occur. Most newly born infants achieve this spontaneously and may use considerable negative pressure (up to ‐50 cmH2O) for initial inspirations (Karlberg 1962; Milner 1977). However, it is estimated that 3% to 5% of newly born infants receive some help to breathe at delivery (Saugstad 1998). Adequate ventilation is the key to successful neonatal resuscitation and stabilisation (Wyckoff 2015). Positive pressure ventilation (PPV) is recommended for infants who have absent or inadequate respiratory efforts, bradycardia, or both, at birth (Wyckoff 2015). Use of manual ventilation devices ‐ self‐inflating bags, flow‐inflating (or anaesthetic) bags, and T‐piece devices ‐ with a face mask or endotracheal tube (ETT) is advised. Although it is not included in the International Liaison Committee on Resuscitation (ILCOR) guidelines, respiratory support of infants in the delivery room with a mechanical ventilator and a nasopharyngeal tube has been described (Lindner 1999).
Description of the intervention
Devices recommended for PPV in the delivery room differ in terms of physical characteristics and ability to deliver sustained lung inflation (SLI). The most commonly used self‐inflating bag (O'Donnell 2004a; O'Donnell 2004b) may be of insufficient size to support sustained inflation (> 1 second). Both flow‐inflating bags and T‐pieces may be used to consistently deliver inflations > 1 second. Although target inflation pressures and long inspiratory times are achieved more consistently in mechanical models when T‐piece devices rather than bags are used, no recommendation can be made as to which device is preferable (Wyckoff 2015; Wyllie 2015). Positive end‐expiratory pressure (PEEP) is very important for aerating the lungs and improving oxygenation; SLI consists of prolonged high‐level PEEP.
How the intervention might work
When airways are liquid‐filled, it might be unnecessary to interrupt inflation pressures to allow the lung to deflate and exhale CO2 (Hooper 2016). Boon 1979 described a study of 20 term infants delivered by Caesarean section under general anaesthesia who were resuscitated with a T‐piece via an ETT. Trial authors reported that gas continued to flow through the flow sensor placed between the T‐piece and the ETT toward the infant at the end of a standard inflation of 1 second on respiratory traces obtained (Boon 1979). On the basis of this observation, this group performed a non‐randomised trial of sustained inflations given via a T‐piece and an ETT to nine term infants during delivery room resuscitation. Investigators reported that initial inflation with a T‐piece lasting 5 seconds produced a two‐fold increase in inflation volume compared with standard resuscitation techniques (Vyas 1981). Citing these findings, a retrospective cohort study described the effects of a change in management strategy for extremely low birth weight infants in the delivery room (Lindner 1999). The new management strategy included the introduction of an initial sustained inflation of 15 seconds obtained with a mechanical ventilator via a nasopharyngeal tube. This change in strategy was associated with a reduction in the proportion of infants intubated for ongoing respiratory support without an apparent increase in adverse outcomes. Pulmonary morbidity in very low birth weight infants was reported to be related directly to mortality in 50% of cases of death (Drew 1982). Moreover, multiple SLIs in very preterm infants improved both heart rate and cerebral tissue oxygen saturation, in the absence of any detrimental effects (Fuchs 2011). An observational study showed that sustained inflation of 10 seconds at 25 cmH2O in 70 very preterm infants at birth was not effective for infants who were not breathing, possibly owing to active glottic adduction (van Vonderen 2014). Newly born infants frequently take a breath and then prolong expiration via glottic closure and diaphragmatic braking, giving themselves prolonged end‐expiratory pressure.
Why it is important to do this review
Recommendations regarding use of sustained inflation at birth have varied between international bodies. Although European Resuscitation Council guidelines suggest giving five inflation breaths if the newborn is gasping or is not breathing (Wyllie 2015), the American Heart Association states that evidence is insufficient to recommend an optimum inflation time (Wyckoff 2015). Differences between these guidelines and their algorithms are intriguing (Klingenberg 2016). A narrative review reported that sustained inflation may reduce the need for mechanical ventilation among preterm infants at risk for respiratory distress syndrome (RDS) (Lista 2010). The same review showed that respiratory outcomes among infants receiving sustained inflation (25 cmH2O for 15 seconds) were improved over those reported for an historical group (Lista 2011).
This review updates the existing review "Sustained versus standard inflations during neonatal resuscitation to prevent mortality and improve respiratory outcomes", which was published in the Cochrane Database of Systematic Reviews in 2015 (O'Donnell 2015).
Objectives
To assess the efficacy of an initial sustained (> 1 second duration) lung inflation (SLI) versus standard inflations (≤ 1 second) in newborn infants receiving resuscitation with intermittent PPV.
Métodos
Obtención y análisis de los datos
Evaluación del riesgo de sesgo de los estudios incluidos
Results
Description of studies
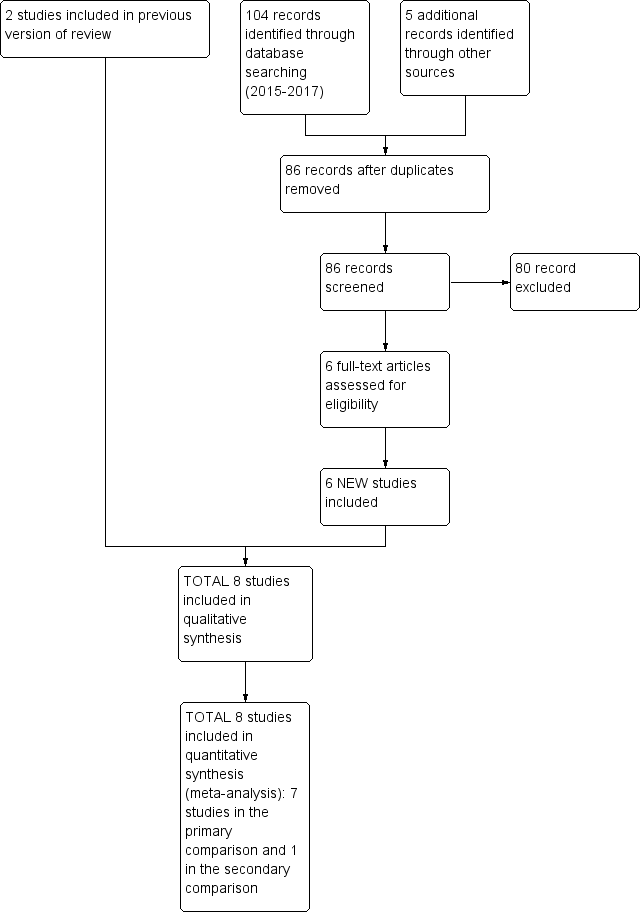
We have provided results of the search for this review update in the study flow diagram (Figure 1).

Study flow diagram: review update.
See Characteristics of included studies,Characteristics of excluded studies, and Characteristics of ongoing studies sections for details.
Included studies
Eight trials recruiting 941 infants (473 in SLI groups, 468 in control groups) met the inclusion criteria (El‐Chimi 2017; Jiravisitkul 2017; Lindner 2005; Lista 2015; Mercadante 2016; Ngan 2017; Schmölzer 2015; Schwaberger 2015). We pooled seven trials (with 932 infants) in the primary comparison (i.e. use of sustained inflation with no chest compressions) (El‐Chimi 2017; Jiravisitkul 2017; Lindner 2005; Lista 2015; Mercadante 2016; Ngan 2017; Schwaberger 2015). In contrast to other trials, Schwaberger 2015 sought to use near‐infrared spectroscopy (NIRS) to investigate whether SLI affected physiological changes in cerebral blood volume and oxygenation. We could not perform any meta‐analysis in the secondary comparison (intervention superimposed on uninterrupted chest compressions) because we included only one trial (a pilot study of nine preterm infants) (Schmölzer 2015).
We have listed characteristics of populations and interventions and comparisons of the eight trials under Characteristics of included studies and in Table 1.
| Trial (no. infants) | Antenatal steroids | Gestational age, weeks | Birth weight, grams | Device/Interface | Interventions/Controls | ||||
| SLI | Control | SLI | Control | SLI | Control | SLI and control | SLI | Control | |
| El‐Chimi 2017 (112) | 39% | 34.5% | mean 31.1 (SD 1.7) | mean 31.3 (SD 1.7) | mean 1561 (SD 326) | mean 1510 (SD 319) | Mask and T‐piece in SLI group Mask and self‐inflating bag with an oxygen reservoir in control group | PIP of 20 cmH2O for 15 seconds, followed by PEEP of 5 cmH2O If needed: a second SLI of 15 seconds of 25 cmH2O for 15 seconds, followed by PEEP of 6 cmH2O; then a third SLI of 15 seconds of 30 cmH2O for 15 seconds, followed by PEEP of 7 cmH2O If still not satisfactory: intubated in delivery room | PIP maximum 40 cmH2O, rate of 40 to 60 breaths/min for 30 seconds |
| Jiravisitkul 2017 (81) | 63% | 74% | 25 to 28 weeks: 29 to 32 weeks: | 25 to 28 weeks: 29 to 32 weeks: | mean 1206 (SD 367) | mean 1160 (SD 411) | Mask and T‐piece | PIP of 25 cmH2O for 15 seconds If HR 60 to 100 beats/min and/or poor respiratory effort: a second SLI (25 cmH2O, 15 seconds) | PIP 15 to 20 cmH2O, PEEP 5 cmH2O for 30 seconds, followed by resuscitation according to AHA guidelines |
| Lindner 2005 (61) | 81% | 80% | median 27.0 (IQR 25.0 to 28.9) | median 26.7 (IQR 25.0 to 28.9) | median 870 (IQR 410 to 1320) | median 830 (IQR 370 to 1370) | Nasopharyngeal tube (fixed at 4 to 5 cm) and mechanical ventilator | PIP of 20 cmH2O for 15 seconds If response was not satisfactory: 2 further SLIs of 15 seconds (25 and 30 cmH2O). Then PEEP at 4 to 6 cmH2O | PIP 20 cmH2O, PEEP 4 to 6 cmH2O; inflation time 0.5 seconds; inflation rate 60 per min. Then, PEEP at 4 to 6 cmH2O |
| Lista 2015 (301) | 87% | 91% | mean 26.8 (SD 1.2); 25 to 26 weeks: 27 to 28 weeks: | mean 26.8 (SD 1.1); 25 to 26 weeks: 27 to 28 weeks: | mean 894 (SD 247) | mean 893 (SD 241) | Mask and T‐piece | PIP 25 cmH2O for 15 seconds. Then reduced to PEEP of 5 cmH2O | PEEP 5 cmH2O, followed by resuscitation according to AHA guidelines |
| Mercadante 2016 (185) | 40% | 32% | mean 35.2 (SD 0.8) | mean 35.2 (SD 0.8) | mean 2345 (SD 397) | mean 2346 (SD 359) | Mask and T‐piece | PIP 25 cmH2O for 15 seconds, followed by PEEP of 5 cmH2O. In case of persistent heart failure (HR < 100 bpm): SLI repeated | PEEP 5 cmH2O, followed by resuscitation according to AAP guidelines |
| Ngan 2017 (162) | 78% | 70% | mean 28 (SD 2.5) | mean 28 (SD 2.5) | mean 1154 (SD 426) | mean 1140 (SD 406) | Mask and T‐piece | Two PIPs of 24 cmH2O. Duration of first SLI was 20 seconds. Duration of second SLI was 20 or 10 seconds, guided by ECO2 values. After SLIs, CPAP if breathing spontaneously or, if found to have apnoea or laboured breathing, mask IPPV at a rate of 40 to 60 bpm | IPPV, rate of 40 to 60 inflations/min until spontaneous breathing, at which time CPAP will be provided |
| Schmölzer 2015 (9) | 80%a | 100%a | mean 24.6 (SD 1.3)a | mean 25.6 (SD 2.3)a | mean 707 (SD 208)a | mean 808 (SD 192)a | Mask and T‐piecea | PIP for 20 + 20 secondsa during chest compressions | 3:1 compression:ventilation ratio according to resuscitation guidelines |
| Schwaberger 2015 (40) | not reported | not reported | mean 32.1 (SD 1.4) | mean 32.1 (SD 1.6) | mean 1692 (SD 297) | mean 1722 (SD 604) | Mask and T‐piece | PIP 30 cmH2O for 15 seconds, to be repeated once or twice with HR remaining < 100 bpm. Infants with HR > 100 bpm: PPV at 30 cmH2O PIP or CPAP at PEEP level of 5 cmH2O depending on respiratory rate | Resuscitation according to AHA guidelines PEEP 5 cmH2O if respiratory rate > 30 and signs of respiratory distress PPV at 30 cmH2O PIP if insufficient breathing efforts |
aInformation provided by study authors
Settings and populations
Researchers conducted the included studies on four different continents: two in Italy (Lista 2015; Mercadante 2016), two in Canada by the same contact author (Ngan 2017; Schmölzer 2015), one in Germany (Lindner 2005), one in Austria (Schwaberger 2015), one in Egypt (El‐Chimi 2017), and one in Thailand (Jiravisitkul 2017). Only one study was conducted at multiple centres (Lista 2015). Five of the six trials identified for this update included infants with mean birth weight > 1 kg (El‐Chimi 2017; Jiravisitkul 2017; Mercadante 2016; Ngan 2017; Schwaberger 2015), whereas the two previously included studies (Lindner 2005; Lista 2015) and the pilot trial (Schmölzer 2015) enrolled extremely low birth weight infants. Mercadante 2016 was the only trial conducted in late preterm infants. No trials enrolled full‐term infants. Table 1 shows additional information on populations.
Interventions
Trials pooled in the primary comparison (i.e. without chest compressions) reported that peak inspiratory pressure (PIP) was sustained for 15 seconds in six trials (El‐Chimi 2017; Jiravisitkul 2017; Lindner 2005; Lista 2015; Mercadante 2016; Schwaberger 2015) and for 20 seconds in Ngan 2017. However, levels of PIP ranged from 20 cmH2O (El‐Chimi 2017; Lindner 2005) to 24 (Ngan 2017), 25 (Jiravisitkul 2017; Lista 2015; Mercadante 2016), and 30 cmH2O (Schwaberger 2015). Investigators provided additional SLIs in cases of poor response, with the same (Jiravisitkul 2017; Mercadante 2016; Schwaberger 2015) or higher PIP (El‐Chimi 2017; Lindner 2005); researchers in Ngan 2017 based the duration of the second SLI on exhaled CO2 values. As regards interface and ventilation devices, most included trials used mask and T‐piece. However, Lindner 2005 used nasopharyngeal tube and ventilator, and El‐Chimi 2017 introduced a relevant bias into the study design by using a T‐piece ventilator in the SLI group and a self‐inflating bag in the control group (mask in both SLI and control groups). No trials reported whether prespecified levels of pressure for the SLI were actually delivered according to the protocol. Study authors did not monitor leaks at the mask and lung volumes during the manoeuvre. Whether the infant breathed before or during the SLI was not recorded: Apnoeic newborns at birth are known to show less gain in lung volume during an SLI than actively breathing infants (Lista 2017).
For the secondary comparison, in which infants in both SLI and control groups were resuscitated with chest compressions, duration of SLI was 20 + 20 seconds (Schmölzer 2015).
Table 1 shows additional information on interventions.
Excluded studies
We have summarised the reasons for exclusion of potentially eligible trials (Bouziri 2011; Harling 2005; te Pas 2007) in the Characteristics of excluded studies table.
In particular, we excluded te Pas 2007 because sustained inflation was only one element of the intervention, and because it is not possible to determine the relative contributions of various elements of this intervention to differences observed between groups. We excluded Harling 2005, as investigators randomised infants in this trial to receive inflation for 2 seconds or 5 seconds at initiation of PPV. All infants thus received sustained (> 1 second) inflations as defined in our protocol (O'Donnell 2004).
For the 2017 update, we excluded no eligible studies.
Risk of bias in included studies
We have presented a summary of the 'Risk of bias' assessment in Figure 2 and Figure 3. We have provided details of the methodological quality of included trials in the Characteristics of included studies section.

Risk of bias summary: review authors' judgements about each risk of bias item for each included trial.

Risk of bias graph: review authors' judgements about each risk of bias item presented as percentages across all included trials.
Allocation
One trial had high risk of selection bias: This quasi‐randomised trial (odd‐numbered sheets indicated allocation to the SLI group, and even‐numbered sheets to the control group) did not use opaque envelopes (information provided by study authors) (El‐Chimi 2017). In Jiravisitkul 2017 and Schwaberger 2015, risk of selection bias was low as regards random sequence generation and allocation concealment (opaque, numbered envelopes). In Ngan 2017, risk of selection bias was low as regards random sequence generation and was unclear for allocation concealment: Timing of randomisation resulted in many post‐randomisation exclusions, as results showed more post‐randomisation exclusions in the SLI group than in the control group. In the other four trials, risk of selection bias was unclear as regards random sequence generation and was low as regards allocation concealment (opaque, numbered envelopes) (Lindner 2005; Lista 2015; Mercadante 2016; Schmölzer 2015).
Blinding
Owing to the nature of the intervention, all trials were unblinded, leading to high risk of performance bias. However, four trials blinded researchers assessing trial endpoints to the nature of study treatments (Lista 2015; Mercadante 2016; Ngan 2017; Schmölzer 2015).
Incomplete outcome data
El‐Chimi 2017 referred almost half of enrolled infants to other NICUs; we excluded these studies from analysis owing to failure of follow‐up, although the primary outcome of the study (treatment failure/success within 72 hours) could have been determined and reported for these infants. In Ngan 2017, post‐randomisation exclusion (27%) resulted in fewer included infants in the SLI group. Most trials accounted for all outcomes (Lindner 2005; Lista 2015; Mercadante 2016; Schwaberger 2015).
Selective reporting
Four trials provided complete results for all reported outcomes (Lindner 2005; Lista 2015; Ngan 2017; Schwaberger 2015).
Other potential sources of bias
El‐Chimi 2017 and Schwaberger 2015 did not report sample size calculations. For Schwaberger 2015, investigators registered the protocol after study initiation. Jiravisitkul 2017 planned sample sizes of 40 infants for each group but allocated only 38 to the control group. Lindner 2005 was stopped after the interim analysis. It was unclear why study authors made this decision. Ngan 2017 did not achieve the planned sample size; in addition, the incidence of the primary outcome in the control group was less than that assumed for the sample size calculation, leading to lack of power to detect the chosen effect size. The other trials appear free of other bias.
We were unable to explore possible bias through generation of funnel plots because fewer than ten trials met the inclusion criteria of this Cochrane review.
Effects of interventions
See: Summary of findings for the main comparison Use of initial sustained inflation compared with standard inflations in newborns receiving resuscitation with no chest compressions during resuscitation; Summary of findings 2 Use of initial sustained inflation compared with standard inflations in newborns receiving resuscitation with chest compressions during resuscitation
Primary comparison: use of initial sustained inflation versus standard inflations in newborns receiving resuscitation with no chest compressions
Primary outcomes
Death (Outcome 1.1)
Death in the delivery room (Outcome 1.1.1)
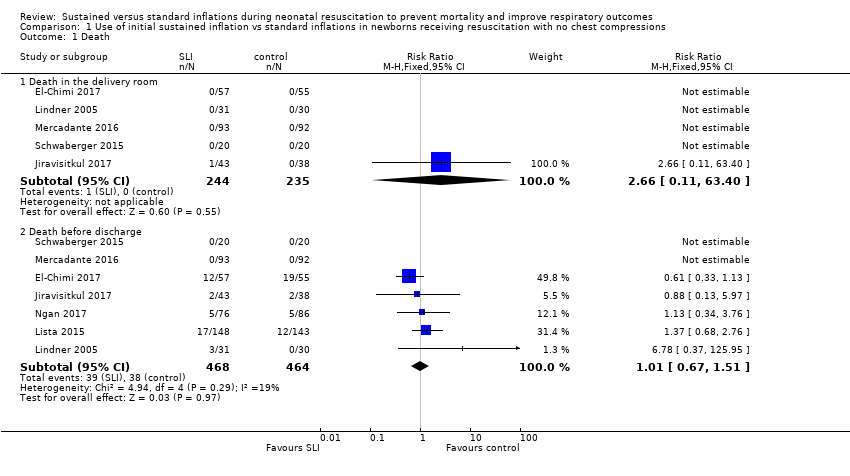
Five trials (N = 479) reported this outcome (El‐Chimi 2017; Jiravisitkul 2017; Lindner 2005; Mercadante 2016; Schwaberger 2015); one event occurred in the SLI group in Jiravisitkul 2017 (death in delivery room at 15 to 20 minutes of life, severe birth asphyxia as the result of a prolapsed cord), and none in the other four trials (typical RR 2.66, 95% CI 0.11 to 63.40; typical RD 0.00, 95% CI ‐0.02 to 0.02; participants = 479; studies = 5; I² not applicable for RR and I² = 0% for RD; Analysis 1.1 and Figure 4). We obtained data for this outcome directly from trial authors (Jiravisitkul 2017; Lindner 2005).

Forest plot of comparison: 1 Use of initial sustained inflation vs standard inflations in newborns receiving resuscitation with no chest compressions, outcome: 1.1 Death.
Death during hospitalisation (Outcome 1.2.1)
All trials included in the primary comparison (El‐Chimi 2017; Jiravisitkul 2017; Lindner 2005; Lista 2015; Mercadante 2016; Ngan 2017; Schwaberger 2015) reported mortality during hospitalisation (typical RR 1.01, 95% CI 0.67 to 1.51; typical RD 0.00, 95% CI ‐0.03 to 0.03; participants = 932; studies = 7; I² = 19% for RR and I² = 0% for RD; Analysis 1.1 and Figure 4).
We obtained data for this outcome directly from trial authors (El‐Chimi 2017; Jiravisitkul 2017; Lindner 2005).
In El‐Chimi 2017, 12 and 19 infants in SLI and control groups, respectively, died. In Jiravisitkul 2017, two infants in each group died: In the SLI group, one died of severe birth asphyxia as the result of a prolapsed cord, and the other died at 3 hours of life of suspected umbilical catheter migration with haemothorax; in the control group, one died of severe respiratory distress syndrome at 2 hours of life, and the other of septic shock at 168 days of life. In Lindner 2005, three deaths occurred in the sustained inflation group: at day 1 (respiratory failure), at day 36 (necrotising enterocolitis), and at day 107 (liver fibrosis of unknown origin). In Lista 2015, 12 infants in the control group and 17 in the sustained inflations group died during the trial. Mercadante 2016 and Schwaberger 2015 reported no events.
Secondary outcomes
Apgar score at one minute (Outcome 1.2)
Five trials (N = 529) (Jiravisitkul 2017; Lindner 2005; Mercadante 2016; Ngan 2017; Schwaberger 2015) reported this outcome (MD ‐0.08, 95% CI ‐0.26 to 0.09; participants = 529; studies = 5; I² = 0%; Analysis 1.2). We obtained data for this outcome directly from trial authors (Jiravisitkul 2017; Lindner 2005; Mercadante 2016; Ngan 2017; Schwaberger 2015).
Apgar score at five minutes (Outcome 1.3)
Six trials (N = 641) (El‐Chimi 2017; Jiravisitkul 2017; Lindner 2005; Mercadante 2016; Ngan 2017; Schwaberger 2015) reported this outcome (MD ‐0.02, 95% CI ‐0.13 to 0.08; participants = 641; studies = 6; I² = 46%; Analysis 1.3). We obtained data for this outcome directly from trial authors (El‐Chimi 2017; Jiravisitkul 2017; Lindner 2005; Mercadante 2016; Ngan 2017; Schwaberger 2015).
Endotracheal intubation (Outcome 1.4)
Endotracheal intubation in the delivery room (Outcome 1.4.1)
Five trials (N = 601) (El‐Chimi 2017; Jiravisitkul 2017; Lindner 2005; Mercadante 2016; Ngan 2017) reported this outcome (typical RR 0.86, 95% CI 0.62 to 1.19; typical RD ‐0.03, 95% CI ‐0.08 to 0.03; participants = 601; studies = 5; I² = 64% for RR and I² = 74% for RD; Analysis 1.4; Figure 5). We obtained data for this outcome directly from trial authors (Mercadante 2016).

Forest plot of comparison: 1 Use of initial sustained inflation vs standard inflations in newborns receiving resuscitation with no chest compressions, outcome: 1.4 Endotracheal intubation.
Endotracheal intubation outside the delivery room within 24 hours (Outcome 1.4.2)
Two trials (N = 225) (Mercadante 2016; Schwaberger 2015) reported this outcome (RR 1.40, 95% CI 0.53 to 3.68; RD 0.02, 95% CI ‐0.04 to 0.07; participants = 225; studies = 2). The test for heterogeneity was not applicable because only one trial (Lindner 2005) reported events (Analysis 1.4; Figure 5). We obtained data for this outcome directly from trial authors (Mercadante 2016).
Endotracheal intubation outside the delivery room by 72 hours (Outcome 1.4.3)
Five included trials (N = 811) (El‐Chimi 2017; Lindner 2005; Lista 2015; Mercadante 2016; Ngan 2017) reported this outcome (typical RR 0.93, 95% CI 0.79 to 1.09; typical RD ‐0.03, 95% CI ‐0.09 to 0.03; participants = 811; studies = 5; I² = 0% for RR and I² = 53% for RD) (Analysis 1.4;Figure 5). We obtained data for this outcome directly from trial authors (Mercadante 2016).
Surfactant administration (Outcome 1.5)
Surfactant administration in the delivery room (Outcome 1.5.1)
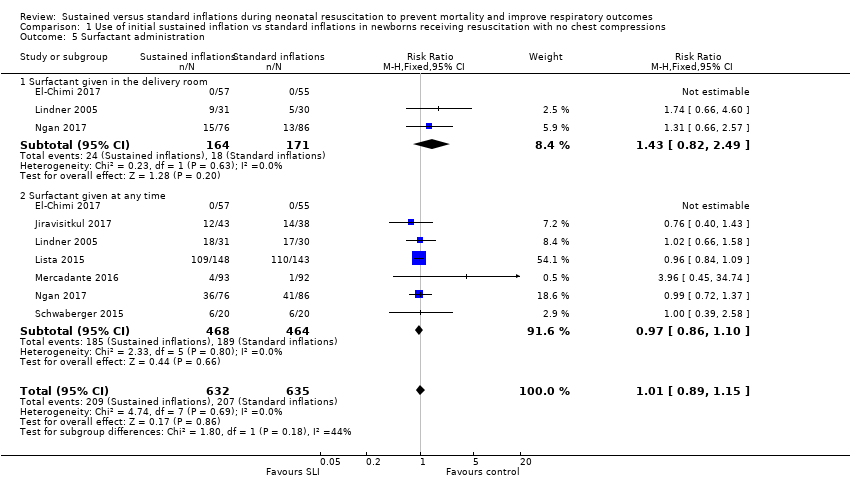
Three trials (N = 335) (El‐Chimi 2017; Lindner 2005; Ngan 2017) reported this outcome (typical RR 1.43, 95% CI 0.82 to 2.49; typical RD 0.04, 95% CI ‐0.02 to 0.11; participants = 335; studies = 3; I² = 0% for RR and I² = 72% for RD; Analysis 1.5;Figure 6). We obtained data for this outcome directly from trial authors (El‐Chimi 2017).

Forest plot of comparison: 1 Use of initial sustained inflation vs standard inflations in newborns receiving resuscitation with no chest compressions, outcome: 1.5 Surfactant administration.
Surfactant administration during hospital admission (Outcome 1.5.2)
All trials included in the primary comparison (El‐Chimi 2017; Jiravisitkul 2017; Lindner 2005; Lista 2015; Mercadante 2016; Ngan 2017; Schwaberger 2015) (N = 932) reported this outcome (typical RR 0.97, 95% CI 0.86 to 1.10; typical RD ‐0.01, 95% CI ‐0.06 to 0.04; participants = 932; studies = 7; I² = 0% for RR and I² = 0% for RD; Analysis 1.5;Figure 6). We obtained data for this outcome directly from trial authors (El‐Chimi 2017; Lindner 2005;Mercadante 2016).
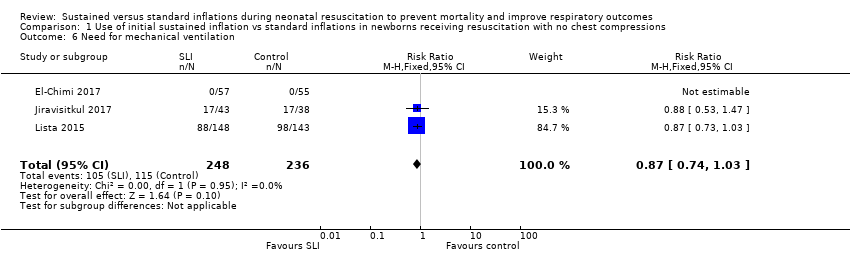
Need for mechanical ventilation (Outcome 1.6)
Three trials (N = 484) reported this outcome (El‐Chimi 2017; Jiravisitkul 2017; Lista 2015) (typical RR 0.87, 95% CI 0.74 to 1.03; typical RD ‐0.06, 95% CI ‐0.14 to 0.01; participants = 484; studies = 3; I² = 0% for RR and I² = 85% for RD) (Analysis 1.6). We obtained data for this outcome directly from trial authors (El‐Chimi 2017).
Duration of nasal continuous airway pressure (Outcome 1.7)
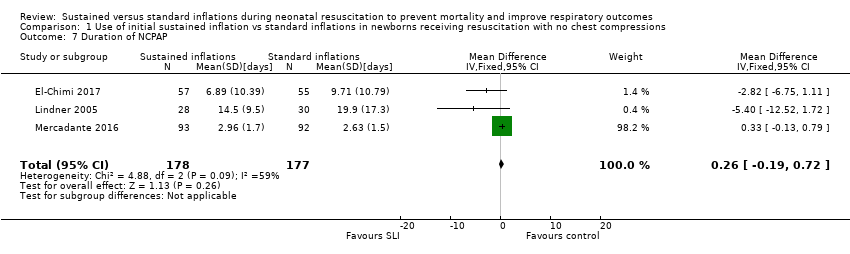
Three trials (N = 355) reported this outcome (El‐Chimi 2017; Lindner 2005; Mercadante 2016) (MD 0.26 days, 95% CI ‐0.19 to 0.72; participants = 355; studies = 3; I² = 59%) (Analysis 1.7). We obtained data for this outcome directly from trial authors; data for this outcome refer to survivors at time of assessment (El‐Chimi 2017; Lindner 2005; Mercadante 2016).
Duration of ventilation via an ETT (Outcome 1.8)
Five trials (N = 524) reported this outcome (Jiravisitkul 2017; Lindner 2005; Mercadante 2016; Ngan 2017; Schwaberger 2015) (MD ‐5.37 days, 95% CI ‐6.31 to ‐4.43; participants = 524; studies = 5; I² = 95%; Analysis 1.8). Data for this outcome refer to survivors at time of assessment (Jiravisitkul 2017; Lindner 2005; Mercadante 2016). We obtained data for this outcome directly from trial authors (Jiravisitkul 2017; Mercadante 2016; Ngan 2017; Schwaberger 2015). Heterogeneity, statistical significance, and magnitude of effects of this outcome are largely influenced by a single study (Ngan 2017): when this study was removed from the analysis, the effect was largely reduced (MD ‐1.71 days, 95% CI ‐3.04 to ‐0.39, I² = 0%).
Duration of respiratory support (nasal continuous airway pressure and ventilation via an ETT, considered in total) (Outcome 1.9)
Two trials (N = 243) reported this outcome (Lindner 2005; Mercadante 2016) (MD 0.69 days, 95% CI 0.23 to 1.16; participants = 243; studies = 2; I² = 0%; Analysis 1.9). We obtained data for this outcome directly from trial authors; data refer to survivors at time of assessment (Lindner 2005; Mercadante 2016).
Duration of supplemental oxygen requirement (days) (Outcome 1.10)
One trial (N = 81) reported this outcome (Jiravisitkul 2017) (MD ‐9.73, 95% CI ‐25.06 to 5.60; participants = 81; studies = 1; Analysis 1.10). The test for heterogeneity was not applicable. We obtained data for this outcome directly from trial authors (Jiravisitkul 2017).
Chronic lung disease (i.e. need for supplemental oxygen at 36 weeks of gestational age for infants born at or before 32 weeks of gestation) (Outcome 1.11)
Bronchopulmonary dysplasia (BPD) any grade (Outcome 1.11.1)
Two trials (N = 220) reported this outcome (Lindner 2005; Ngan 2017) (typical RR 0.90, 95% CI 0.69 to 1.19; typical RD ‐0.05, 95% CI ‐0.17 to 0.08; participants = 220; studies = 2; I² = 0% for RR and I² = 0% for RD). We obtained data for this outcome directly from trial authors; data refer to survivors at time of assessment (Lindner 2005; Analysis 1.11).
Moderate to severe BDP (Outcome 1.11.2)
Five included trials (N = 683) (El‐Chimi 2017; Jiravisitkul 2017; Lista 2015; Ngan 2017; Schwaberger 2015) reported this outcome (typical RR 0.95, 95% CI 0.74 to 1.22; typical RD ‐0.01, 95% CI ‐0.07 to 0.05; participants = 683; studies = 5; I² = 47% for RR and I² = 57% for RD; Analysis 1.11).
Air leaks (pneumothorax, pneumomediastinum, pneumopericardium, pulmonary interstitial emphysema) reported individually or as a composite outcome (Outcome 1.12)
Pneumothorax in first 48 hours of life (Outcome 1.12.1)
One trial (N = 81) (Jiravisitkul 2017) reported this outcome (RR 0.88, 95% CI 0.06 to 13.65; RD ‐0.00, 95% CI ‐0.07 to 0.06). The test for heterogeneity was not applicable (Analysis 1.12).
Pneumothorax at any time (Outcome 1.12.2)
Six included studies (N = 851) (El‐Chimi 2017; Lindner 2005; Lista 2015; Mercadante 2016; Ngan 2017; Schwaberger 2015) reported this outcome (typical RR 1.44, 95% CI 0.76 to 2.72; typical RD 0.02, 95% CI ‐0.01 to 0.04; studies = 6; 851 infants; I² = 26% for RR and I² = 2% for RD; Analysis 1.12).
Cranial ultrasound abnormalities (Outcome 1.13)
Intraventricular haemorrhage (IVH), grade 3 or 4 according to the Papile classification (Papile 1978) (Outcome 1.13.1)
Five included trials (N = 635) (Jiravisitkul 2017; Lindner 2005; Lista 2015; Ngan 2017; Schwaberger 2015) reported this outcome (typical RR 0.89, 95% CI 0.58 to 1.37; typical RD ‐0.01, 95% CI ‐0.06 to 0.03; studies = 5; 635 infants; I2 = 4% for RR and I2 = 0% for RD; Analysis 1.13).
IVH any grade (Outcome 1.13.2)
Two included trials (N = 152) (El‐Chimi 2017; Schwaberger 2015) reported this outcome (typical RR 0.82, 95% CI 0.40 to 1.69; typical RD ‐0.03, 95% CI ‐0.15 to 0.08; studies = 3; 152 infants; I² = 0% for RR and I² = 0% for RD; Analysis 1.13).
Cystic periventricular leukomalacia (Outcome 1.13.3)
Five included trials (N = 635) (Jiravisitkul 2017; Lindner 2005; Lista 2015; Ngan 2017; Schwaberger 2015) reported this outcome (typical RR 0.59, 95% CI 0.24 to 1.44; typical RD ‐0.04, 95% CI ‐0.04 to 0.01; studies = 5; 635 infants; I² = 0% for RR and I² = 0% for RD; Analysis 1.13).
Retinopathy of prematurity (ROP) ≥ stage 3 (Outcome 1.14)
Five trials (N = 632) (Jiravisitkul 2017; Lindner 2005; Lista 2015; Ngan 2017; Schwaberger 2015) reported this outcome (typical RR 0.69, 95% CI 0.44 to 1.10; typical RD ‐0.04, 95% CI ‐0.08 to 0.01; studies = 5; 632 infants; I² = 42% for RR and I² = 40% for RD; Analysis 1.14). For Lindner 2005, data refer to survivors at time of assessment (Analysis 1.14).
Patent ductus arteriosus (PDA) (Outcome 1.15)
Rate of PDA ‐ pharmacological treatment (Outcome 1.15.1)
Six included trials (N = 745) (El‐Chimi 2017; Jiravisitkul 2017; Lindner 2005; Lista 2015; Ngan 2017; Schwaberger 2015) reported this outcome (typical RR 1.08, 95% CI 0.90 to 1.30; typical RD 0.03, 95% CI ‐0.04 to 0.09; studies = 6; 745 infants; I² = 36% for RR and I² = 58% for RD; Analysis 1.15). We obtained data for this outcome directly from trial authors (Schwaberger 2015).
Rate of PDA ‐ surgical closure (Outcome 1.15.2)
Three trials (N = 412) (Jiravisitkul 2017; Lista 2015; Schwaberger 2015) reported this outcome (typical RR 0.73, 95% CI 0.27 to 1.99; typical RD ‐0.01, 95% CI ‐0.05 to 0.03; studies = 3; 412 infants; I² = 0% for RR and I² = 26% for RD; Analysis 1.15). We obtained data for this outcome directly from trial authors (Schwaberger 2015).
The data refer to all randomised infants, unless otherwise specified.
No data were reported for the following outcomes: heart rate; need for supplemental oxygen at 28 days of life; seizures including clinical and electroencephalographic; hypoxic ischaemic encephalopathy in term and late preterm infants (grade 1 to 3; Sarnat 1976); and long‐term neurodevelopmental outcomes.
Death to latest follow‐up: No data were provided in addition to those already presented for death during hospitalisation (Analysis 1.1).
Subgroup analysis for the primary comparison
For the primary comparison, we were unable to conduct any of the four prespecified subgroup analyses because:
-
no term infants were included;
-
for ventilation devices, all trials used a T‐piece except Lindner 2005 (mechanical ventilator): We did not perform a separate analysis because of the very small sample size and the presence of high or unclear risk of bias in most GRADE domains. Moreover, El‐Chimi 2017 used a T‐piece ventilator in the SLI group and a self‐inflating bag in the control group; thus we could not include this as a subgroup;
-
for interface, all trials used a face mask, except Lindner 2005 (nasopharyngeal tube): As for ventilation devices, we did not perform a separate analysis for Lindner 2005; and
-
no trials used SLI < 5 seconds.
Secondary comparison: use of initial sustained inflation versus standard inflations in newborns receiving resuscitation with chest compressions
Primary outcomes
Death (Outcome 2.1)
Death in the delivery room (Outcome 2.1.1)
The included trial (N = 9) did not report this outcome (Schmölzer 2015).
Death during hospitalisation (Outcome 2.1.2)
One trial (N = 9) reported this outcome (RR 1.60, 95% CI 0.21 to 11.92; RD 0.15, 95% CI ‐0.45 to 0.75); thus, the test for heterogeneity was not applicable for this outcome (Schmölzer 2015; Analysis 2.1). We obtained data for this outcome directly from trial authors (Schmölzer 2015).
Secondary outcomes
Endotracheal intubation in the delivery room (Outcome 2.2)
One trial (N = 9) reported this outcome (RR 1.00, 95% CI 0.68 to 1.46; RD 0.00, 95% CI ‐0.34 to 0.34); thus, the test for heterogeneity was not applicable for this outcome (Schmölzer 2015;Analysis 2.2). We obtained data for this outcome directly from trial authors (Schmölzer 2015).
Surfactant administration in the delivery room (Outcome 2.3)
One trial (N = 9) reported this outcome (RR 1.60, 95% CI 0.55 to 4.68; RD 0.30, 95% CI ‐0.30 to 0.90); thus, the test for heterogeneity was not applicable for this outcome (Schmölzer 2015; Analysis 2.3). We obtained data for this outcome directly from trial authors (Schmölzer 2015).
Chronic lung disease (2.4, 2.5, 2.6)
Moderate to severe BDP (Outcome 2.4)
One trial (N = 9) reported this outcome (RR 0.89, 95% CI 0.33 to 2.37; RD ‐0.08, 95% CI ‐0.76 to 0.60); thus, the test for heterogeneity was not applicable for this outcome (Schmölzer 2015; Analysis 2.3). We obtained data for this outcome directly from trial authors (Schmölzer 2015).
Pneumothorax at any time (Outcome 2.5)
One trial (N = 9) reported this outcome: No events occurred (Analysis 2.5). We obtained data for this outcome directly from trial authors (Schmölzer 2015).
Cranial ultrasound abnormalities (Outcome 2.6)
Intraventricular haemorrhage (IVH), grade 3 or 4 according to the Papile classification (Papile 1978) (Outcome 2.6.1)
One trial (N = 9) reported this outcome (RR 0.40, 95% CI 0.05 to 2.98; RD ‐0.30, 95% CI ‐0.90 to 0.30); thus, the test for heterogeneity was not applicable for this outcome (Schmölzer 2015; Analysis 2.6). We obtained data for this outcome directly from trial authors (Schmölzer 2015).
IVH any grade (Outcome 2.6.2)
One trial (N = 9) reported this outcome (RR 0.28, 95% CI 0.07 to 1.15; RD ‐0.80, 95% CI ‐1.23 to ‐0.37); thus, the test for heterogeneity was not applicable for this outcome (Schmölzer 2015; Analysis 2.6). We obtained data for this outcome directly from trial authors (Schmölzer 2015).
Retinopathy of prematurity (ROP) ≥ stage 3 (Outcome 2.7)
One trial (N = 9) reported this outcome (RR 0.27, 95% CI 0.04 to 1.68; RD ‐0.55, 95% CI ‐1.10 to 0.00); thus, the test for heterogeneity was not applicable for this outcome (Schmölzer 2015; Analysis 2.7). We obtained data for this outcome directly from trial authors (Schmölzer 2015).
Rate of PDA ‐ pharmacological treatment (Outcome 2.8)
One trial (N = 9) reported this outcome (RR 0.46, 95% CI 0.17 to 1.25; RD ‐0.60, 95% CI ‐1.07 to ‐0.13); thus, the test for heterogeneity was not applicable for this outcome (Schmölzer 2015; Analysis 2.8). We obtained data for this outcome directly from trial authors (Schmölzer 2015).
For the secondary comparison, investigators provided no data on other prespecified outcomes.
Subgroup analysis for the secondary comparison
For the secondary comparison, we were unable to conduct any subgroup analysis, as we included only one trial.
Discussion
Summary of main results
We evaluated the merits of sustained lung inflation (SLI) versus intermittent ventilation in infants requiring resuscitation and stabilisation at birth. Eight trials enrolling 941 preterm infants met review inclusion criteria (El‐Chimi 2017; Jiravisitkul 2017; Lindner 2005; Lista 2015; Mercadante 2016; Ngan 2017; Schmölzer 2015; Schwaberger 2015). Whereas the two trials included in the previous version of this review enrolled infants at 25+0 to 28+6 weeks (Lindner 2005; Lista 2015), the five more recent trials enrolled larger infants (El‐Chimi 2017; Jiravisitkul 2017; Mercadante 2016; Ngan 2017; Schwaberger 2015). One of the trials included in this update was not pooled with the other studies for analysis because investigators superimposed the intervention on chest compressions (Schmölzer 2015).
Sustained lung inflation was not better than intermittent ventilation for reducing mortality ‐ the primary outcome of this review. We rated the quality of evidence as moderate (GRADE) for death before discharge (limitations in study design of most included trials) and as low (GRADE) for death in the delivery room (limitations in study design and imprecision of estimates). When considering secondary outcomes, such as need for intubation, need for or duration of respiratory support, bronchopulmonary dysplasia, or pneumothorax, we found no benefit of SLI over intermittent ventilation. The quality of evidence for secondary outcomes was moderate (limitations in study design of most included trials ‐ GRADE), except for pneumothorax (low quality: limitations in study design and imprecision of estimates ‐ GRADE). Duration of mechanical ventilation was shorter in the SLI group (low quality: limitations in study design and imprecision of estimates ‐ GRADE). The first version of this review reported an increased rate of patent ductus arteriosus (PDA) in the sustained lung inflation group. However, this effect was not seen when the most recent trials were added to the analysis. We identified six ongoing trials.
Overall completeness and applicability of evidence
To date, seven trials comparing sustained versus standard inflations for initial resuscitation have enrolled 941 newborns. Available data were insufficient for assessment of clinically important outcomes, which were identified a priori. Study authors did not report outcomes such as duration of supplemental oxygen requirement and long‐term neurodevelopmental outcomes and did not enrol term infants. We could not perform an a priori subgroup analysis (gestational age, ventilation device, interface, duration of sustained inflation) to detect differential effects because of the paucity of included trials. Relevant questions such as the following remain unanswered: What is the optimal duration for an SLI? Which level of positive end‐expiratory pressure (PEEP) should follow? Which is the optimal interface/device? (McCall 2016) We were able to summarise available evidence in a comprehensive way, as we obtained additional information about study design and outcome data from all included trials (El‐Chimi 2017; Jiravisitkul 2017; Lindner 2005; Lista 2015; Mercadante 2016; Ngan 2017; Schmölzer 2015; Schwaberger 2015) and from two excluded trials (Harling 2005; te Pas 2007). The five ongoing trials that we identified reported important differences in choice of gestational age (NCT02139800; NCT02493920; NCT02846597; NCT02858583; NCT02887924). NCT02139800 enrols infants at 23 to 26 weeks, NCT02493920 at 25 to 36 weeks, NCT02887924 at 26 to 29 weeks, and NCT02846597 at < 33 weeks, whereas NCT02858583 enrols term and preterm infants. These differences among study populations might prove to be important, as trials have reported that sustained inflation was more effective in infants at 28 to 30 weeks than at < 28 or > 30 weeks of gestation (te Pas 2007).
Quality of the evidence
According to the GRADE approach, we rated the overall quality of evidence for clinically relevant outcomes as low to moderate (see summary of findings Table for the main comparison). We downgraded the overall quality of evidence for critical outcomes because of limitations in study design (i.e. selection bias due to lack of allocation concealment) and imprecision of results (few events for death in the delivery room and wide confidence intervals for pneumothorax). In addition, two trials did not report sample size calculations (El‐Chimi 2017; Schwaberger 2015), and the other three did not achieve them (Jiravisitkul 2017; Lindner 2005;Ngan 2017). Results of smaller studies are subject to greater sampling variation, and hence are less precise. Indeed, imprecision is reflected in the confidence interval around the intervention effect estimate from each study and in the weight given to the results of each study included in the meta‐analysis (Higgins 2011).
Potential biases in the review process
A major limitation of this Cochrane review is the definition of sustained lung inflation, as trials used different pressures, which may have impacted study results. No trials were blinded owing to the nature of the intervention. We excluded a potentially relevant trial (te Pas 2007) because sustained inflation was only one element of the intervention, and it is not possible to determine the relative contributions of various elements of this intervention to differences observed between groups. We excluded Harling 2005 because the control group received 2 seconds of inflation (5 seconds for the intervention group), whereas we defined sustained as > 1 second. For this update, we made a post hoc decision to add a comparison based on the presence of chest compressions during resuscitation.
Agreements and disagreements with other studies or reviews
Several systematic reviews of SLI have been recently published. Schmölzer 2014 conducted a systematic review of randomised clinical trials comparing SLI versus intermittent positive‐pressure ventilation (IPPV) as the primary respiratory intervention during respiratory support in preterm individuals at < 33 weeks of gestational age in the delivery room. This review included four trials, including two that we excluded from our systematic review (Harling 2005; te Pas 2007). Schmölzer 2014 reported a significant reduction in the need for mechanical ventilation within 72 hours after birth (typical risk ratio (RR) 0.87, 95% confidence interval (CI) 0.74 to 1.03). As in our analysis, significantly more infants treated with SLI received treatment for PDA (RR 1.27, 95% CI 1.05 to 1.54). Results showed no differences in bronchopulmonary dysplasia (BPD), death at latest follow‐up, or the combined outcome of death or BPD among survivors between groups. The findings of Schmölzer 2014 differ from the findings of this Cochrane review because of differences in the definition of duration of the intervention, and therefore in determination of included trials. A narrative review (Foglia 2016) including five trials (Harling 2005; Lindner 2005; Lista 2015; Mercadante 2016; te Pas 2007) concluded that at present, data are insufficient to support the use of SLI in clinical practice. An observational analytical cross‐sectional case–control study of 78 preterm infants showed that SLI resulted in lower rates of intubation in the delivery room, lower rates of invasive mechanical ventilation, and higher rates of intraventricular haemorrhage (Grasso 2015).
Study flow diagram: review update.

Risk of bias summary: review authors' judgements about each risk of bias item for each included trial.

Risk of bias graph: review authors' judgements about each risk of bias item presented as percentages across all included trials.

Forest plot of comparison: 1 Use of initial sustained inflation vs standard inflations in newborns receiving resuscitation with no chest compressions, outcome: 1.1 Death.

Forest plot of comparison: 1 Use of initial sustained inflation vs standard inflations in newborns receiving resuscitation with no chest compressions, outcome: 1.4 Endotracheal intubation.

Forest plot of comparison: 1 Use of initial sustained inflation vs standard inflations in newborns receiving resuscitation with no chest compressions, outcome: 1.5 Surfactant administration.
Comparison 1 Use of initial sustained inflation vs standard inflations in newborns receiving resuscitation with no chest compressions, Outcome 1 Death.

Comparison 1 Use of initial sustained inflation vs standard inflations in newborns receiving resuscitation with no chest compressions, Outcome 2 Apgar at 1 minute.

Comparison 1 Use of initial sustained inflation vs standard inflations in newborns receiving resuscitation with no chest compressions, Outcome 3 Apgar at 5 minutes.

Comparison 1 Use of initial sustained inflation vs standard inflations in newborns receiving resuscitation with no chest compressions, Outcome 4 Endotracheal intubation.
Comparison 1 Use of initial sustained inflation vs standard inflations in newborns receiving resuscitation with no chest compressions, Outcome 5 Surfactant administration.
Comparison 1 Use of initial sustained inflation vs standard inflations in newborns receiving resuscitation with no chest compressions, Outcome 6 Need for mechanical ventilation.
Comparison 1 Use of initial sustained inflation vs standard inflations in newborns receiving resuscitation with no chest compressions, Outcome 7 Duration of NCPAP.

Comparison 1 Use of initial sustained inflation vs standard inflations in newborns receiving resuscitation with no chest compressions, Outcome 8 Duration of mechanical ventilation.

Comparison 1 Use of initial sustained inflation vs standard inflations in newborns receiving resuscitation with no chest compressions, Outcome 9 Duration of respiratory support (NCPAP + MV).

Comparison 1 Use of initial sustained inflation vs standard inflations in newborns receiving resuscitation with no chest compressions, Outcome 10 Duration of supplemental oxygen requirement.

Comparison 1 Use of initial sustained inflation vs standard inflations in newborns receiving resuscitation with no chest compressions, Outcome 11 Chronic lung disease.

Comparison 1 Use of initial sustained inflation vs standard inflations in newborns receiving resuscitation with no chest compressions, Outcome 12 Pneumothorax.

Comparison 1 Use of initial sustained inflation vs standard inflations in newborns receiving resuscitation with no chest compressions, Outcome 13 Cranial ultrasound abnormalities.

Comparison 1 Use of initial sustained inflation vs standard inflations in newborns receiving resuscitation with no chest compressions, Outcome 14 Retinopathy of prematurity (ROP) stage ≥ 3.

Comparison 1 Use of initial sustained inflation vs standard inflations in newborns receiving resuscitation with no chest compressions, Outcome 15 Patent ductus arteriosus (PDA).

Comparison 2 Use of initial sustained inflation vs standard inflations in newborns receiving resuscitation with chest compressions, Outcome 1 Death.

Comparison 2 Use of initial sustained inflation vs standard inflations in newborns receiving resuscitation with chest compressions, Outcome 2 Endotracheal intubation.

Comparison 2 Use of initial sustained inflation vs standard inflations in newborns receiving resuscitation with chest compressions, Outcome 3 Surfactant administration.

Comparison 2 Use of initial sustained inflation vs standard inflations in newborns receiving resuscitation with chest compressions, Outcome 4 Chronic lung disease.

Comparison 2 Use of initial sustained inflation vs standard inflations in newborns receiving resuscitation with chest compressions, Outcome 5 Pneumothorax.

Comparison 2 Use of initial sustained inflation vs standard inflations in newborns receiving resuscitation with chest compressions, Outcome 6 Cranial ultrasound abnormalities.

Comparison 2 Use of initial sustained inflation vs standard inflations in newborns receiving resuscitation with chest compressions, Outcome 7 Retinopathy of prematurity (ROP) stage ≥ 3.

Comparison 2 Use of initial sustained inflation vs standard inflations in newborns receiving resuscitation with chest compressions, Outcome 8 Patent ductus arteriosus (PDA).
| Use of initial sustained inflation compared with standard inflations in newborns receiving resuscitation with no chest compressions during resuscitation | ||||||
| Patient or population: preterm infants resuscitated using PPV at birth Settings: delivery room in Europe (Austria, Germany, Italy), Canada, Egypt, Thailand | ||||||
| Outcomes | Illustrative comparative risks* (95% CI) | Relative effect | No. of participants | Quality of the evidence | Comments | |
| Assumed risk | Corresponding risk | |||||
| Standard inflations in newborns receiving resuscitation with no chest compressions | Use of initial sustained inflation | |||||
| Death ‐ death in the delivery room | Study population | RR 2.66 | 479 | ⊕⊕⊝⊝ | ||
| 0 per 1000 | 0 per 1000 | |||||
| Death ‐ death before discharge | Study population | RR 1.01 | 932 | ⊕⊕⊕⊝ | ||
| 82 per 1000 | 83 per 1000 | |||||
| Need for mechanical ventilation | Study population | RR 0.87 | 484 | ⊕⊕⊕⊝ | ||
| 487 per 1000 | 424 per 1000 | |||||
| Chronic lung disease ‐ BPD any grade | Study population | RR 0.9 | 220 | ⊕⊕⊕⊝ | ||
| 483 per 1000 | 435 per 1000 | |||||
| Chronic lung disease ‐ moderate to severe BPD | Study population | RR 0.95 | 683 | ⊕⊕⊕⊝ | ||
| 257 per 1000 | 244 per 1000 | |||||
| Pneumothorax ‐ any time | Study population | RR 1.44 | 851 | ⊕⊕⊝⊝ | ||
| 33 per 1000 | 48 per 1000 | |||||
| Cranial ultrasound abnormalities ‐ intraventricular haemorrhage grade 3 to 4 | Study population | RR 0.89 | 635 | ⊕⊕⊕⊝ | ||
| 120 per 1000 | 107 per 1000 | |||||
| *The basis for the assumed risk (e.g. median control group risk across studies) is provided in footnotes. The corresponding risk (and its 95% confidence interval) is based on the assumed risk in the comparison group and the relative effect of the intervention (and its 95% CI) | ||||||
| GRADE Working Group grades of evidence | ||||||
| Assumed risk is the risk of the control arm. aLimitations in study design: all studies at high or unclear risk of bias in at least one domain | ||||||
| Use of initial sustained inflation compared with standard inflations in newborns receiving resuscitation with chest compressions during resuscitation | ||||||
| Patient or population: preterm infants resuscitated by PPV at birth Settings: delivery room in Europe (Austria, Germany, Italy), Canada, Egypt, Thailand | ||||||
| Outcomes | Illustrative comparative risks* (95% CI) | Relative effect | No. of participants | Quality of the evidence | Comments | |
| Assumed risk | Corresponding risk | |||||
| Standard inflations in newborns receiving resuscitation with chest compressions | Use of initial sustained inflation | |||||
| Death ‐ death before discharge | See comment | See comment | Not estimable | 9 | ⊕⊝⊝⊝ | Only 1 trial included |
| Chronic lung disease ‐ moderate to severe BPD | See comment | See comment | Not estimable | 7 | ⊕⊝⊝⊝ | Only 1 trial included |
| Pneumothorax ‐ any time | See comment | See comment | Not estimable | 9 | ⊕⊝⊝⊝ | Only 1 trial included |
| Cranial ultrasound abnormalities ‐ intraventricular haemorrhage grade 3 to 4 | See comment | See comment | Not estimable | 9 | ⊕⊝⊝⊝ | Only 1 trial included |
| *The basis for the assumed risk (e.g. median control group risk across studies) is provided in footnotes. The corresponding risk (and its 95% confidence interval) is based on the assumed risk in the comparison group and the relative effect of the intervention (and its 95% CI) | ||||||
| GRADE Working Group grades of evidence | ||||||
| Assumed risk is the risk of the control arm. aLimitations in study design: included study at high or unclear risk of bias in four domains | ||||||
| Trial (no. infants) | Antenatal steroids | Gestational age, weeks | Birth weight, grams | Device/Interface | Interventions/Controls | ||||
| SLI | Control | SLI | Control | SLI | Control | SLI and control | SLI | Control | |
| El‐Chimi 2017 (112) | 39% | 34.5% | mean 31.1 (SD 1.7) | mean 31.3 (SD 1.7) | mean 1561 (SD 326) | mean 1510 (SD 319) | Mask and T‐piece in SLI group Mask and self‐inflating bag with an oxygen reservoir in control group | PIP of 20 cmH2O for 15 seconds, followed by PEEP of 5 cmH2O If needed: a second SLI of 15 seconds of 25 cmH2O for 15 seconds, followed by PEEP of 6 cmH2O; then a third SLI of 15 seconds of 30 cmH2O for 15 seconds, followed by PEEP of 7 cmH2O If still not satisfactory: intubated in delivery room | PIP maximum 40 cmH2O, rate of 40 to 60 breaths/min for 30 seconds |
| Jiravisitkul 2017 (81) | 63% | 74% | 25 to 28 weeks: 29 to 32 weeks: | 25 to 28 weeks: 29 to 32 weeks: | mean 1206 (SD 367) | mean 1160 (SD 411) | Mask and T‐piece | PIP of 25 cmH2O for 15 seconds If HR 60 to 100 beats/min and/or poor respiratory effort: a second SLI (25 cmH2O, 15 seconds) | PIP 15 to 20 cmH2O, PEEP 5 cmH2O for 30 seconds, followed by resuscitation according to AHA guidelines |
| Lindner 2005 (61) | 81% | 80% | median 27.0 (IQR 25.0 to 28.9) | median 26.7 (IQR 25.0 to 28.9) | median 870 (IQR 410 to 1320) | median 830 (IQR 370 to 1370) | Nasopharyngeal tube (fixed at 4 to 5 cm) and mechanical ventilator | PIP of 20 cmH2O for 15 seconds If response was not satisfactory: 2 further SLIs of 15 seconds (25 and 30 cmH2O). Then PEEP at 4 to 6 cmH2O | PIP 20 cmH2O, PEEP 4 to 6 cmH2O; inflation time 0.5 seconds; inflation rate 60 per min. Then, PEEP at 4 to 6 cmH2O |
| Lista 2015 (301) | 87% | 91% | mean 26.8 (SD 1.2); 25 to 26 weeks: 27 to 28 weeks: | mean 26.8 (SD 1.1); 25 to 26 weeks: 27 to 28 weeks: | mean 894 (SD 247) | mean 893 (SD 241) | Mask and T‐piece | PIP 25 cmH2O for 15 seconds. Then reduced to PEEP of 5 cmH2O | PEEP 5 cmH2O, followed by resuscitation according to AHA guidelines |
| Mercadante 2016 (185) | 40% | 32% | mean 35.2 (SD 0.8) | mean 35.2 (SD 0.8) | mean 2345 (SD 397) | mean 2346 (SD 359) | Mask and T‐piece | PIP 25 cmH2O for 15 seconds, followed by PEEP of 5 cmH2O. In case of persistent heart failure (HR < 100 bpm): SLI repeated | PEEP 5 cmH2O, followed by resuscitation according to AAP guidelines |
| Ngan 2017 (162) | 78% | 70% | mean 28 (SD 2.5) | mean 28 (SD 2.5) | mean 1154 (SD 426) | mean 1140 (SD 406) | Mask and T‐piece | Two PIPs of 24 cmH2O. Duration of first SLI was 20 seconds. Duration of second SLI was 20 or 10 seconds, guided by ECO2 values. After SLIs, CPAP if breathing spontaneously or, if found to have apnoea or laboured breathing, mask IPPV at a rate of 40 to 60 bpm | IPPV, rate of 40 to 60 inflations/min until spontaneous breathing, at which time CPAP will be provided |
| Schmölzer 2015 (9) | 80%a | 100%a | mean 24.6 (SD 1.3)a | mean 25.6 (SD 2.3)a | mean 707 (SD 208)a | mean 808 (SD 192)a | Mask and T‐piecea | PIP for 20 + 20 secondsa during chest compressions | 3:1 compression:ventilation ratio according to resuscitation guidelines |
| Schwaberger 2015 (40) | not reported | not reported | mean 32.1 (SD 1.4) | mean 32.1 (SD 1.6) | mean 1692 (SD 297) | mean 1722 (SD 604) | Mask and T‐piece | PIP 30 cmH2O for 15 seconds, to be repeated once or twice with HR remaining < 100 bpm. Infants with HR > 100 bpm: PPV at 30 cmH2O PIP or CPAP at PEEP level of 5 cmH2O depending on respiratory rate | Resuscitation according to AHA guidelines PEEP 5 cmH2O if respiratory rate > 30 and signs of respiratory distress PPV at 30 cmH2O PIP if insufficient breathing efforts |
| aInformation provided by study authors | |||||||||
| Outcome or subgroup title | No. of studies | No. of participants | Statistical method | Effect size |
| 1 Death Show forest plot | 7 | Risk Ratio (M‐H, Fixed, 95% CI) | Subtotals only | |
| 1.1 Death in the delivery room | 5 | 479 | Risk Ratio (M‐H, Fixed, 95% CI) | 2.66 [0.11, 63.40] |
| 1.2 Death before discharge | 7 | 932 | Risk Ratio (M‐H, Fixed, 95% CI) | 1.01 [0.67, 1.51] |
| 2 Apgar at 1 minute Show forest plot | 5 | 529 | Mean Difference (IV, Fixed, 95% CI) | ‐0.08 [‐0.26, 0.09] |
| 3 Apgar at 5 minutes Show forest plot | 6 | 641 | Mean Difference (IV, Fixed, 95% CI) | ‐0.02 [‐0.13, 0.08] |
| 4 Endotracheal intubation Show forest plot | 7 | Risk Ratio (M‐H, Fixed, 95% CI) | Subtotals only | |
| 4.1 Endotracheal intubation in the delivery room | 5 | 601 | Risk Ratio (M‐H, Fixed, 95% CI) | 0.86 [0.62, 1.19] |
| 4.2 Endotracheal intubation within 24 hours | 2 | 225 | Risk Ratio (M‐H, Fixed, 95% CI) | 1.4 [0.53, 3.68] |
| 4.3 Endotracheal intubation by 72 hours of age | 5 | 811 | Risk Ratio (M‐H, Fixed, 95% CI) | 0.93 [0.79, 1.09] |
| 5 Surfactant administration Show forest plot | 7 | 1267 | Risk Ratio (M‐H, Fixed, 95% CI) | 1.01 [0.89, 1.15] |
| 5.1 Surfactant given in the delivery room | 3 | 335 | Risk Ratio (M‐H, Fixed, 95% CI) | 1.43 [0.82, 2.49] |
| 5.2 Surfactant given at any time | 7 | 932 | Risk Ratio (M‐H, Fixed, 95% CI) | 0.97 [0.86, 1.10] |
| 6 Need for mechanical ventilation Show forest plot | 3 | 484 | Risk Ratio (M‐H, Fixed, 95% CI) | 0.87 [0.74, 1.03] |
| 7 Duration of NCPAP Show forest plot | 3 | 355 | Mean Difference (IV, Fixed, 95% CI) | 0.26 [‐0.19, 0.72] |
| 8 Duration of mechanical ventilation Show forest plot | 5 | 524 | Mean Difference (IV, Fixed, 95% CI) | ‐5.37 [‐6.31, ‐4.43] |
| 9 Duration of respiratory support (NCPAP + MV) Show forest plot | 2 | 243 | Mean Difference (IV, Fixed, 95% CI) | 0.69 [0.23, 1.16] |
| 10 Duration of supplemental oxygen requirement Show forest plot | 1 | Mean Difference (IV, Fixed, 95% CI) | Totals not selected | |
| 11 Chronic lung disease Show forest plot | 6 | 903 | Risk Ratio (M‐H, Fixed, 95% CI) | 0.93 [0.77, 1.13] |
| 11.1 BPD any grade | 2 | 220 | Risk Ratio (M‐H, Fixed, 95% CI) | 0.90 [0.69, 1.19] |
| 11.2 Moderate to severe BPD | 5 | 683 | Risk Ratio (M‐H, Fixed, 95% CI) | 0.95 [0.74, 1.22] |
| 12 Pneumothorax Show forest plot | 7 | 932 | Risk Ratio (M‐H, Fixed, 95% CI) | 1.40 [0.76, 2.61] |
| 12.1 During first 48 hours | 1 | 81 | Risk Ratio (M‐H, Fixed, 95% CI) | 0.88 [0.06, 13.65] |
| 12.2 At any time | 6 | 851 | Risk Ratio (M‐H, Fixed, 95% CI) | 1.44 [0.76, 2.72] |
| 13 Cranial ultrasound abnormalities Show forest plot | 6 | Risk Ratio (M‐H, Fixed, 95% CI) | Subtotals only | |
| 13.1 Intraventricular haemorrhage grade 3‐4 | 5 | 635 | Risk Ratio (M‐H, Fixed, 95% CI) | 0.89 [0.58, 1.37] |
| 13.2 IVH any grade | 2 | 152 | Risk Ratio (M‐H, Fixed, 95% CI) | 0.82 [0.40, 1.69] |
| 13.3 Cystic periventricular leukomalacia | 5 | 635 | Risk Ratio (M‐H, Fixed, 95% CI) | 0.59 [0.24, 1.44] |
| 14 Retinopathy of prematurity (ROP) stage ≥ 3 Show forest plot | 5 | 632 | Risk Ratio (M‐H, Fixed, 95% CI) | 0.69 [0.44, 1.10] |
| 15 Patent ductus arteriosus (PDA) Show forest plot | 6 | Risk Ratio (M‐H, Fixed, 95% CI) | Subtotals only | |
| 15.1 PDA ‐ pharmacological treatment | 6 | 745 | Risk Ratio (M‐H, Fixed, 95% CI) | 1.08 [0.90, 1.30] |
| 15.2 PDA ‐ surgical closure | 3 | 412 | Risk Ratio (M‐H, Fixed, 95% CI) | 0.73 [0.27, 1.99] |
| Outcome or subgroup title | No. of studies | No. of participants | Statistical method | Effect size |
| 1 Death Show forest plot | 1 | Risk Ratio (M‐H, Fixed, 95% CI) | Totals not selected | |
| 1.1 Death before discharge | 1 | Risk Ratio (M‐H, Fixed, 95% CI) | 0.0 [0.0, 0.0] | |
| 2 Endotracheal intubation Show forest plot | 1 | Risk Ratio (M‐H, Fixed, 95% CI) | Totals not selected | |
| 2.1 Endotracheal intubation in the delivery room | 1 | Risk Ratio (M‐H, Fixed, 95% CI) | 0.0 [0.0, 0.0] | |
| 3 Surfactant administration Show forest plot | 1 | Risk Ratio (M‐H, Fixed, 95% CI) | Totals not selected | |
| 3.1 Surfactant given in the delivery room | 1 | Risk Ratio (M‐H, Fixed, 95% CI) | 0.0 [0.0, 0.0] | |
| 4 Chronic lung disease Show forest plot | 1 | Risk Ratio (M‐H, Fixed, 95% CI) | Totals not selected | |
| 4.1 Moderate to severe BPD | 1 | Risk Ratio (M‐H, Fixed, 95% CI) | 0.0 [0.0, 0.0] | |
| 5 Pneumothorax Show forest plot | 1 | Risk Ratio (M‐H, Fixed, 95% CI) | Totals not selected | |
| 5.1 At any time | 1 | Risk Ratio (M‐H, Fixed, 95% CI) | 0.0 [0.0, 0.0] | |
| 6 Cranial ultrasound abnormalities Show forest plot | 1 | Risk Ratio (M‐H, Fixed, 95% CI) | Totals not selected | |
| 6.1 Intraventricular haemorrhage grade 3 to 4 | 1 | Risk Ratio (M‐H, Fixed, 95% CI) | 0.0 [0.0, 0.0] | |
| 6.2 IVH any grade | 1 | Risk Ratio (M‐H, Fixed, 95% CI) | 0.0 [0.0, 0.0] | |
| 7 Retinopathy of prematurity (ROP) stage ≥ 3 Show forest plot | 1 | Risk Ratio (M‐H, Fixed, 95% CI) | Totals not selected | |
| 8 Patent ductus arteriosus (PDA) Show forest plot | 1 | Risk Ratio (M‐H, Fixed, 95% CI) | Totals not selected | |
| 8.1 PDA ‐ pharmacological treatment | 1 | Risk Ratio (M‐H, Fixed, 95% CI) | 0.0 [0.0, 0.0] | |