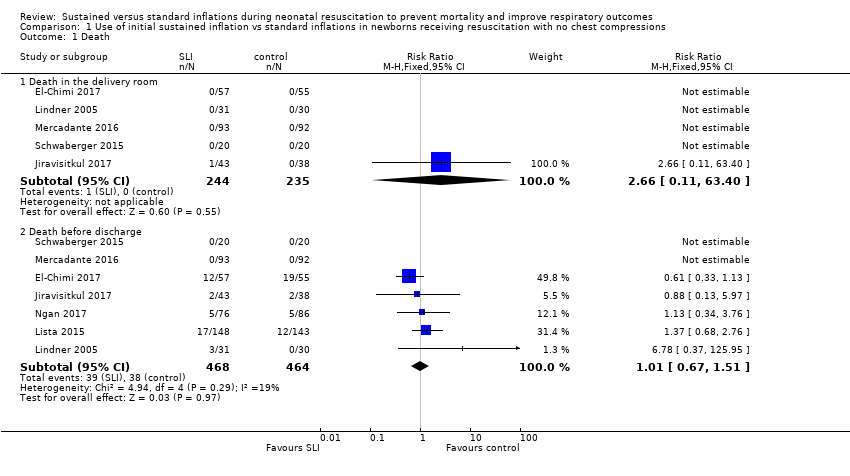
| 1 Death Show forest plot | 7 | | Risk Ratio (M‐H, Fixed, 95% CI) | Subtotals only |
|
| 1.1 Death in the delivery room | 5 | 479 | Risk Ratio (M‐H, Fixed, 95% CI) | 2.66 [0.11, 63.40] |
| 1.2 Death before discharge | 7 | 932 | Risk Ratio (M‐H, Fixed, 95% CI) | 1.01 [0.67, 1.51] |
| 2 Apgar at 1 minute Show forest plot | 5 | 529 | Mean Difference (IV, Fixed, 95% CI) | ‐0.08 [‐0.26, 0.09] |
|
| 3 Apgar at 5 minutes Show forest plot | 6 | 641 | Mean Difference (IV, Fixed, 95% CI) | ‐0.02 [‐0.13, 0.08] |
|
| 4 Endotracheal intubation Show forest plot | 7 | | Risk Ratio (M‐H, Fixed, 95% CI) | Subtotals only |
|
| 4.1 Endotracheal intubation in the delivery room | 5 | 601 | Risk Ratio (M‐H, Fixed, 95% CI) | 0.86 [0.62, 1.19] |
| 4.2 Endotracheal intubation within 24 hours | 2 | 225 | Risk Ratio (M‐H, Fixed, 95% CI) | 1.4 [0.53, 3.68] |
| 4.3 Endotracheal intubation by 72 hours of age | 5 | 811 | Risk Ratio (M‐H, Fixed, 95% CI) | 0.93 [0.79, 1.09] |
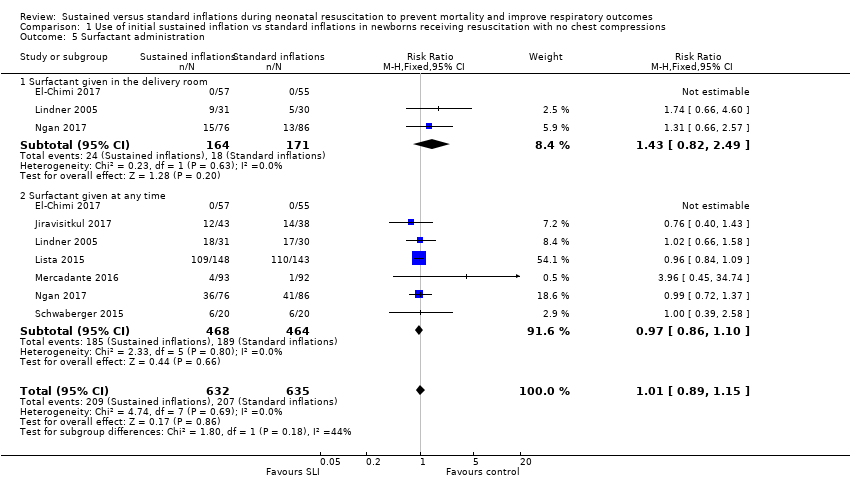
| 5 Surfactant administration Show forest plot | 7 | 1267 | Risk Ratio (M‐H, Fixed, 95% CI) | 1.01 [0.89, 1.15] |
|
| 5.1 Surfactant given in the delivery room | 3 | 335 | Risk Ratio (M‐H, Fixed, 95% CI) | 1.43 [0.82, 2.49] |
| 5.2 Surfactant given at any time | 7 | 932 | Risk Ratio (M‐H, Fixed, 95% CI) | 0.97 [0.86, 1.10] |
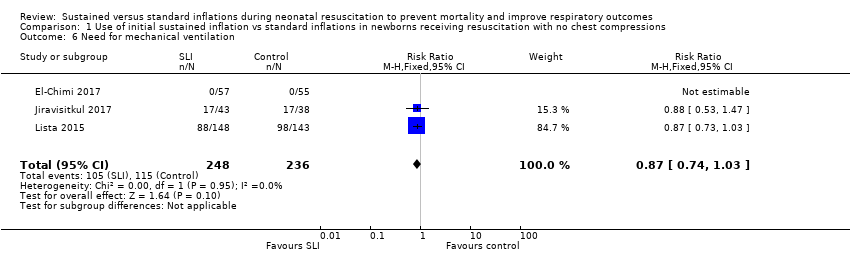
| 6 Need for mechanical ventilation Show forest plot | 3 | 484 | Risk Ratio (M‐H, Fixed, 95% CI) | 0.87 [0.74, 1.03] |
|
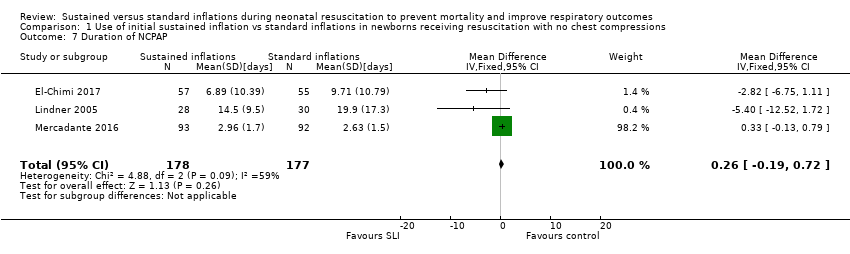
| 7 Duration of NCPAP Show forest plot | 3 | 355 | Mean Difference (IV, Fixed, 95% CI) | 0.26 [‐0.19, 0.72] |
|
| 8 Duration of mechanical ventilation Show forest plot | 5 | 524 | Mean Difference (IV, Fixed, 95% CI) | ‐5.37 [‐6.31, ‐4.43] |
|
| 9 Duration of respiratory support (NCPAP + MV) Show forest plot | 2 | 243 | Mean Difference (IV, Fixed, 95% CI) | 0.69 [0.23, 1.16] |
|
| 10 Duration of supplemental oxygen requirement Show forest plot | 1 | | Mean Difference (IV, Fixed, 95% CI) | Totals not selected |
|
| 11 Chronic lung disease Show forest plot | 6 | 903 | Risk Ratio (M‐H, Fixed, 95% CI) | 0.93 [0.77, 1.13] |
|
| 11.1 BPD any grade | 2 | 220 | Risk Ratio (M‐H, Fixed, 95% CI) | 0.90 [0.69, 1.19] |
| 11.2 Moderate to severe BPD | 5 | 683 | Risk Ratio (M‐H, Fixed, 95% CI) | 0.95 [0.74, 1.22] |
| 12 Pneumothorax Show forest plot | 7 | 932 | Risk Ratio (M‐H, Fixed, 95% CI) | 1.40 [0.76, 2.61] |
|
| 12.1 During first 48 hours | 1 | 81 | Risk Ratio (M‐H, Fixed, 95% CI) | 0.88 [0.06, 13.65] |
| 12.2 At any time | 6 | 851 | Risk Ratio (M‐H, Fixed, 95% CI) | 1.44 [0.76, 2.72] |
| 13 Cranial ultrasound abnormalities Show forest plot | 6 | | Risk Ratio (M‐H, Fixed, 95% CI) | Subtotals only |
|
| 13.1 Intraventricular haemorrhage grade 3‐4 | 5 | 635 | Risk Ratio (M‐H, Fixed, 95% CI) | 0.89 [0.58, 1.37] |
| 13.2 IVH any grade | 2 | 152 | Risk Ratio (M‐H, Fixed, 95% CI) | 0.82 [0.40, 1.69] |
| 13.3 Cystic periventricular leukomalacia | 5 | 635 | Risk Ratio (M‐H, Fixed, 95% CI) | 0.59 [0.24, 1.44] |
| 14 Retinopathy of prematurity (ROP) stage ≥ 3 Show forest plot | 5 | 632 | Risk Ratio (M‐H, Fixed, 95% CI) | 0.69 [0.44, 1.10] |
|
| 15 Patent ductus arteriosus (PDA) Show forest plot | 6 | | Risk Ratio (M‐H, Fixed, 95% CI) | Subtotals only |
|
| 15.1 PDA ‐ pharmacological treatment | 6 | 745 | Risk Ratio (M‐H, Fixed, 95% CI) | 1.08 [0.90, 1.30] |
| 15.2 PDA ‐ surgical closure | 3 | 412 | Risk Ratio (M‐H, Fixed, 95% CI) | 0.73 [0.27, 1.99] |