Insuflaciones sostenidas versus estándar durante la reanimación neonatal para prevenir la mortalidad y mejorar los resultados respiratorios
Appendices
Appendix 1. Standard search method
PubMed: ((infant, newborn[MeSH] OR newborn OR neonate OR neonatal OR premature OR low birth weight OR VLBW OR LBW or infan* or neonat*) AND (randomized controlled trial [pt] OR controlled clinical trial [pt] OR randomized [tiab] OR placebo [tiab] OR drug therapy [sh] OR randomly [tiab] OR trial [tiab] OR groups [tiab]) NOT (animals [mh] NOT humans [mh]))
Embase: (infant, newborn or newborn or neonate or neonatal or premature or very low birth weight or low birth weight or VLBW or LBW or Newborn or infan* or neonat*) AND (human not animal) AND (randomized controlled trial or controlled clinical trial or randomized or placebo or clinical trials as topic or randomly or trial or clinical trial)
CINAHL: (infant, newborn OR newborn OR neonate OR neonatal OR premature OR low birth weight OR VLBW OR LBW or Newborn or infan* or neonat*) AND (randomized controlled trial OR controlled clinical trial OR randomized OR placebo OR clinical trials as topic OR randomly OR trial OR PT clinical trial)
Cochrane Library: (infant or newborn or neonate or neonatal or premature or preterm or very low birth weight or low birth weight or VLBW or LBW)
Appendix 2. Risk of bias tool
We used the standard methods of Cochrane and Cochrane Neonatal to assess the methodological quality (to meet the validity criteria) of the trials. For each trial, we sought information regarding the method of randomisation, and the blinding and reporting of all outcomes of all infants enrolled in the trial. We assessed each criterion as low, high, or unclear risk. Two review authors separately assessed each study. We resolved any disagreement by discussion. We added this information to the table Characteristics of included studies. We evaluated the following issues and entered the findings into the risk of bias table.
1. Sequence generation (checking for possible selection bias). Was the allocation sequence adequately generated?
For each included study, we categorised the method used to generate the allocation sequence as:
a. low risk (any truly random process, e.g. random number table; computer random number generator);
b. high risk (any non‐random process, e.g. odd or even date of birth; hospital or clinic record number); or
c. unclear risk.
2. Allocation concealment (checking for possible selection bias). Was allocation adequately concealed?
For each included study, we categorised the method used to conceal the allocation sequence as:
a. low risk (e.g. telephone or central randomisation; consecutively numbered sealed opaque envelopes);
b. high risk (open random allocation; unsealed or non‐opaque envelopes, alternation; date of birth); or
c. unclear risk.
3. Blinding of participants and personnel (checking for possible performance bias). Was knowledge of the allocated intervention adequately prevented during the study?
For each included study, we categorised the methods used to blind study participants and personnel from knowledge of which intervention a participant received. Blinding was assessed separately for different outcomes or classes of outcomes. We categorised the methods as:
a. low risk, high risk, or unclear risk for participants; and
b. low risk, high risk, or unclear risk for personnel.
4. Blinding of outcome assessment (checking for possible detection bias). Was knowledge of the allocated intervention adequately prevented at the time of outcome assessment?
For each included study, we categorised the methods used to blind outcome assessment. Blinding was assessed separately for different outcomes or classes of outcomes. We categorized the methods as:
a. low risk for outcome assessors;
b. high risk for outcome assessors; or
c. unclear risk for outcome assessors.
5. Incomplete outcome data (checking for possible attrition bias through withdrawals, dropouts, protocol deviations). Were incomplete outcome data adequately addressed?
For each included study and for each outcome, we described the completeness of data including attrition and exclusions from the analysis. We noted whether attrition and exclusions were reported, the numbers included in the analysis at each stage (compared with the total randomised participants), reasons for attrition or exclusion when reported, and whether missing data were balanced across groups or were related to outcomes. When sufficient information was reported or supplied by trial authors, we re‐included missing data in the analyses. We categorised the methods as:
a. low risk (< 20% missing data);
b. high risk (≥ 20% missing data); or
c. unclear risk.
6. Selective reporting bias. Are reports of the study free of suggestion of selective outcome reporting?
For each included study, we described how we investigated the possibility of selective outcome reporting bias and what we found. We assessed the methods as:
a. low risk (when it is clear that all of the study's prespecified outcomes and all expected outcomes of interest to the review have been reported);
b. high risk (when not all of the study's prespecified outcomes have been reported; one or more reported primary outcomes were not prespecified outcomes of interest and are reported incompletely and so cannot be used; study fails to include results of a key outcome that would have been expected to have been reported); or
c. unclear risk.
7. Other sources of bias. Was the study apparently free of other problems that could put it at high risk of bias?
For each included study, we described any important concerns we had about other possible sources of bias (e.g. whether a potential source of bias was related to the specific study design, whether the trial was stopped early owing to some data‐dependent process). We assessed whether each study was free of other problems that could put it at risk of bias as:
a. low risk;
b. high risk; or
c. unclear risk.
If needed, we explored the impact of the level of bias by undertaking sensitivity analyses.
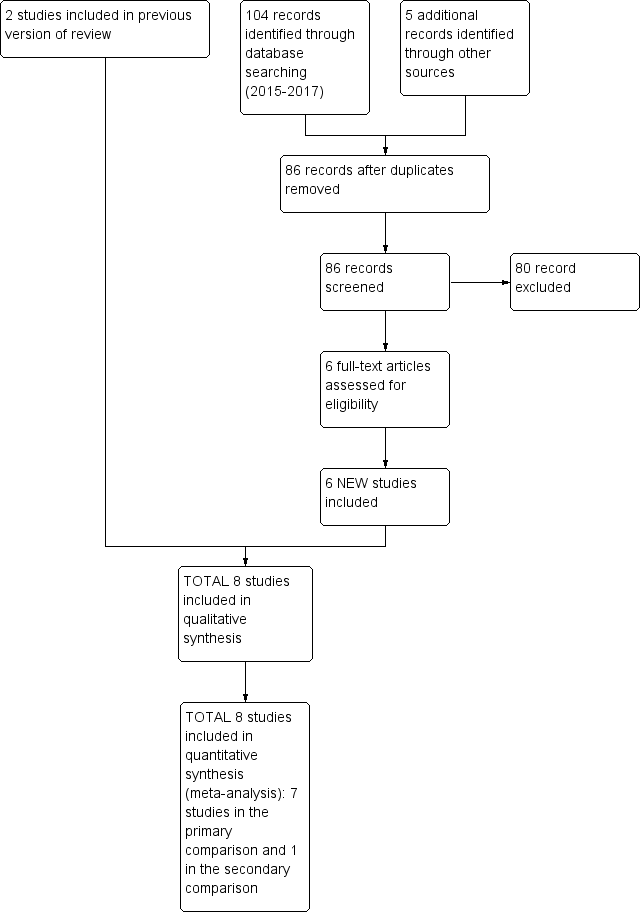
Study flow diagram: review update.

Risk of bias summary: review authors' judgements about each risk of bias item for each included trial.

Risk of bias graph: review authors' judgements about each risk of bias item presented as percentages across all included trials.

Forest plot of comparison: 1 Use of initial sustained inflation vs standard inflations in newborns receiving resuscitation with no chest compressions, outcome: 1.1 Death.

Forest plot of comparison: 1 Use of initial sustained inflation vs standard inflations in newborns receiving resuscitation with no chest compressions, outcome: 1.4 Endotracheal intubation.

Forest plot of comparison: 1 Use of initial sustained inflation vs standard inflations in newborns receiving resuscitation with no chest compressions, outcome: 1.5 Surfactant administration.
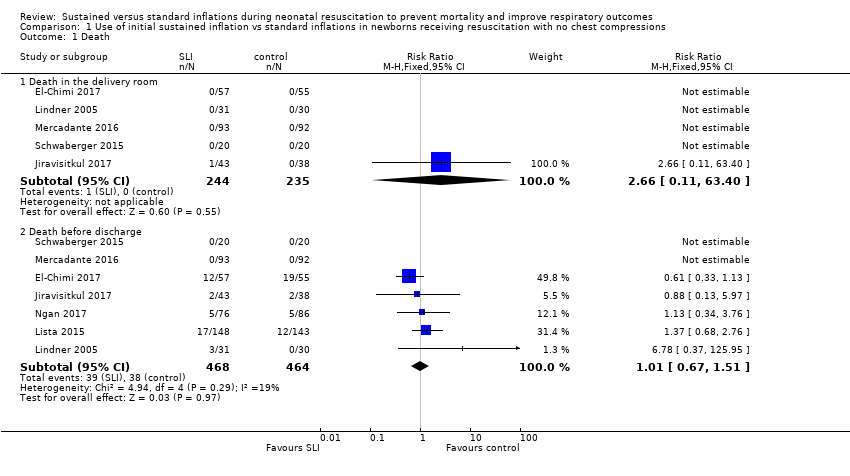
Comparison 1 Use of initial sustained inflation vs standard inflations in newborns receiving resuscitation with no chest compressions, Outcome 1 Death.

Comparison 1 Use of initial sustained inflation vs standard inflations in newborns receiving resuscitation with no chest compressions, Outcome 2 Apgar at 1 minute.

Comparison 1 Use of initial sustained inflation vs standard inflations in newborns receiving resuscitation with no chest compressions, Outcome 3 Apgar at 5 minutes.

Comparison 1 Use of initial sustained inflation vs standard inflations in newborns receiving resuscitation with no chest compressions, Outcome 4 Endotracheal intubation.
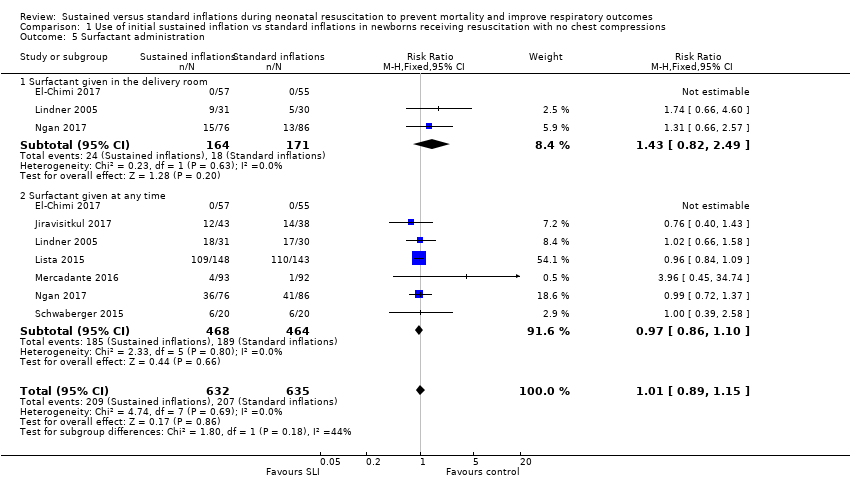
Comparison 1 Use of initial sustained inflation vs standard inflations in newborns receiving resuscitation with no chest compressions, Outcome 5 Surfactant administration.
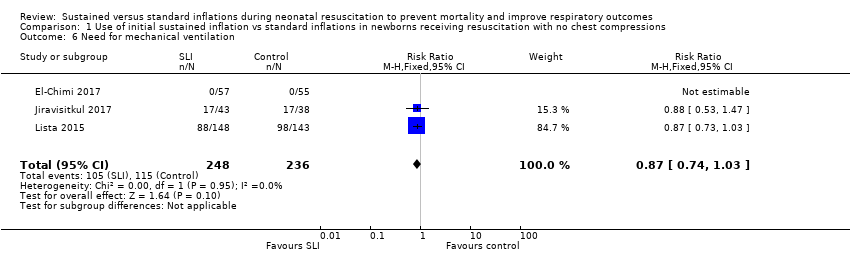
Comparison 1 Use of initial sustained inflation vs standard inflations in newborns receiving resuscitation with no chest compressions, Outcome 6 Need for mechanical ventilation.
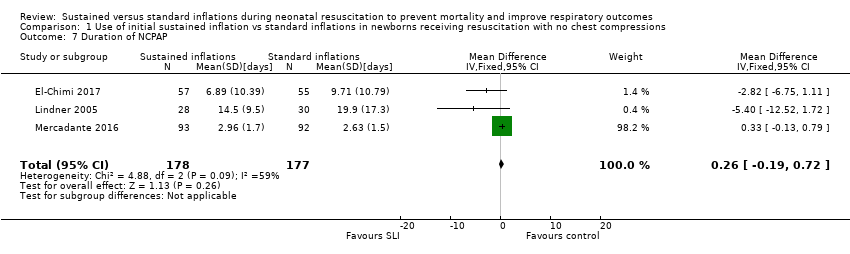
Comparison 1 Use of initial sustained inflation vs standard inflations in newborns receiving resuscitation with no chest compressions, Outcome 7 Duration of NCPAP.

Comparison 1 Use of initial sustained inflation vs standard inflations in newborns receiving resuscitation with no chest compressions, Outcome 8 Duration of mechanical ventilation.

Comparison 1 Use of initial sustained inflation vs standard inflations in newborns receiving resuscitation with no chest compressions, Outcome 9 Duration of respiratory support (NCPAP + MV).

Comparison 1 Use of initial sustained inflation vs standard inflations in newborns receiving resuscitation with no chest compressions, Outcome 10 Duration of supplemental oxygen requirement.

Comparison 1 Use of initial sustained inflation vs standard inflations in newborns receiving resuscitation with no chest compressions, Outcome 11 Chronic lung disease.

Comparison 1 Use of initial sustained inflation vs standard inflations in newborns receiving resuscitation with no chest compressions, Outcome 12 Pneumothorax.

Comparison 1 Use of initial sustained inflation vs standard inflations in newborns receiving resuscitation with no chest compressions, Outcome 13 Cranial ultrasound abnormalities.

Comparison 1 Use of initial sustained inflation vs standard inflations in newborns receiving resuscitation with no chest compressions, Outcome 14 Retinopathy of prematurity (ROP) stage ≥ 3.

Comparison 1 Use of initial sustained inflation vs standard inflations in newborns receiving resuscitation with no chest compressions, Outcome 15 Patent ductus arteriosus (PDA).

Comparison 2 Use of initial sustained inflation vs standard inflations in newborns receiving resuscitation with chest compressions, Outcome 1 Death.

Comparison 2 Use of initial sustained inflation vs standard inflations in newborns receiving resuscitation with chest compressions, Outcome 2 Endotracheal intubation.

Comparison 2 Use of initial sustained inflation vs standard inflations in newborns receiving resuscitation with chest compressions, Outcome 3 Surfactant administration.

Comparison 2 Use of initial sustained inflation vs standard inflations in newborns receiving resuscitation with chest compressions, Outcome 4 Chronic lung disease.

Comparison 2 Use of initial sustained inflation vs standard inflations in newborns receiving resuscitation with chest compressions, Outcome 5 Pneumothorax.

Comparison 2 Use of initial sustained inflation vs standard inflations in newborns receiving resuscitation with chest compressions, Outcome 6 Cranial ultrasound abnormalities.

Comparison 2 Use of initial sustained inflation vs standard inflations in newborns receiving resuscitation with chest compressions, Outcome 7 Retinopathy of prematurity (ROP) stage ≥ 3.

Comparison 2 Use of initial sustained inflation vs standard inflations in newborns receiving resuscitation with chest compressions, Outcome 8 Patent ductus arteriosus (PDA).
| Use of initial sustained inflation compared with standard inflations in newborns receiving resuscitation with no chest compressions during resuscitation | ||||||
| Patient or population: preterm infants resuscitated using PPV at birth Settings: delivery room in Europe (Austria, Germany, Italy), Canada, Egypt, Thailand | ||||||
| Outcomes | Illustrative comparative risks* (95% CI) | Relative effect | No. of participants | Quality of the evidence | Comments | |
| Assumed risk | Corresponding risk | |||||
| Standard inflations in newborns receiving resuscitation with no chest compressions | Use of initial sustained inflation | |||||
| Death ‐ death in the delivery room | Study population | RR 2.66 | 479 | ⊕⊕⊝⊝ | ||
| 0 per 1000 | 0 per 1000 | |||||
| Death ‐ death before discharge | Study population | RR 1.01 | 932 | ⊕⊕⊕⊝ | ||
| 82 per 1000 | 83 per 1000 | |||||
| Need for mechanical ventilation | Study population | RR 0.87 | 484 | ⊕⊕⊕⊝ | ||
| 487 per 1000 | 424 per 1000 | |||||
| Chronic lung disease ‐ BPD any grade | Study population | RR 0.9 | 220 | ⊕⊕⊕⊝ | ||
| 483 per 1000 | 435 per 1000 | |||||
| Chronic lung disease ‐ moderate to severe BPD | Study population | RR 0.95 | 683 | ⊕⊕⊕⊝ | ||
| 257 per 1000 | 244 per 1000 | |||||
| Pneumothorax ‐ any time | Study population | RR 1.44 | 851 | ⊕⊕⊝⊝ | ||
| 33 per 1000 | 48 per 1000 | |||||
| Cranial ultrasound abnormalities ‐ intraventricular haemorrhage grade 3 to 4 | Study population | RR 0.89 | 635 | ⊕⊕⊕⊝ | ||
| 120 per 1000 | 107 per 1000 | |||||
| *The basis for the assumed risk (e.g. median control group risk across studies) is provided in footnotes. The corresponding risk (and its 95% confidence interval) is based on the assumed risk in the comparison group and the relative effect of the intervention (and its 95% CI) | ||||||
| GRADE Working Group grades of evidence | ||||||
| Assumed risk is the risk of the control arm. aLimitations in study design: all studies at high or unclear risk of bias in at least one domain | ||||||
| Use of initial sustained inflation compared with standard inflations in newborns receiving resuscitation with chest compressions during resuscitation | ||||||
| Patient or population: preterm infants resuscitated by PPV at birth Settings: delivery room in Europe (Austria, Germany, Italy), Canada, Egypt, Thailand | ||||||
| Outcomes | Illustrative comparative risks* (95% CI) | Relative effect | No. of participants | Quality of the evidence | Comments | |
| Assumed risk | Corresponding risk | |||||
| Standard inflations in newborns receiving resuscitation with chest compressions | Use of initial sustained inflation | |||||
| Death ‐ death before discharge | See comment | See comment | Not estimable | 9 | ⊕⊝⊝⊝ | Only 1 trial included |
| Chronic lung disease ‐ moderate to severe BPD | See comment | See comment | Not estimable | 7 | ⊕⊝⊝⊝ | Only 1 trial included |
| Pneumothorax ‐ any time | See comment | See comment | Not estimable | 9 | ⊕⊝⊝⊝ | Only 1 trial included |
| Cranial ultrasound abnormalities ‐ intraventricular haemorrhage grade 3 to 4 | See comment | See comment | Not estimable | 9 | ⊕⊝⊝⊝ | Only 1 trial included |
| *The basis for the assumed risk (e.g. median control group risk across studies) is provided in footnotes. The corresponding risk (and its 95% confidence interval) is based on the assumed risk in the comparison group and the relative effect of the intervention (and its 95% CI) | ||||||
| GRADE Working Group grades of evidence | ||||||
| Assumed risk is the risk of the control arm. aLimitations in study design: included study at high or unclear risk of bias in four domains | ||||||
| Trial (no. infants) | Antenatal steroids | Gestational age, weeks | Birth weight, grams | Device/Interface | Interventions/Controls | ||||
| SLI | Control | SLI | Control | SLI | Control | SLI and control | SLI | Control | |
| El‐Chimi 2017 (112) | 39% | 34.5% | mean 31.1 (SD 1.7) | mean 31.3 (SD 1.7) | mean 1561 (SD 326) | mean 1510 (SD 319) | Mask and T‐piece in SLI group Mask and self‐inflating bag with an oxygen reservoir in control group | PIP of 20 cmH2O for 15 seconds, followed by PEEP of 5 cmH2O If needed: a second SLI of 15 seconds of 25 cmH2O for 15 seconds, followed by PEEP of 6 cmH2O; then a third SLI of 15 seconds of 30 cmH2O for 15 seconds, followed by PEEP of 7 cmH2O If still not satisfactory: intubated in delivery room | PIP maximum 40 cmH2O, rate of 40 to 60 breaths/min for 30 seconds |
| Jiravisitkul 2017 (81) | 63% | 74% | 25 to 28 weeks: 29 to 32 weeks: | 25 to 28 weeks: 29 to 32 weeks: | mean 1206 (SD 367) | mean 1160 (SD 411) | Mask and T‐piece | PIP of 25 cmH2O for 15 seconds If HR 60 to 100 beats/min and/or poor respiratory effort: a second SLI (25 cmH2O, 15 seconds) | PIP 15 to 20 cmH2O, PEEP 5 cmH2O for 30 seconds, followed by resuscitation according to AHA guidelines |
| Lindner 2005 (61) | 81% | 80% | median 27.0 (IQR 25.0 to 28.9) | median 26.7 (IQR 25.0 to 28.9) | median 870 (IQR 410 to 1320) | median 830 (IQR 370 to 1370) | Nasopharyngeal tube (fixed at 4 to 5 cm) and mechanical ventilator | PIP of 20 cmH2O for 15 seconds If response was not satisfactory: 2 further SLIs of 15 seconds (25 and 30 cmH2O). Then PEEP at 4 to 6 cmH2O | PIP 20 cmH2O, PEEP 4 to 6 cmH2O; inflation time 0.5 seconds; inflation rate 60 per min. Then, PEEP at 4 to 6 cmH2O |
| Lista 2015 (301) | 87% | 91% | mean 26.8 (SD 1.2); 25 to 26 weeks: 27 to 28 weeks: | mean 26.8 (SD 1.1); 25 to 26 weeks: 27 to 28 weeks: | mean 894 (SD 247) | mean 893 (SD 241) | Mask and T‐piece | PIP 25 cmH2O for 15 seconds. Then reduced to PEEP of 5 cmH2O | PEEP 5 cmH2O, followed by resuscitation according to AHA guidelines |
| Mercadante 2016 (185) | 40% | 32% | mean 35.2 (SD 0.8) | mean 35.2 (SD 0.8) | mean 2345 (SD 397) | mean 2346 (SD 359) | Mask and T‐piece | PIP 25 cmH2O for 15 seconds, followed by PEEP of 5 cmH2O. In case of persistent heart failure (HR < 100 bpm): SLI repeated | PEEP 5 cmH2O, followed by resuscitation according to AAP guidelines |
| Ngan 2017 (162) | 78% | 70% | mean 28 (SD 2.5) | mean 28 (SD 2.5) | mean 1154 (SD 426) | mean 1140 (SD 406) | Mask and T‐piece | Two PIPs of 24 cmH2O. Duration of first SLI was 20 seconds. Duration of second SLI was 20 or 10 seconds, guided by ECO2 values. After SLIs, CPAP if breathing spontaneously or, if found to have apnoea or laboured breathing, mask IPPV at a rate of 40 to 60 bpm | IPPV, rate of 40 to 60 inflations/min until spontaneous breathing, at which time CPAP will be provided |
| Schmölzer 2015 (9) | 80%a | 100%a | mean 24.6 (SD 1.3)a | mean 25.6 (SD 2.3)a | mean 707 (SD 208)a | mean 808 (SD 192)a | Mask and T‐piecea | PIP for 20 + 20 secondsa during chest compressions | 3:1 compression:ventilation ratio according to resuscitation guidelines |
| Schwaberger 2015 (40) | not reported | not reported | mean 32.1 (SD 1.4) | mean 32.1 (SD 1.6) | mean 1692 (SD 297) | mean 1722 (SD 604) | Mask and T‐piece | PIP 30 cmH2O for 15 seconds, to be repeated once or twice with HR remaining < 100 bpm. Infants with HR > 100 bpm: PPV at 30 cmH2O PIP or CPAP at PEEP level of 5 cmH2O depending on respiratory rate | Resuscitation according to AHA guidelines PEEP 5 cmH2O if respiratory rate > 30 and signs of respiratory distress PPV at 30 cmH2O PIP if insufficient breathing efforts |
| aInformation provided by study authors | |||||||||
| Outcome or subgroup title | No. of studies | No. of participants | Statistical method | Effect size |
| 1 Death Show forest plot | 7 | Risk Ratio (M‐H, Fixed, 95% CI) | Subtotals only | |
| 1.1 Death in the delivery room | 5 | 479 | Risk Ratio (M‐H, Fixed, 95% CI) | 2.66 [0.11, 63.40] |
| 1.2 Death before discharge | 7 | 932 | Risk Ratio (M‐H, Fixed, 95% CI) | 1.01 [0.67, 1.51] |
| 2 Apgar at 1 minute Show forest plot | 5 | 529 | Mean Difference (IV, Fixed, 95% CI) | ‐0.08 [‐0.26, 0.09] |
| 3 Apgar at 5 minutes Show forest plot | 6 | 641 | Mean Difference (IV, Fixed, 95% CI) | ‐0.02 [‐0.13, 0.08] |
| 4 Endotracheal intubation Show forest plot | 7 | Risk Ratio (M‐H, Fixed, 95% CI) | Subtotals only | |
| 4.1 Endotracheal intubation in the delivery room | 5 | 601 | Risk Ratio (M‐H, Fixed, 95% CI) | 0.86 [0.62, 1.19] |
| 4.2 Endotracheal intubation within 24 hours | 2 | 225 | Risk Ratio (M‐H, Fixed, 95% CI) | 1.4 [0.53, 3.68] |
| 4.3 Endotracheal intubation by 72 hours of age | 5 | 811 | Risk Ratio (M‐H, Fixed, 95% CI) | 0.93 [0.79, 1.09] |
| 5 Surfactant administration Show forest plot | 7 | 1267 | Risk Ratio (M‐H, Fixed, 95% CI) | 1.01 [0.89, 1.15] |
| 5.1 Surfactant given in the delivery room | 3 | 335 | Risk Ratio (M‐H, Fixed, 95% CI) | 1.43 [0.82, 2.49] |
| 5.2 Surfactant given at any time | 7 | 932 | Risk Ratio (M‐H, Fixed, 95% CI) | 0.97 [0.86, 1.10] |
| 6 Need for mechanical ventilation Show forest plot | 3 | 484 | Risk Ratio (M‐H, Fixed, 95% CI) | 0.87 [0.74, 1.03] |
| 7 Duration of NCPAP Show forest plot | 3 | 355 | Mean Difference (IV, Fixed, 95% CI) | 0.26 [‐0.19, 0.72] |
| 8 Duration of mechanical ventilation Show forest plot | 5 | 524 | Mean Difference (IV, Fixed, 95% CI) | ‐5.37 [‐6.31, ‐4.43] |
| 9 Duration of respiratory support (NCPAP + MV) Show forest plot | 2 | 243 | Mean Difference (IV, Fixed, 95% CI) | 0.69 [0.23, 1.16] |
| 10 Duration of supplemental oxygen requirement Show forest plot | 1 | Mean Difference (IV, Fixed, 95% CI) | Totals not selected | |
| 11 Chronic lung disease Show forest plot | 6 | 903 | Risk Ratio (M‐H, Fixed, 95% CI) | 0.93 [0.77, 1.13] |
| 11.1 BPD any grade | 2 | 220 | Risk Ratio (M‐H, Fixed, 95% CI) | 0.90 [0.69, 1.19] |
| 11.2 Moderate to severe BPD | 5 | 683 | Risk Ratio (M‐H, Fixed, 95% CI) | 0.95 [0.74, 1.22] |
| 12 Pneumothorax Show forest plot | 7 | 932 | Risk Ratio (M‐H, Fixed, 95% CI) | 1.40 [0.76, 2.61] |
| 12.1 During first 48 hours | 1 | 81 | Risk Ratio (M‐H, Fixed, 95% CI) | 0.88 [0.06, 13.65] |
| 12.2 At any time | 6 | 851 | Risk Ratio (M‐H, Fixed, 95% CI) | 1.44 [0.76, 2.72] |
| 13 Cranial ultrasound abnormalities Show forest plot | 6 | Risk Ratio (M‐H, Fixed, 95% CI) | Subtotals only | |
| 13.1 Intraventricular haemorrhage grade 3‐4 | 5 | 635 | Risk Ratio (M‐H, Fixed, 95% CI) | 0.89 [0.58, 1.37] |
| 13.2 IVH any grade | 2 | 152 | Risk Ratio (M‐H, Fixed, 95% CI) | 0.82 [0.40, 1.69] |
| 13.3 Cystic periventricular leukomalacia | 5 | 635 | Risk Ratio (M‐H, Fixed, 95% CI) | 0.59 [0.24, 1.44] |
| 14 Retinopathy of prematurity (ROP) stage ≥ 3 Show forest plot | 5 | 632 | Risk Ratio (M‐H, Fixed, 95% CI) | 0.69 [0.44, 1.10] |
| 15 Patent ductus arteriosus (PDA) Show forest plot | 6 | Risk Ratio (M‐H, Fixed, 95% CI) | Subtotals only | |
| 15.1 PDA ‐ pharmacological treatment | 6 | 745 | Risk Ratio (M‐H, Fixed, 95% CI) | 1.08 [0.90, 1.30] |
| 15.2 PDA ‐ surgical closure | 3 | 412 | Risk Ratio (M‐H, Fixed, 95% CI) | 0.73 [0.27, 1.99] |
| Outcome or subgroup title | No. of studies | No. of participants | Statistical method | Effect size |
| 1 Death Show forest plot | 1 | Risk Ratio (M‐H, Fixed, 95% CI) | Totals not selected | |
| 1.1 Death before discharge | 1 | Risk Ratio (M‐H, Fixed, 95% CI) | 0.0 [0.0, 0.0] | |
| 2 Endotracheal intubation Show forest plot | 1 | Risk Ratio (M‐H, Fixed, 95% CI) | Totals not selected | |
| 2.1 Endotracheal intubation in the delivery room | 1 | Risk Ratio (M‐H, Fixed, 95% CI) | 0.0 [0.0, 0.0] | |
| 3 Surfactant administration Show forest plot | 1 | Risk Ratio (M‐H, Fixed, 95% CI) | Totals not selected | |
| 3.1 Surfactant given in the delivery room | 1 | Risk Ratio (M‐H, Fixed, 95% CI) | 0.0 [0.0, 0.0] | |
| 4 Chronic lung disease Show forest plot | 1 | Risk Ratio (M‐H, Fixed, 95% CI) | Totals not selected | |
| 4.1 Moderate to severe BPD | 1 | Risk Ratio (M‐H, Fixed, 95% CI) | 0.0 [0.0, 0.0] | |
| 5 Pneumothorax Show forest plot | 1 | Risk Ratio (M‐H, Fixed, 95% CI) | Totals not selected | |
| 5.1 At any time | 1 | Risk Ratio (M‐H, Fixed, 95% CI) | 0.0 [0.0, 0.0] | |
| 6 Cranial ultrasound abnormalities Show forest plot | 1 | Risk Ratio (M‐H, Fixed, 95% CI) | Totals not selected | |
| 6.1 Intraventricular haemorrhage grade 3 to 4 | 1 | Risk Ratio (M‐H, Fixed, 95% CI) | 0.0 [0.0, 0.0] | |
| 6.2 IVH any grade | 1 | Risk Ratio (M‐H, Fixed, 95% CI) | 0.0 [0.0, 0.0] | |
| 7 Retinopathy of prematurity (ROP) stage ≥ 3 Show forest plot | 1 | Risk Ratio (M‐H, Fixed, 95% CI) | Totals not selected | |
| 8 Patent ductus arteriosus (PDA) Show forest plot | 1 | Risk Ratio (M‐H, Fixed, 95% CI) | Totals not selected | |
| 8.1 PDA ‐ pharmacological treatment | 1 | Risk Ratio (M‐H, Fixed, 95% CI) | 0.0 [0.0, 0.0] | |